Pedestrian heat exposure is a critical health risk in dense tropical cities, yet standard routing algorithms often ignore micro-scale thermal variation. Hot Hẻm is a GeoAI workflow that estimates and operationalizes pedestrian heat exposure in Hồ Chí Minh City (HCMC), Việt Nam, colloquially known as Sài Gòn. This spatial data science pipeline combines Google Street View (GSV) imagery, semantic image segmentation, and remote sensing. Two XGBoost models are trained to predict land surface temperature (LST) using a GSV training dataset in selected administrative wards, known as phường, and are deployed in a patchwork manner across all OSMnx-derived pedestrian network nodes to enable heat-aware routing. This is a model that, when deployed, can provide a foundation for pinpointing where and further understanding why certain city corridors may experience disproportionately higher temperatures at an infrastructural scale.
Given that urban heat and other environmental injustices are widely recognized as being disproportionately felt [1], dangerous heat exposure will only continue to exacerbate with growing populations and current pollution trajectories. Extreme heat is heterogeneous and driven by both macro-scale morpholo-gies (e.g., elevation, land cover, surface emissivity) and micro-scale streetscapes (e.g., building canyon effects, tree canopy, visible sky) [2], many of which are influenced by local municipalities' regulations on the built environment and social structures.
Conventional thermal mapping often emphasizes satellite-derived patterns that could underrepresent pedestrian-scale experiences [3], and some existing literature notes shaded routes can significantly improve pedestrian comfort. However, there is lacking emphasis that the onus falls on local municipalities to provide resilient, cool, and green infrastructure-this is a byproduct communicated by shade-finding algorithms that present coolest routes. Regardless of intention, they present as alternatives rather than tools to assist with building solutions, implying health, wellbeing, and heat-stress mitigation is a choice among locals, and not a prevailing systemic and infrastructural issue that will worsen with global warming. This project aims to fill these gaps by firstly, fusing street-level visual morphology with thermal and structural remote-sensing predictors, and secondly, by seeking the hottest routes as a government tool. This is where machine learning (ML) optimization can recommend routes minimizing shade and maximizing sun exposure, revealing the hottest paths as potential candidates for shaded infrastructure, future tree canopies, or further investigation, demonstrating how ML can help enhance urban resilience to extreme heat.
This work builds on three converging research streams: urban thermal remote sensing, street-level imagery analytics, and heat-aware pedestrian routing.
The urban heat island (UHI) effect-where cities experience elevated temperatures relative to surrounding rural areas-has been extensively documented since Oke’s work on urban energy balance [2]. Satellite-based thermal remote sensing enables city-scale LST mapping [4], though the coarse spatial resolution (30m for Landsat) limits representation of micro-scale thermal variation experienced by pedestrians [5]. Recent work has shown that lower-income neighborhoods experience disproportionately higher heat exposure [1], emphasizing the environmental justice dimensions of urban heat.
GSV and similar platforms have provided unprecedented human-scale urban measurement. Li et al. [6] pioneered the Green View Index (GVI) to quantify street-level vegetation from GSV imagery. Subsequent work applied deep learning to extract urban morphology features including sky view, building density, and streetscape perception [3,7]. Comprehensive reviews by Kang et al. [8] and Biljecki and Ito [9] document the expanding role of street view imagery in public health and urban analytics, although applications to thermal comfort prediction remain limited.
While shortest-path algorithms like Dijkstra’s [10] are well-established, incorporating thermal comfort into routing optimization is relatively recent. Existing approaches typically seek coolest routes to minimize pedestrian heat exposure. This work inverts that framing: by identifying the hottest routes, municipalities can be provided with actionable infrastructure priorities rather than placing the burden of heat avoidance on individuals.
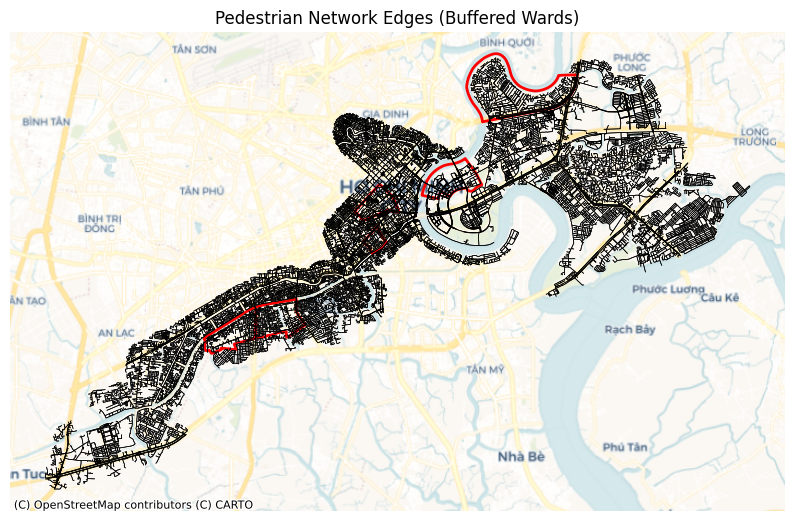
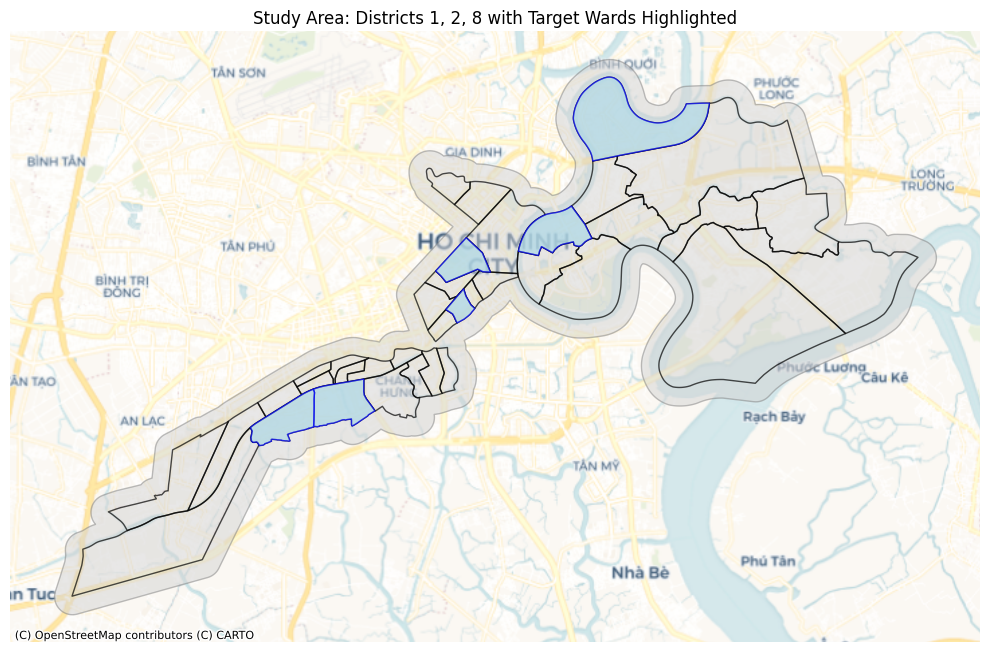
A pedestrian network graph with a 500-meter buffer was extracted from Python’s osmnx [11], yielding 28,445 nodes and 74,710 edges for three administrative districts: District 1, District 2, and District 8. Due to API costs and keeping in mind computational efficiency, only six wards were selected as disparate GSV candidates, two from each district of interest: Bến Thành (2,424 nodes) and Cô Giang (1,840 nodes) in District 1, An Khánh (1,119 nodes) and Thảo Điền (1,547)
GSV samples generated 23,806 points from 500-meter buffered wards of interest at 50-meter intervals. Metadata contained 20,457 images, an unfortunate 14.07% decrease due to interruptions, but nonetheless providing sufficient density for training streetscape indices and validating segmentation outputs within wards of interest.
The satellite data was extracted from several different sources [12,13]:
In the interest of computational efficiency, all notebooks and scripting were offloaded from local into cloud computing using Google’s Colab Pro with A100 GPU acceleration. Combining Landsat rasters into a composite was completed in ArcGIS v3.4.
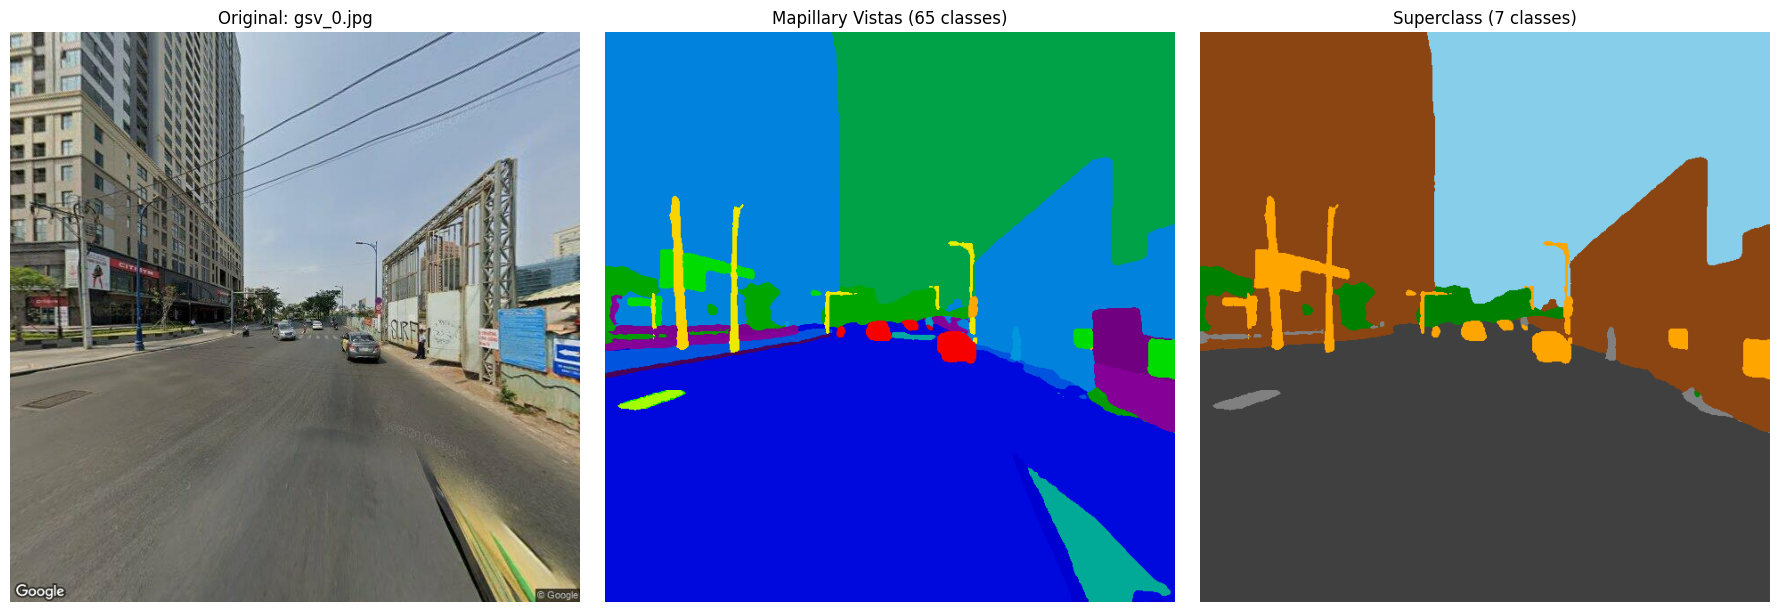
GSV images were processed using Mask2Former Swin-Large [14] trained on Mapillary Vistas (facebook/mask2former-swin-large-mapillary-vistas-semantic) [15], accessed via Hugging Face. The model contains 65 object categories optimized for street-level scene analysis in complex urban environments like Sài Gòn.
GSV images were downloaded at 640 × 640 pixel resolution. Ideally, panoramic images would have been preferable, but due to cost restraints, the static imagery was made to dynamically alter the header to be front-facing.
To improve interpretability and stability for index construction, raw segmentation classes were remapped into seven superclasses:
The final merged superclass imagery was used to create predictive features [6]. Seven superclass percentages were computed directly from the segmentation masks:
• pct_vegetation: Proportion of vegetation pixels
The collection of Landsat rasters moved through the below workflow in this order:
1 Two extraction products were used for the rasters, one for the GSV sample points and second for the entire network nodes. All raster values were extracted for all nodes except for LST, where 0.0037% of nodes were unaccounted for, decreasing from 28,437 to 28,332 nodes.
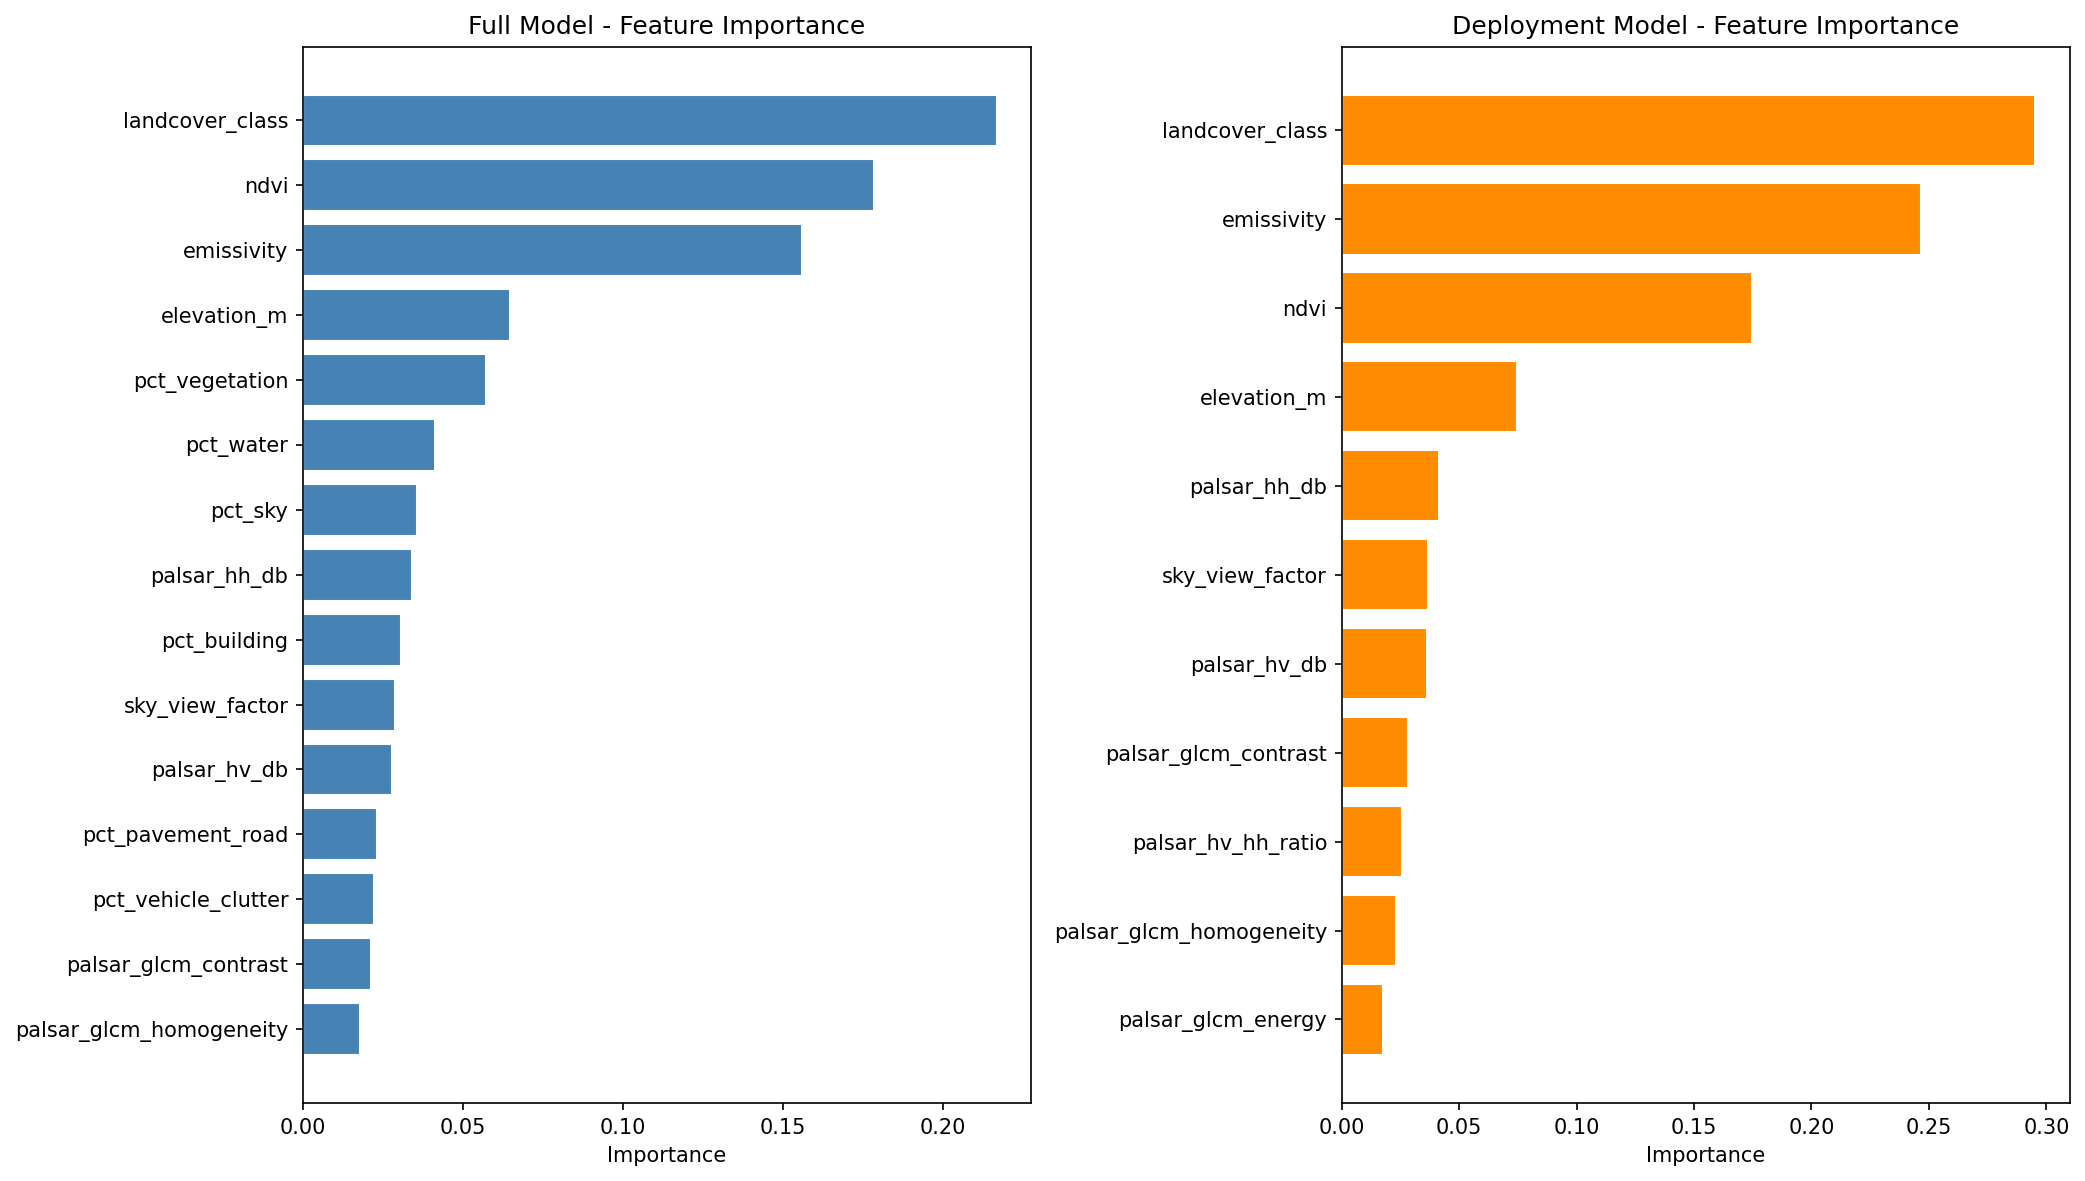
Two XGBoost models were trained using the xgboost Python library: a full model including raster and GSV features for maximum predictive power, and a deployment model using only raster features for city-wide application [16].
Landsat features: thermal and vegetation indices. LANDSAT_FEATURES = [ “ndvi”, “emissivity” ] # PALSAR features: radar backscatter and texture. PALSAR_FEATURES = [ “palsar_hh_db”, “palsar_hv_db”, “palsar_hv_hh_ratio”, “palsar_glcm_contrast”, “palsar_glcm_homogeneity”, “palsar_glcm_energy” ] # DSM features: elevation and sky view. DSM_FEATURES = [ “elevation_m”, “sky_view_factor” ] # Landcover features.
GSV segmentation features: direct superclass percentages. GSV_SEGMENTATION_FEATURES = [ “pct_vegetation”, “pct_sky”, “pct_building”, “pct_pavement_road”, “pct_water”, “pct_vehicle_clutter”, “pct_other” ]
Each predictor variable was selected based on its established physical or empirical relationship with land surface temperature:
• ndvi: The Normalized Difference Vegetation Index quantifies vegetation density. Higher NDVI indicates greater evapotranspiration and shading capacity, which reduces surface temperatures [12].
• emissivity: Surface emissivity determines how efficiently a material radiates absorbed thermal energy. Urban materials (e.g., concrete, asphalt) typically have lower emissivity than vegetated surfaces, affecting the LST retrieval and thermal behavior.
• palsar_hh_db and palsar_hv_db: SAR backscatter intensity in HH and HV polarizations captures surface roughness and structural characteristics. Built-up areas with vertical structures produce stronger backscatter, serving as proxies for urban density and building mass that store and re-emit heat.
• palsar_hv_hh_ratio: The cross-polarization ratio distinguishes vegetation (higher HV response due to volume scattering) from built surfaces (dominated by HH) [13], providing structural information complementary to optical indices.
• palsar_glcm_contrast, palsar_glcm_homogeneity, palsar_glcm_energy: Gray-Level Co-occurrence Matrix (GLCM) texture metrics characterize spatial heterogeneity of the urban fabric. High contrast indicates fragmented land cover; homogeneity captures uniformity of surface types-both relate to thermal variability patterns.
• elevation_m: Elevation influences temperature through adiabatic lapse rates and drainage patterns. Lower elevations in HCMC often correspond to denser development and reduced ventilation.
• sky_view_factor: SVF measures the proportion of visible sky hemisphere from a point, approximating urban canyon geometry. Lower SVF indicates taller surrounding structures that trap longwave radiation and reduce nocturnal cooling.
• landcover_class: Categorical land use classification directly encodes surface type (water, forest, urban, agriculture), each with distinct thermal properties, albedo, and heat capacity.
• pct_vegetation: Street-level vegetation proportion captures micro-scale canopy cover invisible to 30m satellite imagery, directly measuring shade availability at pedestrian height.
• pct_sky: Visible sky proportion from street level indicates canyon openness and potential solar exposure-complementing the DSM-derived SVF with human-perspective geometry.
• pct_building: Building facade proportion quantifies wall surfaces that absorb and re-radiate heat, contributing to the urban heat island effect at street scale.
• pct_pavement_road: Impervious surface proportion at street level captures heat-absorbing materials with low albedo and no evaporative cooling capacity.
• pct_water: Water body visibility indicates proximity to cooling features; water has high heat capacity and provides evaporative cooling.
• pct_vehicle_clutter: Vehicle and street furniture proportion serves as a proxy for traffic density and anthropogenic heat sources.
• pct_other: Remaining categories (persons, terrain, miscellaneous objects) provide contextual information about street activity and surface conditions.
The XGBoost parameters were carefully selected to balance complexity, learning speed, and regularization to prevent overfitting while capturing complex, nonlinear mechanisms that impact LST: XGB_PARAMS = { “n_estimators”: 500, “max_depth”: 5, “learning_rate”: 0.05, “subsample”: 0.8, “colsample_bytree”: 0.8, “min_child_weight”: 5, “reg_alpha”: 0.5, “reg_lambda”: 2.0, “random_state”: RANDOM_SEED, “n_jobs”: -1, “early_stopping_rounds”: 50 }
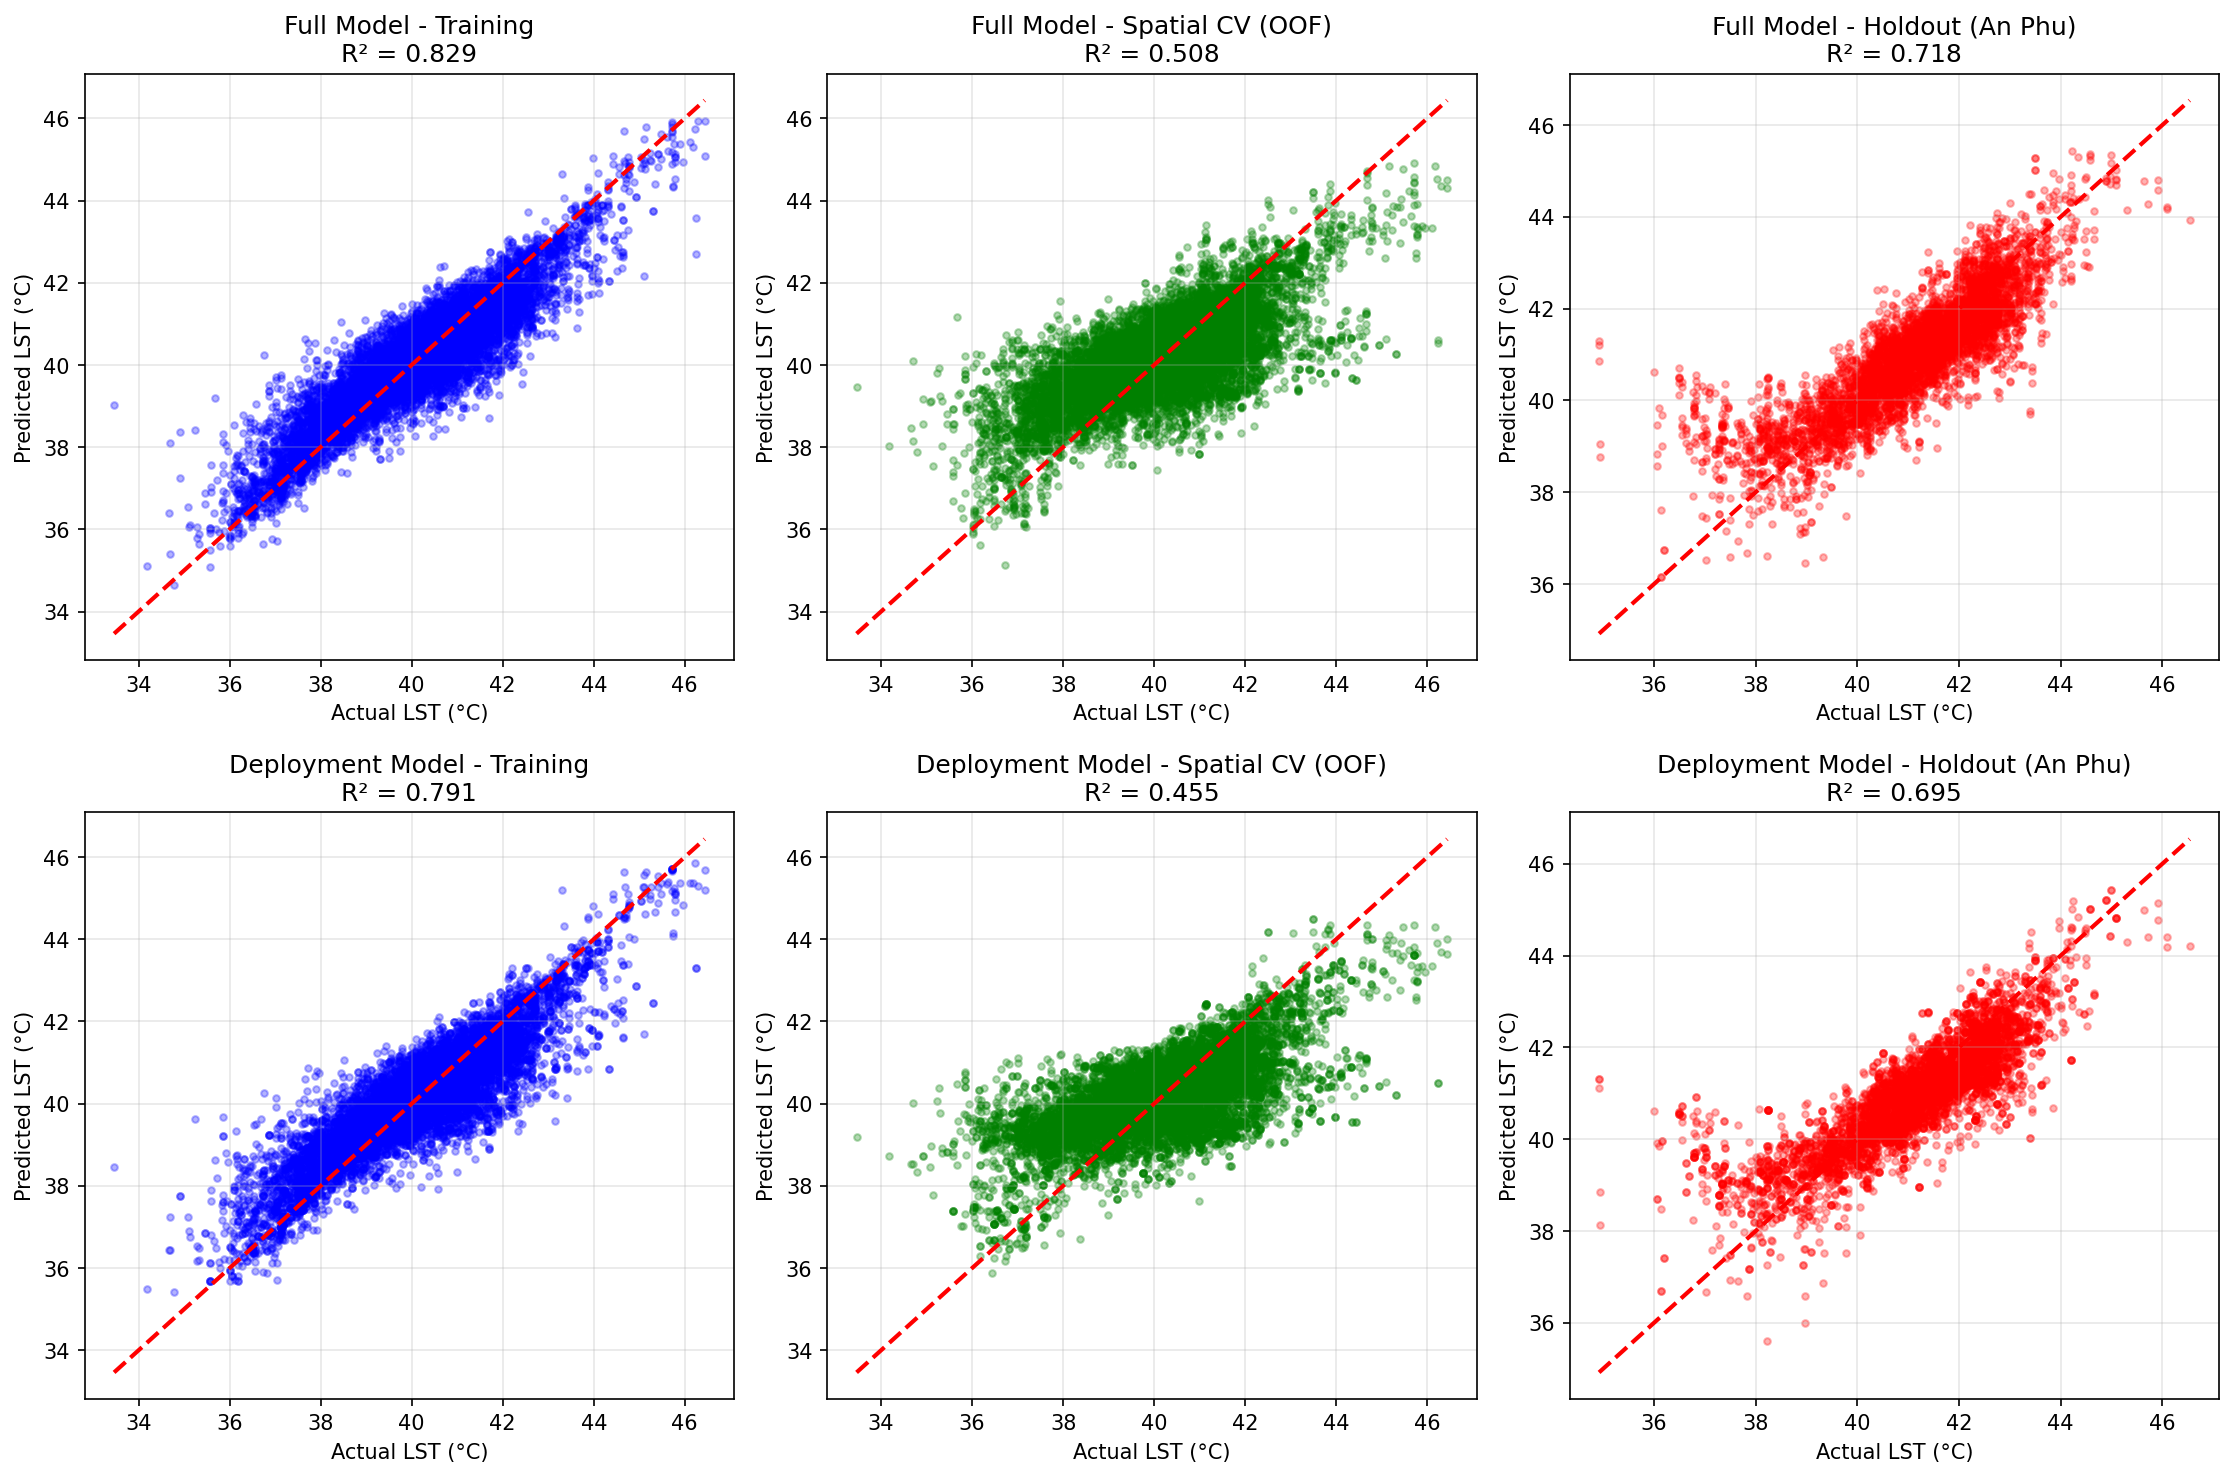
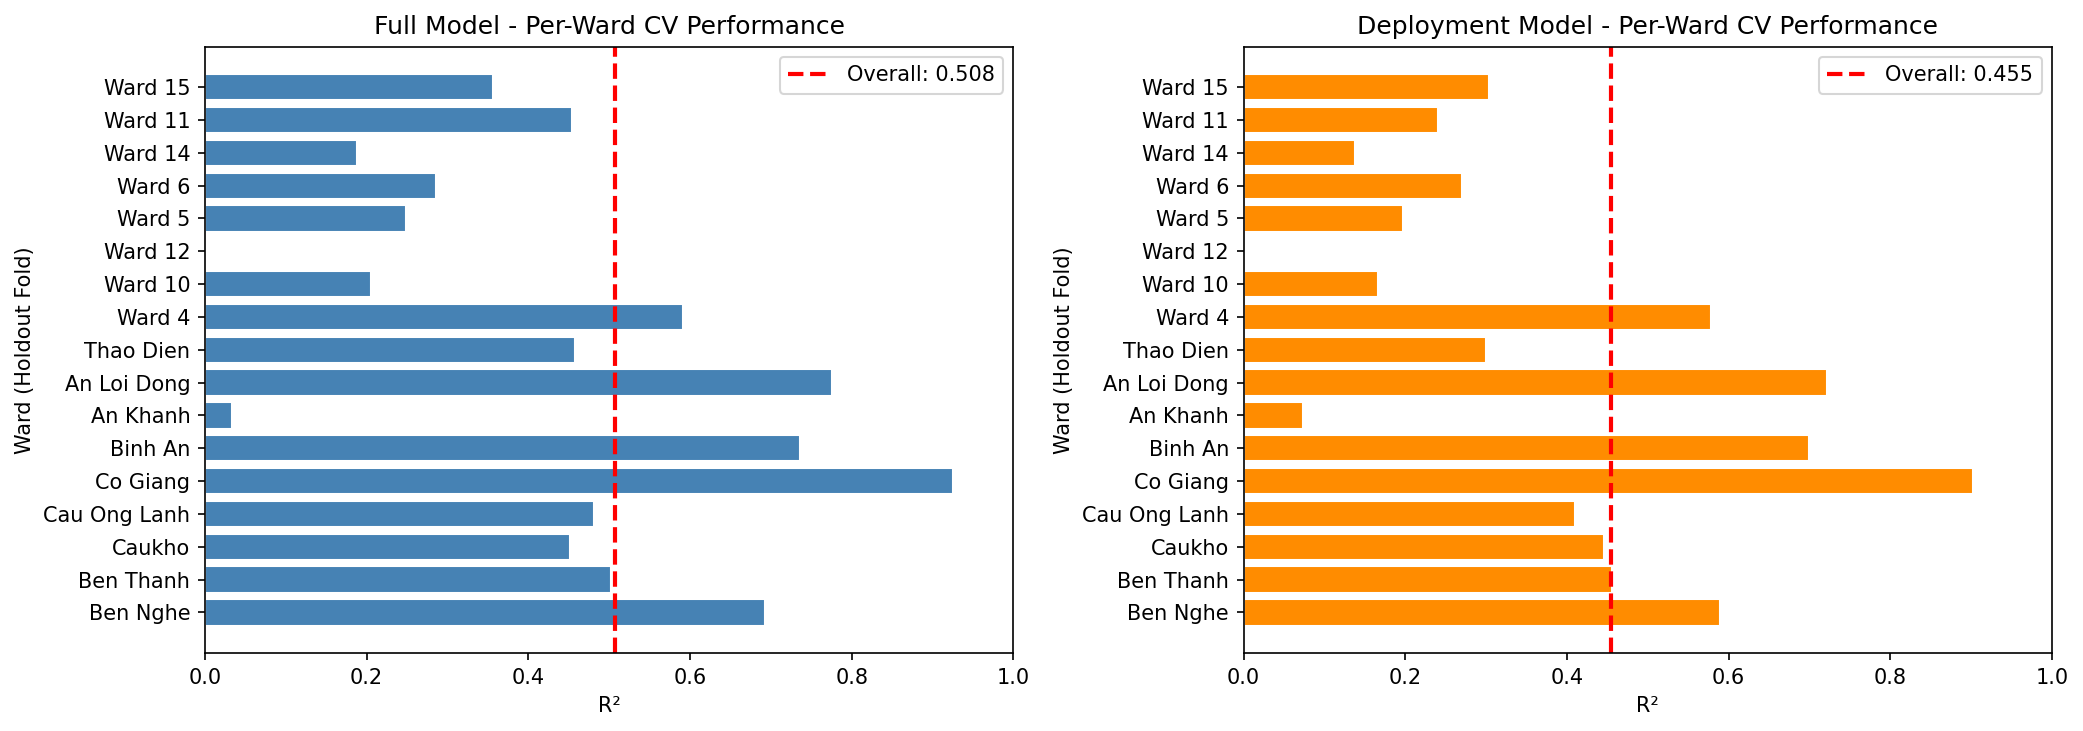
To prevent optimistically biased performance estimates from spatial autocorrelation, a leave-one-ward-out spatial cross-validation strategy was implemented. GSV points sampled at 50-meter intervals share the same 30-meter Landsat pixels, so adjacent points in different folds would leak information under standard K-fold CV. By holding out entire wards during each fold, the model must extrapolate to spatially distinct areas, providing realistic generalization estimates.
One ward (An Phú) was reserved as a completely held-out test set, never seen during any stage of training or hyperparameter tuning. This provides an unbiased estimate of true generalization performance.
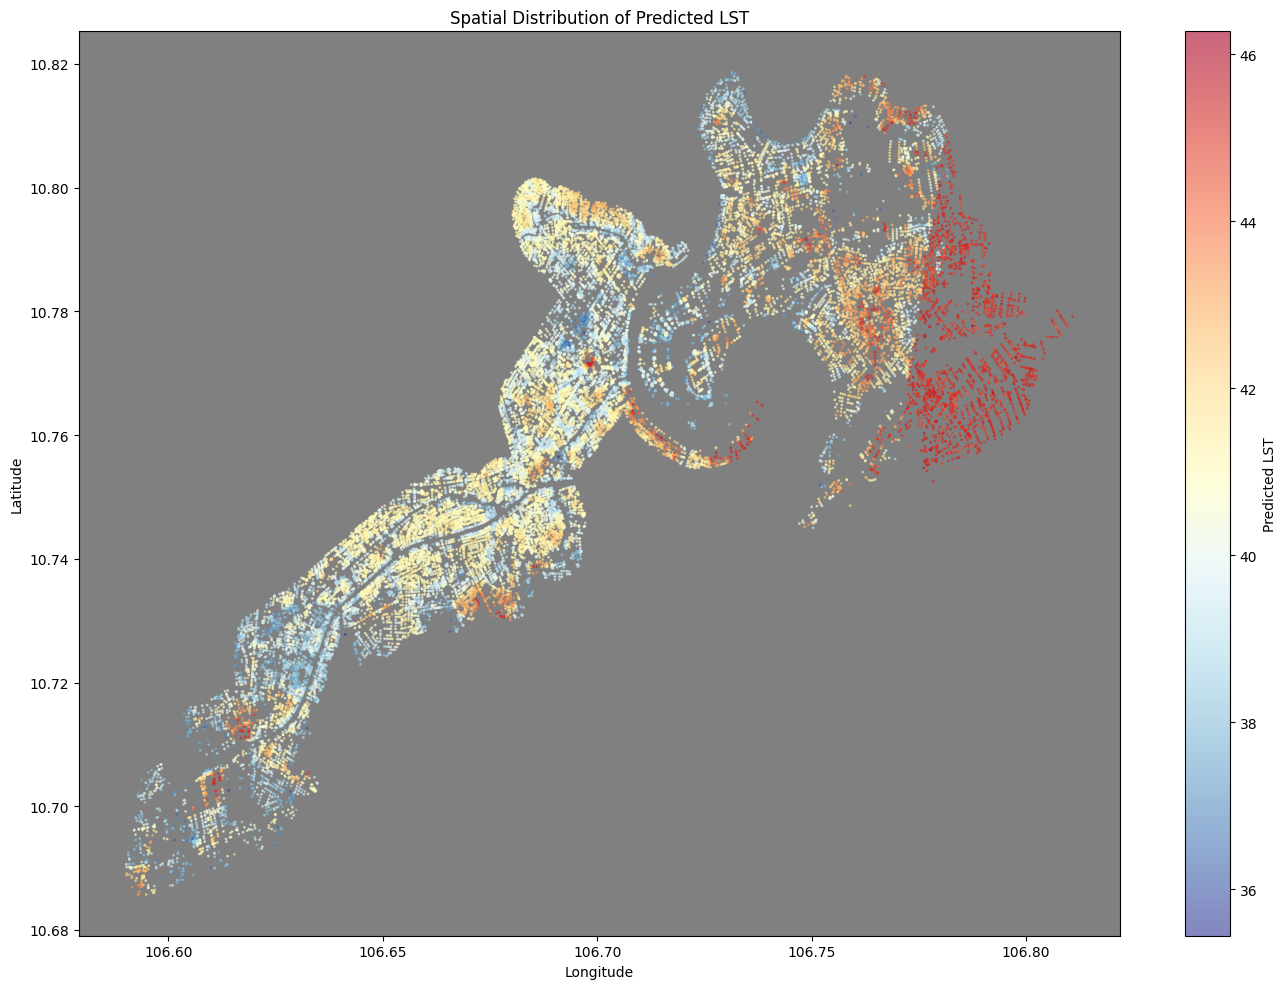
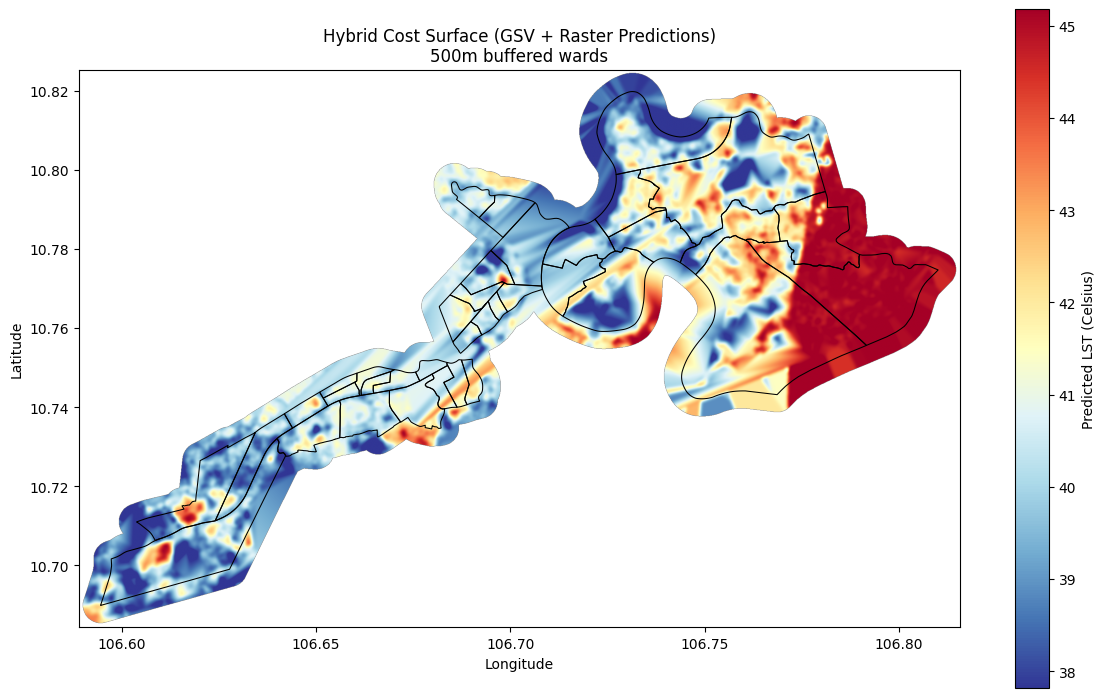
A patchwork approach was pursued, using the full model (with GSV features) to predict within wards of interest and the deployment model (raster-only) to predict outside of those wards where GSV imagery is unavailable.
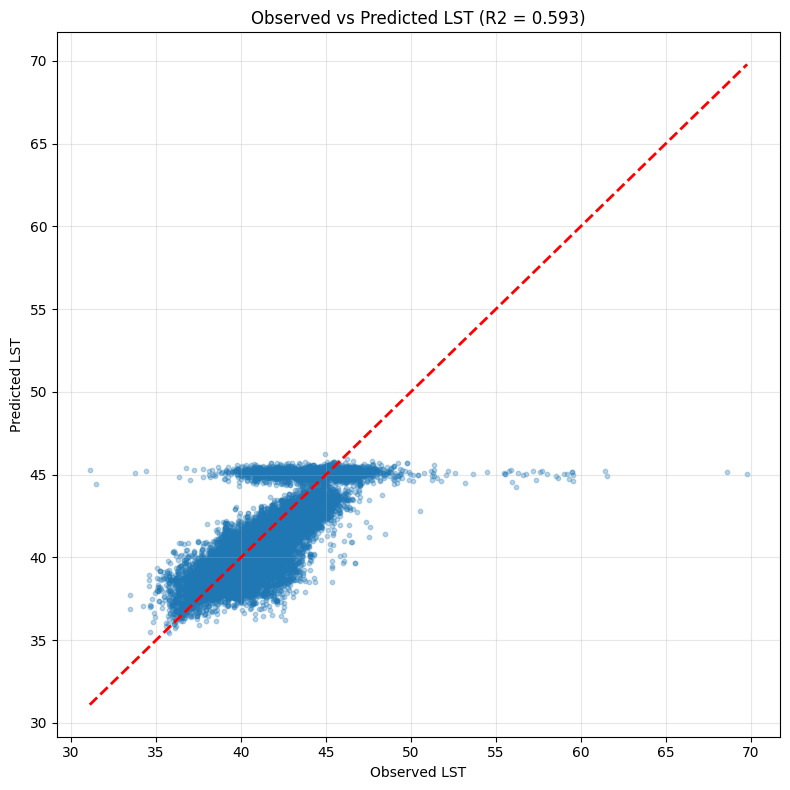
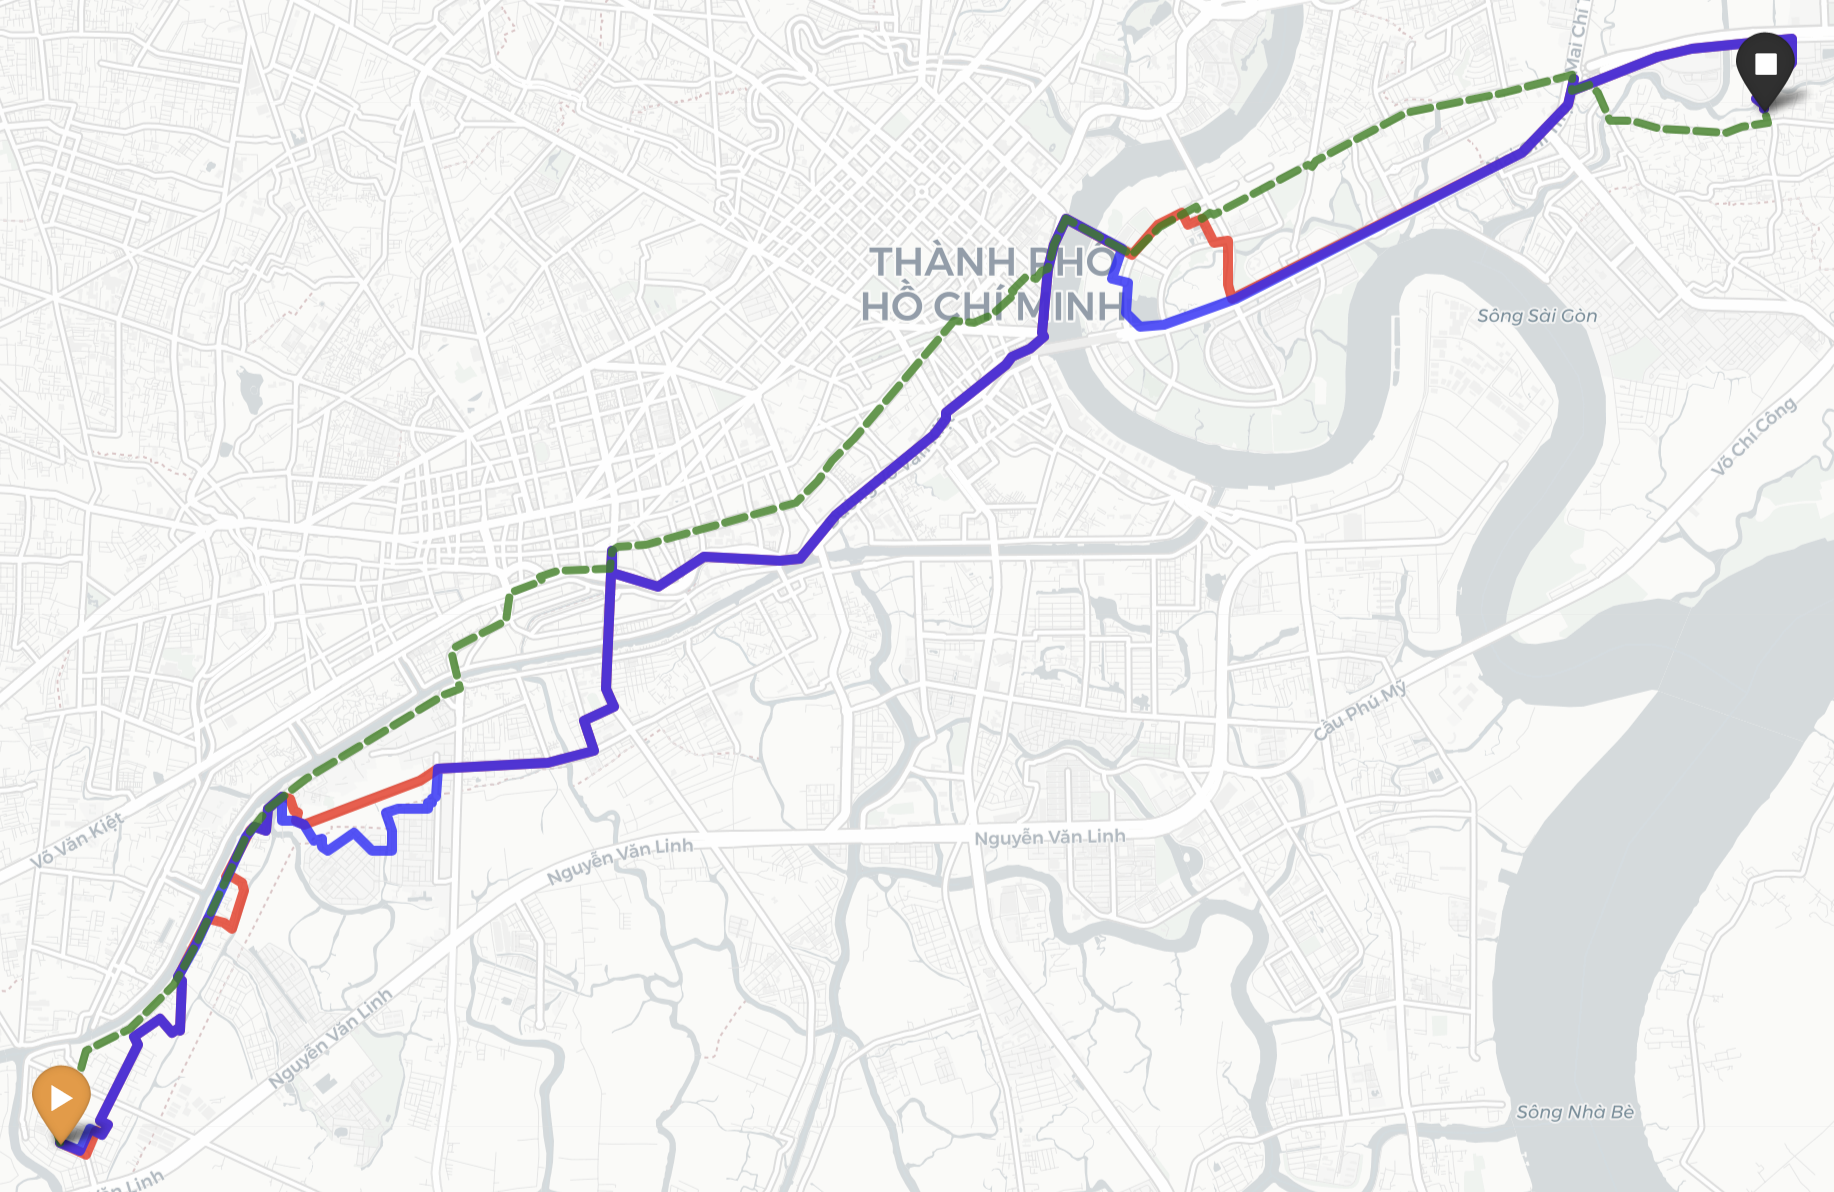
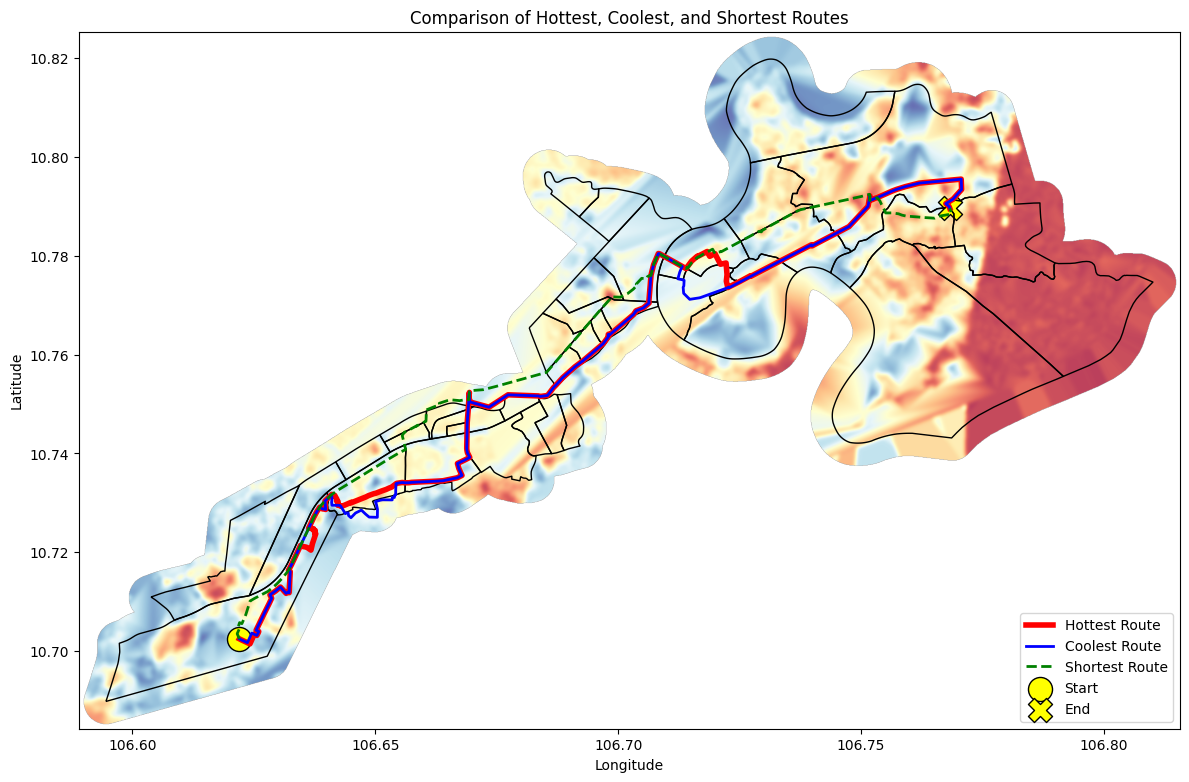
After generating predictions for network nodes, a prediction raster was derived from them and interpolated to create a hybrid cost surface. The raster resolution was 0.0001 degrees and 2,266 × 1,409 pixel resolution clipped to the area of interest encompassing the districts, and a Gaussian blur (sigma = 4) was applied to smooth out interpolation artifacts. Dijkstra’s algorithm was implemented [10], assigning heat edge costs by combining normalized length and temperature to support three route types with tunable heat penalty and reward parameters: shortest, coolest with a temperature penalty, and hottest with an inverted temperature penalty to reward. Model performance was evaluated using three complementary metrics: training set performance, spatial cross-validation (leave-one-ward-out), and holdout ward (An Phú) performance. The spatial cross-validation reveals substantial inter-ward variability (± 0.27 R²), indicating that some wards are considerably harder to predict than others. The holdout ward (An Phú) achieved higher R² than the spatial CV average, suggesting it shares similar characteristics with the training wards.
The contribution of GSV-derived streetscape features was quantified by comparing the full model (with GSV) to the deployment model (raster-only):
Table 4: Improvement in model performance attributable to GSV-derived features.
Spatial CV R² Improvement +0.0530 Holdout R² Improvement +0.0234
GSV features provide modest but meaningful improvement, confirming that street-level imagery adds predictive value beyond satellite data alone. The dominant predictors were consistent across both models. Landcover class, NDVI, and emissivity ranked highest, together accounting for over 55% of predictive power. In the full model, GSV-derived streetscape variables (vegetation, water, sky percentages) contributed additional explanatory signal, ranking within the top 10 features.
The coolest route increases travel distance but reduces both mean and peak exposure, demonstrating tangible potential for heat-resilient mobility guidance. The hottest route identifies corridors of maximum heat exposure-priority candidates for infrastructure intervention.
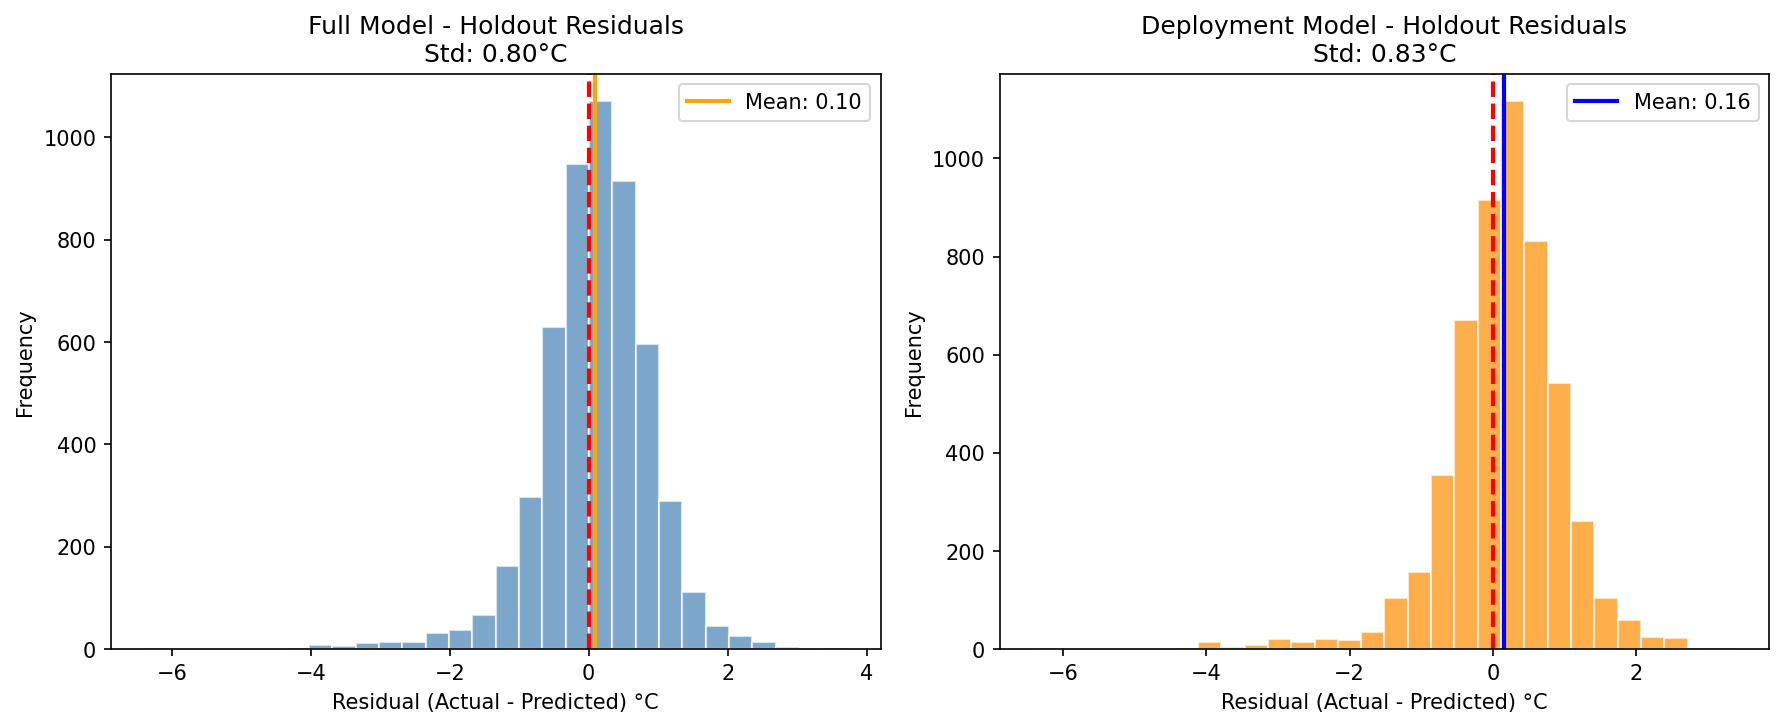
Hot Hẻm demonstrates a scalable approach for integrating human-scale streetscape morphology with city-scale remote sensing to operationalize pedestrian heat risk. The deployment model achieves R² of 0.69 on the held-out An Phú ward, with predictions typically within 0.61°C (MAE) of observed LST, demonstrating robust generalization to unseen areas. However, there are significant limitations for the future:
Spatial Transferability: Performance varies significantly by ward (CV std = ±0.27 R²). Some areas with unique urban morphology are harder to predict, and the model may underperform in wards that differ substantially from the training distribution [3].
Temporal Mismatch: GSV images were captured at various times over several years, while Landsat composites represent dry-season 2023-2025 maximum temperatures. Street conditions (e.g., tree canopy, construction) may have changed between GSV capture and satellite observation.
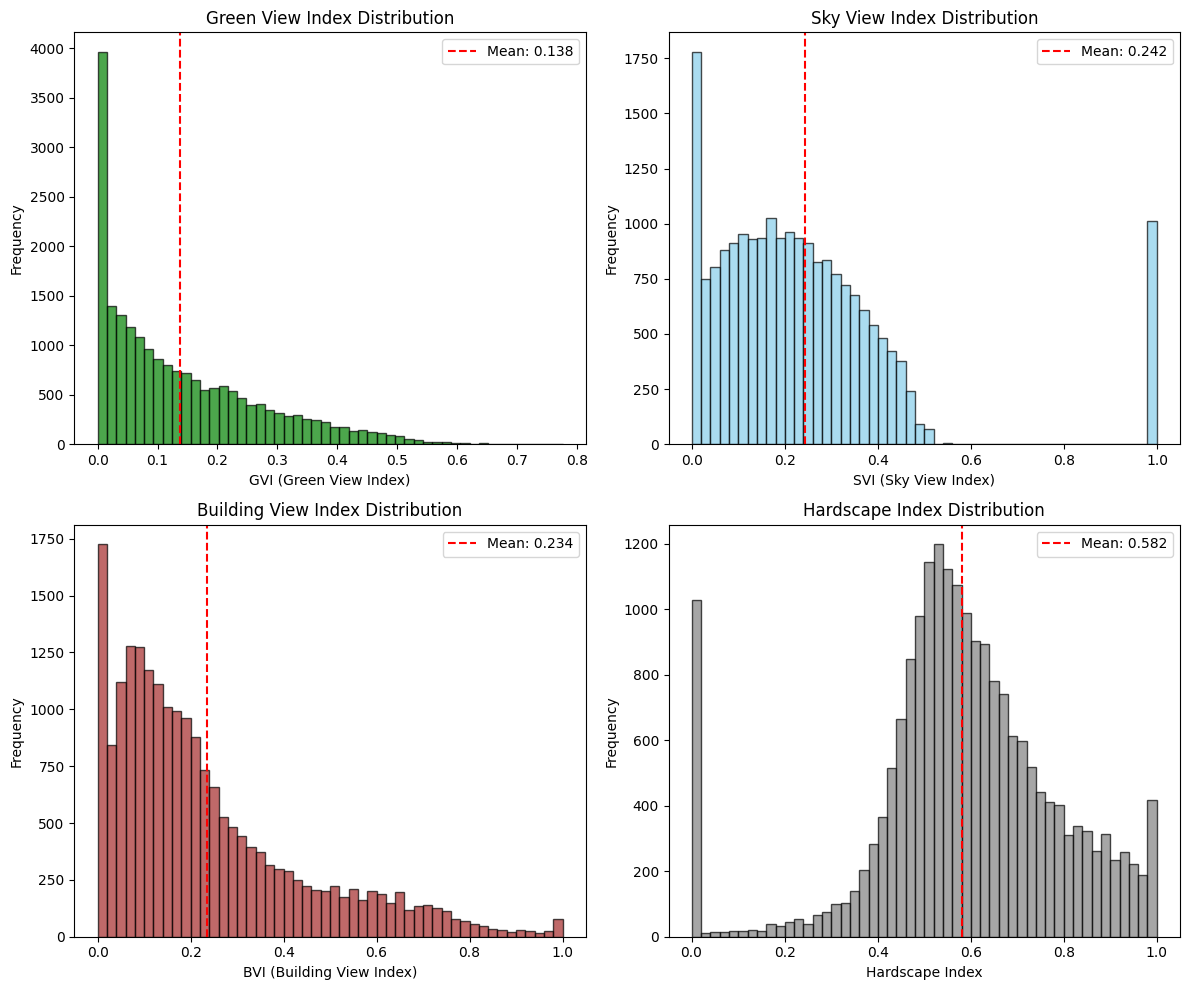
Feature Redundancy: The originally computed GVI, SVI, and BVI indices were identical to their corresponding superclass percentages (pct_vegetation, pct_sky, pct_building) and were removed from the final model to avoid redundancy.
The sky view factor derived from the 30m terrain DSM captures topographic effects but does not fully represent urban canyon geometry at the street level.
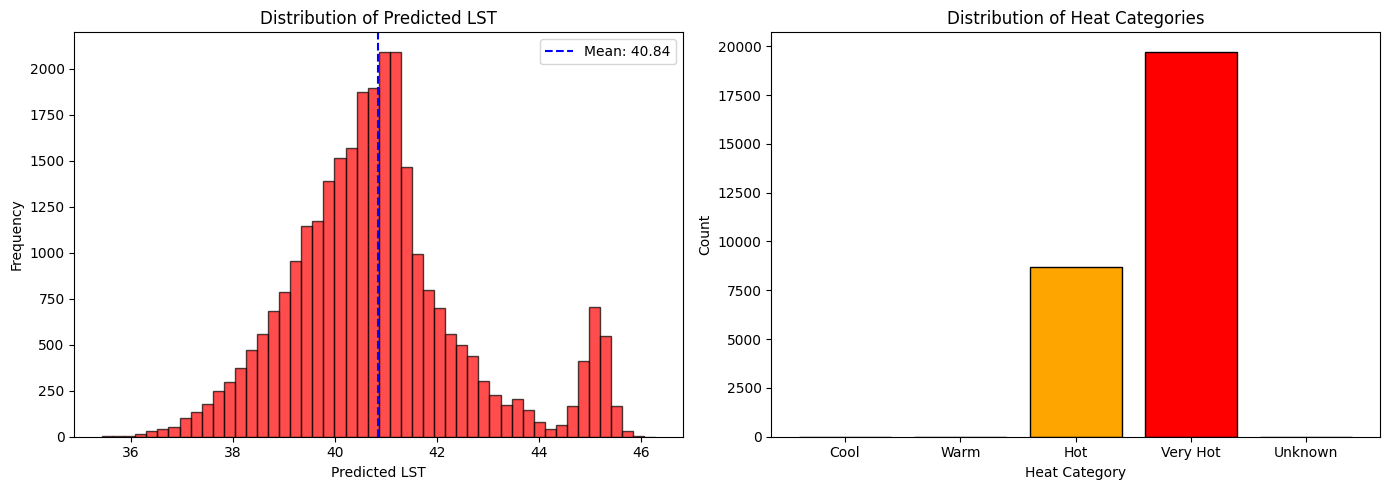
The current heat-category thresholds skew heavily toward “Hot / Very Hot,” suggesting that categorical calibration (e.g., quantile-based or health-relevant thresholds) should be refined prior to policyfacing deployment.
This project delivers a reproducible, multi-scale GeoAI pipeline for heatweighted pedestrian routing in Ho Chi Minh City. By combining GSV-derived segmentation indices with Landsat thermal variables, JAXA SAR structure, and DSM terrain context, the framework achieves strong predictive accuracy (holdout R² = 0.70, MAE = 0.6°C) and enables practical routing alternatives that identify heat exposure corridors.
The key insight is methodological: rather than helping individuals escape heat, the hottest route optimization identifies where pedestrians suffer most, providing municipalities with actionable data for infrastructure intervention. The 26% distance penalty imposed by the coolest route demonstrates that heat avoidance should not be framed as individual responsibility-it is a systemic infrastructure challenge requiring public investment. It should be noted that GSV imagery contains copyright restrictions forbidding their implementations in building applications, so granular streetscape imagery would need to be manually obtained or downloaded from open-source material.
Future extensions should include multi-ward holdout testing, threshold calibration using health-relevant cutoffs, multi-season or diurnal modeling, weather data, uncertainty-aware routing, and Meta’s tree canopy height data [17], and Global Building Atlas’ 3D dataset [18] to further strengthen real-world applicability.
This content is AI-processed based on open access ArXiv data.