Vision-Based Early Fault Diagnosis and Self-Recovery for Strawberry Harvesting Robots
📝 Original Paper Info
- Title: Vision-Based Early Fault Diagnosis and Self-Recovery for Strawberry Harvesting Robots- ArXiv ID: 2601.02085
- Date: 2026-01-05
- Authors: Meili Sun, Chunjiang Zhao, Lichao Yang, Hao Liu, Shimin Hu, Ya Xiong
📝 Abstract
Strawberry harvesting robots faced persistent challenges such as low integration of visual perception, fruit-gripper misalignment, empty grasping, and strawberry slippage from the gripper due to insufficient gripping force, all of which compromised harvesting stability and efficiency in orchard environments. To overcome these issues, this paper proposed a visual fault diagnosis and self-recovery framework that integrated multi-task perception with corrective control strategies. At the core of this framework was SRR-Net, an end-to-end multi-task perception model that simultaneously performed strawberry detection, segmentation, and ripeness estimation, thereby unifying visual perception with fault diagnosis. Based on this integrated perception, a relative error compensation method based on the simultaneous target-gripper detection was designed to address positional misalignment, correcting deviations when error exceeded the tolerance threshold. To mitigate empty grasping and fruit-slippage faults, an early abort strategy was implemented. A micro-optical camera embedded in the end-effector provided real-time visual feedback, enabling grasp detection during the deflating stage and strawberry slip prediction during snap-off through MobileNet V3-Small classifier and a time-series LSTM classifier. Experiments demonstrated that SRR-Net maintained high perception accuracy. For detection, it achieved a precision of 0.895 and recall of 0.813 on strawberries, and 0.972/0.958 on hands. In segmentation, it yielded a precision of 0.887 and recall of 0.747 for strawberries, and 0.974/0.947 for hands. For ripeness estimation, SRR-Net attained a mean absolute error of 0.035, while simultaneously supporting multi-task perception and sustaining a competitive inference speed of 163.35 FPS.💡 Summary & Analysis
1. **SRR-Net Introduction**: SRR-Net is a deep learning-based visual perception model that can perform multiple tasks simultaneously. This single model handles detection, segmentation, and ripeness estimation all at once, much like how a person uses their eyes to identify and judge an object. 2. **Relative Error Compensation Method**: Based on the results of visual recognition, this method adjusts the position of the robotic arm for precise harvesting. This allows the robot to operate more accurately, similar to how GPS guides a car driver's route. 3. **Early Abort Strategy**: During the harvesting process, if an apple is not properly grasped or slips out, the system can predict these issues and terminate the current cycle accordingly. This is akin to a race coordinator stopping a race immediately upon detecting problems.📄 Full Paper Content (ArXiv Source)
Harvesting robots have made significant progress in recent years, showing great potential to reduce labor dependence and improve agricultural productivity. However, several mechanical, electrical, and control faults still arise during robotic operations, compromising operational stability and continuity. For example, mechanical structural failures , air leakage in pneumatic end-effectors , and fractures in end-joint connectors can impair the normal operation of strawberry harvesting robots. Moreover, the absence of active learning and self-updating mechanisms renders models ineffective in adapting to changing conditions. Failure to respond to abnormal signals also poses operational and safety risks to the robot. Once any single component fails or produces an erroneous output, the entire harvesting process is interrupted. Due to the lack of robust fault diagnosis and self-recovery mechanisms, harvesting robots remain prone to frequent work interruptions, which shortens their effective operation time in the field.
Generally, fruit harvesting with robots involves seven key steps: image acquisition, fruit detection, segmentation and ripeness estimation, instance tracking and localization, motion planning, execution, result evaluation with fault diagnosis, and result recording with optimization. Along this pipeline, potential faults may occur in multiple stages . On the perception side, problems such as blurred or occluded cameras, unstable illumination , network/data loss, inaccurate segmentation , ripeness misclassification , ID tracking drift, and depth or calibration errors can lead to detection failures. At the motion control level, incorrect path planning, collision avoidance errors, inverse kinematics failures, or grasp misalignment may disrupt harvesting. Even after successful contact, execution faults such as loose grasps, failed detachments, fruit damage, or gripper jamming remain common. These are further compounded by inaccurate success/failure judgment and inadequate fault recovery, resulting in prolonged downtime. Without robust fault diagnosis and self-recovery mechanisms, current robots are prone to frequent interruptions, severely limiting their effective operating time in orchards.
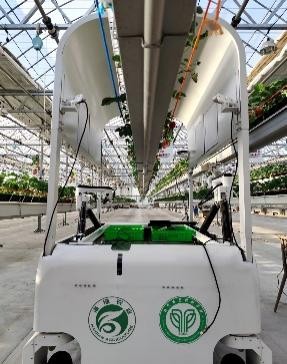
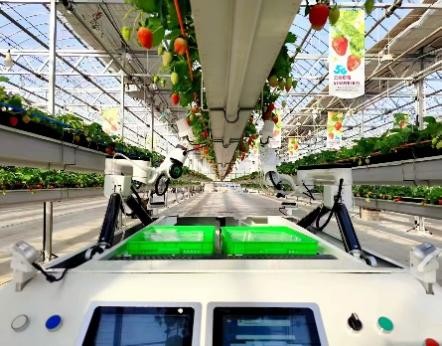
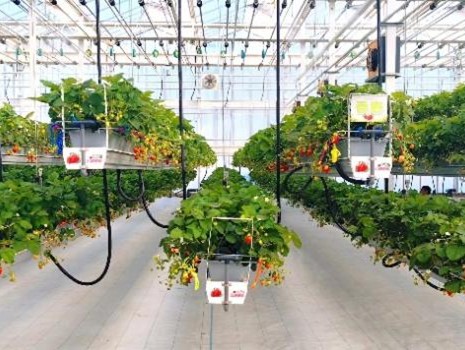
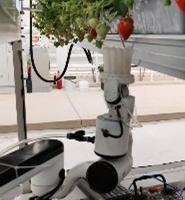
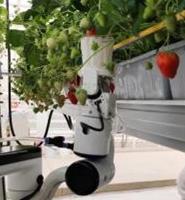
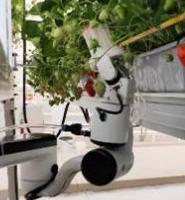
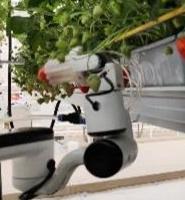
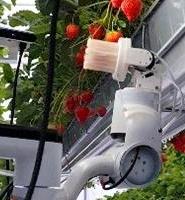
In the HarvestFlex system (https://xiong-lab.cn/) , as shown in Fig. 1 (a) and (b), a RealSense D455F depth camera (Intel, Realsense, USA) captured real-time RGB-D images, which were processed by YOLOv8/11 for strawberry detection and segmentation. A checkerboard-based calibration enabled eye-to-hand coordinate transformation, while polynomial regression compensated spatial errors. For sequence planning, a minimal-height sorting algorithm determined harvesting order, and a point-to-point speed pattern-based method ensured efficient move the end-effector. The end-effector was a flexible pneumatic gripper that inflated and deflated to gently envelop and detach strawberries. The complete harvesting workflow consisted of six steps: inflating and approaching, swallowing, deflating, snap off, descending and placing, in Fig. 2. However, several issues emerged with our HarvestFlex robot that severely compromised its ability to harvest stably and continuously. These primary challenges were: (1) Low integration of visual perception tasks – the limited fusion of detection, segmentation, and ripeness estimation led to increased model complexity and reduced inference speed, thereby constraining overall system efficiency. (2) Positional inaccuracy between the end-effector and the target fruit – although the eye-to-hand approach offered a stable field of view for dynamic fruit tracking, it remained highly sensitive to hand-eye calibration errors. Even minor deviations could lead to misalignment, empty grasps, unsuccessful detachments, or incorrect placements, thereby disrupting continuous operation. (3) Inadequate gripping and strawberry slippage – although the pneumatic soft gripper reduced fruit damage, its high compliance makes the integration of reliable tactile or slippage sensors challenging. Consequently, slippage often went undetected, resulting in wasted cycle time and, in some cases, unintended fruit release during the snap-off stage. This problem was further compounded by the immaturity of current tactile sensing technologies, which remained expensive, unstable, and impractical for large-scale deployment in orchard environments. Moreover, existing tactile sensor technologies remained immature, with solutions that are typically expensive, unstable, and challenging to deploy reliably in orchard environments.
To mitigate such problems, fault diagnosis and recovery methods were generally classified into two categories: traditional approaches and deep learning-based techniques to deal with electrical, software and control, process-related, and human errors faults . Traditionally, various methods were proposed to address robotic faults, such as signal processing techniques , rule-based systems , model-based approaches , etc. However, these traditional methods faced limitations in handling complex fault scenarios, particularly in the case of rule-based and threshold-based approaches. With advances in computer hardware, deep learning emerged a new paradigm for fault diagnosis, enabling automatic feature extraction from multi-modal data such as sensor signals, vibrations, acoustics, and images. CNNs were applied to surface defect detection , while RNNs and LSTMs were used to analyze time-series data for early fault detection in . However, these methods often relied on additional sensors to acquire high-quality multi-modal data, which not only increased system cost and complexity but also complicated deployment in real-world agricultural environments. Furthermore, ensuring temporal and spatial alignment across heterogeneous data sources (e.g., vision, vibration, and tactile signals) remained a nontrivial challenge, as even slight misalignments could degrade fault diagnosis accuracy.
To overcome these limitations, this paper focused on a vision-based fault diagnosis framework for HarvestFlex, thereby avoiding the need for additional multi-modal sensors and the complexities of data alignment. The objective was to address software- and control-related faults that compromised harvesting stability and efficiency. To this end, an end-to-end multi-task perception method SRR-Net was introduced and integrated visual perception with fault object detection while maintaining a lightweight model architecture and low computational load. The method comprised three primary subtasks: object detection, instance segmentation, and ripeness estimation. To align the gripper with the harvesting point, a relative error compensation method based on the simultaneous target-gripper detection was implemented in the coordinate frame of robot arm once the gripper reached the position beneath the target. Then, a corrected harvesting point was generated, guiding the gripper to move beneath the target for a second time to ensure accurate alignment. Furthermore, an early abort strategy was introduced to improve the reliability of the harvesting process. Specifically, a micro-optical camera embedded at the base of the gripper continuously monitors the presence and stability of strawberries. In the deflating stage, the MobileNet V3-Small verified whether the fruit had been successfully grasped, while in the snap-off stage, an LSTM classifier estimated the probability of the strawberry slippage from the gripper. If no strawberry was detected, an early abort signal was triggered to terminate the current cycle. This integrated perception–action framework enabled prompt detection of empty grasps or slippage, allowing the robotic arm to respond rapidly and maintain stable operation. The main contributions of this paper were as follows.
-
An end-to-end multi-task perception framework, SRR-Net, was introduced to integrate visual perception with fault diagnosis.
-
A relative error compensation method based on the simultaneous target-gripper detection was developed to realign the position of end-effector when approaching the area beneath the picking point.
-
To enhance operational reliability, an early abort strategy was implemented. During the deflating stage, MobileNet V3-Small was used to classify whether the strawberry had been successfully grasped. Subsequently, in the snap-off stage, an LSTM classifier predicted the likelihood of fruit slippage from the gripper, enabling timely corrective actions.
Dataset Benchmark
In this paper, FaultData, GraspData and SnapData were constructed to support the multi-task vision perception task, grasp adjustment task and enable the time-series LSTM classifier task. All data were collected using the HarvestFlex strawberry-harvesting robot, which includes two robotic arms , two Realsense D455F cameras, and two controllable light sources, as shown in Fig. 1(a–b). The cameras captured RGB-D images at a resolution of 640×480 pixels, with the distance between the lens and the strawberries ranging from 30 to 90 cm. Data were collected in both natural and controlled lighting environments to enhance the robot’s visual adaptability to complex and dynamic orchard conditions.
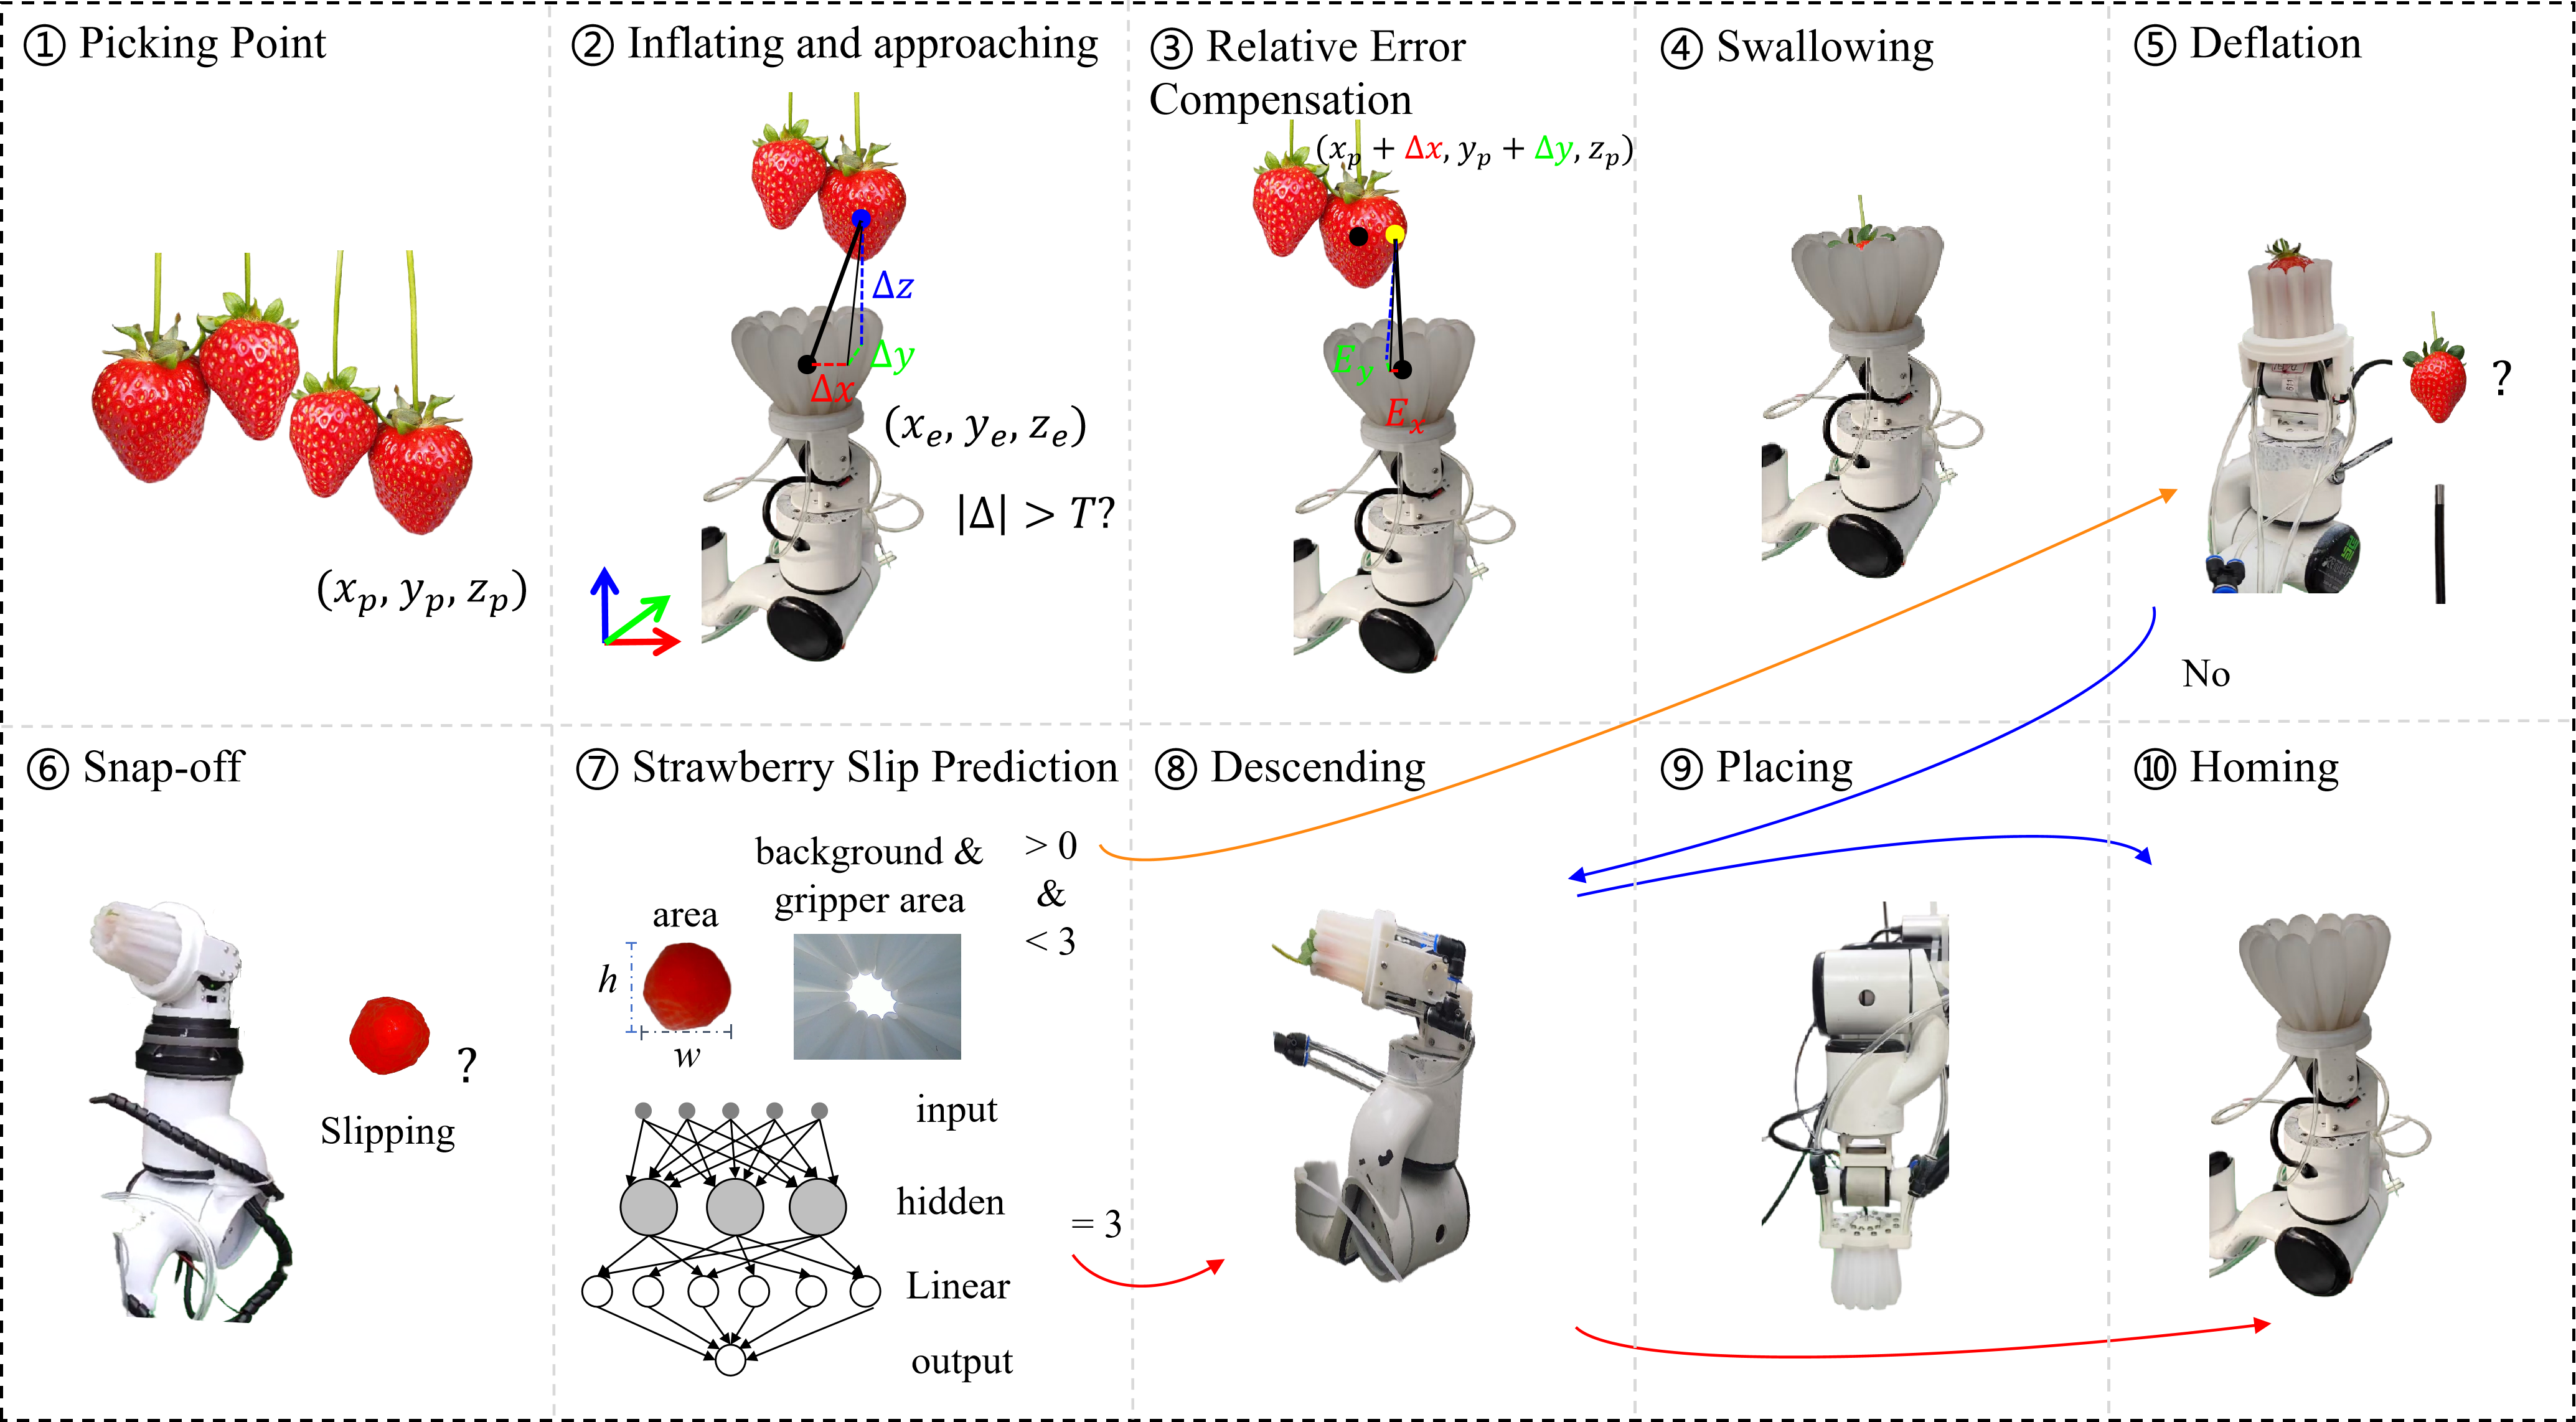
FaultData For the tasks of detection, segmentation and ripeness estimation of strawberry and gripper, diverse strawberry formations-such as isolated, overlapping, and occluded fruits-as well as the complete operational sequence of the end-effector during picking images were collected. To ensure robust and continuous operation for multi-task vision perception task, the dataset also incorporated a variety of lighting conditions, weather scenarios, and nighttime environments, laying the foundation for stable, autonomous, all-weather performance. In addition, high-resolution images were captured using a Redmi Note 13 Pro smartphone and an Orbbec Gemini Pro RGB-D camera (Orbbec, Gemini Pro, China) providing enhanced texture and color information. The entire dataset was collected at the Cuihu Factory in Beijing, China, and featured the Fragaria × ananassa ‘Kaorino’ cultivar, as shown in Fig. 1(c). All images were annotated with the polygonal outlines of strawberries and the end-effector using Labelme . Each object instance was labeled as strawberry, hand or table, with the ripeness of strawberries assigned based on . The ripeness score was defined within the range [0,1.1]. The label format for each instance followed the structure: $`<`$cls$`>`$ $`<`$ripeness$`>`$ $`<`$boundaries$`>`$, where cls represented the object class. The dataset was split into training and validation subsets, consisting of 2954 and 779 images, respectively. Note that the ripeness attribute applied only to strawberries. To ensure a consistent label format, the table and hand class was assigned alignment flags of 2 and 3.
GraspData Using a miniature camera, image data were collected during the deflation stage of the end-effector. A total of 594 images were acquired. In the training and validation sets, the numbers of images with strawberries and without strawberries during the deflating stage are 197/202 and 93/102, respectively.
SnapData For the time-series prediction task during the strawberry snap-off stage, all images were captured using a micro-optical camera mounted on the end-effector based on artificial strawberry instances. In each frame, key visual features—including the normalized strawberry area, normalized gripper area, normalized background area, and the width and height of the strawberry—were extracted using a fine-tuned SRR-Net. These features were structured in the format: $`<`$strawberry_area$`>`$, $`<`$gripper_area$`>`$, $`<`$background_area$`>`$, $`<`$w$`>`$, $`<`$h$`>`$, $`<`$label$`>`$, where label denotes the presence (0) or absence (1) of the strawberry within the gripper. A sliding window of 10 consecutive frames was used to form each input sequence. For each sequence, a label was assigned based on the next 3 frames immediately following the sequence. This label indicated whether the strawberry was at risk of slipping from the gripper. This structure enabled the training and validation of a binary LSTM classifier to estimate the likelihood of strawberry slippage. The training and validation sets comprise 341 and 147 samples, respectively.
Visual Fault Diagnosis and Self-Recovery Method
Overview
The HarvestFlex robot has successfully achieved strawberry harvesting in orchard environments. However, several challenges persisted that hindered harvesting performance during continuous operations. The core challenges included: (a) limited integration of visual perception; (b) grasping misalignment or failure resulting from positional offsets; and (c) reliance on human intervention to determine success or failure during the picking process, owing to the absence of automated evaluation and recovery mechanisms, as shown in Fig. 3.
To address the aforementioned issues, a vision-based harvest fault diagnosis and self-recovery architecture was developed. This architecture integrated three key components: an end-to-end multi-task perception network, a relative error compensation method, an early abort strategy based on the empty grasp adjustment and strawberry slip prediction. Specifically, the end-to-end multi-task perception network, SRR-Net, simultaneously performed detection, segmentation, and ripeness estimation. Detection, segmentation, and ripeness estimation were integrated into an end-to-end method. A vision-based positional error compensation method was implemented to correct the $`x`$- and $`y`$-axis offsets between the picking point and the gripper center, thereby enhancing localization accuracy. To detect unsuccessful grasps, a micro-optical camera was embedded within the end-effector to monitor strawberry retention during the deflating stage and predict potential slippage risks during the snap-off stage. A MobileNet V3-Small classifier was applied to determinate the whether strawberry are present at the end-effector during the deflating stage. An LSTM-based visual time-series prediction model provided real-time forecasts of slippage, enabled a secondary harvesting attempt, the triggering of an early abort signal, or the continuation of subsequent actions.
End-to-End Multi-Task Perception Method: Detection, Segmentation and Ripeness Estimation
An end-to-end multi-task perception method, SRR-Net, was introduced to simultaneously perform detection, segmentation, and ripeness estimation of both strawberries and gripper. This method integrated low- and high-level feature representations with ripeness and biological attributes to comprehensively perceive strawberries and reduce errors in ripeness estimation. The method employed a lightweight network with shared weights. For strawberries, the perception task distinguished between ripe and unripe fruits via post-processing classification. For the robotic gripper, relative error between the gripper and the picking point was calculated.
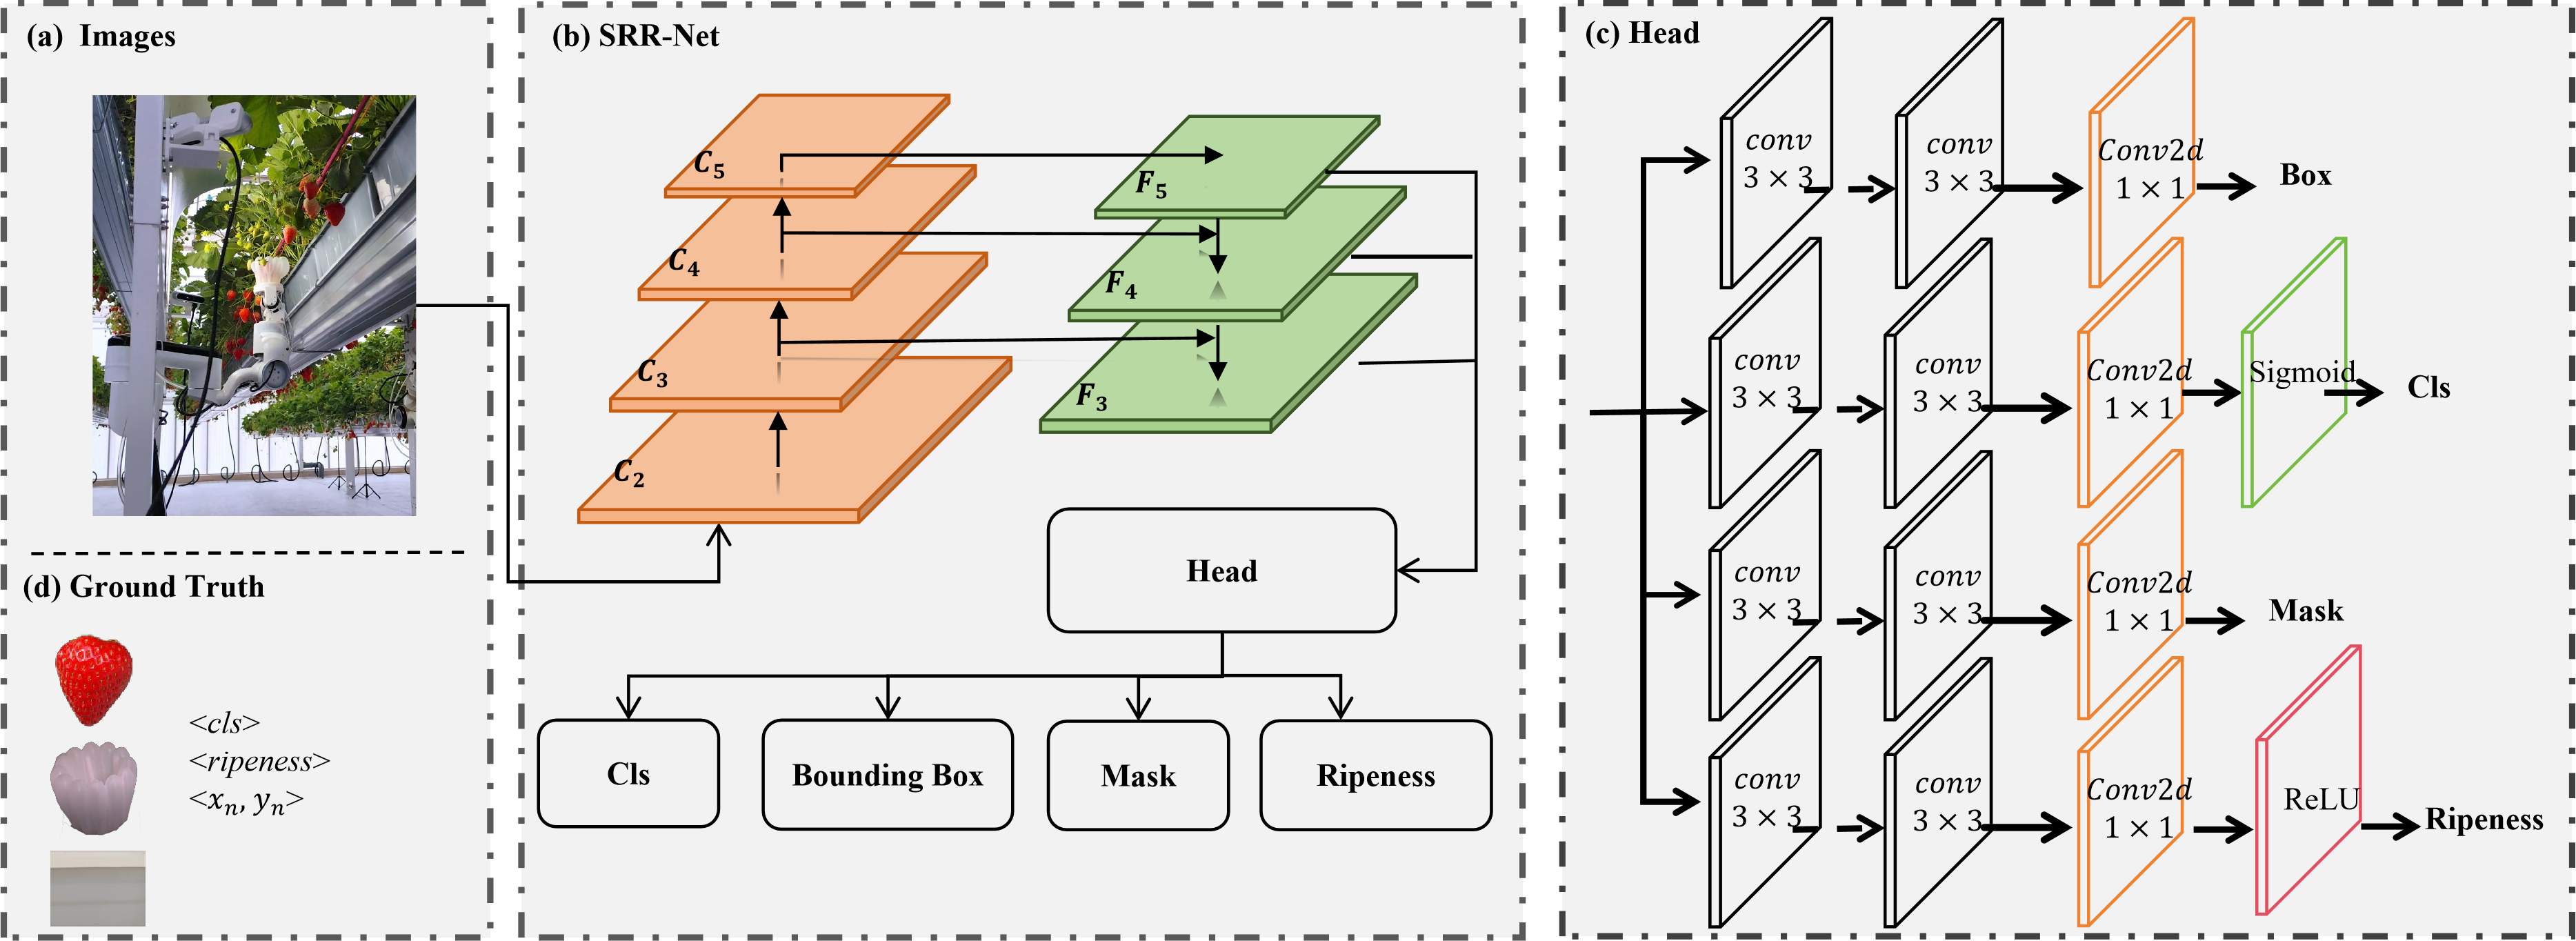
This method was built on the general real-time detection and segmentation framework YOLOv11. The architecture consisted of a backbone, neck, and head: the backbone extracted features, the neck fused multi-scale features, and the head performed classification, bounding box regression, instance segmentation, and ripeness estimation. Compared with the original YOLOv11, the primary modification was the addition of a parallel ripeness estimation branch embedded within the head. An overview of the proposed end-to-end multi-task method was shown in Fig. 4.
The ripeness estimation branch consisted of two convolutional layers with a 3×3 kernel, followed by a convolutional layer with a 1×1 kernel and a ReLU activation function. The ReLU constrained the predicted ripeness values within a valid range. To supervise ripeness estimation, the mean absolute error was used as the loss function, scaled by a factor $`\lambda`$ to balance its influence with the losses of other tasks. The ripeness loss was defined as follows:
\begin{equation}
\mathcal{L}_{ripeness} = \frac{\lambda }{N} \sum_{i=1}^{N} |r_i - \hat{r}_i|
\end{equation}where $`r_i`$ was the ground truth ripeness value, $`\hat{r}_i`$ was the predicted ripeness, $`N`$ was the number of predicted instances, and $`\lambda`$ was the weighting coefficient.
Simultaneous Target-Gripper Detection for Relative Error Compensation
Traditional harvesting robots rely on calibration-based methods to transform the object’s location from the camera frame to the robot arm frame. However, these approaches are susceptible to calibration errors and positioning inaccuracies in dynamic environments, exacerbated by system latency, making effective compensation challenging . In contrast, our proposed method detected the target strawberry and the gripper simultaneously in the same camera view, enabling direct estimation and correction of their relative error within that shared frame. This approach minimized the impact of absolute calibration inaccuracies and system latency, as the offset was computed relative to both elements in the same view, providing a more robust and real-time compensation strategy for improved picking accuracy in the HarvestFlex system.
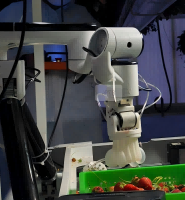
In the HarvestFlex arm’s workflow, a relative error compensation method was incorporated into the inflating and approaching and swallowing stages of the picking process, in Fig. 5.
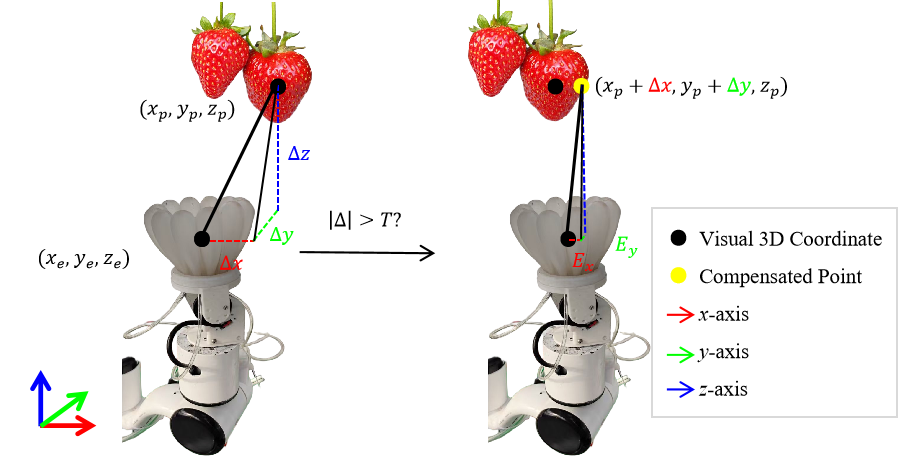
When the gripper approached the strawberry picking point, the 3D coordinates of both the end-effector and the picking point in the robot arm coordinate system were obtained. Specifically, using SRR-Net, the 2D image coordinates of the strawberry and the end-effector were extracted in the camera coordinate system. By combining these with the corresponding depth information, their 3D positions in the camera coordinate system were reconstructed and then transformed into the robot arm coordinate system through hand–eye calibration. Let $`(x_p,y_p,z_p)`$ and $`(x_e,y_e,z_e)`$ denote the coordinates of the picking point and the end-effector in the robot arm frame, respectively. The positional error between the end-effector and the picking point was defined as a 3D offset ($`\Delta x`$, $`\Delta y`$, $`\Delta z`$) , defined as
\begin{equation}
\Delta x = x_p - x_e; \Delta y = y_p - y_e; \Delta z = z_p - z_e
\end{equation}Since the snap-off stage necessitated bending the strawberry stem, the vertical position of gripper during the swallowing stage was adjusted to exceed that of the picking point. To simplify computation and reduce processing overhead, only the $`x`$- and $`y`$-axis errors were considered, while $`z`$-axis errors were ignored. Given an error tolerance threshold $`T`$, when the end-effector reached a position beneath the picking point and the absolute error exceeded $`T`$, the compensated picking point coordinates $`(x_c,y_c,z_c)`$ were computed as:
\begin{equation}
x_c =
\begin{cases}
x_p + \Delta x & \text{if } |\Delta x| > T \\
x_p & \text{otherwise}
\end{cases}
\end{equation}\begin{equation}
y_c =
\begin{cases}
y_p + \Delta y & \text{if } |\Delta y| > T \\
y_p & \text{otherwise}
\end{cases}
\end{equation}\begin{equation}
z_c = z_p
\end{equation}Here, $`T`$ denoted the maximum tolerance positional error for each axis, set to 10. The robotic arm was then moved to the compensated point for strawberry grasping.
Early Aborting Robotic Picking upon Grasp Adjustment and Slip Prediction
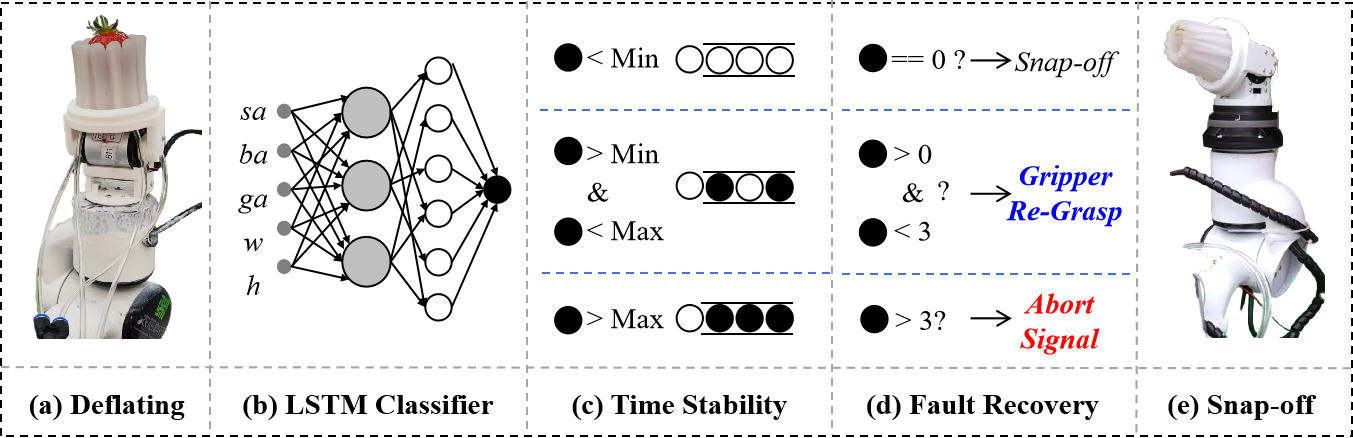
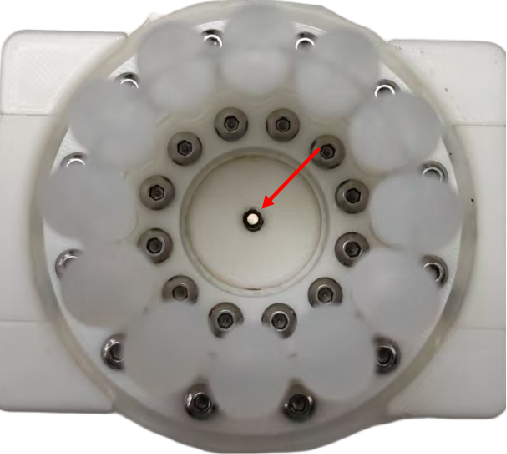
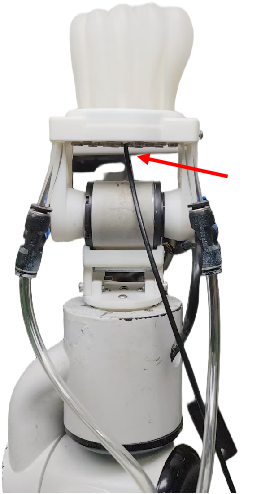
Empty grasp was a common failure mode in robotic strawberry harvesting during the deflating and snap-off stages. During the deflating stage, empty grasps occurred when the strawberry was not successfully enclosed by the end-effector, primarily due to localization errors or unexpected fruit motion. In the snap-off stage, strawberry slippage occurred when the picked strawberry unintentionally slipped, often due to a non-optimal end-effector pose or inadequate gripping force. To diagnose such faults effectively, a simple yet efficient method involved the installation of a miniature camera (JTS302, JiuTan, China) with a 3 mm diameter at the bottom of the end-effector, as shown in Fig. 6. The micro-optical camera directly captured real-time images of the gripper area, enabling visual monitoring of strawberry presence.
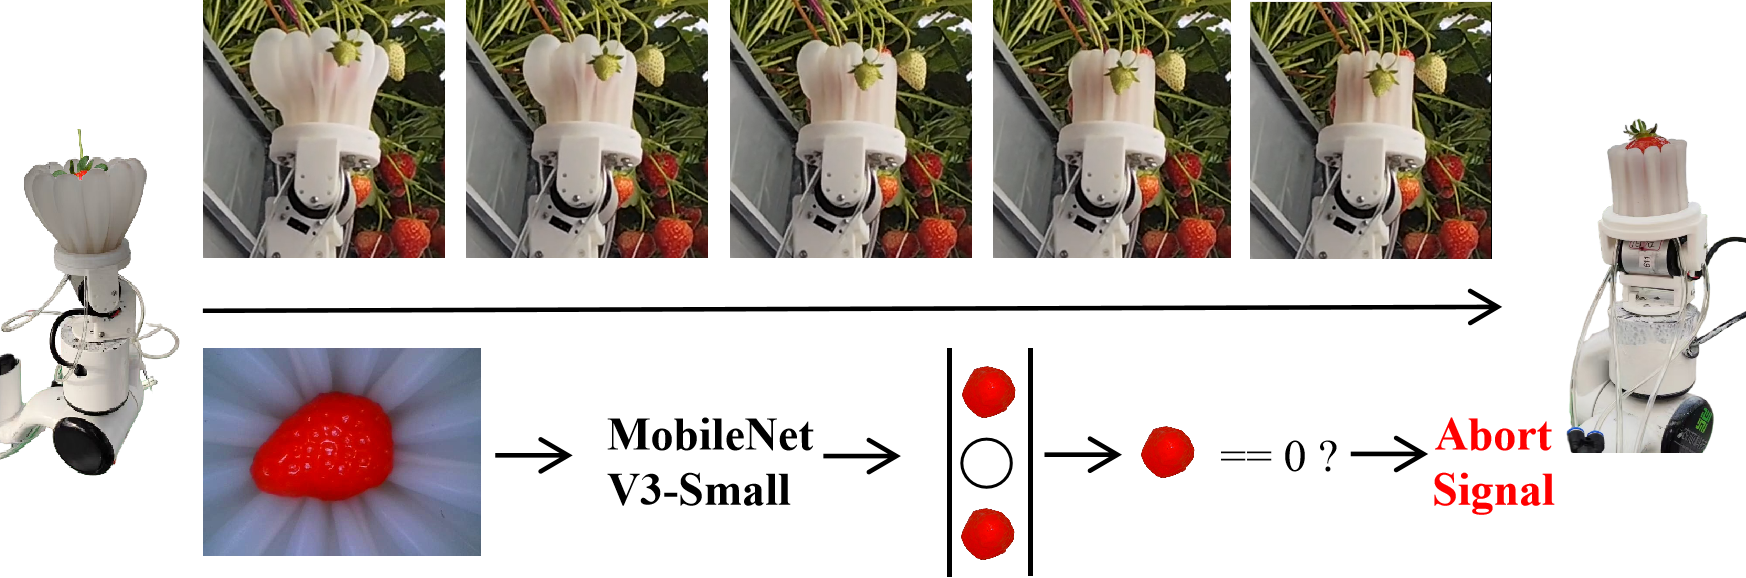
Once the deflating stage began, a MobileNet V3-Small was used to determine whether a strawberry was present in the gripper, as shown in Fig. 7. If a strawberry was detected, the robotic arm continued executing the subsequent picking actions. Otherwise, the robot skipped the deflating and placing stages of the picking sequence. Instead, it immediately selected a new target strawberry and proceeded to the next picking cycle. The process flow, indicated by the blue line, was illustrated in Fig. 3.
For the slippage scenario, a time-series LSTM classifier was developed to predict whether the strawberry would slip from the end-effector during the snap-off stage. The LSTM classifier architecture was summarized in Table 1. The input layer received a feature vector of dimension 5 from SRR-Net, which was followed by a hidden LSTM layer with 32 units that captured the temporal dependencies in the sequential data. The hidden representation was then mapped through a linear layer of size 32 and finally projected to a single output neuron that produced the classification result.
| Layer | Number |
|---|---|
| input | 5 |
| hidden | 32 |
| linear | 32 |
| output | 1 |
LSTM classifier architecture
The input of the LSTM classifier consisted of a sequence of features from the past 10 frames, represented as $`<`$normalized strawberry area, normalized gripper area, normalized background area, $`w`$, $`h`$ $`>`$. The normalized strawberry area, gripper area, and background area referred to the proportion of pixels in the image corresponding to the strawberry, the gripper, and the background, respectively. $`w`$ and $`h`$ represented the width and height of the strawberry. The model outputted the probability of slippage over the following three frames. If the probability fell below the minimum threshold, the strawberry remained attached to the end-effector after the snap-off motion, indicating a successful pick. Conversely, if the probability was equal to or exceeded the maximum threshold, the strawberry had slipped, indicating a failure in the snap-off stage. When the probability fell between the minimum and maximum thresholds, the strawberry was in the process of slipping from the gripper.
To enhance reliability, a time-stability rule was implemented. If slippage was predicted in three consecutive instances, an early abort signal was triggered, the placing stage was skipped, and the next picking cycle began. If the number of slipping instances was greater than zero but less than three, a secondary picking mechanism was activated, bypassing the inflating and approaching and swallowing stages, with the gripper inflating and deflating to re-grasp the strawberry during the snap-off actions. When no slip was predicted, the robot proceeded with the remaining steps until the cycle was completed.
Paradigm of HarvestFlex Visual Fault Diagnosis and Self-Recovery
In HarvestFlex, visual fault diagnosis and self-recovery proceeded through the following steps, in Fig. 9. First, RGB and depth images were captured by a RealSense camera. The RGB images were processed by an end-to-end multi-task perception network to detect and segment strawberries and the gripper, and to estimate strawberry ripeness. Using a predefined ripeness threshold, fruits were classified as ripe or unripe, and only ripe strawberries were tracked in real time. Next, the camera coordinates of both tracked ripe and untracked unripe strawberries were transformed into the robot arm coordinate via hand–eye calibration. The end-effector’s coordinates, based on the camera coordinate system, were also extracted, tracked, and transformed to prevent track ID jumps. The system then planned the picking sequence for ripe strawberries and computed the robot arm motion trajectory to reach the (compensated) picking points. The gripper harvested each strawberry in sequence until no ripe fruits remained, at which point the mobile platform repositioned.
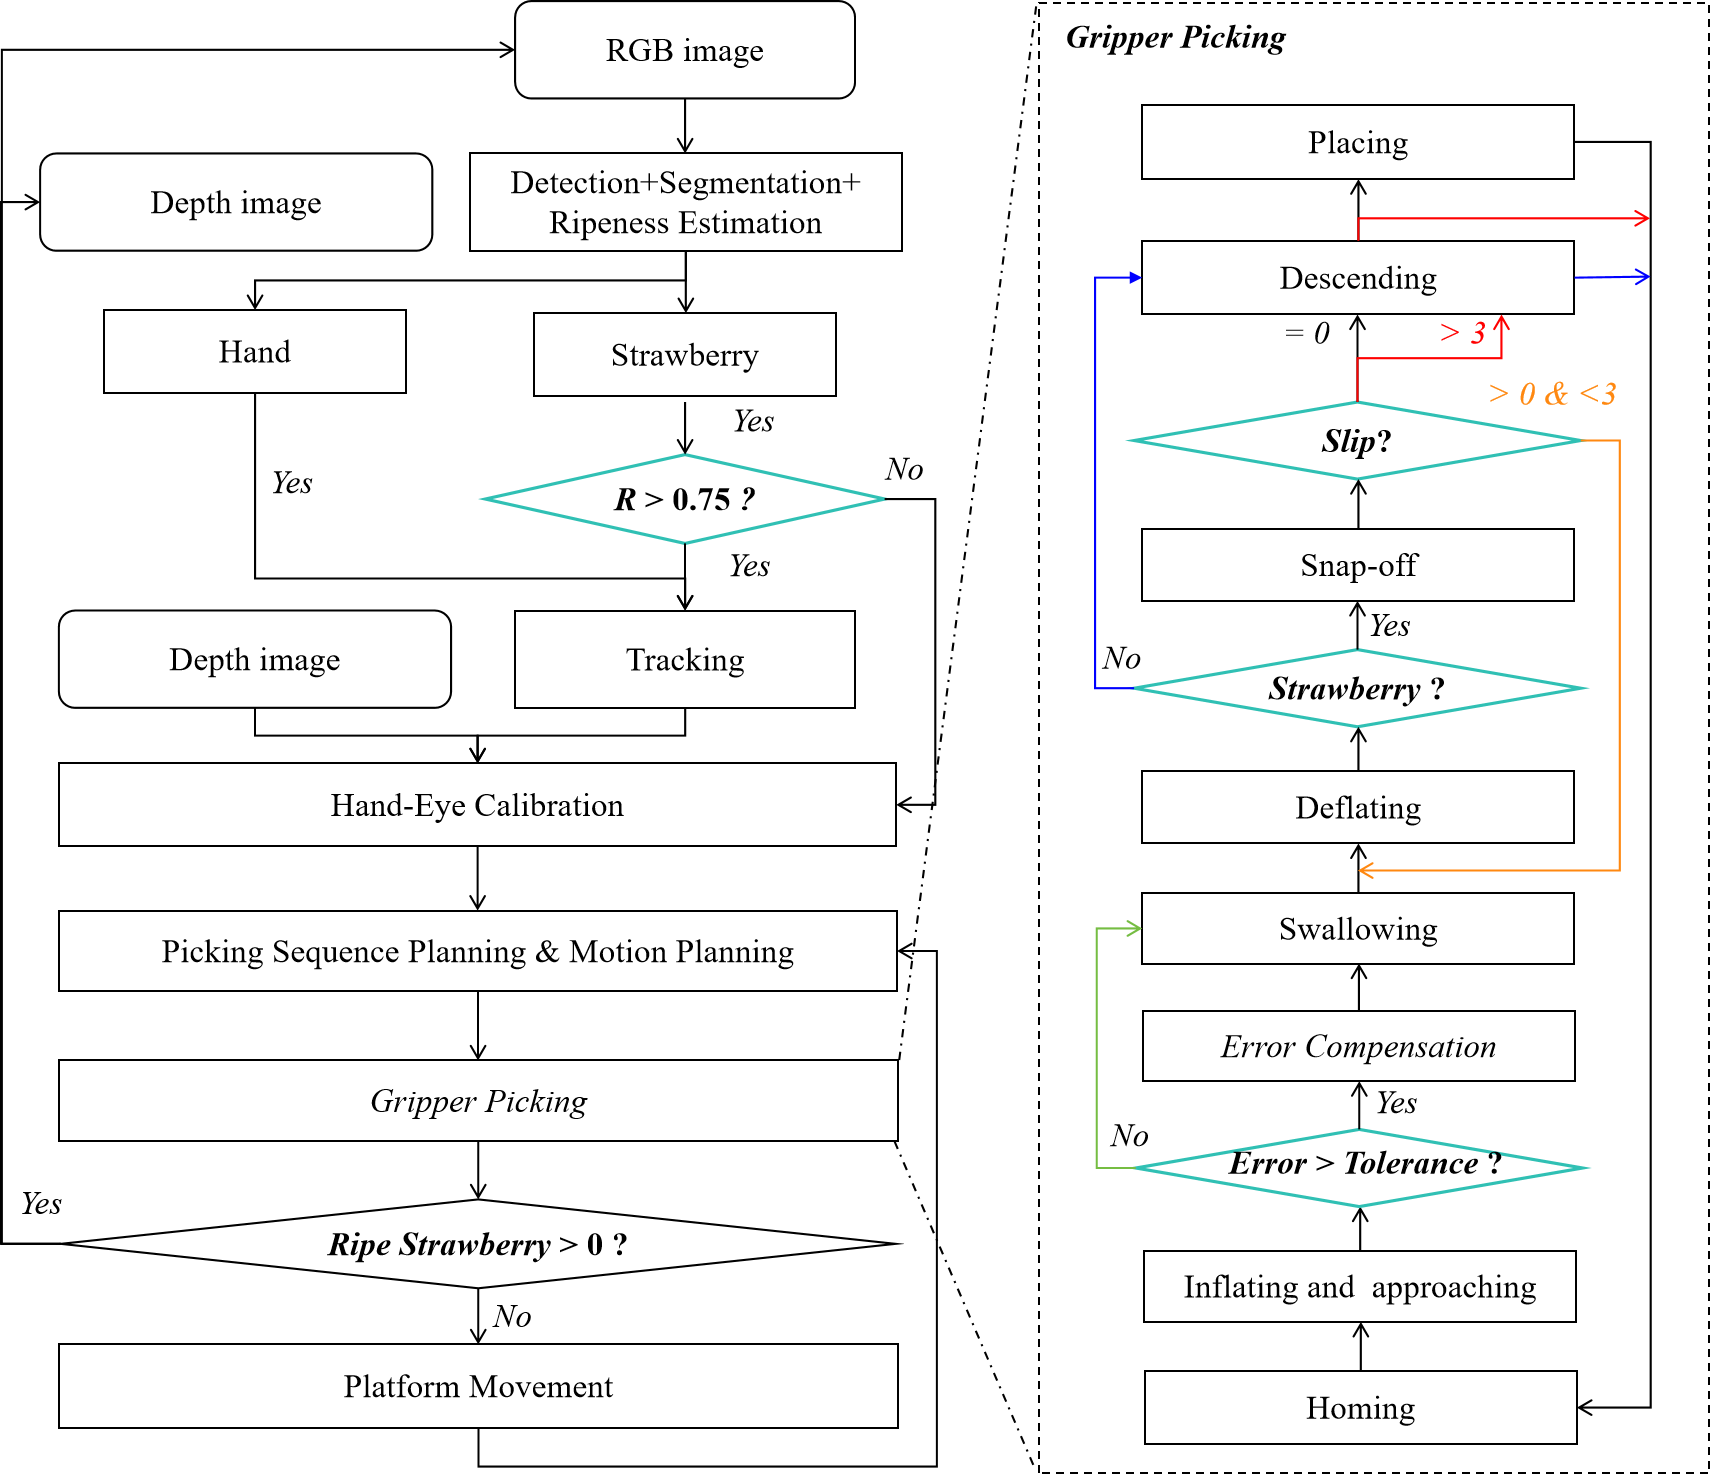
The relative positional error compensation method, incorporating visual feedback SRR-Net, and the early abort strategy based on MobileNet V3-Small and the LSTM-based strawberry slippage prediction were implemented as follows. The gripper then inflated and approached a location directly beneath the target strawberry picking point. At this position, the relative error between the gripper and the actual strawberry position was calculated. If the error exceeded a predefined tolerance threshold, a compensated picking point was generated to correct the deviation before proceeding.
Once aligned, the gripper executed swallowing and deflating motions to enclose the strawberry. During this process, a micro-optical camera mounted on the gripper captured images, which were used to determine whether the strawberry was successfully gripped based on MobileNet V3-Small classifier. If no strawberry was detected in the gripper for three consecutive frames, the robot executed descending and homing actions to initiate a new picking cycle. Conversely, it continuously performed the bending action while running a time-series LSTM classifier to predict strawberry slippage.
To improve prediction stability, a time-stability rule was applied. When the probability exceeded the maximum threshold for three consecutive instances, the robot aborted the snap-off stage, skipped the placing stage, and returned to its homing position, as illustrated by the red lines in Fig. 9. When the probability remained below the minimum threshold, the robot continued the snap-off motion before proceeding to the next stage, as illustrated by the black line in Fig. 9. Meanwhile, if the probability fell between the maximum and minimum thresholds for one or two instances, a new picking workflow was initiated, bypassing the approaching and swallowing stages. In this case, the gripper was inflated and deflated to re-grasp the strawberry during the deflating and snap-off actions, followed by the descending, placing, and homing steps, as illustrated by the orange line in Fig. 9.
Experiments
Evaluation Metrics
For the detection and segmentation tasks, precision and recall were used to evaluate performance, following the definitions in . For strawberry ripeness estimation, the mean absolute error (MAE) was adopted as the evaluation metric, defined as:
\begin{equation}
    \text{MAE} = \frac{1}{N} \sum_{i=1}^{N} |y_i - \hat{y}_i|
\end{equation}where $`y_i`$ denoted the ground-truth ripeness value, $`\hat{y}_i`$ was the predicted ripeness, and $`N`$ was the total number of samples. Additionally, the inference speed was assessed by measuring frames per second (FPS) on the FaultData validation set with resolution of 640×480.
For the relative error between the end-effector and the picked strawberry instance, the visual relative errors along the $`x`$-, $`y`$-, and $`z`$- axes under the robotic arm coordinate system were denoted as $`\Delta x`$, $`\Delta y`$, and $`\Delta z`$, respectively.
Due to the bending motion required during the snap-off stage, the end-effector’s ascent height could exceed that of the target point. Therefore, the error calculation was simplified from the $`x`$-, $`y`$-, and $`z`$-axes to only the $`x`$-, and $`y`$- axes. Similarly, the corresponding physical errors along the $`x`$-, and $`y`$-axes were denoted as $`\Delta x_w`$ and $`\Delta y_w`$. The physical error after compensation, denoted as $`E_x`$ and $`E_y`$, was measured to validate the effectiveness of the relative error compensation method. Finally, mean value $`\bar{e}`$ was used to evaluate the accuracy of the relative error and physical error before compensation and for each coordinate axis and can be formulated as:
\begin{equation}
  \bar{e} = \frac{1}{n} \sum_{1}^{n} |e| , \text{ where } e = \{\Delta x, \Delta y, \Delta x_w, \Delta y_w, E_x, E_y\}
\label{eq:mae_equation}
\end{equation}Implementation Details
To evaluate the effectiveness of the proposed method, experiments were conducted on the FaultData, GraspData, and SnapData benchmarks, with GraspData and SnapData constructed using artificial strawberries. The end-to-end multi-task perception framework was first trained and validated on the training and validation subsets of FaultData. Due to the limited strawberry growing season, the experiments were carried out indoors with artificial strawberries rather than in a strawberry orchard. During this evaluation, the relative error of the strawberry and the gripper beneath the picking point were measured, along with the physical error before compensation, the relative error before compensation, and the physical error after compensation, to assess picking accuracy. Furthermore, the end-to-end multi-task perception method was fine-tuned on SnapData-again initialized with the best weights from FaultData. The outputs of the multi-task perception model were then used as inputs to an LSTM classifier.
Results of Detection, Segmentation, Ripeness Estimation
SRR-Net, which integrated multi-task learning for both strawberry and hand classes, was evaluated on the FaultData dataset for detection, segmentation, and ripeness estimation in Table. [tbl-perception]. For bounding box prediction, it achieved a precision of 0.895, recall of 0.813, mAP@50 of 0.884, and mAP@50-95 of 0.633 for strawberries, while for the hand class, the corresponding values were 0.972, 0.958, 0.977, and 0.788, respectively. In segmentation, SRR-Net reached a precision of 0.887, recall of 0.747, mAP@50 of 0.829, and mAP@50-95 of 0.448 for strawberries, and 0.974, 0.947, 0.964, and 0.655 for hands.
Compared with YOLOv11 and YOLOv11-seg, SRR-Net demonstrated comparable detection and segmentation performance across both classes, with minor variations in individual metrics. In detection, its recall for strawberries was slightly higher than YOLOv11, while the mAP values remained similar to YOLOv11-seg. In segmentation, SRR-Net showed a modest gain in recall over YOLOv11-seg, while maintaining comparable precision. These results indicate a balanced trade-off between precision and recall, with the segmentation branch preserving high precision and competitive recall, enabling reliable identification of strawberries and hands.
In ripeness estimation, SRR-Net achieved a mean absolute error of 0.035, highlighting its advantage in accurately assessing strawberry ripeness levels. Regarding inference speed, SRR-Net reached 163.35 FPS, remaining close to the speed of YOLOv11-seg (167.89 FPS), demonstrating that the added ripeness estimation branch does not compromise real-time performance.
Overall, these results suggested that SRR-Net maintained detection and segmentation performance on par with established baselines, while also demonstrating solid capability in ripeness estimation accuracy and inference speed. As an end-to-end multi-task visual perception framework, it effectively integrated detection, segmentation, and ripeness estimation, achieving a well-balanced performance across all tasks.
| Method | Class | Box | Mask | MAE | FPS | ||||||
| P | R | mAP@50 | mAP@50-95 | P | R | mAP@50 | mAP@50-95 | ||||
| FaultData | |||||||||||
| YOLOv11 | strawberry | 0.915 | 0.792 | 0.884 | 0.633 | - | - | - | - | - | 201.10 |
| hand | 0.966 | 0.957 | 0.977 | 0.793 | - | - | - | - | - | ||
| YOLOv11-seg | strawberry | 0.892 | 0.812 | 0.884 | 0.663 | 0.864 | 0.753 | 0.824 | 0.442 | - | 167.89 |
| hand | 0.968 | 0.957 | 0.976 | 0.791 | 0.971 | 0.95 | 0.975 | 0.653 | - | ||
| SRR-Net | strawberry | 0.895 | 0.813 | 0.884 | 0.633 | 0.887 | 0.747 | 0.829 | 0.448 | 0.035 | 163.35 |
| hand | 0.972 | 0.958 | 0.977 | 0.788 | 0.974 | 0.947 | 0.964 | 0.655 | - | ||
| SnapData | |||||||||||
| SRR-Net | strawberry | 0.999 | 0.992 | 0.995 | 0.978 | 0.999 | 0.992 | 0.995 | 0.981 | - | - |
| background | 0.881 | 0.922 | 0.941 | 0.807 | 0.888 | 0.93 | 0.946 | 0.824 | - | ||
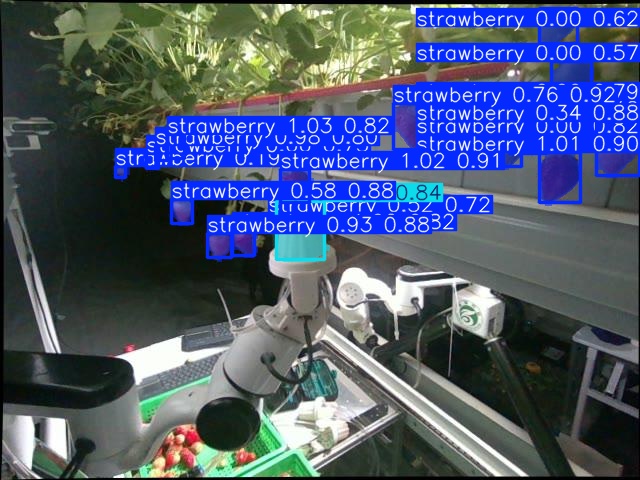
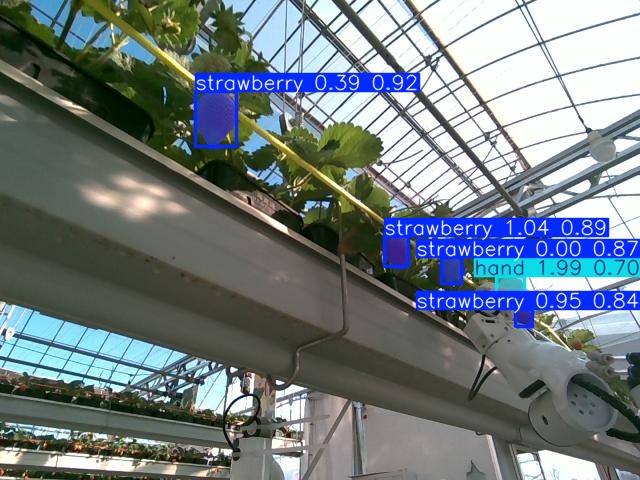
To more intuitively observe the performance of SRR-Net, the visualization results of SRR-Net, YOLOv11, and YOLOv11-seg on the FaultData dataset are presented in Fig. 10. In Fig. 10 (a) and (b), strawberries and end-effectors were represented with bounding boxes, with the target class label and confidence score displayed above each box. The confidence threshold was set to 0.5. For the same strawberry instance, SRR-Net produced higher confidence scores than YOLOv11 and YOLOv11-seg. In terms of ripeness estimation, ripeness estimation of SRR-Net closely matched the true ripeness of each strawberry. Overall, the visual comparisons illustrated that SRR-Net delivered superior performance compared with YOLOv11 and YOLOv11-seg.
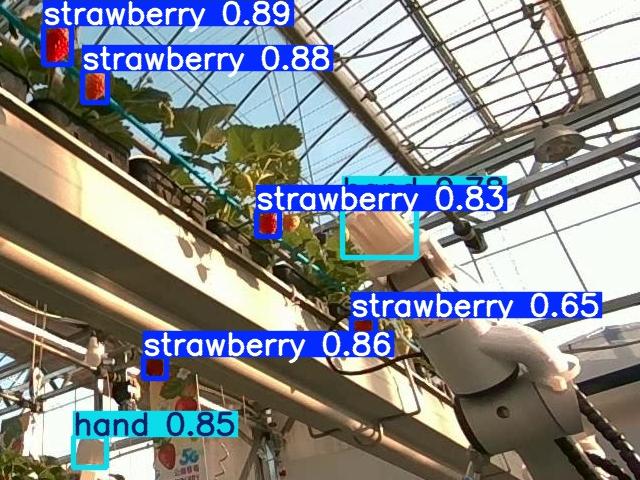
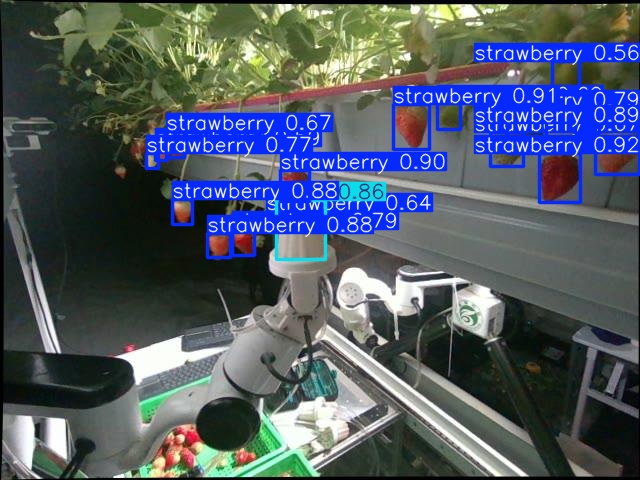
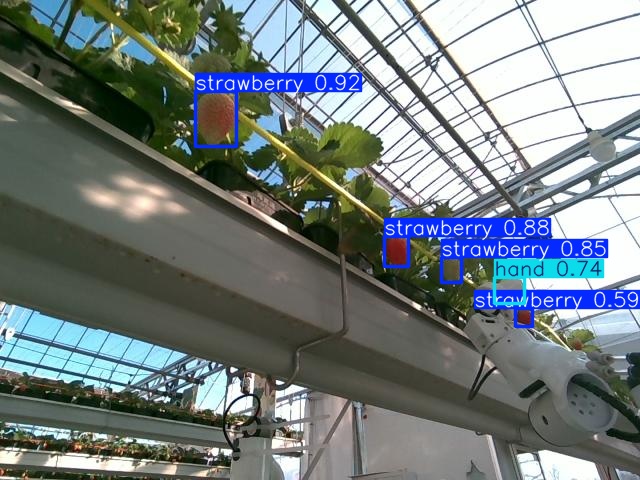
(a) YOLOv11
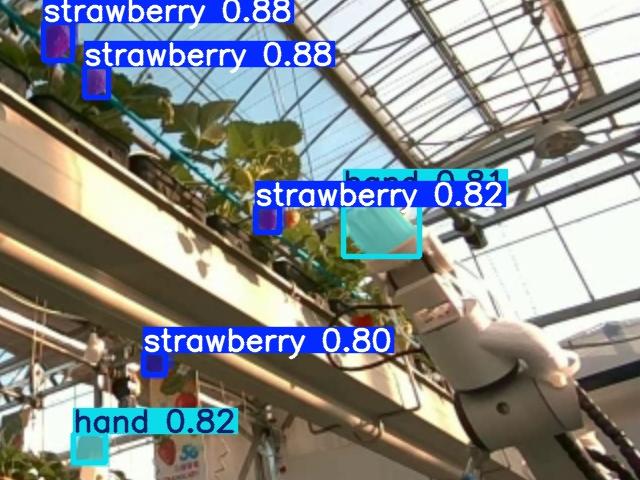
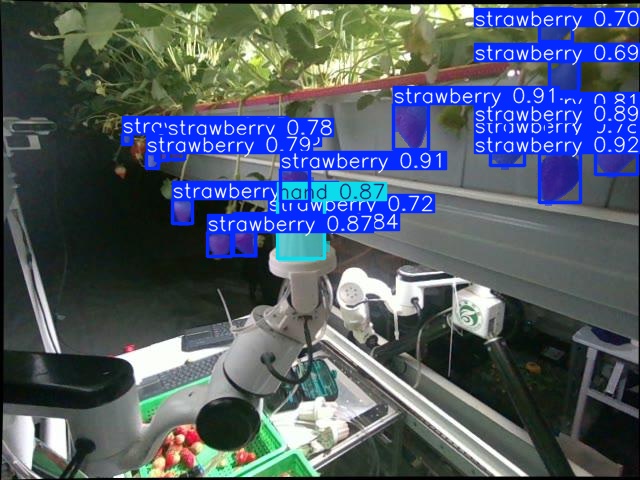
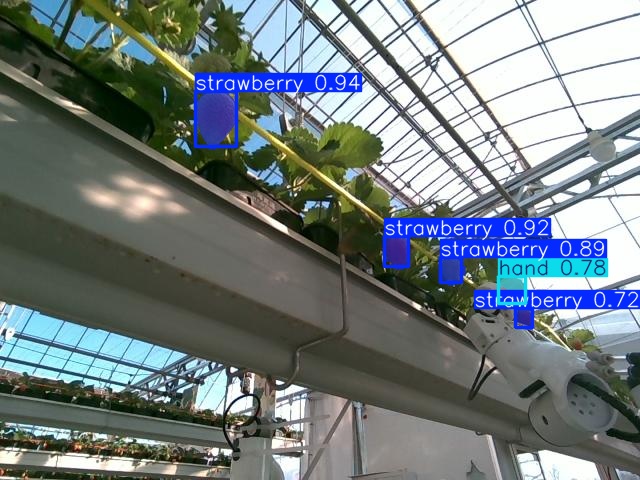
(b) YOLOv11-seg
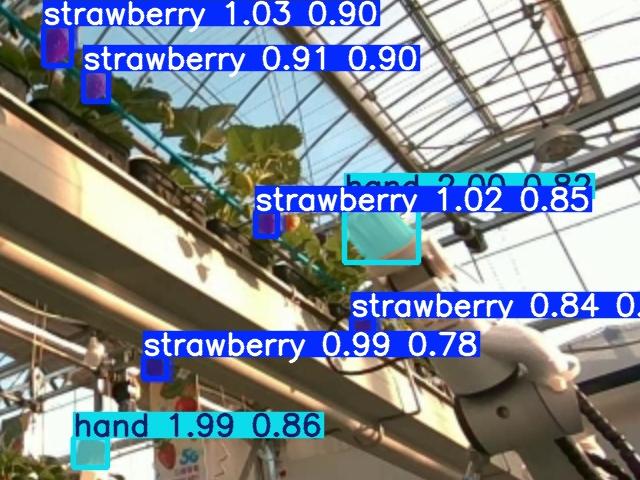
(c) SRR-Net
Evaluation of Relative Error Compensation
To validate the effectiveness of relative error compensation, the 3D coordinates of the strawberry picking point ($`x_s`$, $`y_s`$, $`z_s`$), the gripper positioned beneath the picking point ($`x_e`$, $`y_e`$, $`z_e`$), the relative error before compensation ($`\Delta x`$, $`\Delta y`$), the ground-truth error before compensation ($`\Delta x_w`$, $`\Delta y_w`$) , the compensated picking point ($`x_{ce}`$, $`y_{ce}`$, $`z_{ce}`$), and the relative error after compensation ($`E_x`$, $`E_y`$) in the robot arm coordinate system were measured in Table 2. Due to the requirement of snap-off, the rise distance in the swallowing stage exceeded the height of the strawberry. To simplify the experiments and reduce computational overhead, the relative error along the $`z`$-axis was not considered.
From Table 2, the visual and ground-truth errors before compensation were compared, and the ground-truth errors after compensation were recorded. For example, in the first row, the relative errors on the $`x`$- and $`y`$- axis were 22 mm and -4 mm, while the corresponding ground-truth errors were 17.3 mm and 4.2 mm. The absolute differences between visual and ground-truth errors were therefore 4.7 mm and 8.2 mm. After compensation, the physical errors of the $`x`$- and $`y`$- axis were reduced to 1.5 mm and 6.3 mm, both below the defined threshold.
Before compensation, the mean relative errors were 14.07 mm on the $`x`$-axis and 8.64 mm on the $`y`$-axis, while the mean physical errors were 11.52 mm and 5.15 mm, respectively—indicating that visual estimation tended to overestimate the actual physical errors. With the proposed compensation method, the mean physical error between the strawberry point and the gripper were further reduced to 3.12 mm ($`x`$-axis) and 4.11 mm ($`y`$-axis). The slightly larger residual $`y`$-axis error was likely due to the difficulty of achieving high-precision motor control over very small movement ranges. Despite this phenomenon, the relative error compensation method demonstrated a clear advantage in aligning the gripper with the target and in reducing grasping errors.
| $`x_s`$ | $`y_s`$ | $`z_s`$ | $`x_e`$ | $`y_e`$ | $`z_e`$ | $`\Delta x`$ | $`\Delta y`$ | $`\Delta x_w`$ | $`\Delta y_w`$ | $`x_{ce}`$ | $`y_{ce}`$ | $`z_{ce}`$ | $`E_x`$ | $`E_y`$ |
|---|---|---|---|---|---|---|---|---|---|---|---|---|---|---|
| 709 | 221 | 706 | 686 | 225 | 647 | 22 | -4 | 17.3 | 4.2 | 732 | 219 | 706 | 1.5 | 6.3 |
| 464 | 232 | 710 | 450 | 249 | 652 | 14 | -17 | 8.3 | -12.7 | 479 | 223 | 710 | 5.0 | -8.2 |
| 377 | 245 | 693 | 362 | 255 | 626 | 15 | -10 | 7.2 | -2.5 | 392 | 239 | 693 | 2.6 | 3.6 |
| 700 | 222 | 699 | 681 | 224 | 638 | 18 | -2 | 15.7 | 3.4 | 719 | 221 | 699 | 0 | 2.8 |
| 532 | 234 | 710 | 518 | 245 | 649 | 14 | -11 | 10.6 | -3.6 | 546 | 228 | 710 | 2.7 | -2.9 |
| 711 | 244 | 711 | 692 | 249 | 651 | 18 | -5 | 9.2 | -5.1 | 730 | 241 | 711 | 0 | 2.2 |
| 320 | 244 | 692 | 316 | 256 | 628 | 4 | -11 | 3.6 | -2.6 | 324 | 239 | 692 | 0 | 2.1 |
| 468 | 236 | 703 | 460 | 245 | 653 | 8 | -8 | 12.8 | -1.3 | - | - | - | - | - |
| 652 | 235 | 712 | 631 | 239 | 651 | 20 | -3 | 20.4 | 6.2 | 673 | 233 | 712 | -4.4 | -2 |
| 816 | 220 | 699 | 793 | 223 | 642 | 23 | -2 | 17.4 | 6.8 | 839 | 219 | 699 | -6.4 | 5.1 |
| 393 | 238 | 706 | 386 | 245 | 643 | 7 | -7 | 6.9 | 3.0 | - | - | - | - | - |
| 734 | 222 | 699 | 712 | 224 | 638 | 22 | -1 | 11.8 | 5.0 | 757 | 221 | 699 | -5.3 | 3.9 |
| 445 | 230 | 711 | 436 | 249 | 646 | 8 | -19 | 9.9 | -9.5 | 454 | 220 | 711 | -4.3 | 6.2 |
| 629 | 234 | 721 | 611 | 244 | 659 | 17 | -10 | 17.5 | -2.6 | 647 | 228 | 721 | 5.9 | 6.3 |
| 299 | 246 | 693 | 295 | 259 | 631 | 4 | -12 | 10 | -7.9 | 304 | 240 | 693 | -2.4 | 1.2 |
| 453 | 233 | 701 | 443 | 251 | 637 | 10.6 | -18.5 | 10.4 | -7.5 | 464 | 224 | 701 | 7.1 | -1.2 |
| 752 | 213 | 708 | 729 | 218 | 645 | 22 | -4 | 13.4 | 6.9 | 774 | 221 | 708 | 0 | 4.3 |
| 667 | 215 | 708 | 645 | 222 | 645 | 22 | -7 | 14.2 | 0 | 690 | 211 | 708 | -3.8 | -6.0 |
| 307 | 246 | 693 | 305 | 252 | 633 | 1.71 | -6.3 | 5.7 | 0 | - | - | - | - | - |
| 467 | 232 | 700 | 456 | 248 | 634 | 11 | -15 | 8.1 | -12.1 | 479 | 224 | 700 | -1.6 | 5.6 |
| - | - | - | - | - | - | 14.07 | 8.64 | 11.52 | 5.15 | - | - | - | 3.12 | 4.11 |
Relative errors between the end-effector and the picking point in the arm coordinate system (unit: mm). The final row showed the computed mean absolute error.
Operational Efficiency Analysis of the Early Abort Strategy
To evaluate the effectiveness of the early abort strategy, the original picking time, the minimum time at which the early abort signal was triggered, and the time reduction for each action were calculated and analyzed in Table 3. In the original process, a complete picking cycle required approximately 12 s, with the inflating and approaching, swallowing, deflating, snap-off, descending, placing and homing stages taking 2 s, 2 s, 2 s, 1 s, 2 s, 2 s, and 1 s, respectively. When the gripper approached beneath the strawberry picking point, the relative error was estimated, and if it exceeded the threshold, a compensation action was triggered to align the gripper with the strawberry, adding 1 s to the cycle, as shown in Table. 3 #Case 1.
During the deflating stage, MobileNet V3-Small was executed to monitor whether a strawberry was present in the gripper. In accordance with the time-stability rule, the system required three consecutive signals before issuing the abort command. Upon receiving the abort command, the robotic arm immediately aborted the current process and skipped the descending and homing stages. The shortest time to receive the abort signal during the deflating stage was 0.11 s, resulting in a time reduction of 1.89 s, as shown in Table. 3 #Case 2. Overall, although the compensation action slightly increased the cycle time, the continuous harvesting efficiency was significantly improved.
For the snap-off stage, the results of the LSTM classifier on the validation set of SnapData were presented in Table. [tab:lstm_train], where class 0 and class 1 represented strawberries remaining in the gripper and strawberries that had slipped, respectively. As shown in Table. [tab:lstm_train], the LSTM classifier achieved high accuracy on SnapData. For class 0, all strawberries in the gripper were correctly detected (recall = 1.0000), with a few false positives (precision = 0.9294). For class 1, all predicted slips were correct (precision = 1.0000), though a small fraction were missed (recall = 0.9118). These results indicated that the LSTM classifier provided reliable slip prediction with minimal false alarms, supporting its use in early abort strategies. Classes 0 and 1 were classified using a maximum threshold. It was noted that class 0 encompassed two strawberry states—stable and slipping—so an adaptive minimum threshold was introduced and applied to further distinguish between them.
During the snap-off stage, operations were triggered based on the strawberry status in the gripper, with the time-stability rule applied to prevent false positives. When the early abort condition was met for three consecutive checks, the descending and placing stages were skipped, and homing was executed immediately. In randomized tests, the minimum response time for receiving an abort signal was 0.7 s, reducing the overall cycle time by 0.3 s, as presented in Table. 3 #Case 3.
| Action | Original Time (s) | #Case 1 (s) | #Case 2 (s) | #Case 3 (s) |
| Relative Error Compensation | Grasping failure | Slipped | ||
| Inflation and approaching | 2 | 2 | 2 | 2 |
| Compensation | - | 1 | - | - |
| Swallowing | 2 | 2 | 2 | 2 |
| Deflating | 2 | 2 | 0.11 | 2 |
| Snap-off | 1 | 1 | - | 0.7 |
| Descending | 2 | 2 | 2 | 2 |
| Placing | 2 | 2 | - | - |
| Homing | 1 | 1 | 1 | 1 |
| Time Reduction (s) | - | -1 | 1.89 | 0.3 |
| Class | precision | recall | F1-score |
|---|---|---|---|
| 0 | 0.9294 | 1.0000 | 0.9634 |
| 1 | 1.0000 | 0.9118 | 0.9538 |
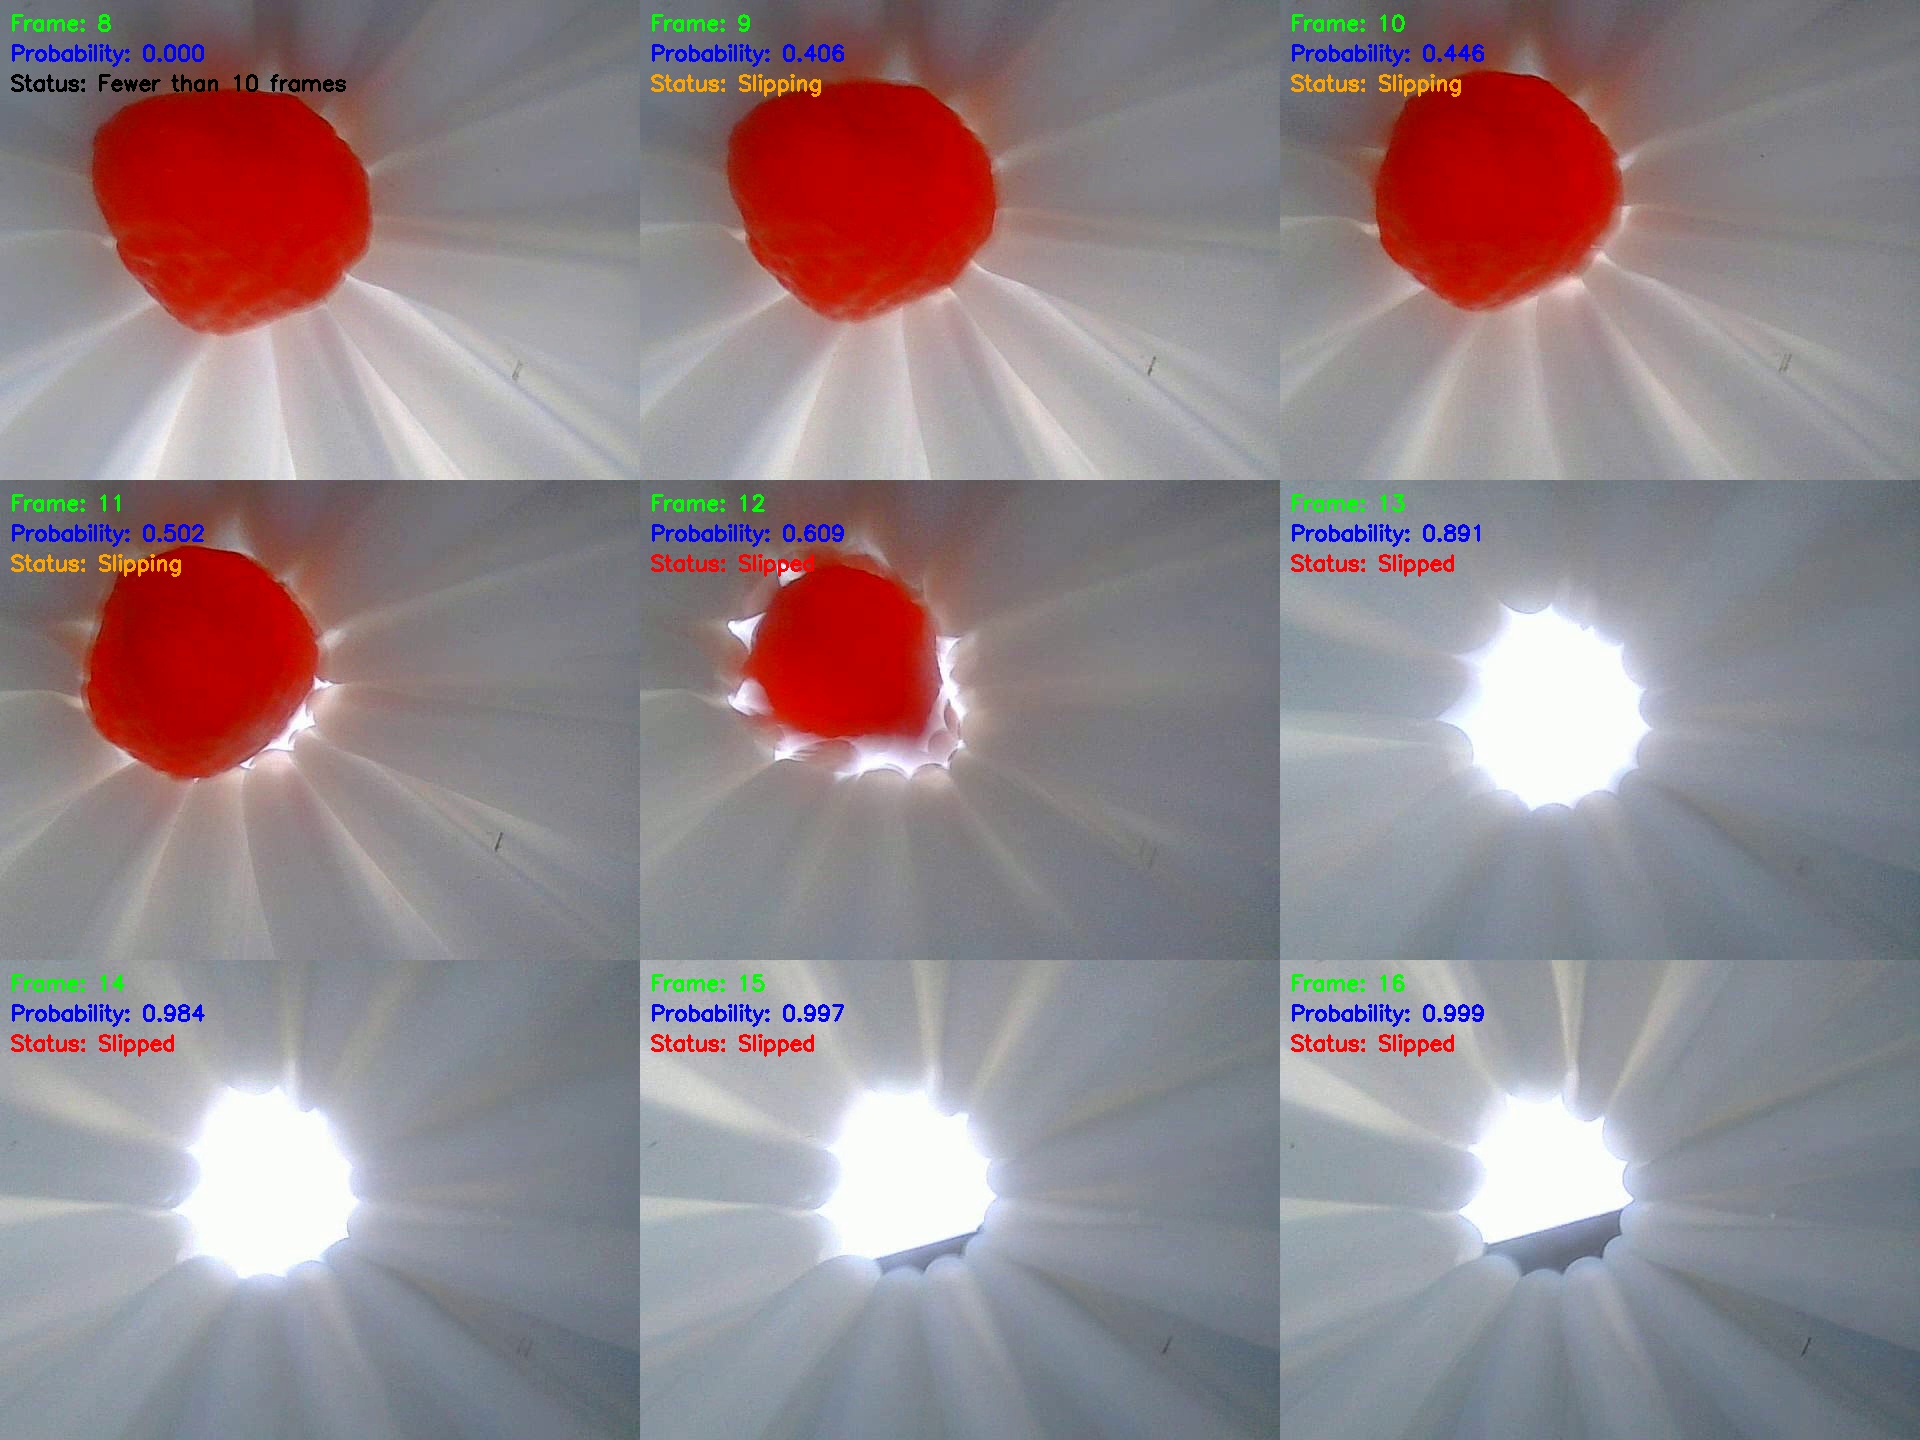
Visualization results of the LSTM classifier on the validation of SnapData were presented in Fig. 11. The left panel displays frames 8-16 with the prediction probability and corresponding strawberry statuses, while the right panel illustrated the LSTM prediction probabilities. The horizontal axis represented the frame index starting from 0, and the vertical axis indicated the predicted probability of strawberry slippage within the next three frames. The red dashed line marked the maximum threshold, while the blue curve with asterisks showed the predicted probabilities. Red five-pointed stars denoted instances where the strawberry had slipped from the end-effector. An adaptive minimum threshold, illustrated by a pink dashed line, was employed to determine whether a secondary picking attempt should be executed or the subsequent actions should continue.
If the total number of frames did not reach 10, fewer than 10 frames were displayed as labels in the top-left corner of the images. The strawberry began slipping between frames 9 and 11, with corresponding probabilities of 0.406, 0.446, and 0.502. From frame 13 onward, the strawberry was considered slipped. Similarly, a probability curve of strawberry slippage was plotted for intuitive observation, as shown in the right panel of Fig. 11.
In Fig. 11 (left), the LSTM classifier presented the predicted probability of strawberry slippage for frames 8-16. When the number of frames did not reach 10, fewer than 10 frames were displayed as labels at the top-left of the images. The strawberry was slipping from frames 9-11, with corresponding probabilities of 0.406, 0.446, and 0.502; starting from frame 13, the strawberry had slipped. Similarly, a probability curve of strawberry slippage was plotted for intuitive observation in Fig. 11 right. The five-pointed star indicates the frame where the strawberry slipped for the first time. Based on validation results on SnapData, the LSTM classifier was able to timely send early-abort signals, enabling efficient and stable operation. Tests of the early abort strategy for empty grasp in deflating and slip prediction in snap-off were conducted on HarvestFlex. However, experiments involving inflating-and-deflating to re-grasp were not performed or deployed on HarvestFlex due to limitations in the strawberry growing season.

Discussion
Vision-based fault diagnosis and self-recovery offered an effective means of enhancing the stability of strawberry-harvesting robots. During the inflating and approaching stage, the positional relationship between the gripper and the harvesting point served as a visual indicator of accumulated errors caused by fruit recognition, localization, hand–eye calibration, and inverse kinematics. Without requiring an additional camera, relative errors based on the simultaneous target-gripper detection were computed to align the strawberry with the end-effector. For early abort feedback during the deflating and snap-off stages, a micro-optical camera was embedded in the end-effector to detect and predict the probability of strawberry slippage in the gripper. This approach compensated for the absence of force feedback in the flexible pneumatic gripper, whose deformation during inflation and deflation rendered conventional force sensing impractical. However, a limitation of slip prediction–based early abort was that the material properties of artificial strawberries differed from those of real ones, particularly in weight and texture. Consequently, the secondary inflating-deflating regrasp experiment was evaluated only on the SnapData test set and was not conducted on HarvestFlex, owing to the material constraints of artificial strawberries. In this study, artificial strawberries were used primarily to evaluate relative error compensation and the early abort strategy. Mechanical failures, inverse kinematics errors, and other control-related faults were not addressed in this work. Due to the limitations of strawberry growth conditions, artificial strawberries were used in the experiments, which did not fully account for biological characteristics such as fruit damage.
Additionally, self-learning and adaptive evolutionary perception, planning and decision-making can be applied to reduce dataset dependency and improve the generalization and robustness of the strawberry-harvesting robot. With the rapid development of embodied artificial intelligence and robotic agents, a new wave of end-to-end, multi-modal, large-model-based perception, self-planning and self-decision frameworks is emerging in the robotics domain. These advances offer valuable insights for building strawberry harvesting robots and enabling collaborative operations among multiple robots. In the future, developing end-to-end active learning and continuously evolving methods is expected to become a major research trend.
Conclusion
This paper proposed a visual-based fault diagnosis and self-recovery system to address gripper offset and strawberry slippage during harvesting. An end-to-end multi-task perception network with a shared weight backbone and neck was developed to reduce computational overhead. Without the need for an additional external camera, relative error compensation method based on the simultaneous target-gripper detection was estimated, enabling compensation actions to mitigate cumulative errors. To monitor the strawberry’s status in the gripper, a miniature optical camera was embedded at its base. A MobileNet V3-Small classifier was adapted to detect strawberries within the gripper and trigger early abort signal when necessary during the deflating stage based on the GraspData. For strawberry slippage during the snap-off stage, a novel dataset, SnapData, comprising strawberry and background classes was introduced, and the perception network was extended and fine-tuned to segment strawberries, the gripper, and background. Width and height features were combined with a time-series LSTM classifier to predict strawberry slippage from the gripper, enabling early-abort picking actions and improving harvesting efficiency. Experimental results demonstrated that the perception network achieved high accuracy, with a mean absolute error of 0.035 for ripeness estimation. The compensation mechanism reduced relative errors to 3.12 mm and 4.11 mm, while the early-abort strategy shortened execution times by 1.89 s and 0.3 s during the deflating and snap-off stages, respectively. Overall, the proposed system effectively enhanced the robustness and efficiency of strawberry harvesting, providing a practical solution for reliable autonomous fruit picking.
Declarations
This work was supported by the Haidian District Bureau of Agriculture and Rural Affairs, the Beijing Academy of Agriculture and Forestry Sciences (BAAFS) Innovation Ability Project (KJCX20240321), the Outstanding Youth Foundation of BAAFS (YKPY2025007), the BAAFS Talent Recruitment Program and the National Natural Science Foundation of China (NSFC) Excellent Young Scientists Fund (overseas).
The authors declare that they have no known competing financial interests or personal relationships that could have appeared to influence the work reported in this paper.
Data will be released.
The code will be released.
Meili Sun: Methodology, Software, Validation, Writing - original draft. Chunjiang Zhao: Investigation, Funding acquisition, Writing - review editing. Lichao Yang: Data curation, Methodology, Software, Visualization. Hao Liu: Data curation, Methodology, Software. Shimin Hu: Data curation, Software, Visualization. Ya Xiong: Conceptualization, Methodology, Investigation, Funding acquisition, Writing - review editing.
📊 논문 시각자료 (Figures)