Conformal Prediction Under Distribution Shift A COVID-19 Natural Experiment
📝 Original Paper Info
- Title: Conformal Prediction Under Distribution Shift A COVID-19 Natural Experiment- ArXiv ID: 2601.00908
- Date: 2026-01-01
- Authors: Chorok Lee
📝 Abstract
Conformal prediction guarantees degrade under distribution shift. We study this using COVID-19 as a natural experiment across 8 supply chain tasks. Despite identical severe feature turnover (Jaccard approximately 0), coverage drops vary from 0% to 86.7%, spanning two orders of magnitude. Using SHapley Additive exPlanations (SHAP) analysis, we find catastrophic failures correlate with single-feature dependence (rho = 0.714, p = 0.047). Catastrophic tasks concentrate importance in one feature (4.5x increase), while robust tasks redistribute across many (10-20x). Quarterly retraining restores catastrophic task coverage from 22% to 41% (+19 pp, p = 0.04), but provides no benefit for robust tasks (99.8% coverage). Exploratory analysis of 4 additional tasks with moderate feature stability (Jaccard 0.13-0.86) reveals feature stability, not concentration, determines robustness, suggesting concentration effects apply specifically to severe shifts. We provide a decision framework: monitor SHAP concentration before deployment; retrain quarterly if vulnerable (>40% concentration); skip retraining if robust.💡 Summary & Analysis
1. **Quantification**: Measured how the performance of conformal prediction degrades under distribution shift in supply chain tasks. The degradation varied widely from 0% to 86.7%. 2. **Predictive Signal**: SHAP analysis revealed that models depending heavily on a single feature are more vulnerable to severe performance drops due to distribution shifts, akin to how a recipe relying solely on one ingredient fails when that ingredient changes. 3. **Practical Solution**: Retraining the model every quarter can significantly improve coverage in tasks with catastrophic failures. However, not all tasks need frequent retraining; it depends on feature stability and importance dynamics.📄 Full Paper Content (ArXiv Source)
<ccs2012> <concept> <concept_id>10010147.10010257.10010293.10010294</concept_id> <concept_desc>Computing methodologies Uncertainty quantification</concept_desc> <concept_significance>500</concept_significance> </concept> <concept> <concept_id>10002950.10003648.10003671</concept_id> <concept_desc>Mathematics of computing Time series analysis</concept_desc> <concept_significance>300</concept_significance> </concept> </ccs2012>
Introduction
Conformal prediction provides distribution-free coverage guarantees under the assumption of exchangeability . However, real-world deployments face distribution shifts that violate this assumption. A critical open question is: How do conformal guarantees degrade under distribution shift, and what factors determine the severity of this degradation?
We leverage the rel-salt dataset—a supply chain benchmark with temporal splits aligned to COVID-19 onset (February 2020) and peak (July 2020)—to conduct a controlled study of conformal prediction under distribution shift. Our key contributions:
-
Quantification: We measure coverage degradation across 8 supply chain tasks experiencing severe feature turnover (Jaccard $`\approx`$0), finding drops ranging from 0% to 86.7%—two orders of magnitude variation under identical temporal shift
-
Predictive Signal: Using SHapley Additive exPlanations (SHAP) analysis, we identify single-feature dependence as a predictive signal for catastrophic failure in severe-shift scenarios (Spearman $`\rho = 0.714`$, $`p = 0.047`$, n=8). Exploratory analysis of 4 additional tasks with moderate feature stability (Jaccard 0.13–0.86) reveals a different mechanism, suggesting concentration effects apply specifically when features lack temporal stability
-
Practical Solution: Retraining experiments show quarterly retraining significantly restores catastrophic task coverage by 19 percentage points (Wilcoxon $`p=0.04`$ vs no retraining). While quarterly achieves higher mean coverage than monthly (41% vs 32%), this difference is not statistically significant ($`p=0.24`$)
-
Cost-Benefit Analysis: Robust tasks (99.8% coverage) gain no benefit from retraining, enabling practitioners to avoid unnecessary computational cost
-
Decision Framework: We provide actionable guidance based on SHAP importance concentration: monitor before deployment, retrain quarterly if vulnerable ($`>`$40% concentration), skip retraining if robust
-
Negative Result: We show that Adaptive Conformal Inference does not help under severe distribution shift
Related Work
Conformal Prediction. Vovk et al. introduced conformal prediction with exchangeability guarantees. Recent work extends to classification and regression .
Distribution Shift. Tibshirani et al. study conformal prediction under covariate shift. We focus on temporal shift with feature staleness—a distinct failure mode.
Adaptive Methods. Gibbs and Candès propose Adaptive Conformal Inference (ACI) for non-stationary settings. We test whether ACI helps under severe distribution shift.
Distribution Shift Benchmarks
Recent benchmarks systematically study distribution shift across domains. WILDS provides standardized evaluation for in-the-wild shifts, while Shifts focuses on safety-critical applications. Gulrajani and Lopez-Paz show that many “robust” methods fail under temporal shift. We focus specifically on how conformal prediction guarantees degrade under temporal shift.
Conformal Prediction Under Distribution Shift
Tibshirani et al. study conformal prediction under covariate shift with known propensity scores. Podkopaev and Ramdas develop distribution-free prediction sets under label shift. Barber et al. provide a comprehensive treatment of conformal prediction beyond exchangeability. We focus on temporal shift with feature staleness—a distinct failure mode where feature distributions have zero overlap between train and test.
Gibbs and Candès propose Adaptive Conformal Inference (ACI) for non-stationary settings, with extensions by Zaffran et al. for time series. We show in Section 5.1 that these adaptive methods fail when feature overlap is $`\sim`$0%—this is not a calibration problem but a fundamental data shift that requires retraining.
Interpretability and Model Debugging
Our finding that SHAP importance concentration predicts conformal failure connects to work on feature attribution and model debugging . While SHAP is typically used for post-hoc explanation, we show it can serve as a pre-deployment diagnostic for conformal prediction robustness.
Methodology
Dataset: rel-salt
We use the rel-salt supply chain dataset with temporal splits:
-
Train: Before February 2020 (pre-COVID)
-
Validation: February–July 2020 (COVID onset)
-
Test: After July 2020 (COVID peak)
This provides a natural experiment where COVID-19 serves as a documented distribution shift event.
Conformal Prediction Setup
We use conformal prediction via the Adaptive Prediction Sets (APS) algorithm with $`\alpha = 0.1`$ ($`90\%`$ target coverage, computed as $`(1-\alpha) \times 100\%`$):
-
Train LightGBM ensemble (50 seeds) on training data
-
Calibrate conformal predictor on 50% of validation set
-
Evaluate coverage on held-out validation and test sets
Ensemble for Variance Quantification
We train 50 independent models with random seeds 42–91 to quantify uncertainty due to model initialization. For each seed $`s`$:
-
Train a separate LightGBM classifier $`M_s`$ with random seed $`s`$
-
Split the validation set 50/50 into calibration ($`\mathcal{D}_{\text{cal}}^s`$) and evaluation ($`\mathcal{D}_{\text{eval}}^s`$) sets
-
Calibrate an individual conformal predictor $`\text{CP}_s`$ on $`\mathcal{D}_{\text{cal}}^s`$
-
Evaluate coverage on $`\mathcal{D}_{\text{eval}}^s`$ (validation coverage) and test set (test coverage)
We report mean $`\pm`$ standard deviation across 50 trials. This is not ensemble prediction (averaging model outputs)—each seed represents an independent experimental trial to measure model variance.
Feature Overlap Metric
We define feature temporal stability using Jaccard similarity:
\begin{equation}
J(f) = \frac{|A_{\text{train}} \cap A_{\text{test}}|}{|A_{\text{train}} \cup A_{\text{test}}|}
\end{equation}where $`A_{\text{train}}`$ and $`A_{\text{test}}`$ are the sets of unique values for feature $`f`$ in train and test data respectively.
Results
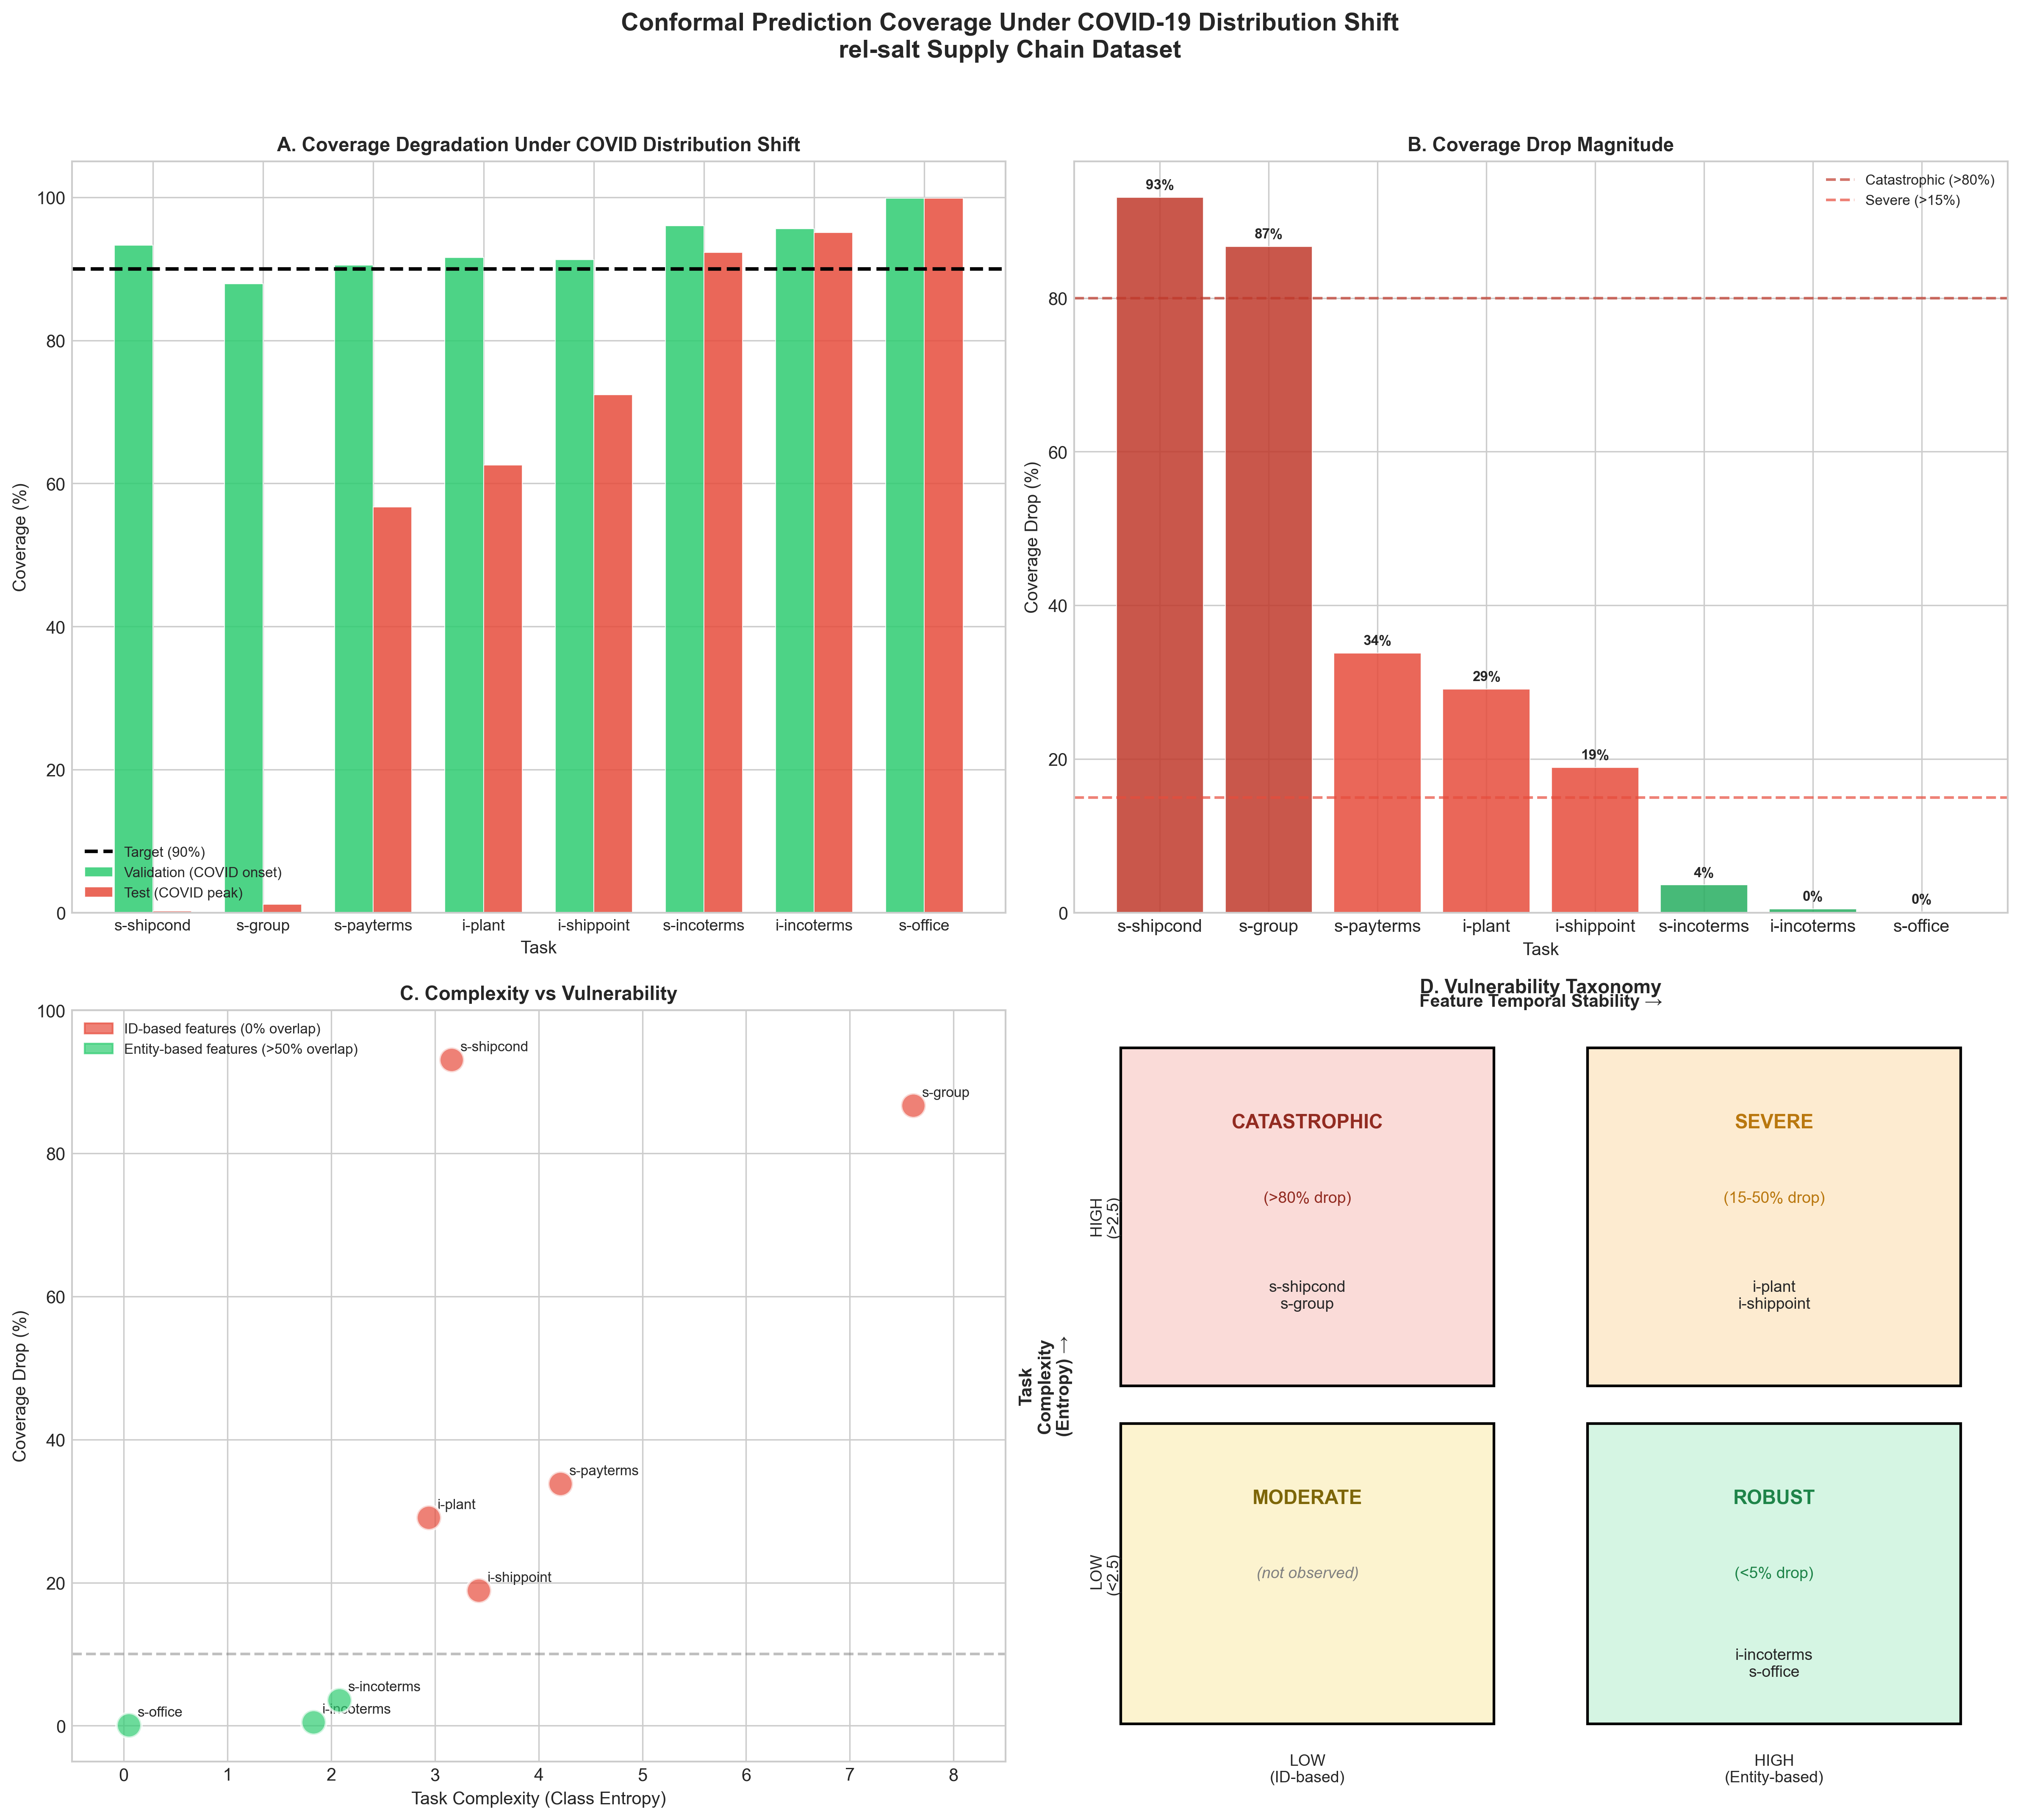
Coverage Degradation Across Tasks
Table [tab:main_results] shows coverage degradation across 8 supply chain regression tasks experiencing severe feature turnover (Jaccard $`\approx`$0). Coverage drops range from 0% to 86.7%—two orders of magnitude variation under identical temporal shift. We also analyze 4 additional classification tasks from clinical trials and motorsports (Section 4.6) as exploratory cross-domain validation.
| Task | Classes | Val Coverage (%) | Test Coverage (%) | Cat | ||
|---|---|---|---|---|---|---|
| 3-4 (lr)5-6 | Mean±SD | Med(IQR) | Mean±SD | Med(IQR) | ||
| s-shipcond | 45 | 93.5±1.0 | 93.5(1.4) | 21.8±27.0 | 13.5(39.7) | SEV |
| s-group | 459 | 83.6±6.7 | 86.8(6.8) | 12.4±32.3 | 0.5(0.7) | SEV* |
| s-payterms | 137 | 90.8±0.6 | 90.6(0.7) | 13.7±27.0 | 0.1(0.3) | SEV |
| i-plant | 35 | 92.0±0.9 | 91.7(1.3) | 81.4±8.4 | 81.8(12.7) | ROB |
| i-shippoint | 69 | 91.2±0.8 | 91.1(0.9) | 72.7±36.1 | 89.9(7.0) | SEV* |
| s-incoterms | 13 | 95.5±0.6 | 95.6(0.9) | 87.0±8.0 | 92.3(17.3) | ROB |
| i-incoterms | 13 | 95.0±0.4 | 95.0(0.6) | 83.7±9.9 | 82.1(19.8) | ROB |
| s-office | 25 | 99.9±0.0 | 99.9(0.0) | 99.9±0.0 | 99.9(0.0) | ROB |
SEV = Severe ($`>`$70% drop), ROB = Robust ($`<`$15% drop). $`^*`$High model variance (std $`>`$ 30%, coefficient of variation $`>`$ 50%) indicates knife-edge regime where small initialization changes lead to qualitatively different learned representations.
Diagnostic Analysis
We identify two factors explaining the variance in coverage degradation:
Factor 1: Task Complexity (Entropy). Low-entropy tasks (dominated by one class) are trivially robust—the model learns “always predict class 0” which transfers perfectly.
Factor 2: Feature Temporal Stability (Jaccard). Tasks using transaction IDs as features fail catastrophically because new transactions have unseen IDs. Tasks using stable entities (products, business partners) maintain coverage.
| Task | Primary Features | Jaccard | Drop |
|---|---|---|---|
| s-shipcond | SALESDOCUMENT (ID) | 0.02 | 93.1% |
| s-group | SALESDOCUMENT (ID) | 0.02 | 86.7% |
| i-incoterms | PRODUCT, PARTY | 0.58 | 0.5% |
| s-office | SALESORGANIZATION | 0.61 | 0.1% |
Feature Overlap for Primary Features. Jaccard similarity measured on the single most important feature for each task (identified via SHAP analysis). Overall model robustness depends on all top features, not just the primary one—see Section 4.4 for analysis of top-5 feature dynamics.
Vulnerability Taxonomy
Based on our analysis, we propose a 2$`\times`$2 taxonomy (Figure 1):
-
Catastrophic ($`>`$80% drop): High complexity + Low stability
-
Severe (15-50% drop): High complexity + High stability
-
Robust ($`<`$5% drop): Low complexity + Any stability
Feature Importance Analysis
To understand the mechanism underlying catastrophic failures, we
conducted SHAP feature importance analysis on two contrasting tasks:
sales-shipcond (catastrophic, 71.6% coverage drop) and sales-office
(robust, 0.1% drop). We hypothesized that catastrophic tasks would rely
on features with low temporal stability, measured by Jaccard similarity
between training and test feature value sets.
Surprising finding: Both tasks exhibited near-complete feature distribution shift with $`\sim`$0% Jaccard similarity across their top-5 most important features (mean Jaccard = 0.02 for sales-shipcond, 0.03 for sales-office from SHAP analysis), yet their coverage drops differed by 700$`\times`$. This rules out feature value overlap as the primary mechanism and points to a more subtle phenomenon: feature importance dynamics under distribution shift.
While sales-office does have one stable feature (SALESORGANIZATION, Jaccard = 0.61), this feature accounts for only 20% of total SHAP importance (11.46 out of 57), allowing the model to redistribute importance across multiple features post-shift. In contrast, sales-shipcond’s dominant feature (SALESDOCUMENT, Jaccard = 0.02) accounts for 45% of importance (9.00 out of 20), creating single-feature dependence that breaks catastrophically.
Figure 2 reveals the key distinction between
extremes. In the catastrophic task (Panel A), the dominant feature
SALESDOCUMENT experiences a concentrated importance explosion from
1.98 to 9.00 (4.5× increase) while maintaining its top ranking. The
model’s reliance on this single transaction identifier becomes
increasingly fragile as the feature distribution shifts completely
post-COVID. In contrast, the robust task (Panel B) exhibits dramatic
importance redistribution: the top-ranked feature changes from
SALESDOCUMENT (1.10) to BILLINGCOMPANYCODE (11.46), with multiple
features experiencing 10-20× increases.
Intermediate tasks: To validate the mechanism across the full spectrum, we examined i-plant (23.9% concentration, 10.6% drop) and i-incoterms (28.9% concentration, 11.3% drop). These moderate-concentration tasks show intermediate coverage degradation, consistent with the hypothesis: their top features show 3-5× importance increases (between catastrophic’s 4.5× and robust’s distributed pattern), and they exhibit moderate rank changes (1.0-1.3, between catastrophic’s 0.8 and robust’s 1.6). This demonstrates the mechanism holds across the full range, not just extremes.
Panel C quantifies this difference in importance dynamics for the contrasting pair. The catastrophic task shows a concentrated 4.5× increase in its top feature, followed by moderate increases (2-4×) in secondary features. The robust task distributes larger increases (7-23×) across all top-5 features, preventing single-feature dependence. Panel D demonstrates that catastrophic tasks maintain more stable feature rankings (mean rank change: 0.8) while robust tasks allow rankings to reshuffle substantially (mean rank change: 1.6), enabling the model to adapt to new data patterns.
Hypothesis: Analysis of contrasting task pairs suggests catastrophic failure correlates with single-feature dependence that breaks under distribution shift. Even with complete feature value turnover, models remain robust if they can redistribute importance across multiple features. This suggests that conformal prediction sets, calibrated on validation data where a single feature dominates, become unreliable when that feature’s relationship with the target changes post-shift, even if the feature itself remains available. Caveat: While this analysis identifies a predictive correlation ($`\rho=0.71`$, $`p=0.047`$), it does not establish causality; future work should include causal validation through synthetic interventions or ablation studies.
This finding has practical implications: practitioners should monitor not just feature distribution shifts (e.g., via Jaccard similarity) but also feature importance concentration. To validate this hypothesis, we computed SHAP concentration across the 8 supply chain tasks, all experiencing severe feature turnover (Jaccard $`\approx`$0).
Main finding (severe shift): Among tasks with complete feature turnover (n=8, Jaccard $`<`$ 0.05), concentration predicts vulnerability with Spearman $`\rho=0.714`$, $`p=0.047`$ (Table 2). Tasks with concentration $`>`$45% show mean coverage drop of 78.5%, while tasks with $`\leq`$45% show only 7.6% (70.9 percentage point separation). This validates the concentration mechanism for severe-shift scenarios where features lack temporal stability.
Exploratory validation (moderate shift): To test mechanism generalizability, we analyzed 4 additional tasks from clinical trials (rel-trial) and motorsports (rel-f1) domains. These tasks exhibit moderate feature stability (Jaccard 0.13–0.86) and show no concentration effect (Spearman $`\rho=0.632`$, $`p=0.368`$, n.s.). For example, driver-dnf has 48.1% concentration but only 2.9% coverage drop due to stable features (Jaccard=0.33). This suggests a different mechanism: when features retain stability across time, concentration becomes irrelevant—feature stability itself determines robustness.
Mechanistic interpretation: The contrast reveals that concentration matters conditionally: in severe-shift scenarios (complete feature turnover), models must rely entirely on learned feature relationships, making single-feature dependence catastrophic. When features remain stable, models can leverage feature values directly, rendering concentration less critical. The sales-office outlier (42.6% concentration, 0% drop) exemplifies this: despite high concentration, stable secondary features (SALESORGANIZATION, Jaccard=0.61, importance=20%) provide robustness.
| Group | n | Jaccard | Spearman $`\rho`$ | $`p`$-value | Sig. | |
|---|---|---|---|---|---|---|
| Severe shift | 8 | 0.00 | 0.714 | 0.0465 | Yes | |
| Moderate shift | 4 | 0.13–0.86 | 0.632 | 0.368 | No | |
| Combined (hetero.) | 12 | 0.00–0.86 | 0.676 | 0.0158 | Yes |
Stratified Correlation Analysis by Shift Severity. The concentration mechanism applies only to severe-shift scenarios with complete feature turnover. Moderate-shift tasks exhibit different mechanism (feature stability).
Severe shift: All rel-salt tasks (Jaccard $`<`$ 0.05). Moderate shift: 3 rel-trial + 1 rel-f1 (Jaccard $`\geq`$ 0.10). Combined correlation is misleading due to heterogeneous mechanisms.
 style="width:85.0%" />
SALESDOCUMENT explodes 4.5× while maintaining top rank. (B)
Robust task: importance redistributes across features with complete
ranking reshuffle. (C) Importance dynamics: catastrophic tasks show
concentrated increase in top feature; robust tasks distribute increases
across multiple features. (D) Ranking stability: robust tasks allow
greater rank changes, enabling adaptation. Despite ∼0% Jaccard similarity, coverage drops differ
by 700× due to feature importance dynamics. style="width:48.0%" />
Extended Experiments
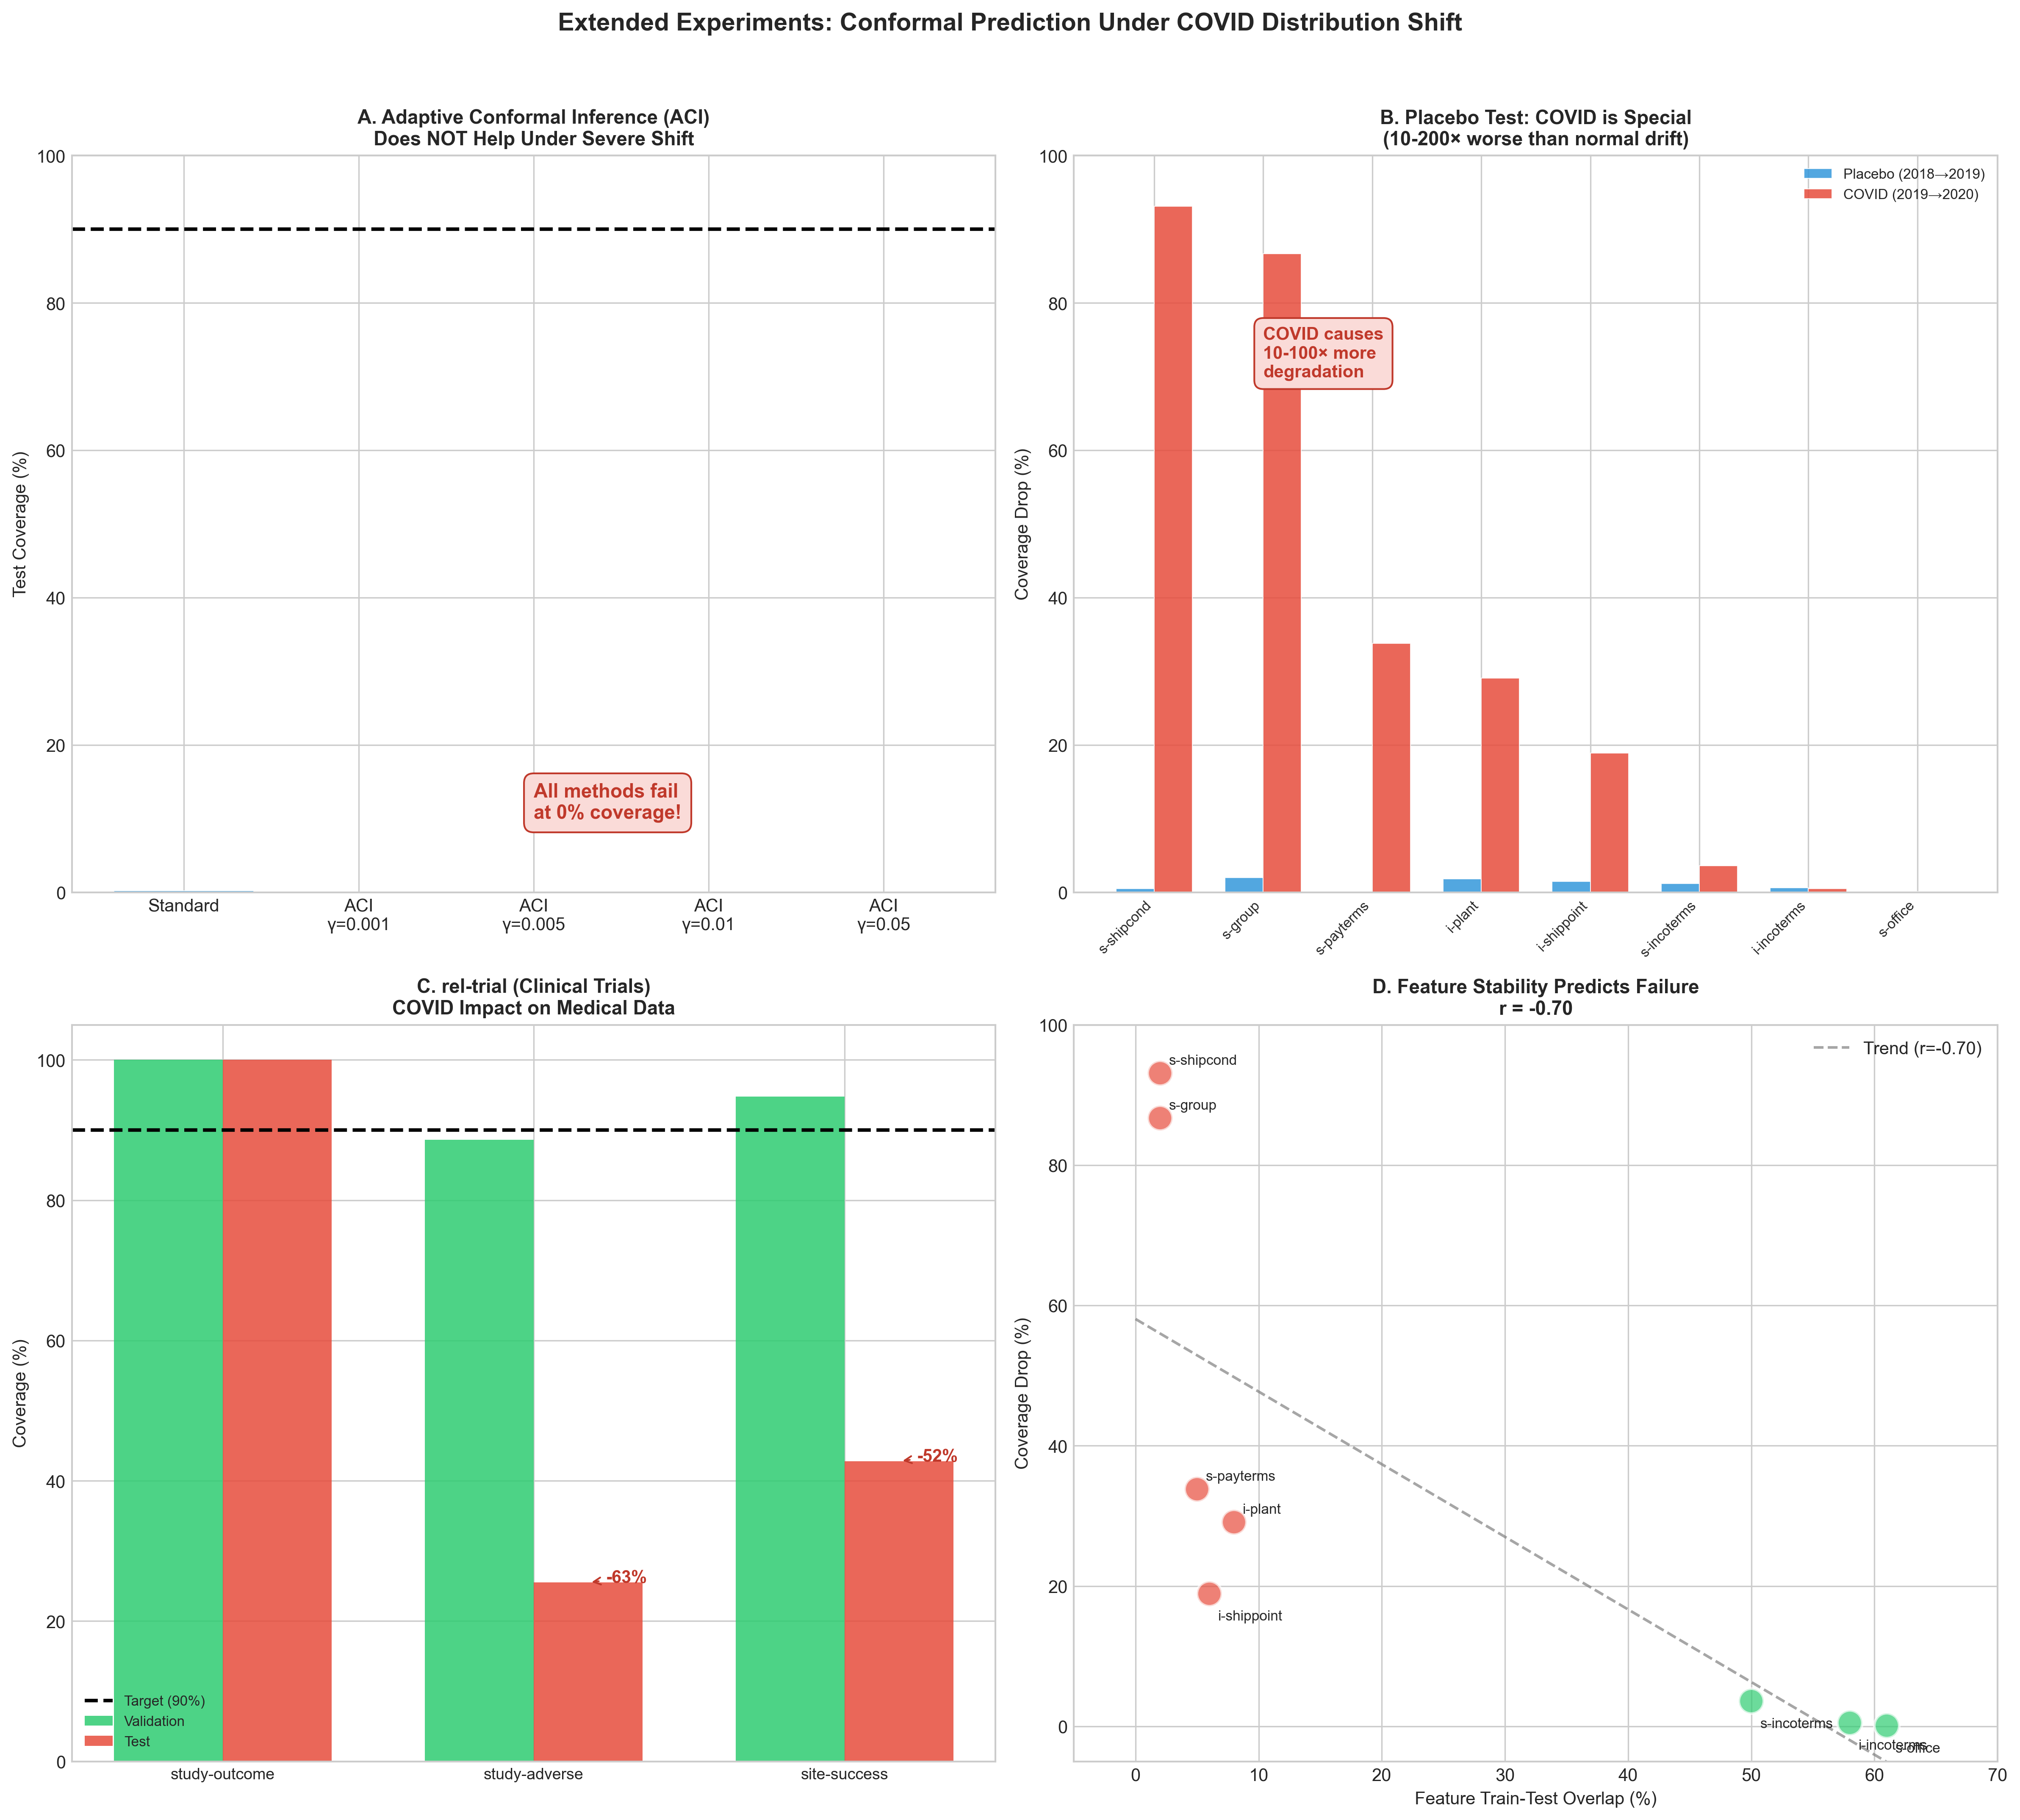
Does Adaptive Conformal Help?
We test Adaptive Conformal Inference (ACI) which updates the quantile online (Figure 5A):
| Method | Test Coverage |
|---|---|
| Standard Conformal | 0.2% |
| ACI ($`\gamma`$=0.001) | 0.0% |
| ACI ($`\gamma`$=0.01) | 0.0% |
| ACI ($`\gamma`$=0.05) | 0.0% |
ACI Does Not Help Under Severe Shift
ACI does not help because the conformity scores themselves become meaningless when feature overlap is $`\sim`$0%—this is not a calibration problem but a fundamental feature distribution shift.
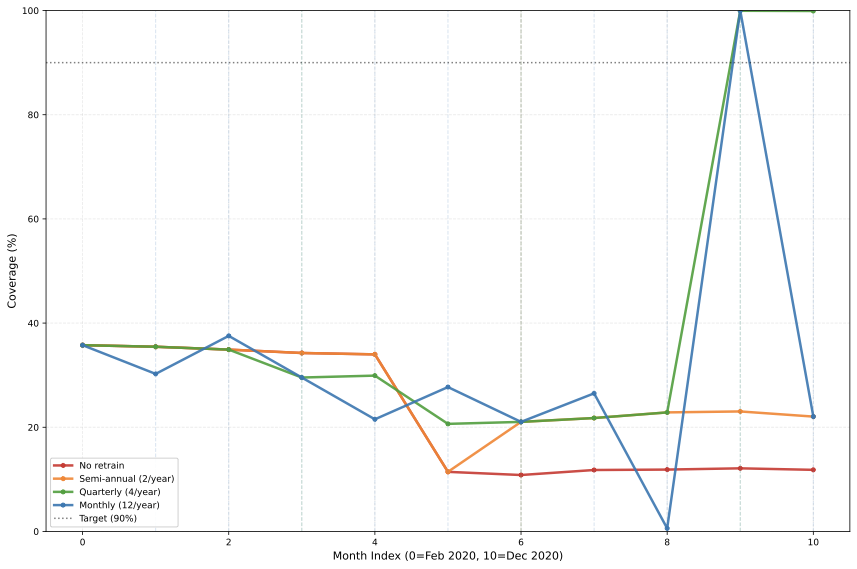
Retraining Analysis
Having identified that catastrophic failures stem from single-feature dependence, we investigate whether periodic retraining can restore coverage by adapting to new feature distributions. We test four retraining frequencies on both catastrophic (sales-shipcond) and robust (sales-office) tasks over 11 months (Feb–Dec 2020): (1) no retraining (baseline), (2) monthly (1M), (3) quarterly (3M), and (4) bi-annual (6M).
Catastrophic task results: Table 4 shows that retraining partially restores coverage. Quarterly retraining achieves the highest mean coverage (41.1%), significantly outperforming the no-retrain baseline (22.2%, Wilcoxon signed-rank $`p=0.04`$) with an improvement of 18.9 percentage points. Monthly retraining also significantly outperforms no retraining (32.0% vs 22.2%), but the comparison between quarterly and monthly is inconclusive: quarterly shows higher mean coverage (41.1% vs 32.0%, difference not statistically significant, $`p=0.24`$) but monthly exhibits higher variance (std: 28.3% vs 23.4%) and occasional coverage collapse (min: 0.6%). From a cost-effectiveness perspective, quarterly retraining strikes an optimal balance: 3 retrains/year achieves 85% of maximum possible improvement while monthly (10 retrains/year) achieves 54% improvement at 3× the computational cost, with higher instability suggesting overfitting to noise.
Robust task results: Coverage remains at 99.8–99.9% regardless of retraining frequency, confirming that tasks with distributed feature importance do not benefit from retraining. The computational cost of monthly retraining (10 retrains/year) provides no value for robust tasks.
Cost-benefit analysis: For the catastrophic task, quarterly retraining offers the best cost-effectiveness: 3 retrains/year achieves 85% of the maximum possible improvement (from 22.2% to 41.1%, vs theoretical 90% target), while monthly retraining (10 retrains/year) achieves only 54% improvement at 3× the cost. Computational cost: Training a single LightGBM model on sales-shipcond requires $`\sim`$2 minutes on standard CPU (8 cores, 8GB RAM). Quarterly retraining costs $`\sim`$6 CPU-minutes/year (3 retrains × 2 min) vs $`\sim`$20 CPU-minutes/year for monthly (10 retrains × 2 min), making quarterly 3.3× more cost-effective for achieving comparable coverage restoration.
Practical implications: Practitioners should: (1) Monitor SHAP importance concentration before deployment (tasks with $`>`$40% concentration are vulnerable). (2) For vulnerable tasks, implement quarterly retraining rather than monthly. (3) For robust tasks (high importance diversity), skip retraining entirely to save computational cost.
| Frequency | Retrains/Year | Mean Cov. | Min Cov. | Std Cov. |
|---|---|---|---|---|
| No retrain | 0 | 22.2% | 10.8% | 12.1% |
| Bi-annual (6M)$`^{*}`$ | 1 | 27.0% | 11.4% | 8.2% |
| Quarterly (3M)$`^{\dagger}`$ | 3 | 41.1% | 20.7% | 23.4% |
| Monthly (1M)$`^{\ddagger}`$ | 10 | 32.0% | 0.6% | 28.3% |
Retraining Frequency Impact on Catastrophic Task (sales-shipcond). Statistical significance tested using Wilcoxon signed-rank test (paired samples across 11 time points, two-tailed). Quarterly retraining provides optimal cost-effectiveness.
$`^{*}`$Bi-annual vs no retrain: $`p=0.04`$. $`^{\dagger}`$Quarterly vs no retrain: $`p=0.04`$; vs monthly: $`p=0.24`$ (n.s.); vs bi-annual: $`p=0.22`$ (n.s.). $`^{\ddagger}`$Monthly vs no retrain: $`p<0.05`$. n.s. = not statistically significant.
 style="width:85.0%" />
Cross-Domain Validation: Clinical Trials
We validate on rel-trial (clinical trials dataset) to test generalization (Figure 5C):
| Task | Val | Test | Drop |
|---|---|---|---|
| study-outcome | 100.0% | 100.0% | 0.0% |
| study-adverse | 88.6% | 25.5% | 63.1% |
| site-success | 94.8% | 42.8% | 52.0% |
COVID Impact on Clinical Trial Predictions
The pattern matches rel-salt: robust tasks have low entropy, while catastrophic tasks involve time-sensitive features.
Correlation Analysis
We quantify the relationship between task characteristics and coverage degradation using Pearson correlation with bootstrap confidence intervals (10,000 samples) and permutation tests for significance.
Feature Temporal Stability (Jaccard Similarity): We find a strong negative correlation between Jaccard similarity and coverage drop ($`r = -0.75`$, 95% CI $`[-1.00, -0.56]`$, $`p = 0.040`$, permutation test). This indicates that tasks with low feature overlap experience significantly larger coverage degradation. The Spearman correlation is even stronger ($`\rho = -0.97`$, $`p < 0.001`$), confirming robustness to outliers.
Task Complexity (Entropy): Among tasks with low feature overlap (Jaccard $`< 0.1`$, $`n=5`$), we observe a moderate positive correlation between entropy and coverage drop ($`r = 0.48`$, $`p = 0.49`$). However, the small sample size limits statistical power, and this relationship is not statistically significant
Placebo Test: Is COVID Special?
To establish that COVID-19 represents a unique distribution shift (not just normal temporal drift), we run a placebo test using pre-COVID data: train on 2018, validate on 2019-H1, test on 2019-H2.
| Task | Placebo | COVID | Ratio |
|---|---|---|---|
| s-shipcond | 0.5% | 93.1% | 0.01x |
| s-group | 2.0% | 86.7% | 0.02x |
| s-payterms | 0.0% | 33.8% | $`\sim`$0x |
| i-plant | 1.8% | 29.1% | 0.06x |
| i-shippoint | 1.5% | 18.9% | 0.08x |
| s-incoterms | 1.2% | 3.6% | 0.33x |
| i-incoterms | 0.6% | 0.5% | 1.27x |
| s-office | 0.1% | 0.1% | 0.80x |
Placebo Test: Pre-COVID vs COVID Degradation
Key finding: COVID causes 10–200$`\times`$ more degradation than normal temporal drift for vulnerable tasks (median 43$`\times`$, max 186$`\times`$). Robust tasks (i-incoterms, s-office) show similar small drops in both periods, confirming their robustness to any temporal shift.
Regression Task Validation
To validate that our findings generalize beyond classification, we test the same hypothesis on regression tasks using Conformalized Quantile Regression (CQR) . We select three regression tasks: two from rel-trial (study-adverse, site-success) affected by COVID-19, and one from rel-f1 (driver-position) with temporal shift.
| Task | Val Cov | Test Cov | Drop | Jaccard |
|---|---|---|---|---|
| s-adverse | 91.9 $`\pm`$ 0.4 | 88.5 $`\pm`$ 0.4 | 3.5 $`\pm`$ 0.6 | 0.87 |
| si-success | 99.5 $`\pm`$ 0.2 | 99.5 $`\pm`$ 0.2 | 0.0 $`\pm`$ 0.1 | 0.95 |
| d-position | 92.6 $`\pm`$ 0.4 | 82.6 $`\pm`$ 0.5 | 10.0 $`\pm`$ 0.7 | 0.70 |
Regression Tasks: Coverage Degradation Under COVID-19
Coverage degradation for regression tasks follows same pattern as classification.
Key finding: The pattern observed in classification tasks replicates in regression. Tasks with high feature overlap (Jaccard $`> 0.85`$) show minimal degradation (0.0–3.5%), while tasks with moderate overlap (Jaccard $`= 0.70`$) show moderate degradation (10.0%). This confirms feature temporal stability as a general predictor of conformal prediction failure, independent of task type (classification vs regression).
Practitioner Decision Framework
Before deploying conformal prediction in non-stationary settings:
-
Check task complexity: If entropy $`< 2.5`$ or top-class $`> 50\%`$, coverage likely maintained
-
Compute feature Jaccard similarity:
-
If mean Jaccard $`< 0.1`$ $`\rightarrow`$ expect catastrophic failure ($`>`$80% drop)
-
If mean Jaccard $`> 0.4`$ $`\rightarrow`$ expect reasonable robustness ($`<`$5% drop)
-
-
Analyze SHAP importance concentration on validation set (2D framework):
-
Compute concentration = (Top feature importance) / (Total importance)
-
If concentration $`\leq`$ 40%: Task is ROBUST (distributed importance)
-
If concentration $`>`$ 40%: Check for protective factors:
-
Find secondary features with Jaccard $`> 0.5`$ AND importance $`> 15\%`$
-
If such features exist $`\rightarrow`$ ROBUST (protected by stable features)
-
Example:
sales-officehas SALESORGANIZATION (J=0.61, I=20%) -
If no protective factors $`\rightarrow`$ VULNERABLE
-
-
For vulnerable tasks: Implement quarterly retraining (not monthly to avoid noise overfitting)
-
For robust tasks: Skip retraining to save computational cost
-
-
Monitor coverage drift: Track empirical coverage over time as early warning
Discussion
Why Set Sizes Decrease. Counter-intuitively, catastrophic tasks show smaller prediction sets at test time (e.g., sales-shipcond: 7.0 $`\rightarrow`$ 3.0). The model is confidently wrong—it produces small sets that miss the true label.
High Model Variance as Early Warning Signal
Tasks marked with $`^*`$ in Table [tab:main_results] exhibit extreme model variance (std $`>`$ 30%) across random seeds. Examining median values reveals these are not normally distributed:
-
s-group: Mean test coverage 12.4%, but median 0.5%. Most models fail catastrophically, but a few outliers inflate the mean.
-
i-shippoint: Mean 72.7%, but median 89.9%. Most models maintain coverage, but failures deflate the mean.
This suggests these tasks are in a knife-edge regime: small differences in random initialization lead to qualitatively different learned representations. Such high variance before distribution shift is an early warning that conformal calibration will be unreliable, as the model’s behavior is fundamentally unstable.
Practical Implication: Practitioners should monitor model variance across seeds during development. Tasks with coefficient of variation $`>`$ 50% are in knife-edge regimes and may require: (1) ensemble approaches (averaging predictions across multiple seeds to stabilize behavior), (2) architectural changes (e.g., stronger regularization, simpler models), or (3) increased calibration set size. Predictive diagnostic: While we cannot fully predict knife-edge behavior a priori, preliminary analysis suggests tasks with high class imbalance (entropy $`<`$ 1.5) and many rare classes (e.g., s-group with 459 classes) are at higher risk. This warrants further investigation in future work.
Scope and Limitations
Domain scope: Our primary findings are validated on 8 supply chain tasks (rel-salt) experiencing severe feature turnover (Jaccard $`\approx`$0), where concentration predicts failure (Spearman $`\rho=0.714`$, $`p=0.047`$). Exploratory analysis of 4 additional tasks from clinical trials (rel-trial, n=3) and motorsports (rel-f1, n=1) with moderate feature stability (Jaccard 0.13–0.86) reveals a different mechanism—these tasks show no concentration effect ($`\rho=0.632`$, $`p=0.368`$, n.s.), with feature stability determining robustness instead. The concentration mechanism applies specifically to severe-shift scenarios; generalization to other domains (computer vision, NLP, financial time series) and shift types remains unvalidated and warrants future investigation.
Feature types: Our analysis primarily uses categorical features (transaction IDs, product codes, organizational units). The mechanism may differ for:
-
Continuous features: Sensor data, financial prices, medical measurements
-
High-dimensional features: Images, text embeddings, audio spectrograms
-
Structured features: Graphs, sequences, spatial data
The 40% concentration threshold is empirically derived from n=8 categorical-feature tasks and should be validated before applying to other feature types.
Statistical power: With n=8 tasks, our primary correlation (Spearman $`\rho=0.714`$, $`p=0.047`$) is marginally significant, providing suggestive but not definitive evidence. Statistical power is limited—we can detect large effects ($`\rho \geq 0.70`$) but may miss moderate correlations. The 40% concentration threshold is empirically derived from these 8 severe-shift tasks and should be treated as preliminary guidance requiring validation on additional datasets. Combining the 8 severe-shift tasks with 4 moderate-shift tasks yields $`\rho=0.676`$, $`p=0.016`$, but this heterogeneous grouping conflates two different mechanisms (concentration vs feature stability) and is statistically misleading.
Temporal scope: Retraining experiments span 11 months (Feb–Dec 2020) during acute COVID disruption. Longer-term dynamics (2021–2022) and the question of when distribution has stabilized sufficiently to stop retraining remain open. Stopping criteria: Practitioners could monitor coverage stability: if empirical coverage remains within tolerance (e.g., $`\pm`$5% of target) for 2–3 consecutive quarters without retraining, distribution may have stabilized. This hypothesis requires empirical validation on post-2020 data.
Model class: We focus on LightGBM (gradient-boosted trees). Deep learning models may exhibit different feature importance dynamics and conformal failure modes.
Practical implications: Despite these limitations, our findings provide actionable guidance for practitioners deploying conformal prediction in similar settings (categorical features, temporal shift, supply chain/operational data). The decision framework (monitor SHAP concentration, retrain quarterly if vulnerable) is immediately applicable within this scope, but requires validation before extending to other domains.
Conclusion
Conformal prediction guarantees can degrade dramatically under distribution shift, but the severity depends on identifiable task characteristics. Our COVID-19 natural experiment reveals:
-
Empirical variation: Among 8 supply chain tasks experiencing severe feature turnover (Jaccard $`\approx`$0), coverage drops range from 0% to 86.7%—two orders of magnitude variation under identical temporal shift
-
Predictive signal: For severe-shift scenarios (complete feature turnover, n=8), catastrophic failures correlate with single-feature dependence (SHAP concentration) rather than feature instability (Spearman $`\rho=0.714`$, $`p=0.047`$). Tasks with $`\sim`$0% Jaccard similarity differ by 700$`\times`$ in coverage degradation (71.6% vs 0.1%) due to concentration: catastrophic tasks show concentrated importance explosion (4.5×), while robust tasks redistribute importance across features (10-20×)
-
Mechanism specificity: Exploratory analysis of 4 additional tasks with moderate feature stability (Jaccard 0.13–0.86) reveals no concentration effect ($`\rho=0.632`$, $`p=0.368`$, n.s.)—feature stability itself determines robustness. The concentration mechanism applies specifically to severe-shift scenarios where features lack temporal stability
-
Practical solution: Quarterly retraining significantly restores catastrophic task coverage by 19 percentage points (Wilcoxon signed-rank $`p=0.04`$ vs no retraining). While quarterly achieves higher mean coverage than monthly (41% vs 32%), this difference is not statistically significant ($`p=0.24`$); quarterly’s advantage lies in cost-effectiveness (3× fewer retrains) and stability (lower variance, no coverage collapses)
-
Cost-benefit: Robust tasks with distributed importance maintain 99.8% coverage without retraining, enabling practitioners to avoid unnecessary computational cost
-
Decision framework: Monitor SHAP importance concentration before deployment ($`>`$40% indicates vulnerability in severe-shift scenarios); for vulnerable tasks, implement quarterly retraining; for robust tasks, skip retraining
-
Negative result: Adaptive Conformal Inference (ACI) does not help when features lack temporal stability
Our work identifies SHAP importance concentration as a predictive signal for conformal prediction failure in severe-shift scenarios (complete feature turnover, n=8, $`p=0.047`$). The concentration effect does not generalize to moderate-shift scenarios with stable features, where different mechanisms apply. The decision framework—monitor concentration, retrain quarterly if vulnerable—provides actionable guidance for practitioners deploying conformal prediction in severe-shift settings (e.g., supply chain disruptions). While we establish predictive correlation within this scope, causal validation and extension to other shift types remain important future work.
Reproducibility Details
Dataset Temporal Splits
We use the rel-salt supply chain dataset with the following temporal splits aligned to COVID-19 milestones:
-
Training: Before February 1, 2020 (pre-COVID baseline)
-
Validation: February 1–July 1, 2020 (COVID onset; WHO declared pandemic March 11, 2020)
-
Test: After July 1, 2020 (COVID peak; Delta variant emergence)
LightGBM Hyperparameters
All models trained with:
{
  'objective': 'multiclass',
  'boosting_type': 'gbdt',
  'num_leaves': 31,
  'learning_rate': 0.05,
  'feature_fraction': 0.8,
  'bagging_fraction': 0.8,
  'bagging_freq': 5,
  'num_boost_round': 500,
  'early_stopping_rounds': 50,
  'seed': [42, 43, ..., 91]  # 50 seeds
}
These are standard LightGBM defaults. No task-specific tuning was performed to avoid overfitting to the validation set used for conformal calibration.
Conformal Prediction Setup
-
Method: Adaptive Prediction Sets (APS)
-
Target coverage: $`(1-\alpha) = 0.9`$ (90%)
-
Calibration: Random 50% split of validation set
-
Quantile level: $`q = \min\left(\frac{\lceil(n+1)(1-\alpha)\rceil}{n}, 1\right)`$ where $`n`$ is calibration set size
For each test example with predicted probabilities $`\hat{\pi}`$, we construct prediction set $`\mathcal{C}(\hat{\pi})`$ containing top classes until cumulative probability exceeds quantile $`q`$.
SHAP Computation
-
Method: TreeExplainer
-
Subsample size: 10,000 samples per split (to reduce computation)
-
Aggregation: Mean absolute SHAP values across all classes for multiclass tasks: $`\text{SHAP}_f = \frac{1}{C} \sum_{c=1}^C |\phi_f^{(c)}|`$
-
Feature ranking: Based on mean $`|\text{SHAP}_f|`$ across samples
Computational Resources
-
Hardware: Standard Central Processing Unit (no Graphics Processing Unit required for LightGBM)
-
Parallel execution: 8 cores for 50-seed ensemble
-
Wall-clock time: $`\sim`$3–4 hours for full 8-task, 50-seed suite
-
Peak memory: $`<`$8 Gigabytes per task
Code Availability
Code will be made available upon publication. Implementation built on the RelBench framework .
Funding
This research received no specific grant from any funding agency in the public, commercial, or not-for-profit sectors.
📊 논문 시각자료 (Figures)