The Impact of LLMs on Online News Consumption and Production
📝 Original Paper Info
- Title: The Impact of LLMs on Online News Consumption and Production- ArXiv ID: 2512.24968
- Date: 2025-12-31
- Authors: Hangcheng Zhao, Ron Berman
📝 Abstract
Large language models (LLMs) change how consumers acquire information online; their bots also crawl news publishers' websites for training data and to answer consumer queries; and they provide tools that can lower the cost of content creation. These changes lead to predictions of adverse impact on news publishers in the form of lowered consumer demand, reduced demand for newsroom employees, and an increase in news "slop." Consequently, some publishers strategically responded by blocking LLM access to their websites using the robots.txt file standard. Using high-frequency granular data, we document four effects related to the predicted shifts in news publishing following the introduction of generative AI (GenAI). First, we find a moderate decline in traffic to news publishers occurring after August 2024. Second, using a difference-in-differences approach, we find that blocking GenAI bots can be associated with a reduction of total website traffic to large publishers compared to not blocking. Third, on the hiring side, we do not find evidence that LLMs are replacing editorial or content-production jobs yet. The share of new editorial and content-production job listings increases over time. Fourth, regarding content production, we find no evidence that large publishers increased text volume; instead, they significantly increased rich content and use more advertising and targeting technologies. Together, these findings provide early evidence of some unforeseen impacts of the introduction of LLMs on news production and consumption.💡 Summary & Analysis
1. **Impact of LLMs on News Publisher Traffic:** The introduction of LLMs has led to a decline in traffic for news publishers, much like how AI providing direct answers online is starting to replace the role of traditional search engines as intermediaries.-
Blocking LLM Crawlers: Some publishers have blocked LLM crawlers to reduce bot traffic, but this can also decrease human visits. Understanding this effect is akin to seeing how AI directly impacts website interactions and user behaviors.
-
Shift in Content Production Formats: Following the adoption of LLMs, publishers are moving towards richer content formats like images and videos rather than expanding text output. This suggests that AI influences not just content creation but also its format and user engagement.
📄 Full Paper Content (ArXiv Source)
Generative AI (GenAI) and large language models (LLMs) are reshaping how consumers discover and consume information online. Unlike search-based discovery intermediaries (e.g., Google) that primarily redirect users to publishers through links, LLM-mediated interfaces can directly provide answers and summaries, potentially substituting away from click-through visits.1 Recent evidence shows that LLM adoption reduces traditional search activity and downstream browsing to smaller sites, and users click external links less often when AI summaries appear in search results.2 These developments raise a few interesting questions: (1) to what extent does generative AI function as a substitute for publisher traffic and monetization? (2) how do publishers respond? and (3) is this response effective?
News publishers have been at the center of the debate about the impact of LLMs because LLMs use news content to improve their model training and also to answer user queries. Since the business model of news publishers depends heavily on discovery and referral from intermediaries, some publishers have been quick to respond by blocking LLM access to their websites using the robots.txt standard.3 The impact of this blocking can be three-fold: it can reduce bot traffic from LLMs used to scan the websites to train models; it can reduce bot traffic by LLMs used to answer user queries; and it can reduce referral traffic by LLMs sending users to visit the news publisher. Publishers can also try to respond by lowering headcount which would save costs, or by increasing content production using LLMs to attract more consumers.
Given these different potential effects, it remains less understood (1) what the overall impact of LLMs on publisher traffic is; (2) whether blocking access is an effective strategic response; and (3) how LLM tools affect the supply of news content by publishers through hiring decisions and changes in the quantity and format of content they produce.
We address these questions by constructing a high-frequency, publisher panel that links daily traffic to strategic blocking rules for LLM crawlers, publishers’ page structure, and publishers’ hiring. We combine daily domain-level visits from SimilarWeb with historical robots.txt files and HTML snapshots from the HTTP Archive and employer-linked job postings from Revelio. To separate total visits to publishers (which may include bot and crawler traffic) from real audience demand, we also use household browsing data from the Comscore Web-Behavior Panel.4 Using these data, we document four empirical facts characterizing early shifts in the news publishing industry following the diffusion of generative AI, which are summarized below.
Publisher traffic declines, but the decline emerges only after August 2024.
Following the introduction of ChatGPT in November 2022 and Google AI Overview in May 2024, there were widespread predictions and anecdotal reporting of a substantial drop in publisher traffic. Our analysis using SimilarWeb visit data for news domains shows that traffic is broadly stable through mid-2023 and does not exhibit an immediate post-ChatGPT and post-Google AI Overview collapse. We employ a multiple change-point detection approach and identify persistent breaks in traffic patterns, most prominently in November 2023 and August 2024, after which traffic levels shift to a lower level. We estimate a synthetic difference-in-differences (SDID) model using log traffic in the six months before and six months after each detected breakpoint, with the top 100 retail websites as the control group. Following the August 2024 break, traffic to news publishing websites decreased by approximately 13.2% relative to the control group. The point estimates for the November 2023 break are also negative but statistically insignificant.
Some publishers decide to block LLM traffic, but blocking reduces both total and human traffic for large publishers.
One way that publishers could respond to their content being crawled by
LLMs and to an increase in bot traffic is to declare that crawling is
not allowed in their robots.txt file. The robots.txt file of a
website (part of the RFC 9309 standard) instructs web crawlers on what
they are allowed and not allowed to access. We identify when each
publisher first disallowed GPT-related crawlers using the HTTP
Archive.5 News publishers choose to block LLM access more often than
non-news websites. About 80% of the top publishers block LLM crawlers in
2023, in a staggered pattern of blocking starting mid-2023. We use the
staggered adoption pattern in a difference-in-differences analysis that
compares blocking publishers to not-yet-blocking publishers to estimate
the effect of blocking LLM crawlers on total traffic. We find a
persistent post-blocking decline of 23.1% in log-monthly visits measured
by SimilarWeb. To assess whether this effect reflects reduced automated
(e.g., bot) traffic rather than changes in real audience demand, we
replicate the analysis using Comscore Web-Behavior panel data. We again
find a sizable and statistically significant post-blocking decline in
monthly publisher visits of 13.9%. These results imply that blocking
LLMs can have significant negative effects on publishers: it is followed
by lower total traffic and lower human traffic, and not merely the
mechanical removal of bot visits for large websites. Indeed, some
publishers removed the Disallow rule in 2024. However, when we extend
the analysis to lower-traffic websites in the Comscore data, we find
heterogeneous results that vary with website size.
No near-term contraction in newsroom hiring relative to other roles.
Another possible response by publishers to a decline in traffic and reduced cost of content production is to reduce their newsroom headcount. We use employer-linked job postings to track publishers’ hiring by occupation. Motivated by evidence that LLM exposure is heterogeneous across tasks and that measured labor-market impacts have been modest in the near term , we test whether publishers disproportionately reduce demand for editorial/content-production roles after the introduction of LLMs. We find no such pattern: editorial postings do not exhibit a discrete post-GenAI decrease. The share of postings not only does not decline but increases, suggesting that publishers do not respond to LLMs primarily by reducing newsroom headcount.
Publishers do not scale up textual production; they shift toward richer pages and embedded components.
A recently emerging phenomenon associated with LLM usage is the production of content slop.6 We use page-structure metrics from the HTTP Archive7 and URL histories from the Internet Archive8 to estimate whether news publishers create more content or whether they alter their content after the introduction of LLMs. We find no evidence that publishers respond by expanding the number of sections or by accelerating growth in text and article-related URLs. Instead, pages exhibit substantial increases in interactive elements (68.1%) and in advertising and targeting technology components (50.1%) relative to retail websites, with growth concentrated in image-related URLs. This pattern is consistent with work linking monetization design to content incentives and with evidence that multimedia and interactivity shape user engagement .
To summarize, we document a decline in news publisher traffic but mostly after August 2024. We find that some publishers respond by blocking LLM crawlers, but that this blocking can hurt them. We also do not find evidence of reduced hiring in content creation and editing positions, but we do find evidence that content is becoming richer.
Together, these facts provide early evidence that generative AI does not currently function as a direct substitute for traditional news production. Rather, the industry appears to be adjusting along multiple domains: access control, hiring composition, and content production format and quantity. The impact of these adjustments, however, sometimes has unforeseen outcomes.
The remainder of the paper describes the data construction and empirical strategy, documents traffic patterns, estimates the effects of blocking on total and human traffic, analyzes hiring composition, and characterizes changes in page structure, multimedia richness and advertisement density.
Contribution and Related Work
First, our paper contributes to the literature on how digital platforms, discovery intermediaries, and new technologies reshape content demand and monetization by reallocating attention and traffic. Work on news aggregation, intermediation, and platform competition shows that platforms can materially affect publishers’ traffic and strategic outcomes . Recent evidence suggests that similar changes are emerging with LLM-mediated information access: in clickstream data, LLM adoption reduces traditional search activity and downstream browsing to smaller sites , and when AI summaries appear in search, users click external links less often. We contribute by pinning down whether, when, and how much publisher traffic declines using a publisher-focused panel.
Second, our paper contributes to the literature on access control, the economics of reuse, and copyright. A growing literature argues that GenAI changes the bargaining environment around content access and reuse, raising questions about substitution, licensing, and welfare under alternative copyright regimes . The institutional margin that websites can control in the short run is technical access: robots.txt (the Robots Exclusion Protocol) is not authorization (RFC 9309).9 Consistent with the limits of this voluntary protocol, show in large-scale evidence and controlled robots.txt experiments that compliance falls with stricter directives and that some bot categories (including AI-related crawlers) rarely check robots.txt. documents that by end-2023 about 48% of widely used news websites across ten countries blocked OpenAI’s crawlers. We contribute by treating blocking as a measurable strategic action and providing causal evidence on its effects separating total traffic from real (human) traffic, showing that blocking GenAI crawlers has a statistically significant impact on newspaper website traffic despite evidence on imperfect compliance with robots.txt.
Third, our paper relates to the growing literature on LLM adoption at work and its implications for labor demand and organizational adjustment. Exposure-based analyses map which occupations’ task bundles are most affected by LLM capabilities . Experimental and field evidence shows that generative AI can raise productivity in knowledge-work tasks, often with larger gains for less experienced workers . At the aggregate level, recent evidence finds limited short-run effects on earnings and hours despite rapid diffusion , while demand shifts are more visible in online labor markets for exposed tasks ; macro perspectives similarly caution that economy-wide impacts may be modest in the near term . We contribute by examining publisher-side hiring composition (editorial/content roles versus other postings) and documenting little short-term replacement in core newsroom roles.
Finally, our paper relates to the literature on content supply, format choice, and monetization technology. Classic work links monetization schemes to content incentives and format: ad-based monetization can shift content quality and topic choice , while subscription, paywall, and freemium designs trade off reach and revenue . GenAI has been shown to change participation and contribution patterns in online knowledge communities . We add to this literature by showing that publishers are not simply scaling text output; instead, they shift toward richer pages with more images, video, and interactive elements, consistent with prior evidence that multimedia and interactivity shape user experience and engagement .
Data
We construct a publisher panel by combining high-frequency measures of website traffic, page structure and content proxies, and hiring from multiple data sources.
Website traffic
SimilarWeb
Our first traffic measure comes from SimilarWeb accessed via the Dewey Data Platform.10 The data provide daily, domain-level estimates of total visits (desktop and mobile) for each website in our sample from October 17, 2022 through July 1, 2025. For each domain–day, we observe the estimated number of daily worldwide visits. We use these data to characterize aggregate traffic patterns and to study traffic responses around changes in publisher GenAI bots policies.
Comscore Web-Behavior Panel
To measure human browsing, we use the Comscore Web-Behavior Panel available through WRDS for 2022–2024. This panel records desktop browsing behavior for a large sample of U.S. households. For each household–URL event, we observe the domain URL and timestamp. We aggregate these events to construct publisher-level measures of “real” consumer visits and use them to distinguish human browsing from aggregate traffic measures that may include automated activity.
Publisher characteristics and content quantity
Robots.txt and page structure
For each publisher domain, we collect robots.txt rules and page-level HTML metadata from the HTTP Archive,11 which tracks how the web is built and how it changes over time. These data allow us to code whether and when a domain blocks major GenAI crawlers and to quantify changes in page composition, including the intensity of images, videos, and interactive elements.
Content quantity proxies.
To proxy for the scale and scope of published content, we use the Internet Archive’s Wayback Machine12 to construct annual counts of unique URLs observed for each domain. We use these counts as a proxy for the number of distinct pages a publisher maintains over time and use them in our analysis of content production.
Job postings and employment
To study hiring patterns, we use job posting data from Revelio Labs via WRDS.13 Revelio aggregates job postings from multiple sources and provides employer identifiers, job titles, occupation codes, locations, and posting dates. We use these data to construct publisher-level monthly counts of new job postings by occupation category (e.g., editorial/content-production versus other roles) and to track changes in editorial/content postings and total postings over time.
Sample construction and merge across sources
We construct our sample by starting from domains that have employer-linked job postings in Revelio and that appear in at least one traffic source (SimilarWeb or Comscore). Domains are matched across sources using Revelio’s firm–URL mapping at the domain level. In total, Revelio and SimilarWeb share 6,286 common domains. Table [tab:url_naics_distribution] presents the ratios of URLs in each industry sector (the first two digits of the NAICS code).14 We select websites classified under NAICS 513110 as newspaper publishers. We then manually review these websites and filter out those that are not newspaper publishers, such as news aggregators. This process yields 30 URLs; we present the list of URLs and their total 2024 traffic in Table 4.
We then merge in Comscore panel browsing data when available. To construct stable Comscore-based measures of human traffic, we restrict the sample to active panelists with at least four browsing sessions in each month of a calendar year, and we aggregate their visits to the domain–month level. For analyses that rely on Comscore traffic, we expand coverage by focusing on the top 500 news-publisher domains with the highest Comscore traffic among those matched to Revelio.15
Finally, we retrieve robots.txt rules and HTML snapshots from the HTTP Archive, and historical URL coverage from the Internet Archive, for all of these domains. Table [tab:combined_traffic_stats] presents summary statistics for the daily traffic of websites across different industries.
This table summarizes the daily traffic of websites across different categories. For the retail trade category, we exclude URLs that also appear in the information or technology sectors.
Results
Effect 1: Publisher Traffic Declines Emerge Only After August 2024
We begin by examining whether aggregate traffic to newspaper publishers exhibits discrete shifts over time. The daily traffic data come from SimilarWeb. Figure 1 plots the sum of daily visits across the newspaper domains in our sample from October 2022 through June 2025. Traffic is relatively stable through mid-2023, but we observe downward shifts around April 2023, November 2023, and August 2024, after which visits remain at lower levels.
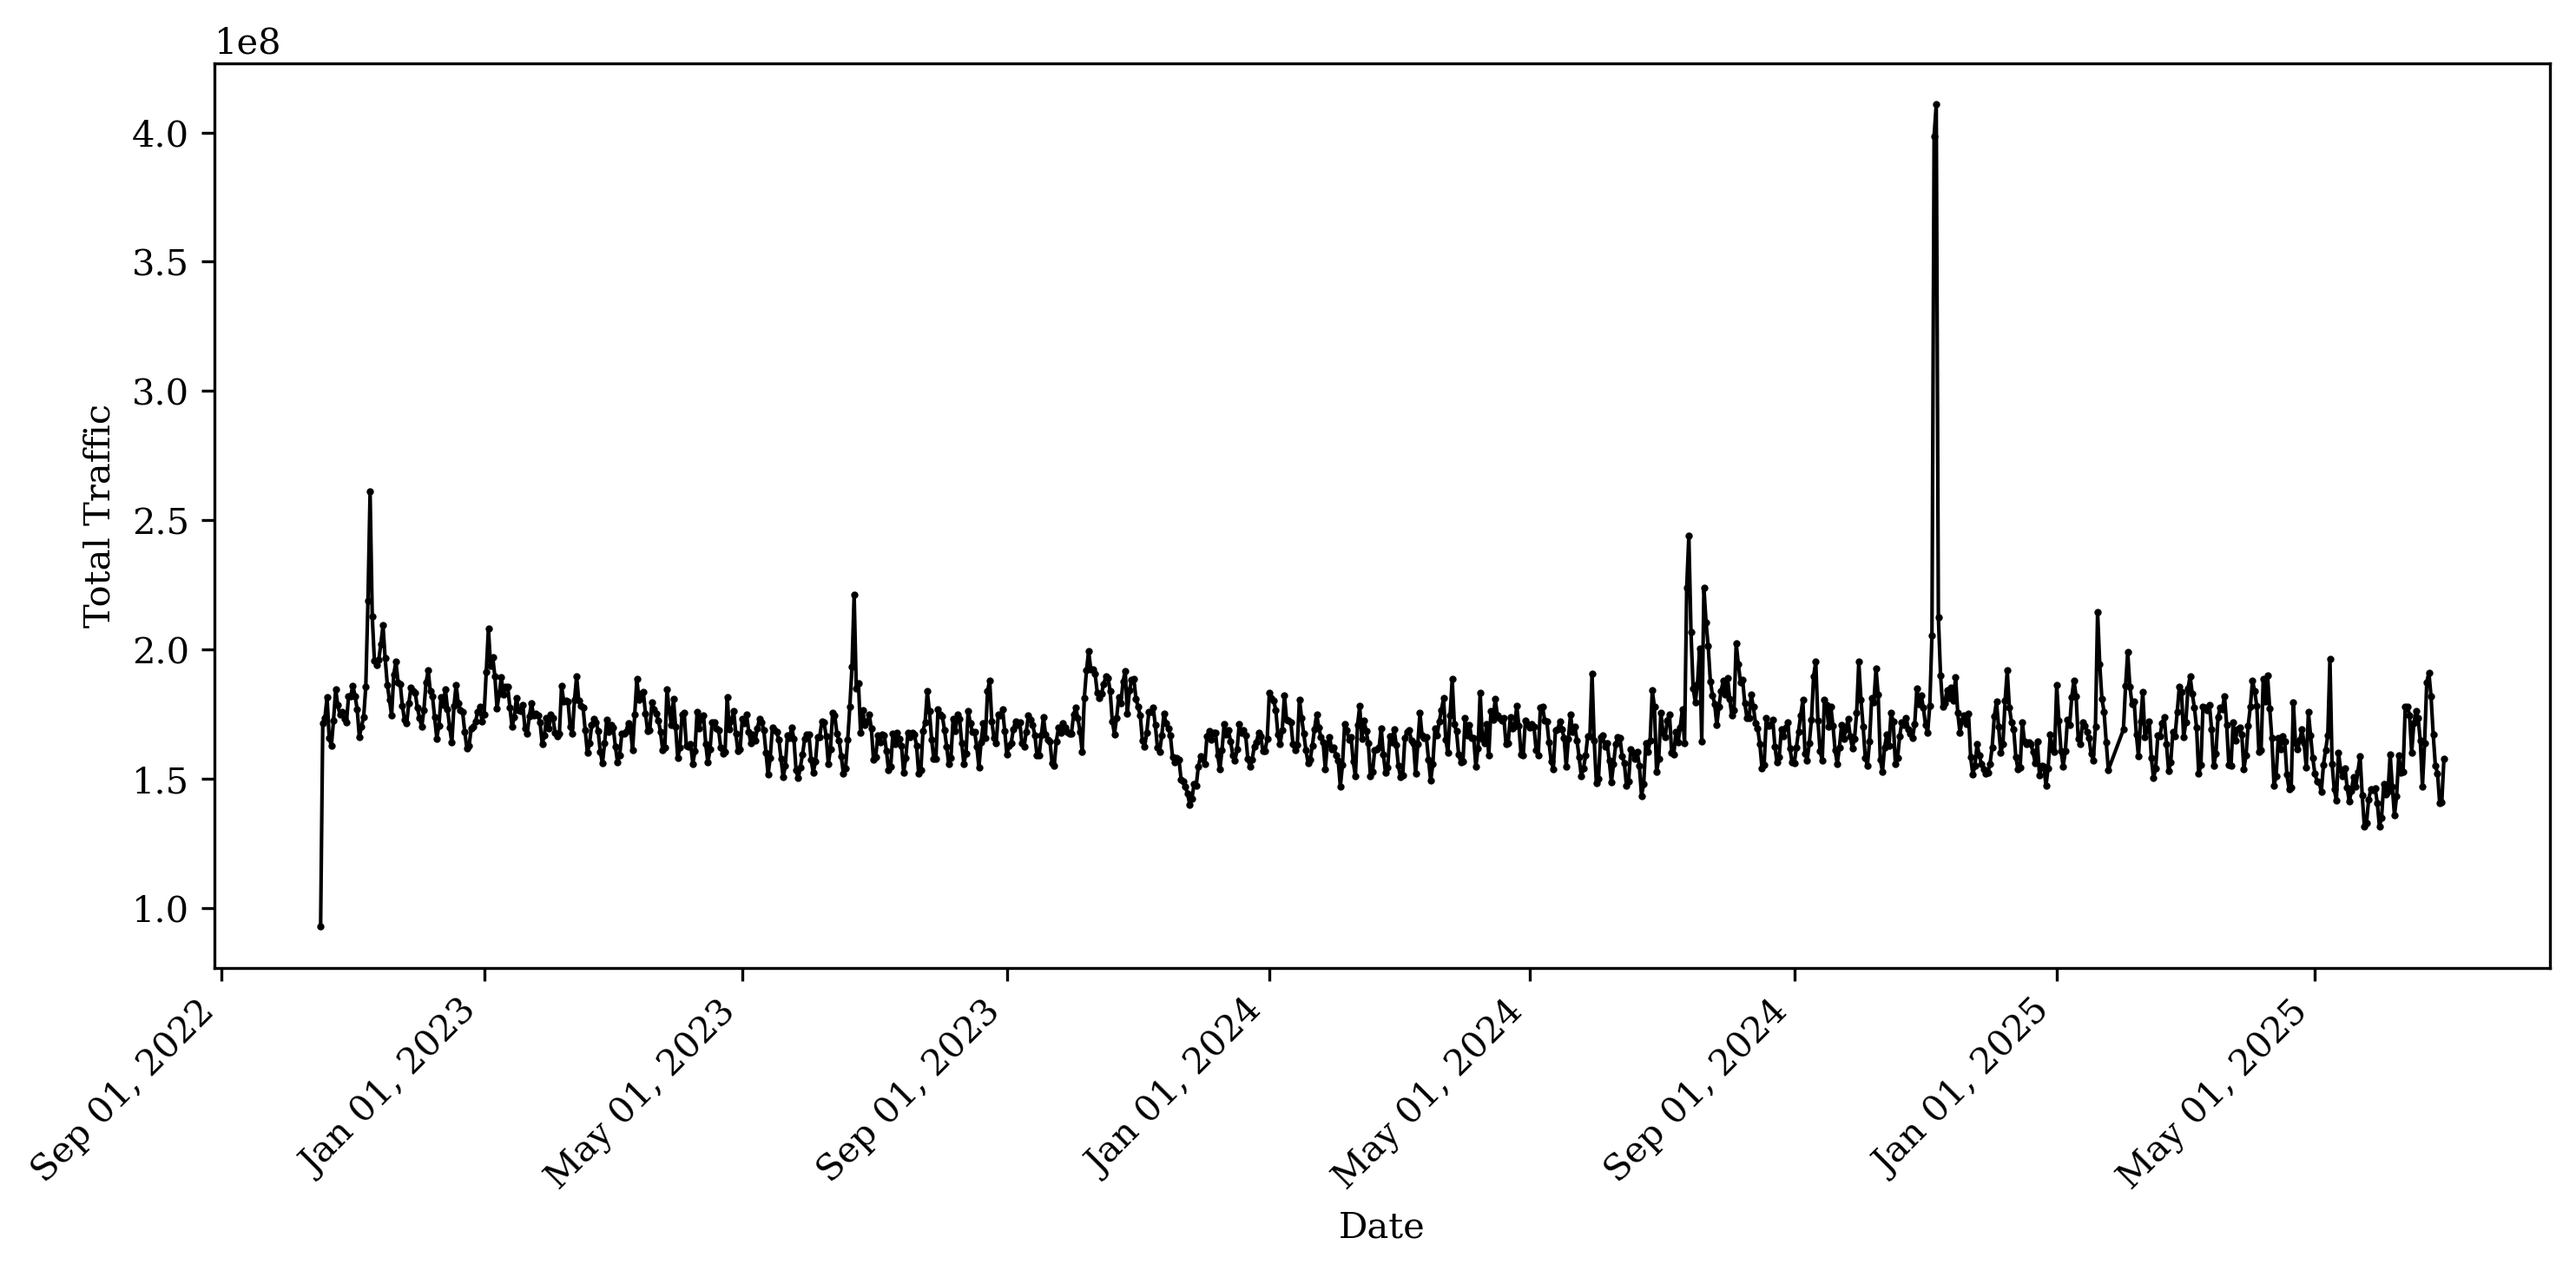
This figure plots the total daily traffic across all news publishing websites using SimilarWeb data.
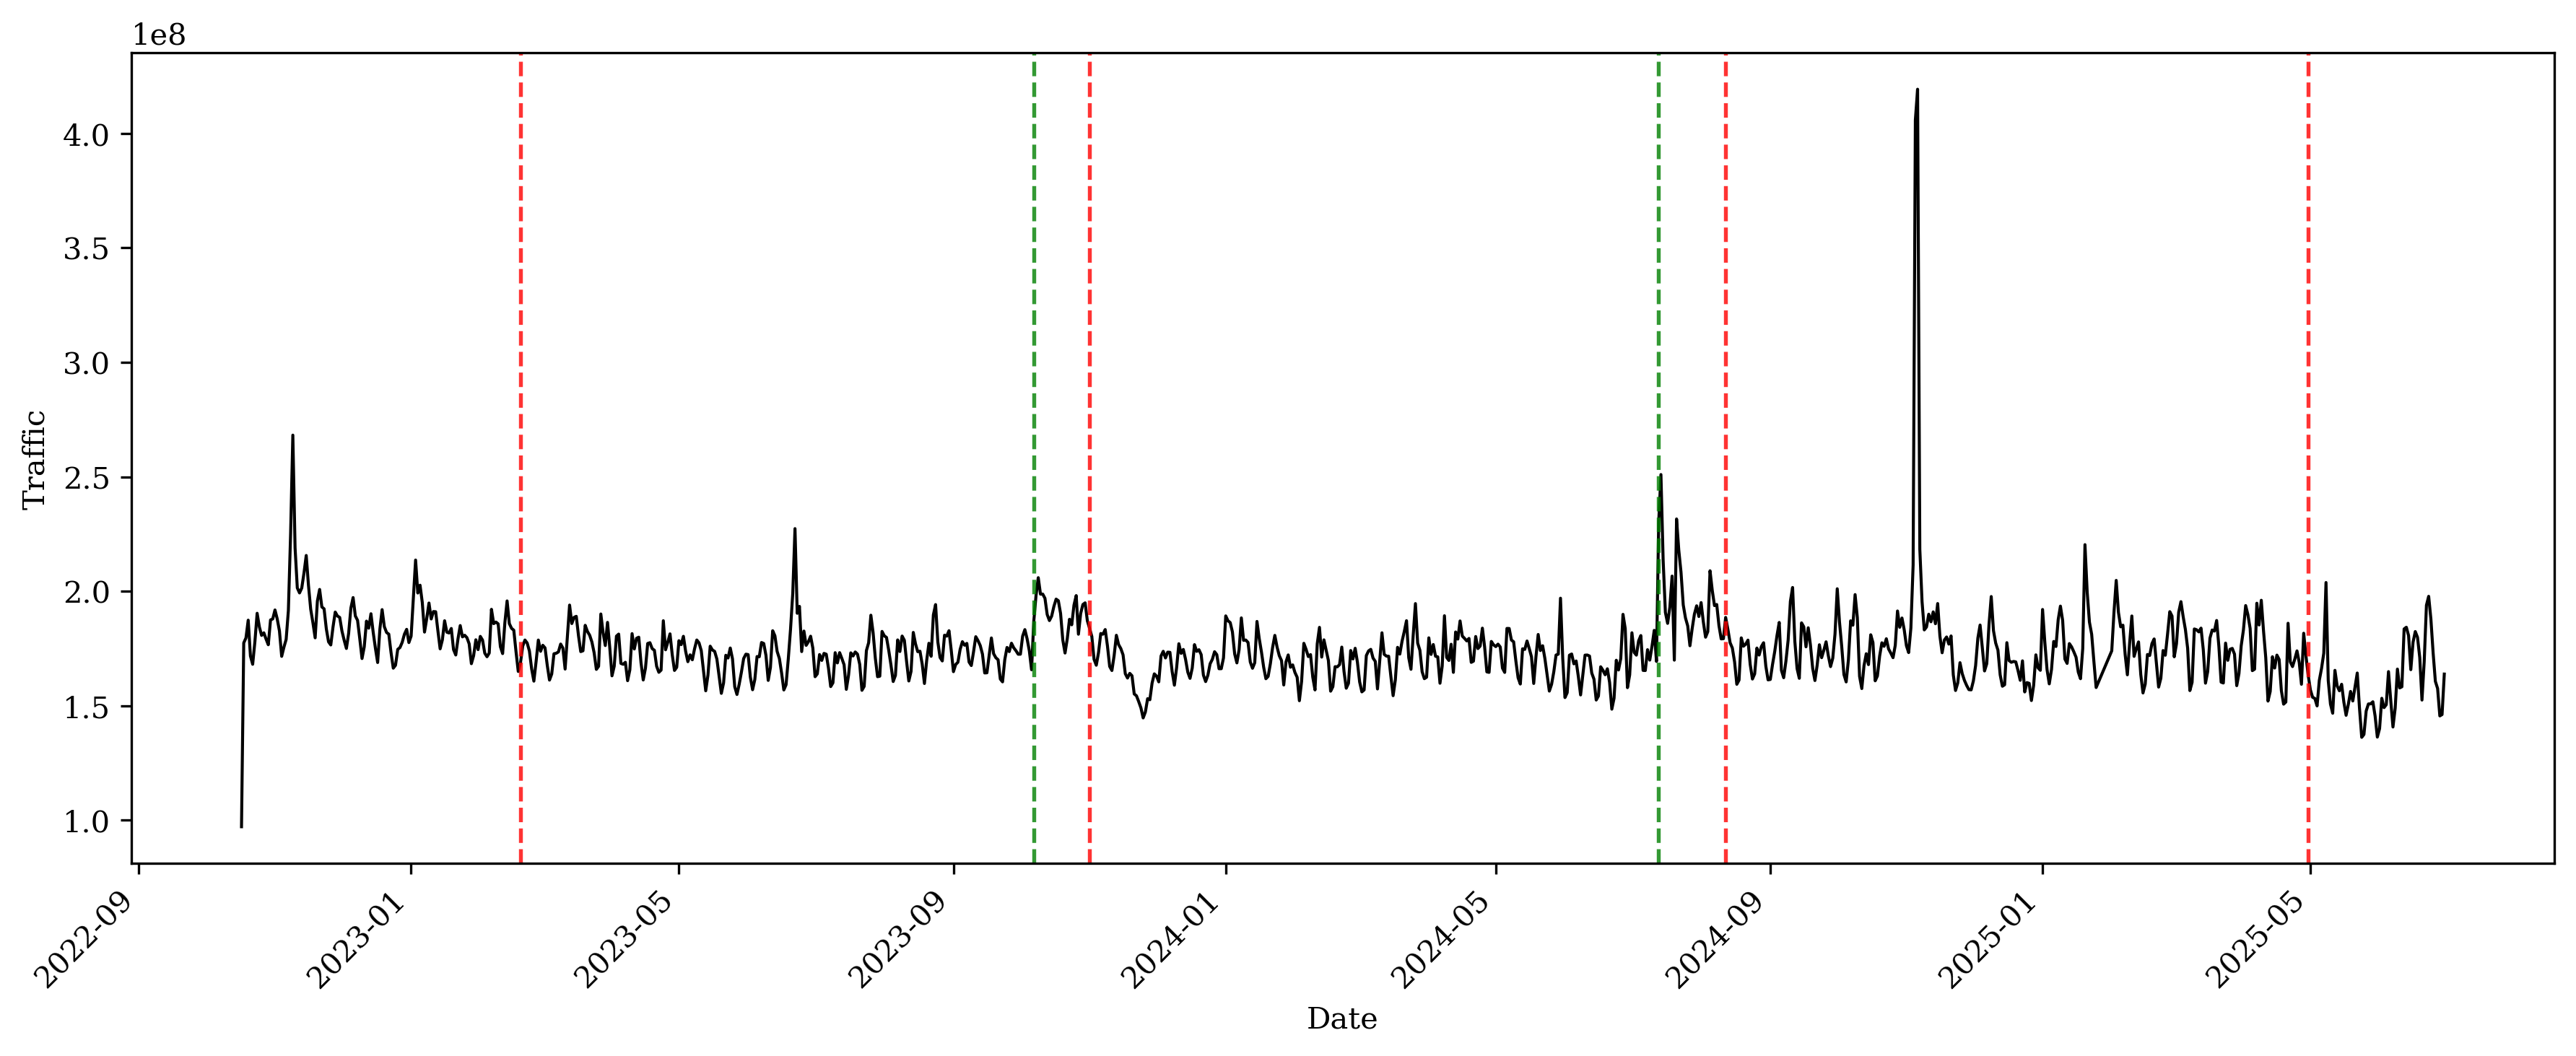
To test whether these visual patterns reflect statistically significant structural breaks, we apply a multiple change-point detection procedure to the logarithm of daily total visits. Specifically, we residualize log traffic with day-of-week fixed effects, calendar-week fixed effects, and month fixed effects to absorb systematic seasonality and within-week variation. We then apply the Pruned Exact Linear Time (PELT) algorithm to the residual series, assuming a piecewise-constant mean and selecting the number of breaks via a penalized least-squares criterion. The procedure identifies major breaks in April 2023, November 2023, and August 2024; we visualize the detected change points in Figure 2.
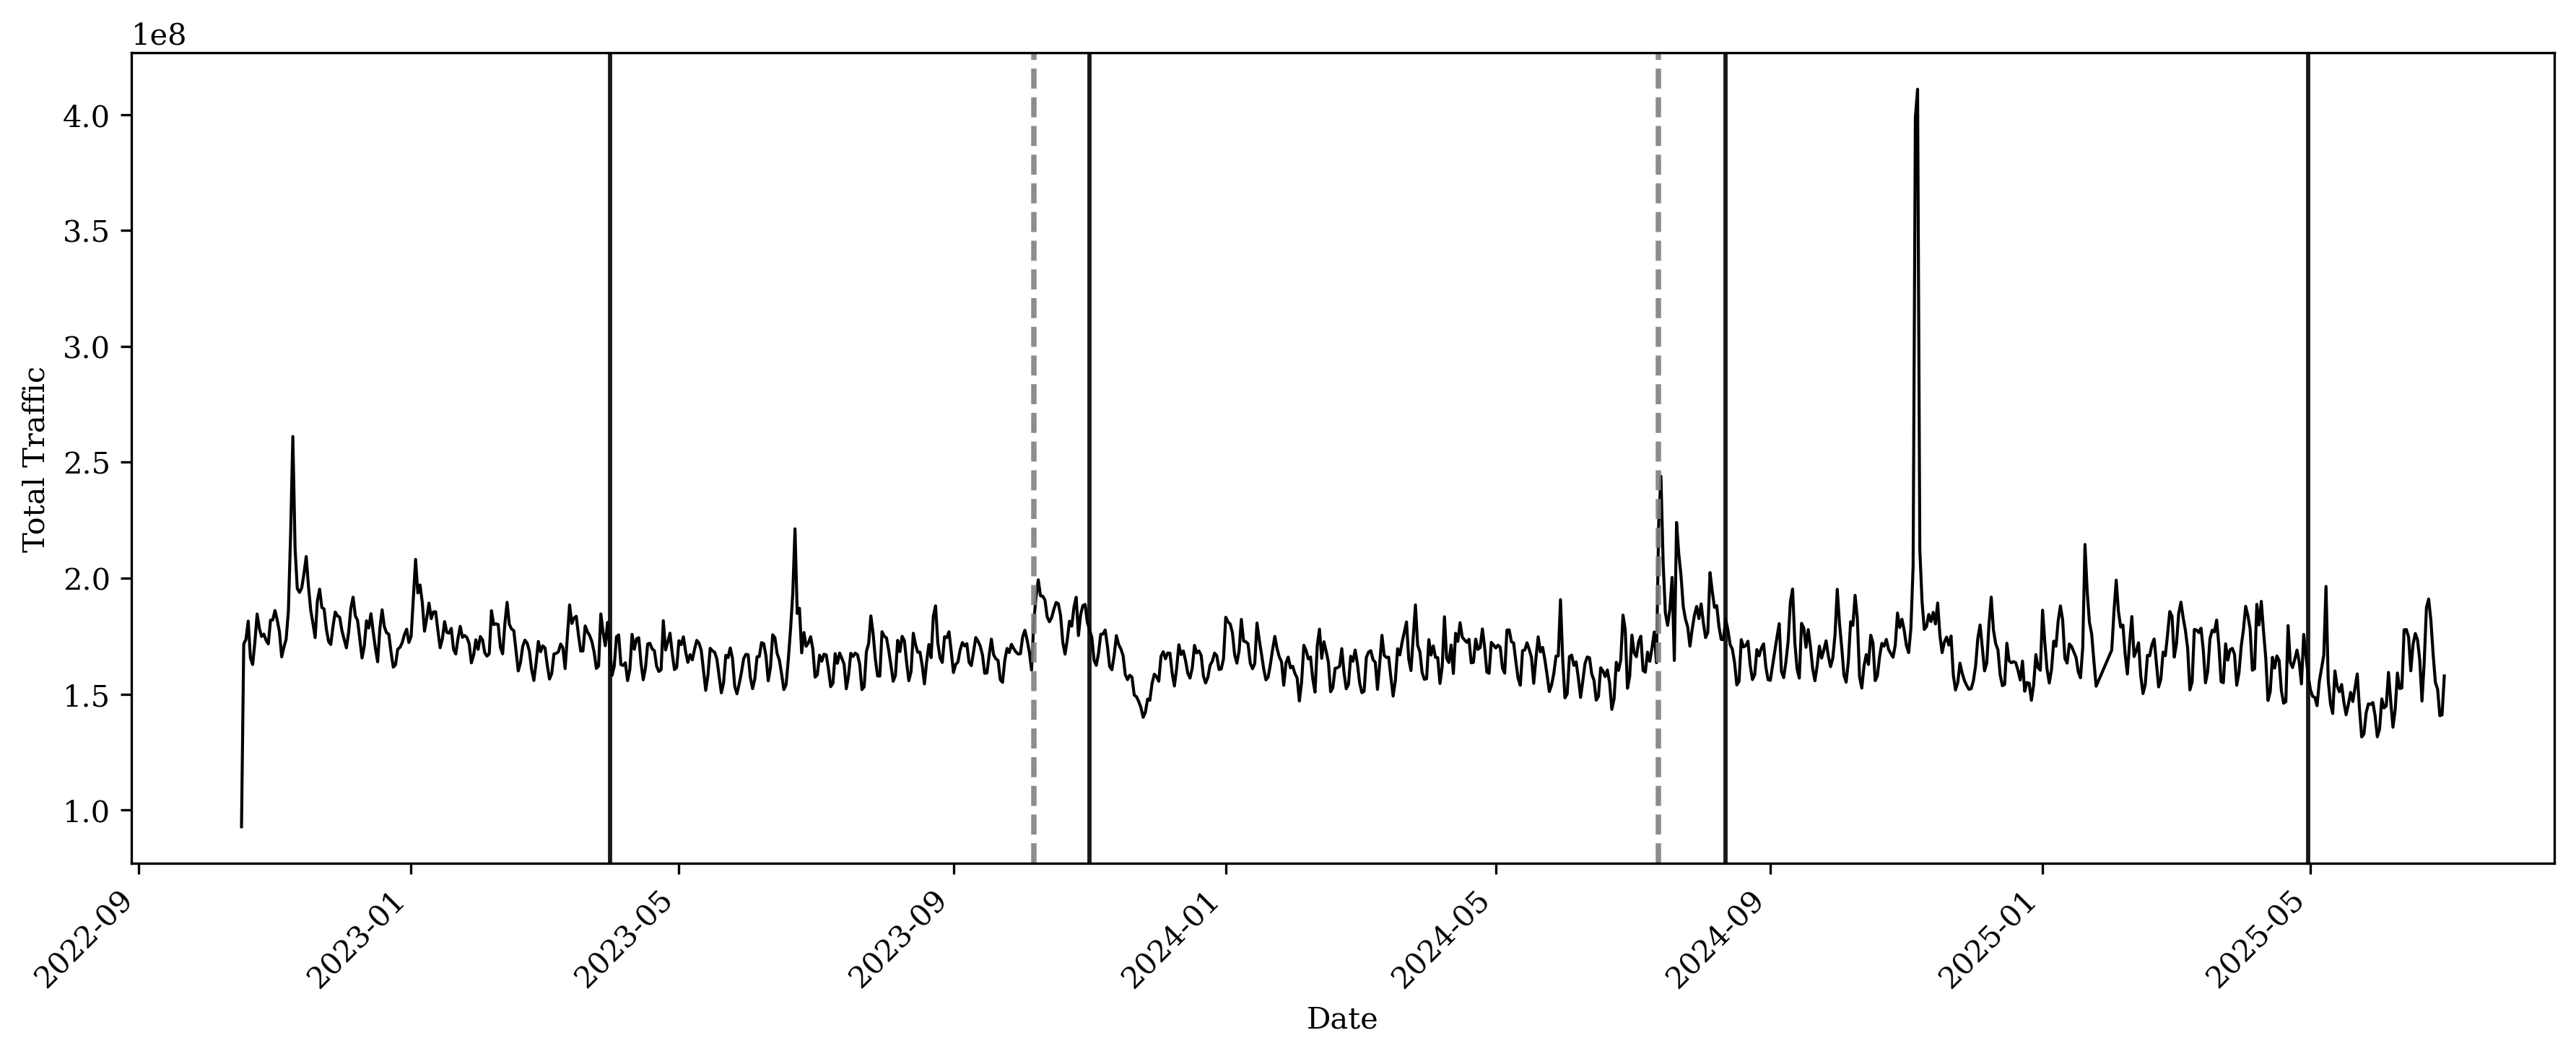
This plot visualizes change-point detection using the Pruned Exact Linear Time (PELT) algorithm applied to residualized log traffic after controlling for day-of-week, calendar-week, and month fixed effects. Vertical reference lines mark detected change points: dashed gray lines denote increases in the mean level following a detected change point, while solid black lines denote decreases in the mean level.
As a complementary parametric check, we estimate a simple autoregressive specification around each detected break date. For a given change point $`\tau_k`$ (with the next change point denoted $`\tau_{k+1}`$), we estimate the following regression:
\begin{equation}
    y_{t}
    = \alpha
    + \rho_0\, y_{t-1}
    + \rho_1\, y_{t-1} \cdot \mathbf{1}\{ \tau_k \le t \le \tau_{k+1}\}
    + \rho_2\, \mathbf{1}\{\tau_k \le t \le \tau_{k+1}\}
    + \epsilon_{t},
\end{equation}where $`y_{t}`$ denotes residualized log traffic (after controlling for calendar-week, day-of-week, and month fixed effects) on day $`t`$. The indicator $`\mathbf{1}\{\tau_k \le t \le \tau_{k+1}\}`$ identifies the post-break segment (from $`\tau_k`$ up to $`\tau_{k+1}`$). In this specification, $`\rho_2`$ captures a level shift in traffic at the break, while $`\rho_1`$ captures a change in persistence of traffic dynamics after the break. We report the results in Table [tab:lag_traffic_regression]. The significantly negative estimates of $`\rho_2`$ after the August 2024, November 2023, and April 2023 change points suggest a decrease in the mean level of residualized traffic. Table 5 presents results from the same regression model using randomly selected placebo dates. Across these specifications, we find no significant effect of the post-placebo indicators, confirming that the main results at the actual detection points capture systematic changes rather than random fluctuations.
To quantify the extent to which traffic shifted relative to other categories, we compare news publishing websites with the top 100 retail websites ranked by daily traffic. We estimate synthetic difference-in-differences (SDID) and a standard two-way fixed effects (TWFE) difference-in-differences model using log traffic for the six months before and after the treatment dates. Table [tab:sdid_Aug_2024] presents the estimated average treatment effects on log traffic. After August 2024, traffic to news publishing websites decreased by approximately 13.2% relative to the control group. The point estimates after November 2023 and April 2023 are statistically insignificant. Figures 23 through 29 plot the SDID and TWFE estimates for each period. The estimates and plots confirm that traffic to publishers declines only after August 2024. While multiple dates show detected shifts in traffic patterns, these other shifts may reflect seasonality (e.g., year-end effects) and are not statistically significant once we control for broader online traffic trends.
This table reports the average treatment effect on the treated (ATT) for website traffic across the detected treatment windows. The dependent variable is the logarithm of daily website traffic. The treatment group consists of news publishing websites, while the control group comprises the top 100 retail websites by daily traffic. For each window, we estimate both the Synthetic DiD model and a standard TWFE DiD model. Confidence intervals are based on 50 bootstrap replications. *$`p<`$0.1; **$`p<`$0.05; ***$`p<`$0.01.
Effect 2: Blocking GenAI Bots Reduces Both Total and Human Traffic for Large Publishers
One important response of publishers to generative AI is to restrict automated access by blocking GenAI crawlers in their robots.txt files. Publishers may be concerned that GenAI systems use scraped content for model training and/or AI-powered search and summarization, which could reduce referral traffic and advertising revenue.
To document this behavior, we use historical robots.txt snapshots from
the HTTP Archive. We code a publisher as blocking a given GenAI bot if
its robots.txt contains an explicit Disallow directive for that
bot’s user agent (Table
[tab:genai_bot]). Most user agents
correspond to official crawlers documented by the vendors; we supplement
these with a small set of widely used user agents observed frequently in
robots.txt files.
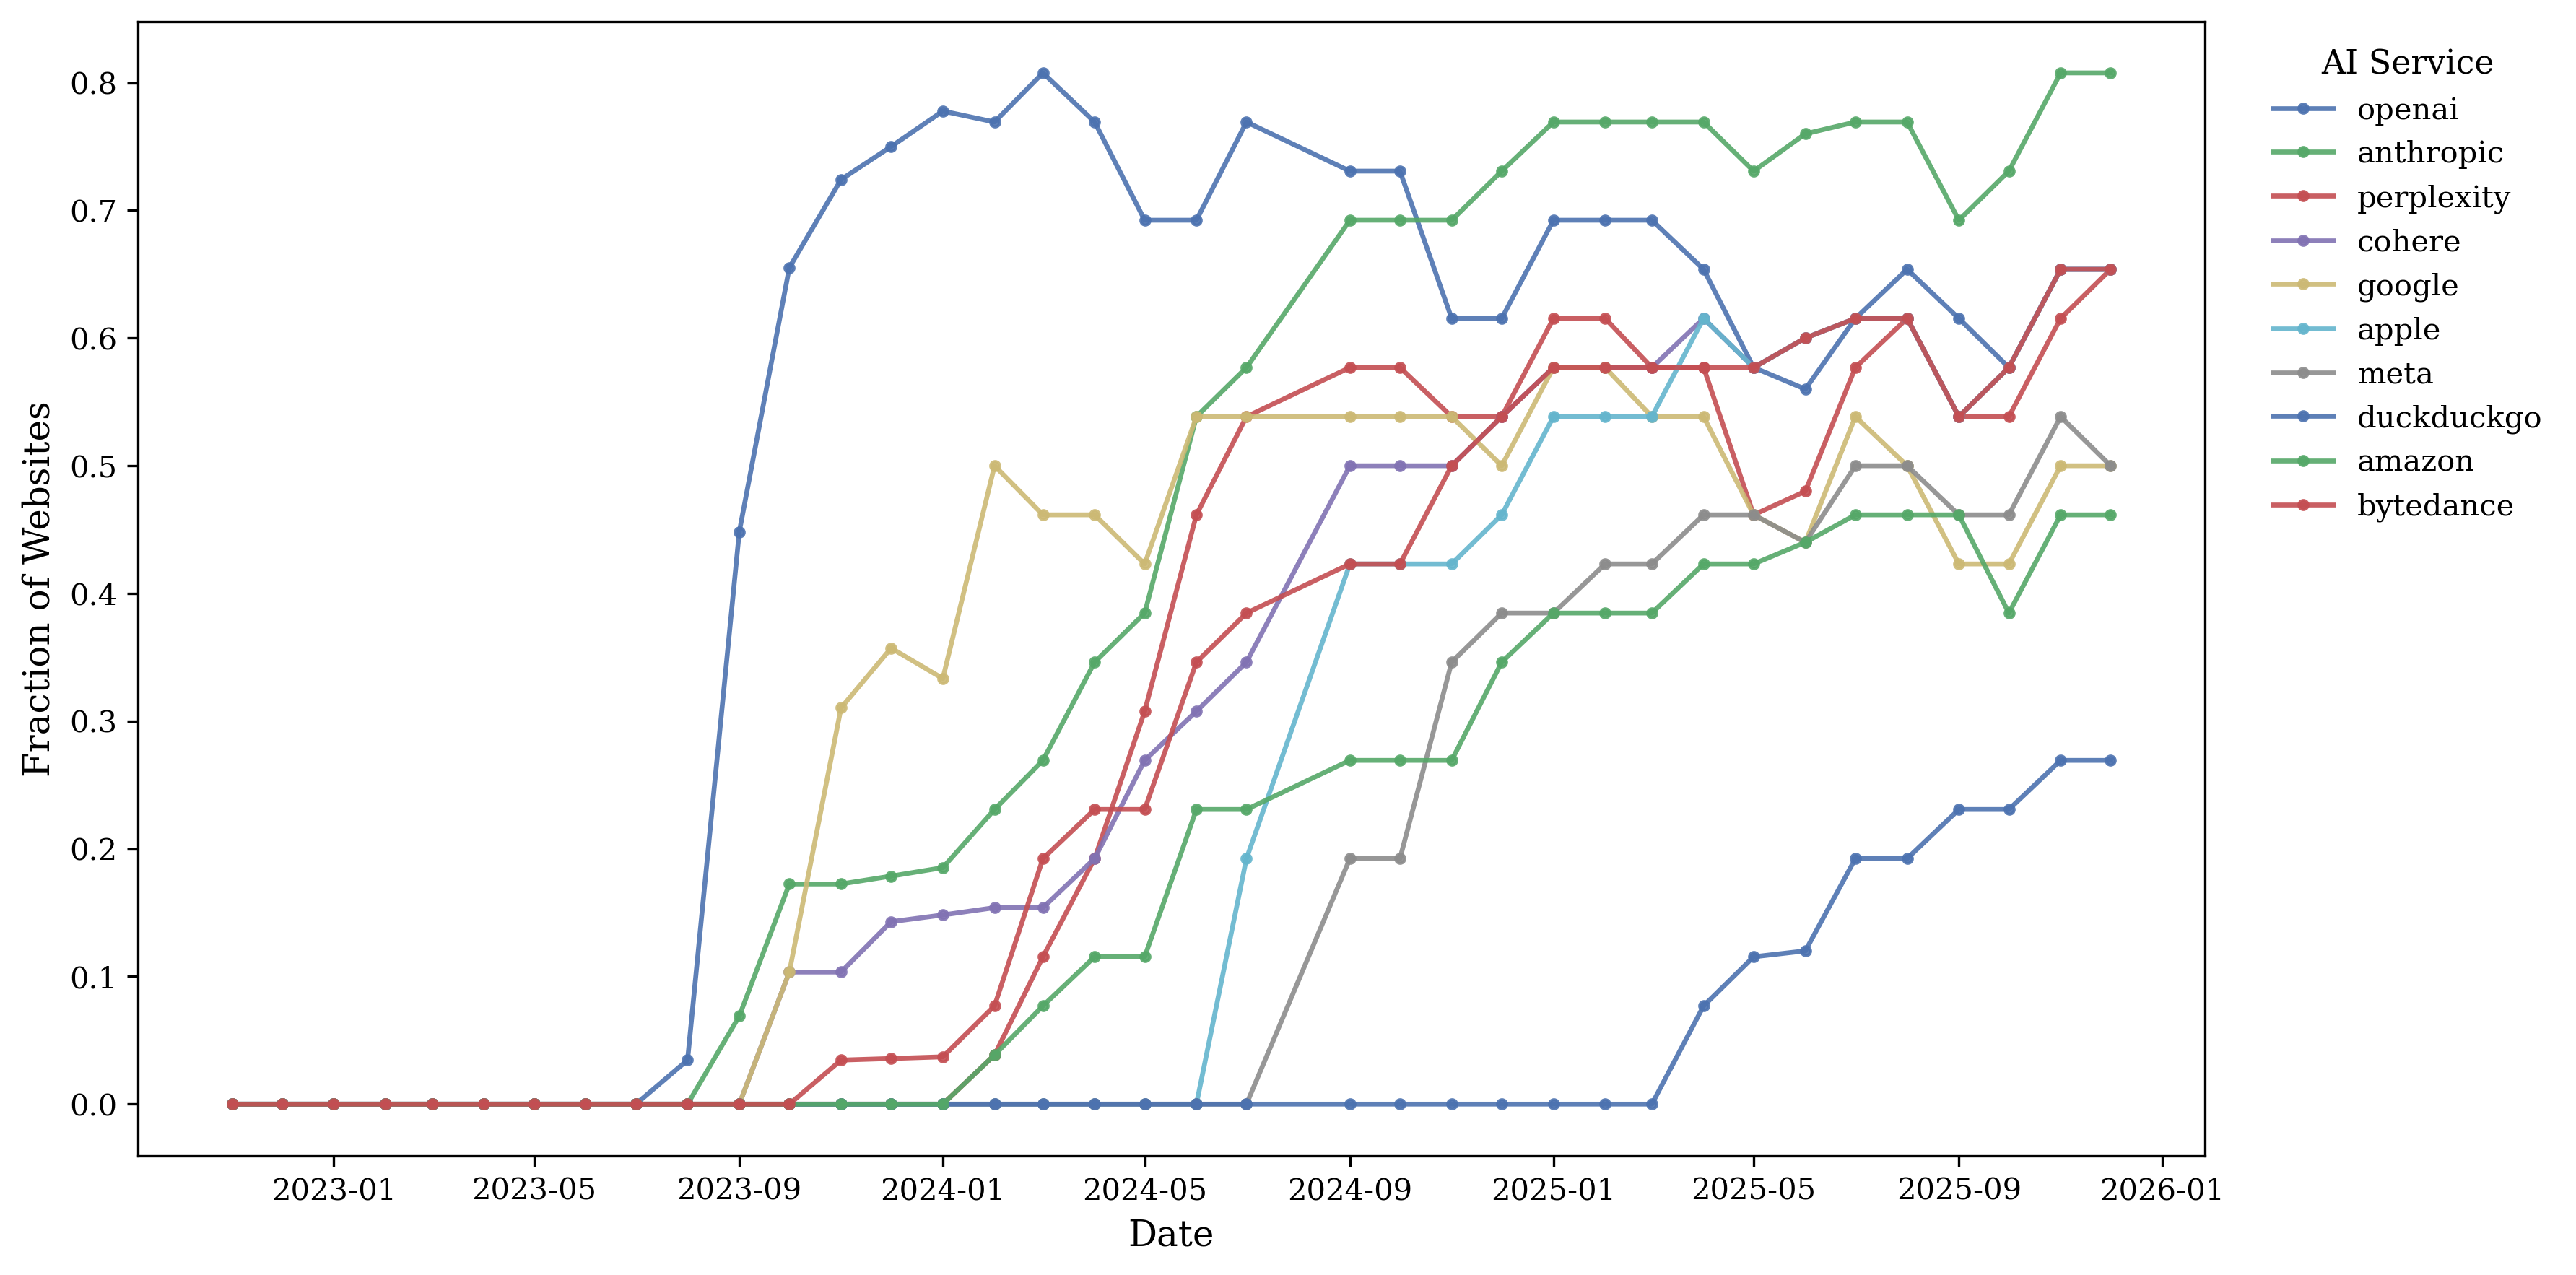
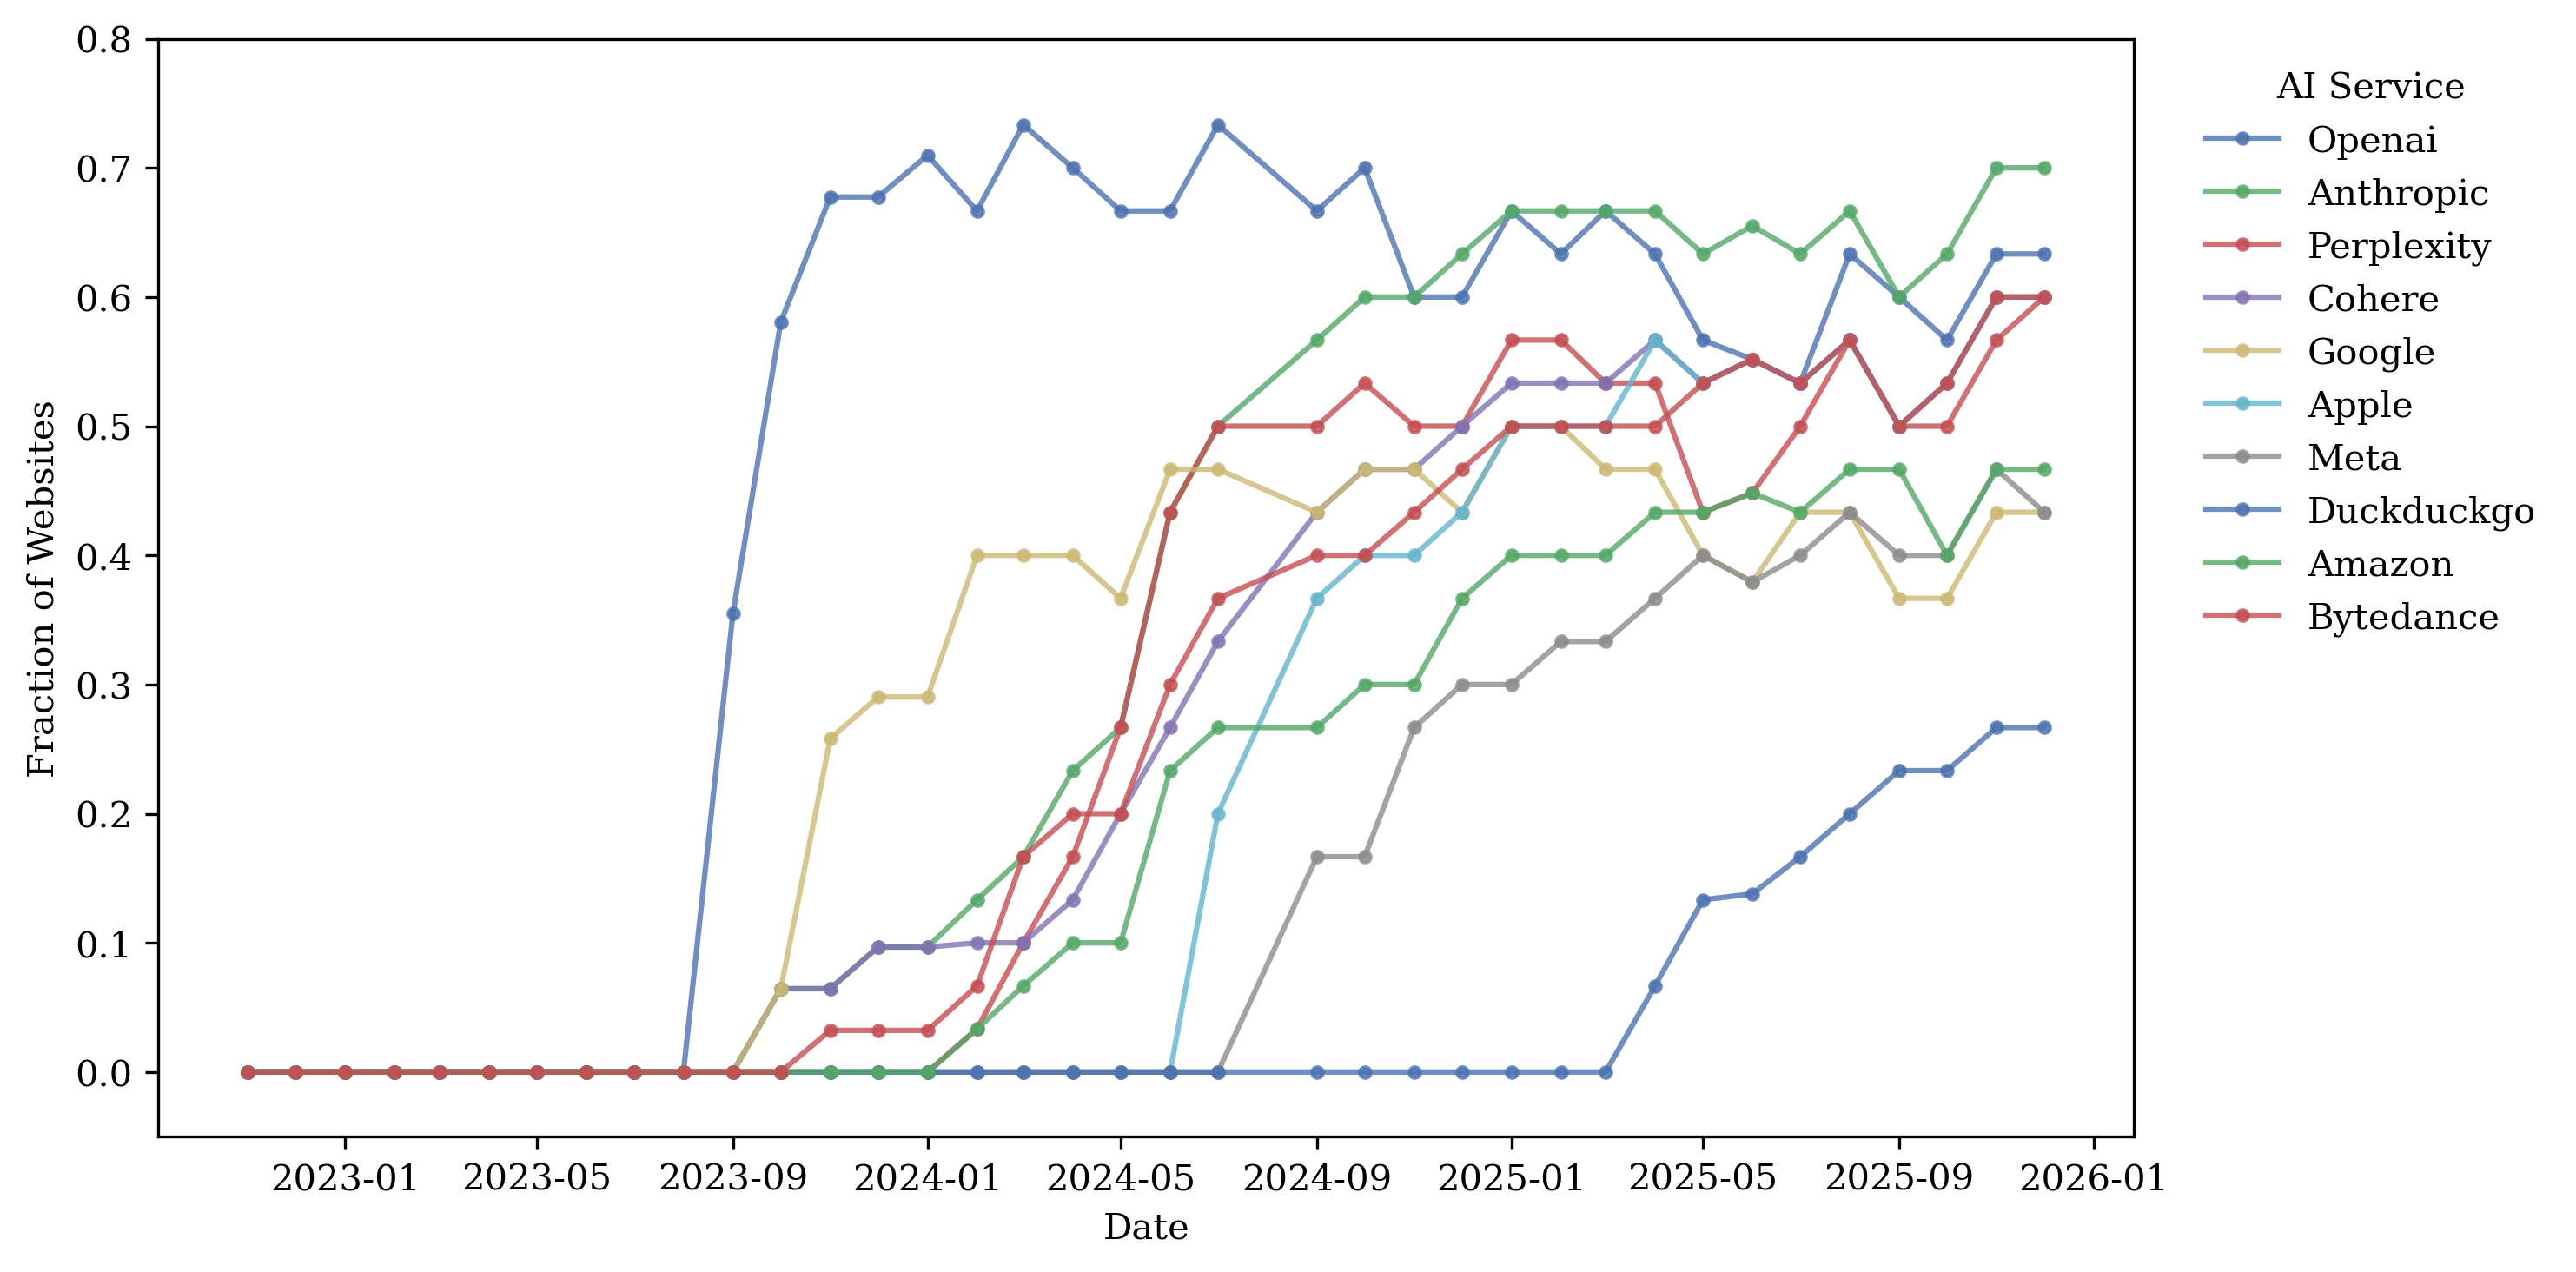
Figure 3 plots the fraction of
websites that disallow GenAI bots over time.
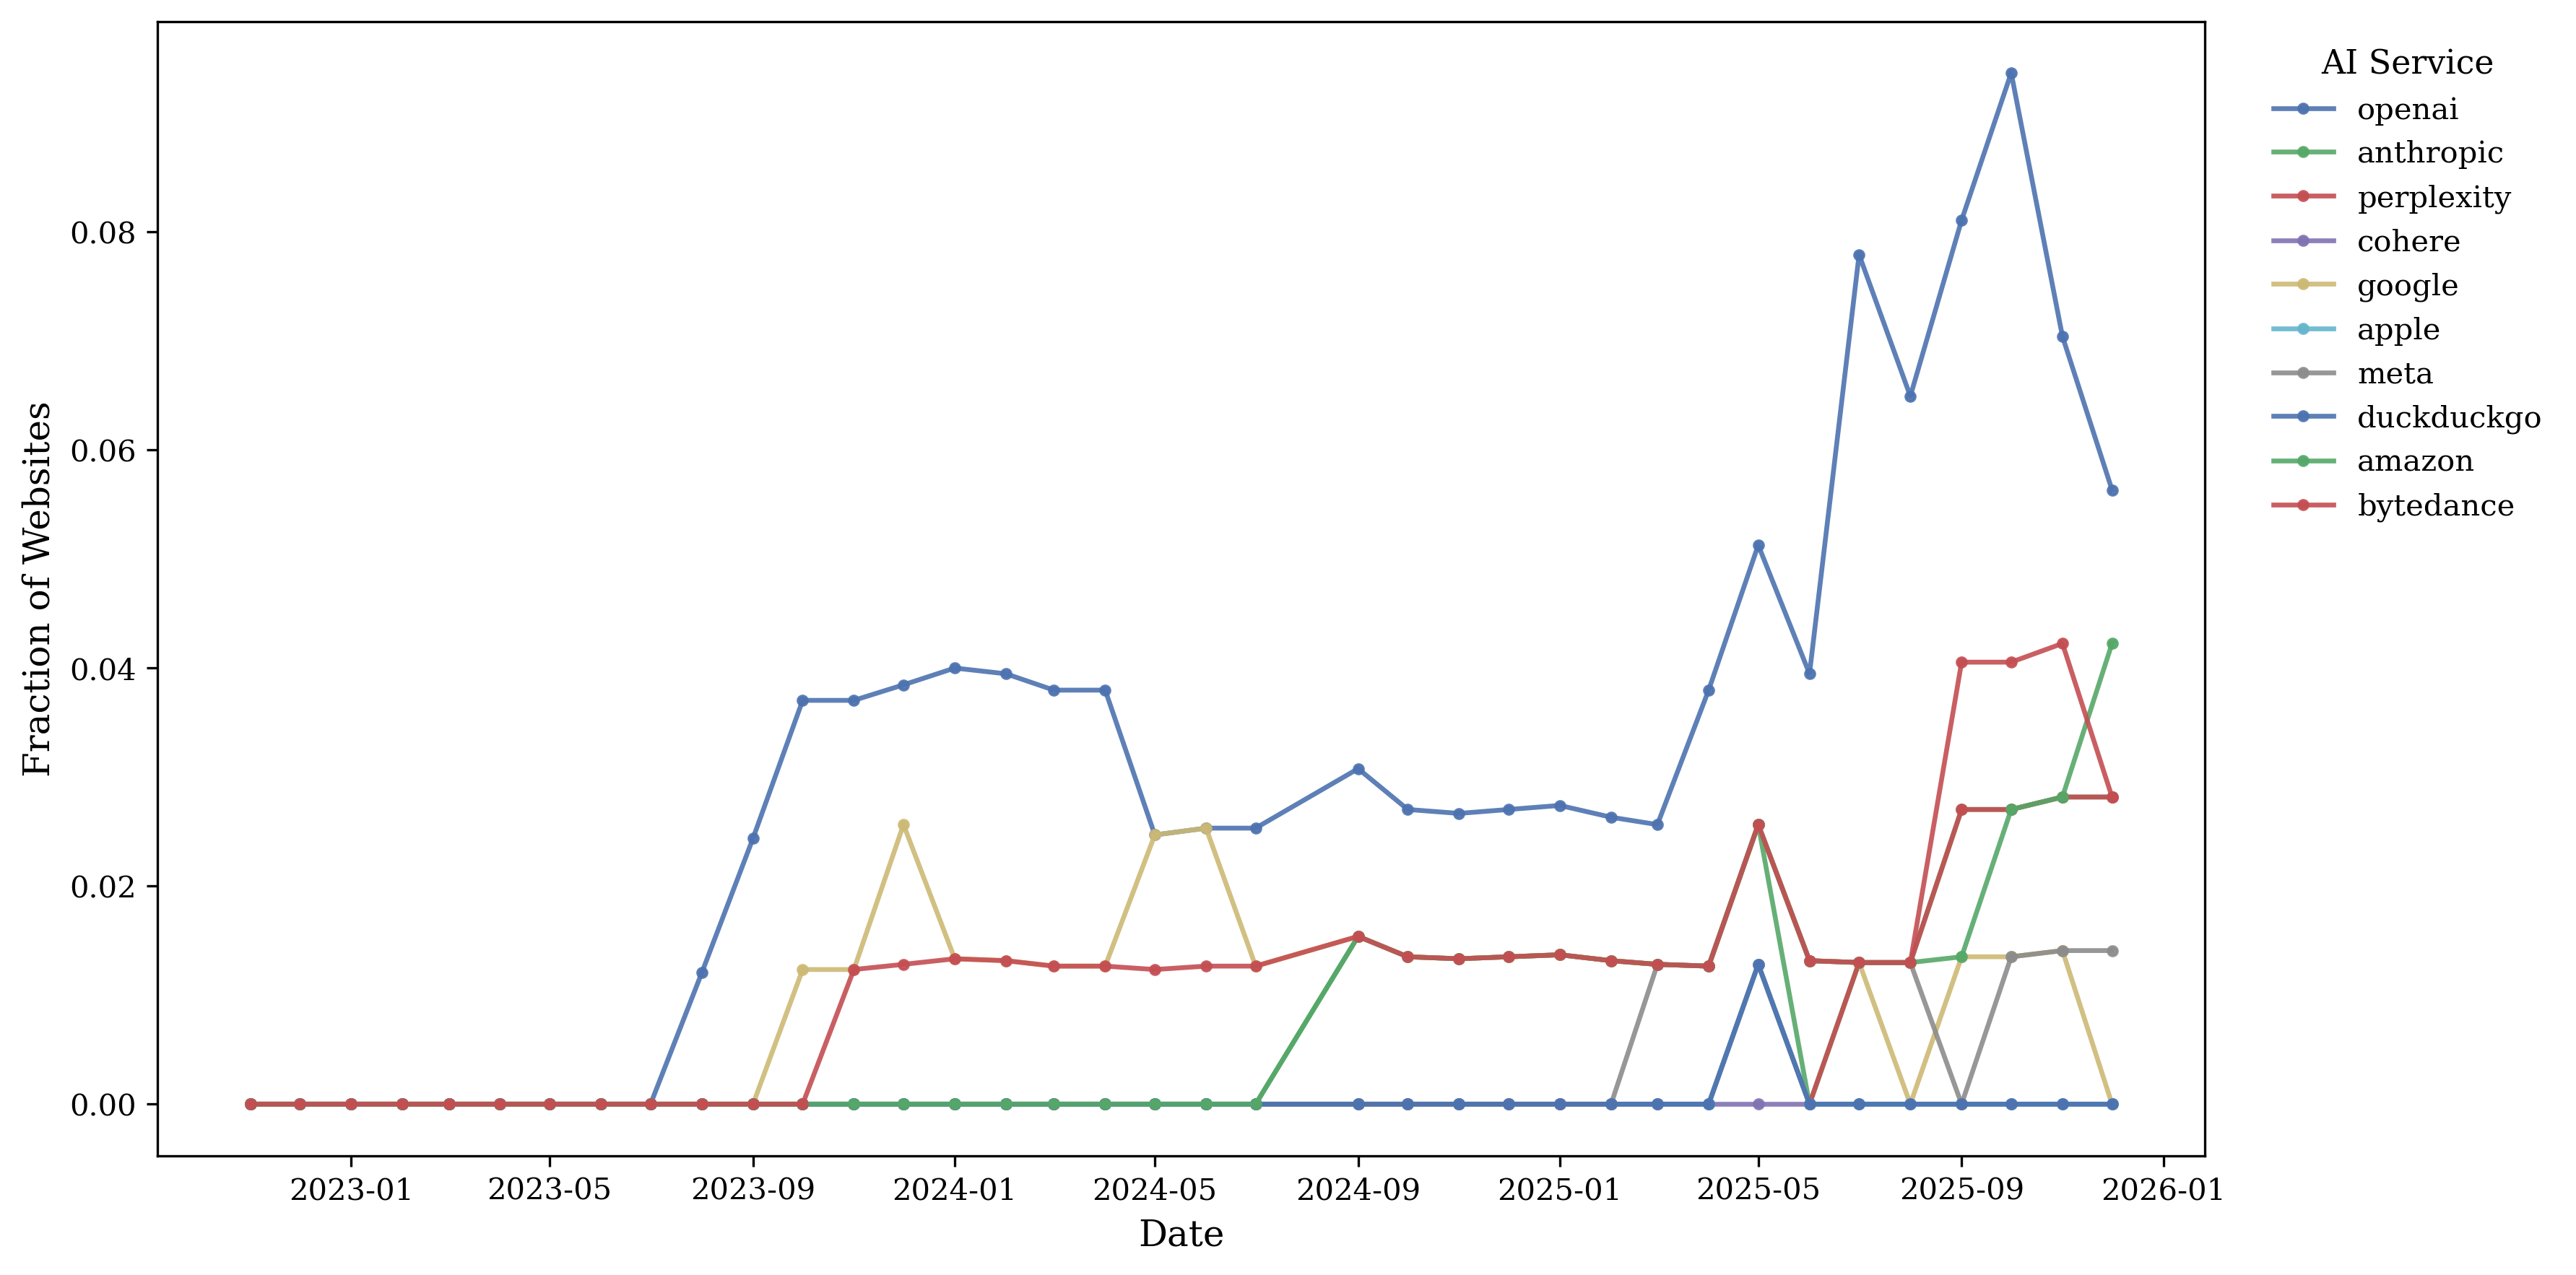
Publishers begin blocking GenAI crawlers as early as mid-2023, with staggered adoption thereafter. OpenAI-related crawlers are blocked first, followed by Anthropic, Perplexity, Cohere, and others. Roughly 80% of publishers in our sample block an OpenAI-related crawler at some point. News publishers also exhibit substantially higher GenAI bot blocking rates than both other domains in the information sector and domains in sectors such as retail. Figure 34 shows blocking ratios for lower-traffic publishers and retailers. The blocking ratio among the top 500 news publishing websites is below 60%, whereas it is below 10% among the top retailers.
We then quantify the effect of blocking GenAI crawlers on publisher
traffic. The outcome $`Y_{it}`$ is the log of monthly visits to
publisher $`i`$ in month $`t`$. Let $`G_i`$ denote the month in which
publisher $`i`$ first introduces a Disallow rule for a GPT-related
crawler in its robots.txt. Let $`G_{i,g} = \mathbf{1}\{G_i = g\}`$
indicate membership in adoption cohort $`g`$. The treatment indicator is
$`D_{i,t} = \mathbf{1}\{t \ge G_i\}`$, so $`D_{i,t}=1`$ from the first
blocking month onward. We focus on the ATT among eventual adopters by
restricting the sample to publishers that block GPT-related crawlers by
the end of our sample. For publishers that later remove the Disallow
rule, we drop observations after the first unblocking month.
Following , the parameter of interest is
\begin{align}
   \nonumber \text{ATT}_{g,t}
    &= \mathbb{E}\big[ Y_{i,t}(g) - Y_{i,t}(0) \,\big|\, G_{i,g} = 1 \big] \\
    &= \mathbb{E}\big[ Y_{i,t} - Y_{i,g-1} \,\big|\, G_{i,g} = 1 \big]
     \;-\;
       \mathbb{E}\big[ Y_{i,t} - Y_{i,g-1} \,\big|\, D_{i,t} = 0,\, G_{i,g} = 0 \big].
\end{align}Here, $`Y_{i,t}(g)`$ denotes the potential outcome for publisher $`i`$ in month $`t`$ if it starts blocking in month $`g`$, and $`Y_{i,t}(0)`$ denotes the potential outcome if it has not yet blocked by month $`t`$. In the second line, the first term is the observed change in outcomes for cohort $`g`$ between the pre-period $`g-1`$ and month $`t`$, while the second term is the corresponding change for publishers that are not yet treated in month $`t`$ ($`D_{i,t}=0`$) and belong to other cohorts ($`G_{i,g}=0`$). Because we restrict the sample to eventual adopters, these controls are all future adopters (not-yet-treated), and never-treated units do not enter the control group.
Identification. Identification relies on a conditional parallel trends assumption among eventually treated publishers. For all $`t \ge g`$ and for all cohorts $`g`$ and $`g' \neq g`$,
\mathbb{E}\big[ Y_{i,t}(0) - Y_{i,g-1}(0) \,\big|\, G_{i,g}=1, X_i \big]
=
\mathbb{E}\big[ Y_{i,t}(0) - Y_{i,g-1}(0) \,\big|\, D_{i,t}=0, G_{i,g}=0, X_i \big],where $`X_i`$ denotes publisher characteristics. This requires that, conditional on $`X_i`$, the evolution of log monthly traffic that cohort $`g`$ would have experienced in the absence of blocking is the same as that of publishers that have not yet blocked by month $`t`$ but will block in a future month.
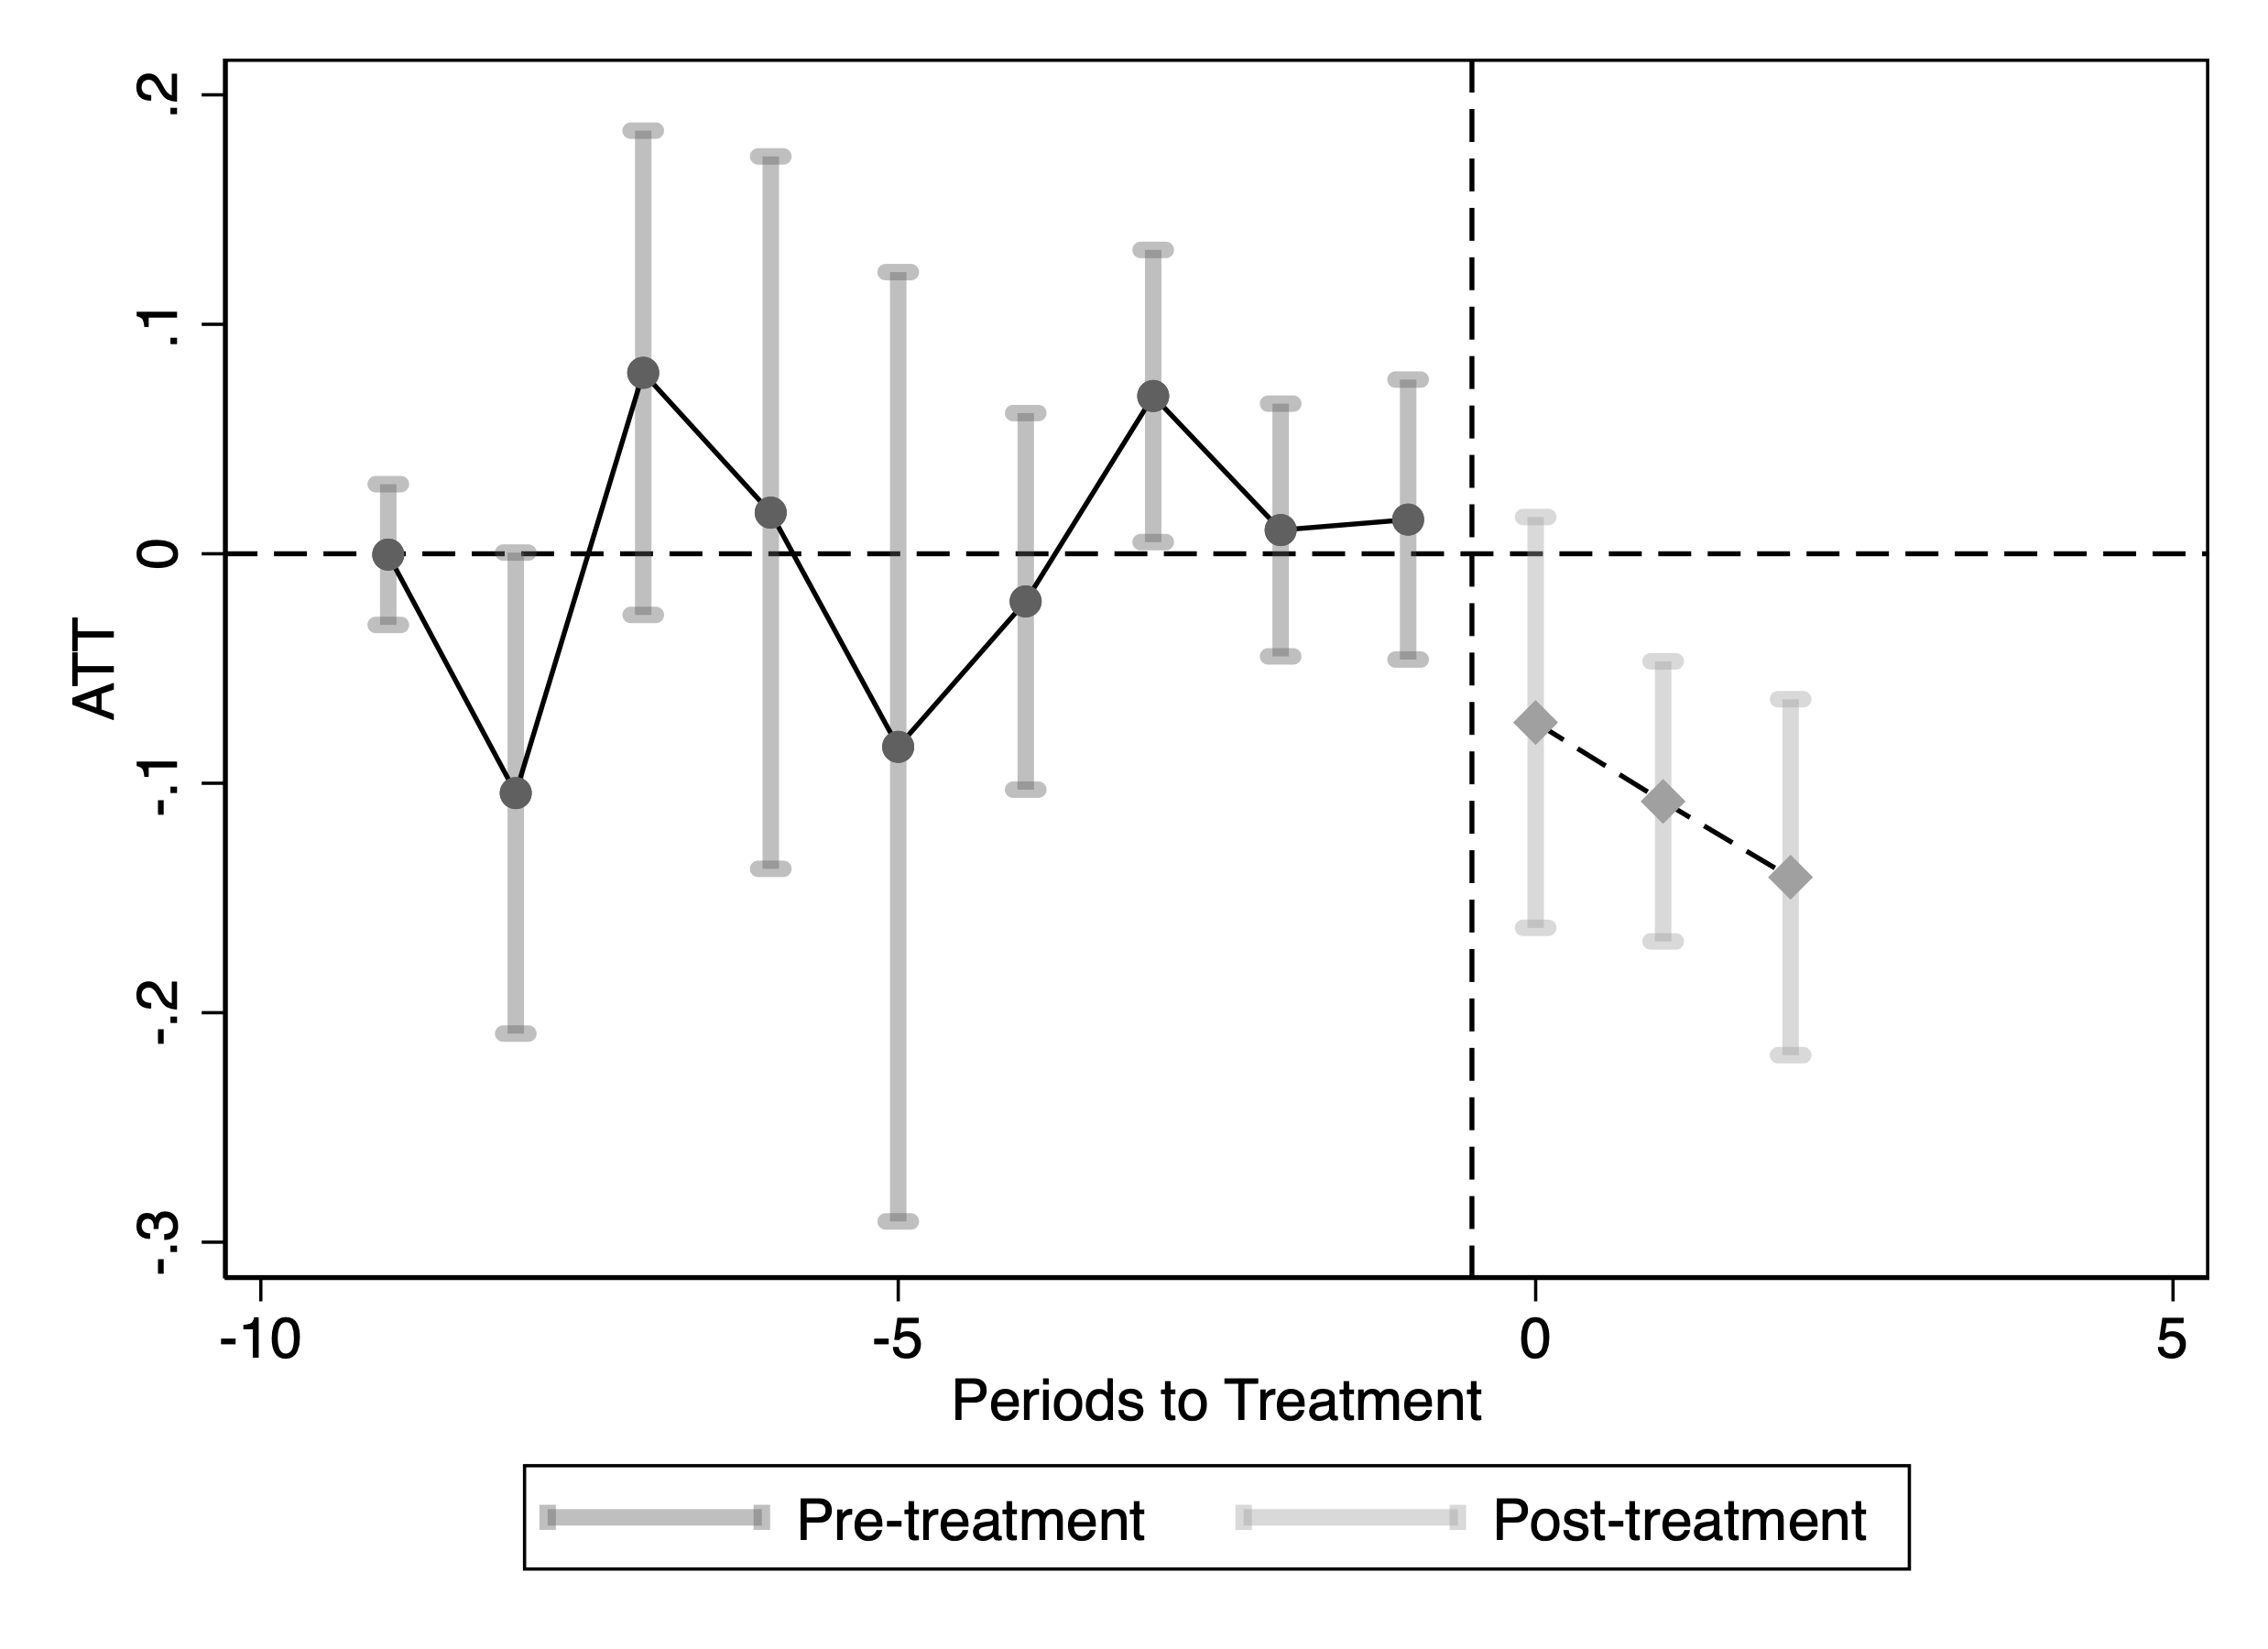
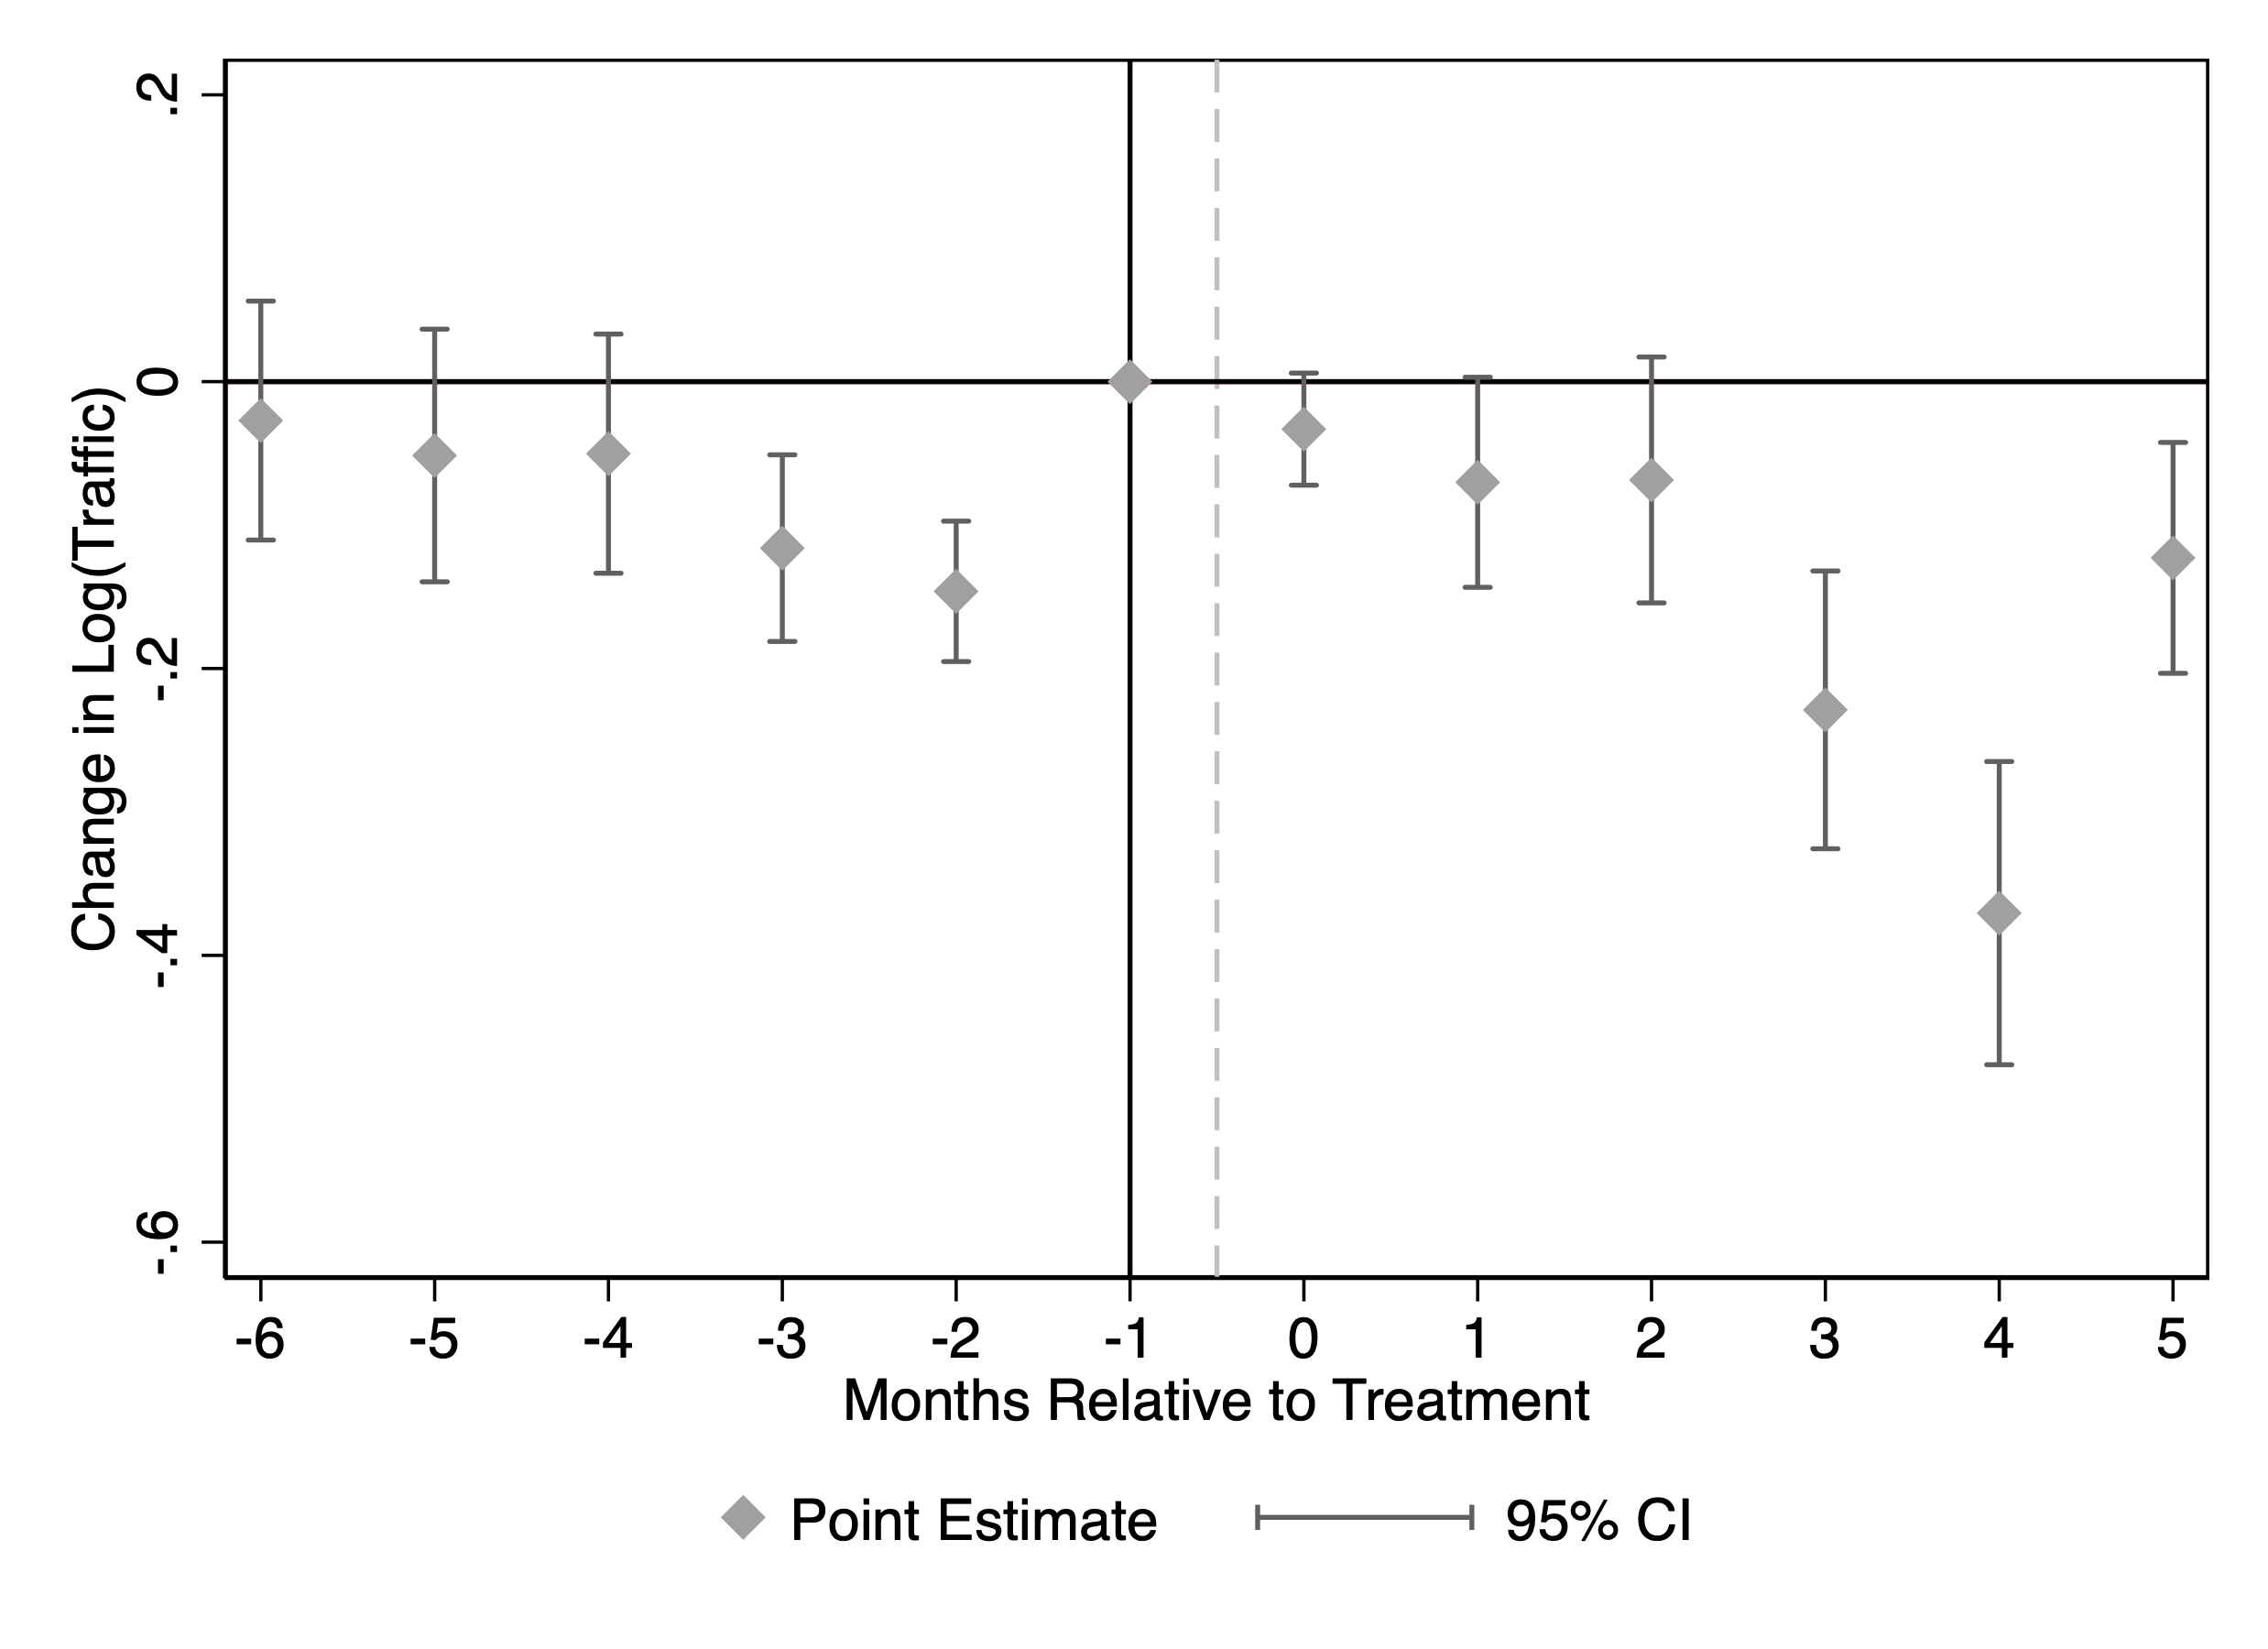
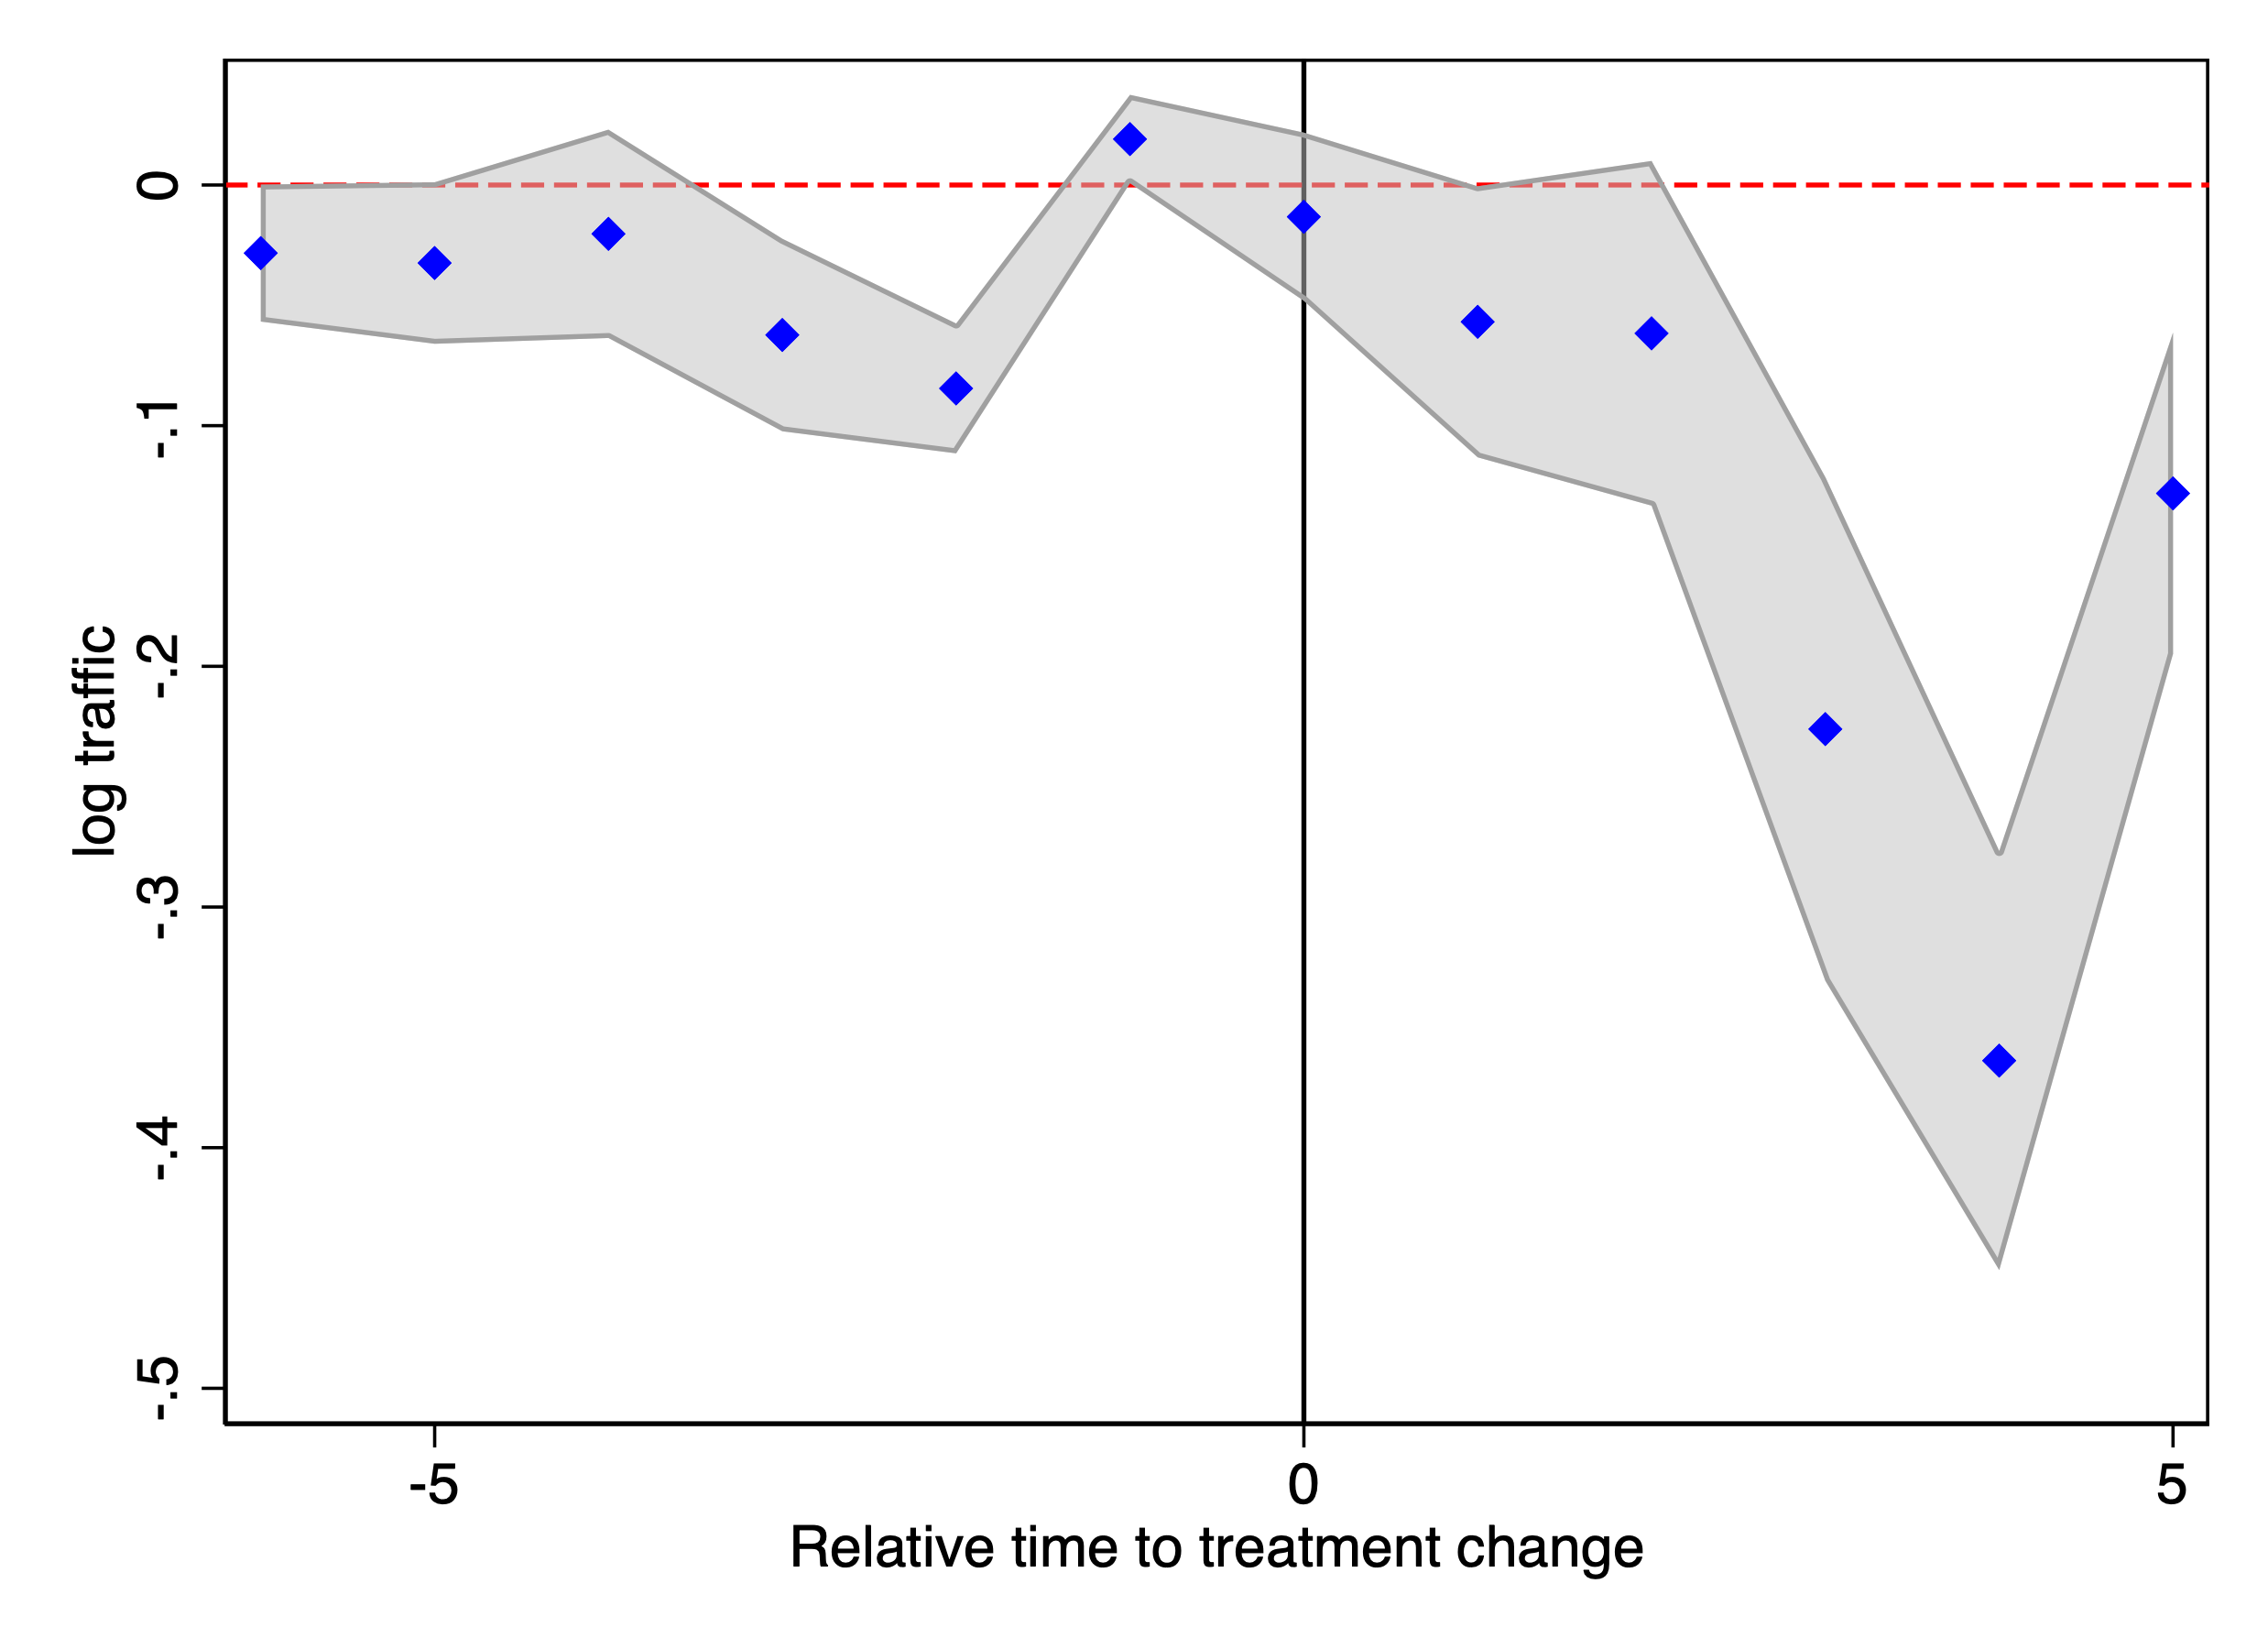
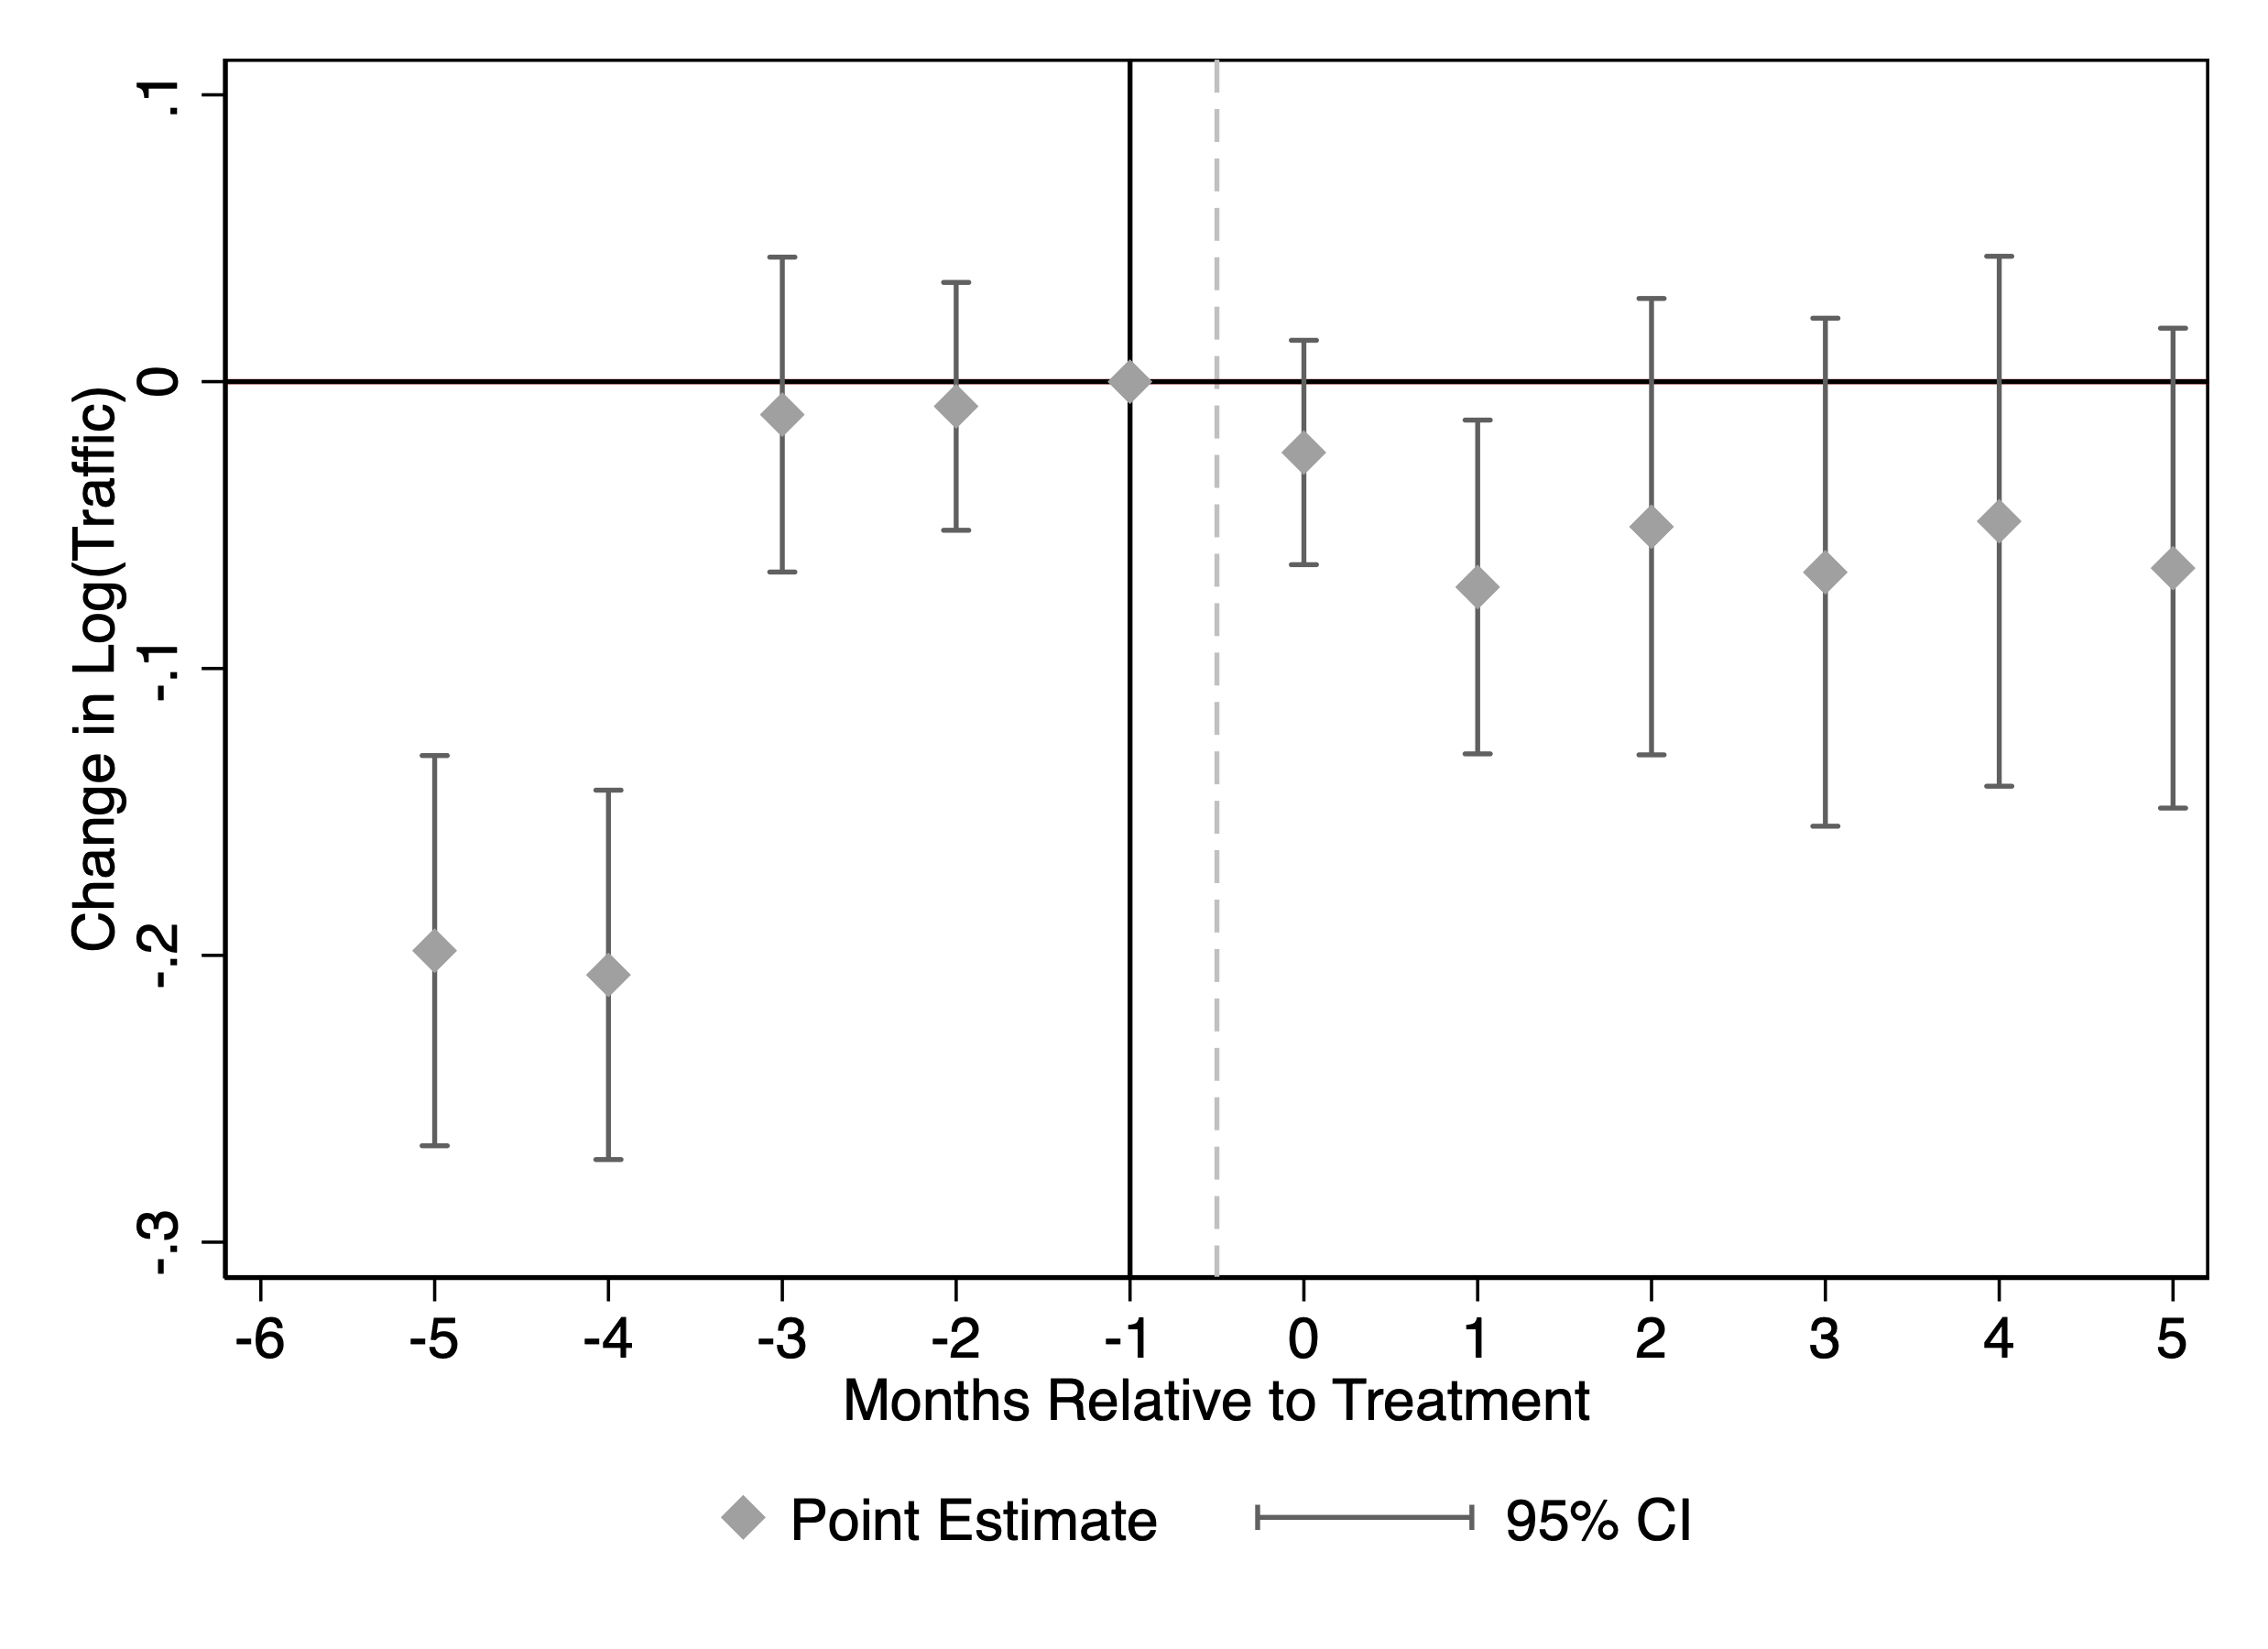
Figure 4 reports the estimates when the outcome is log monthly traffic from SimilarWeb. The event-time coefficients are close to zero and statistically insignificant in the pre-blocking months, providing no evidence of systematic pre-trends. After blocking, the coefficients become negative and remain below zero, indicating that blocking GPT-related bots is associated with a persistent decline in total traffic for treated publishers.
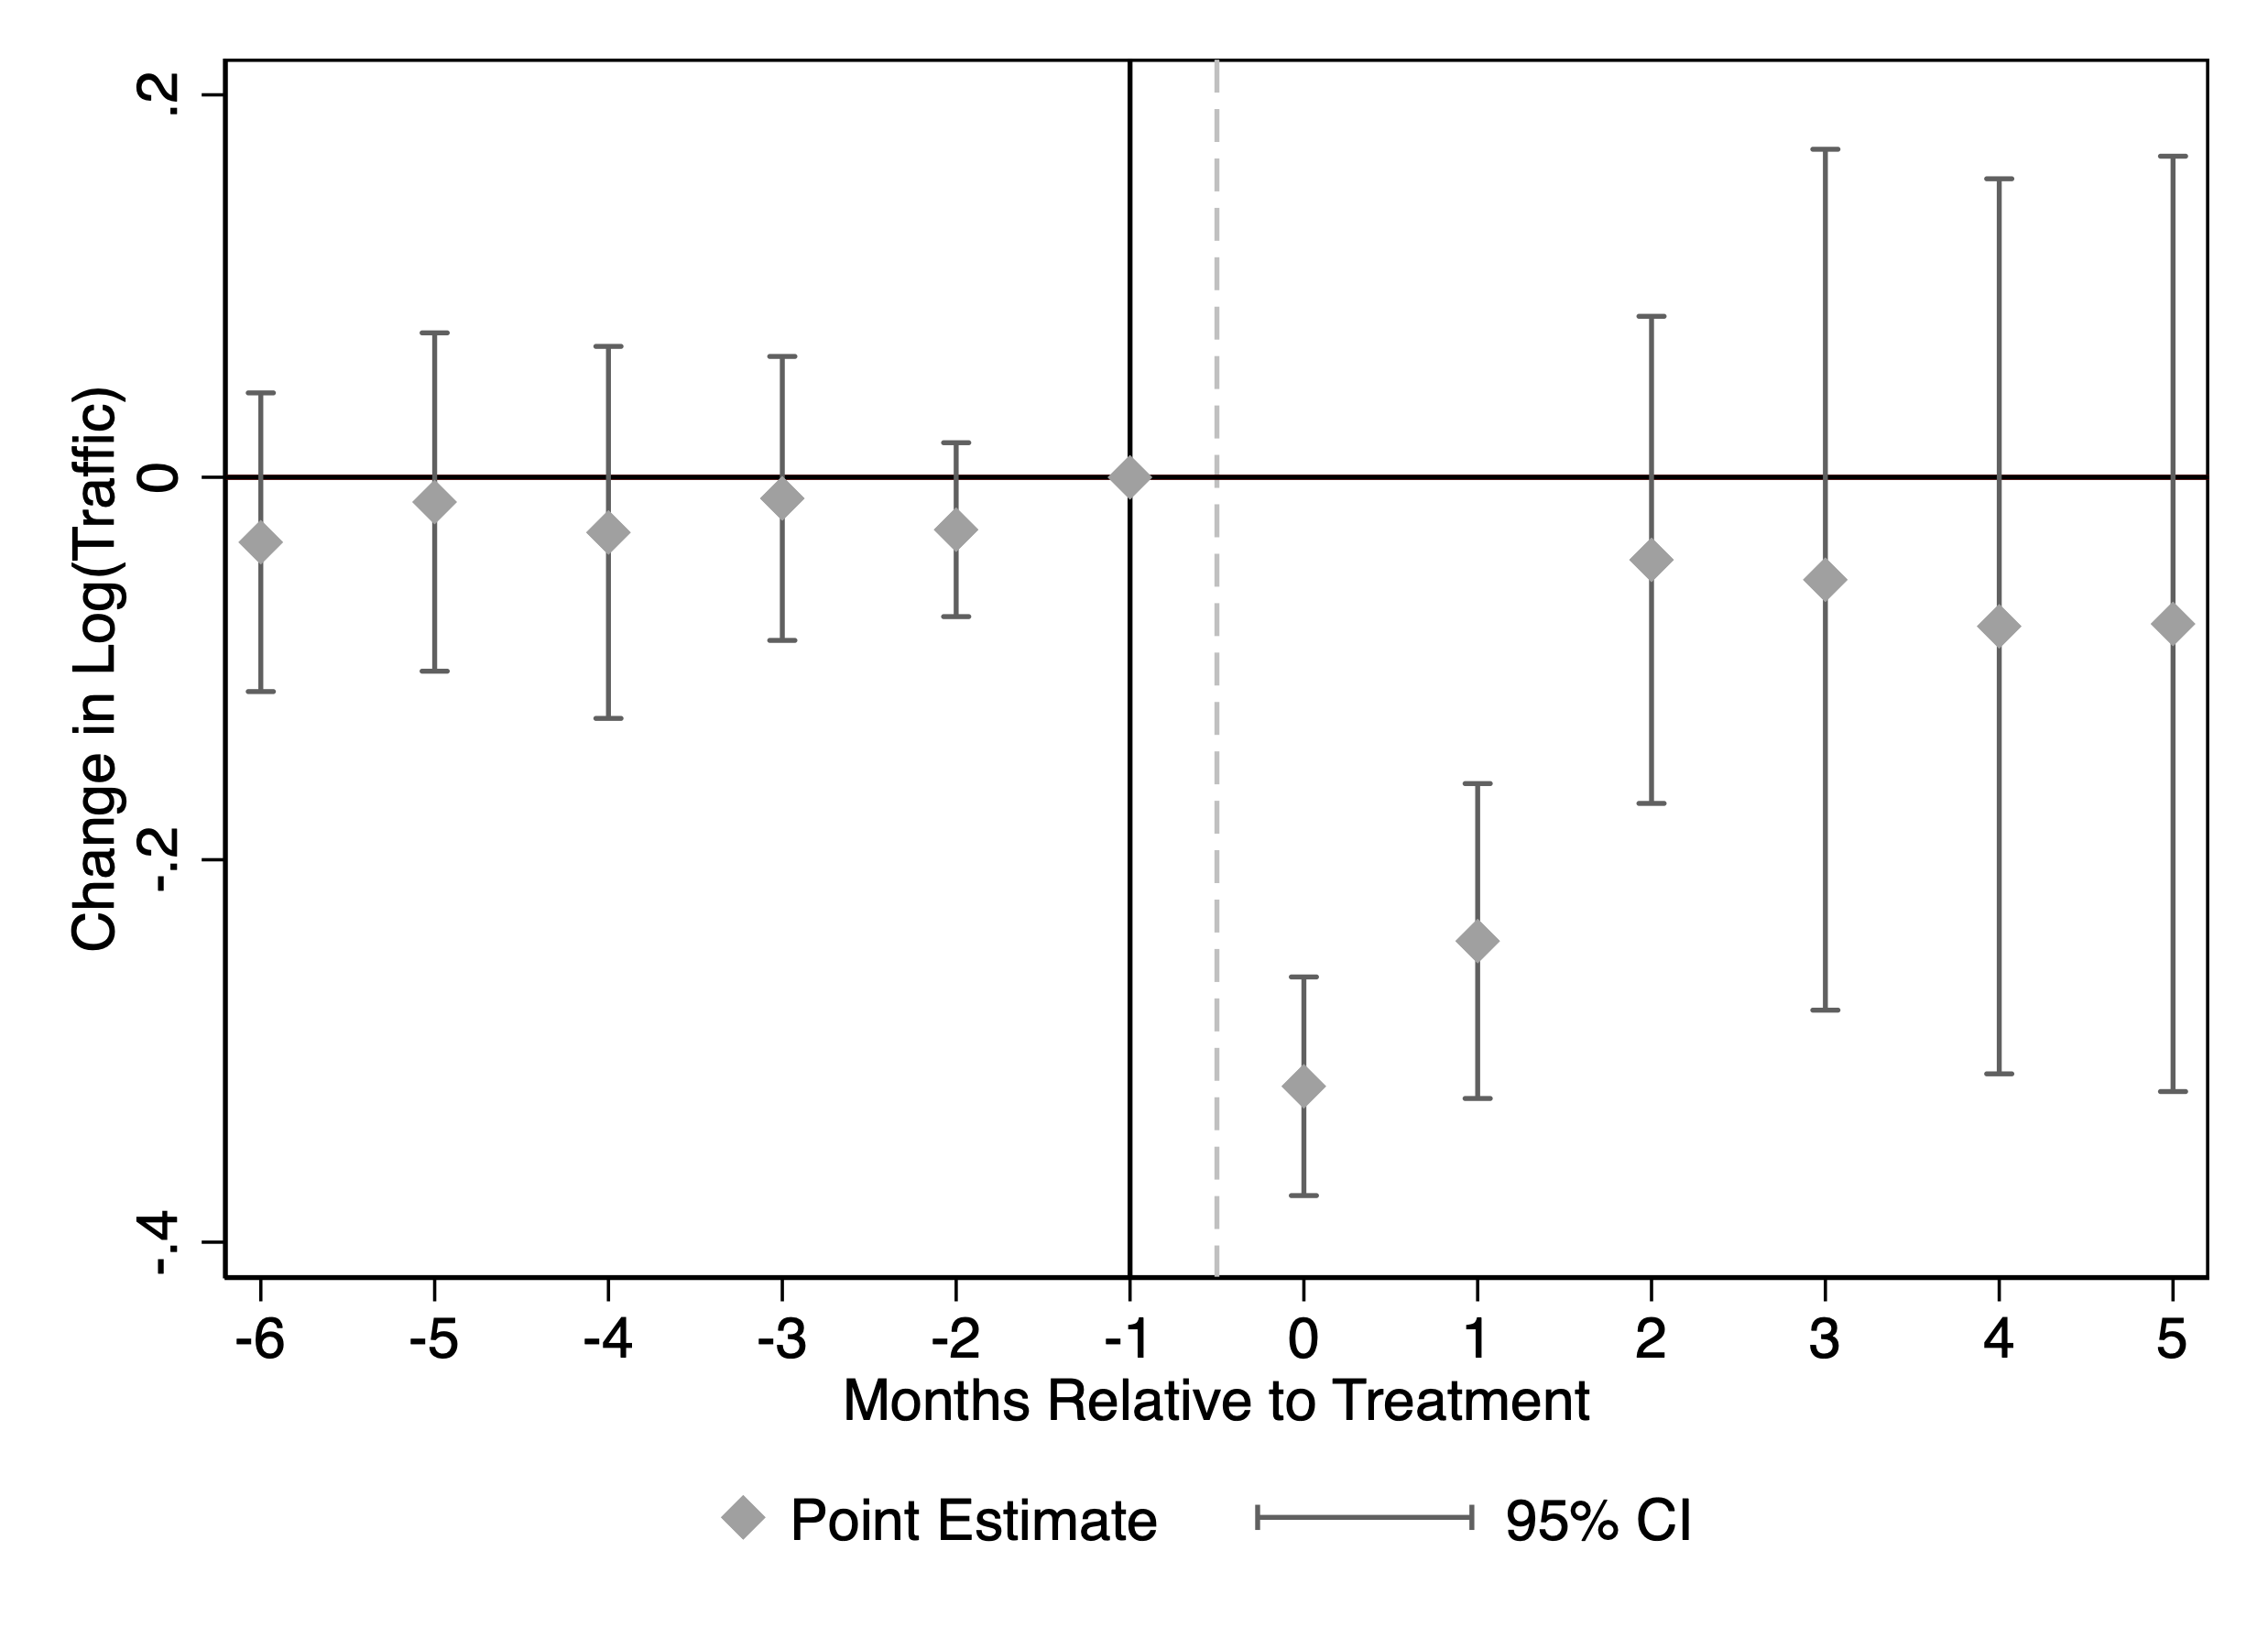
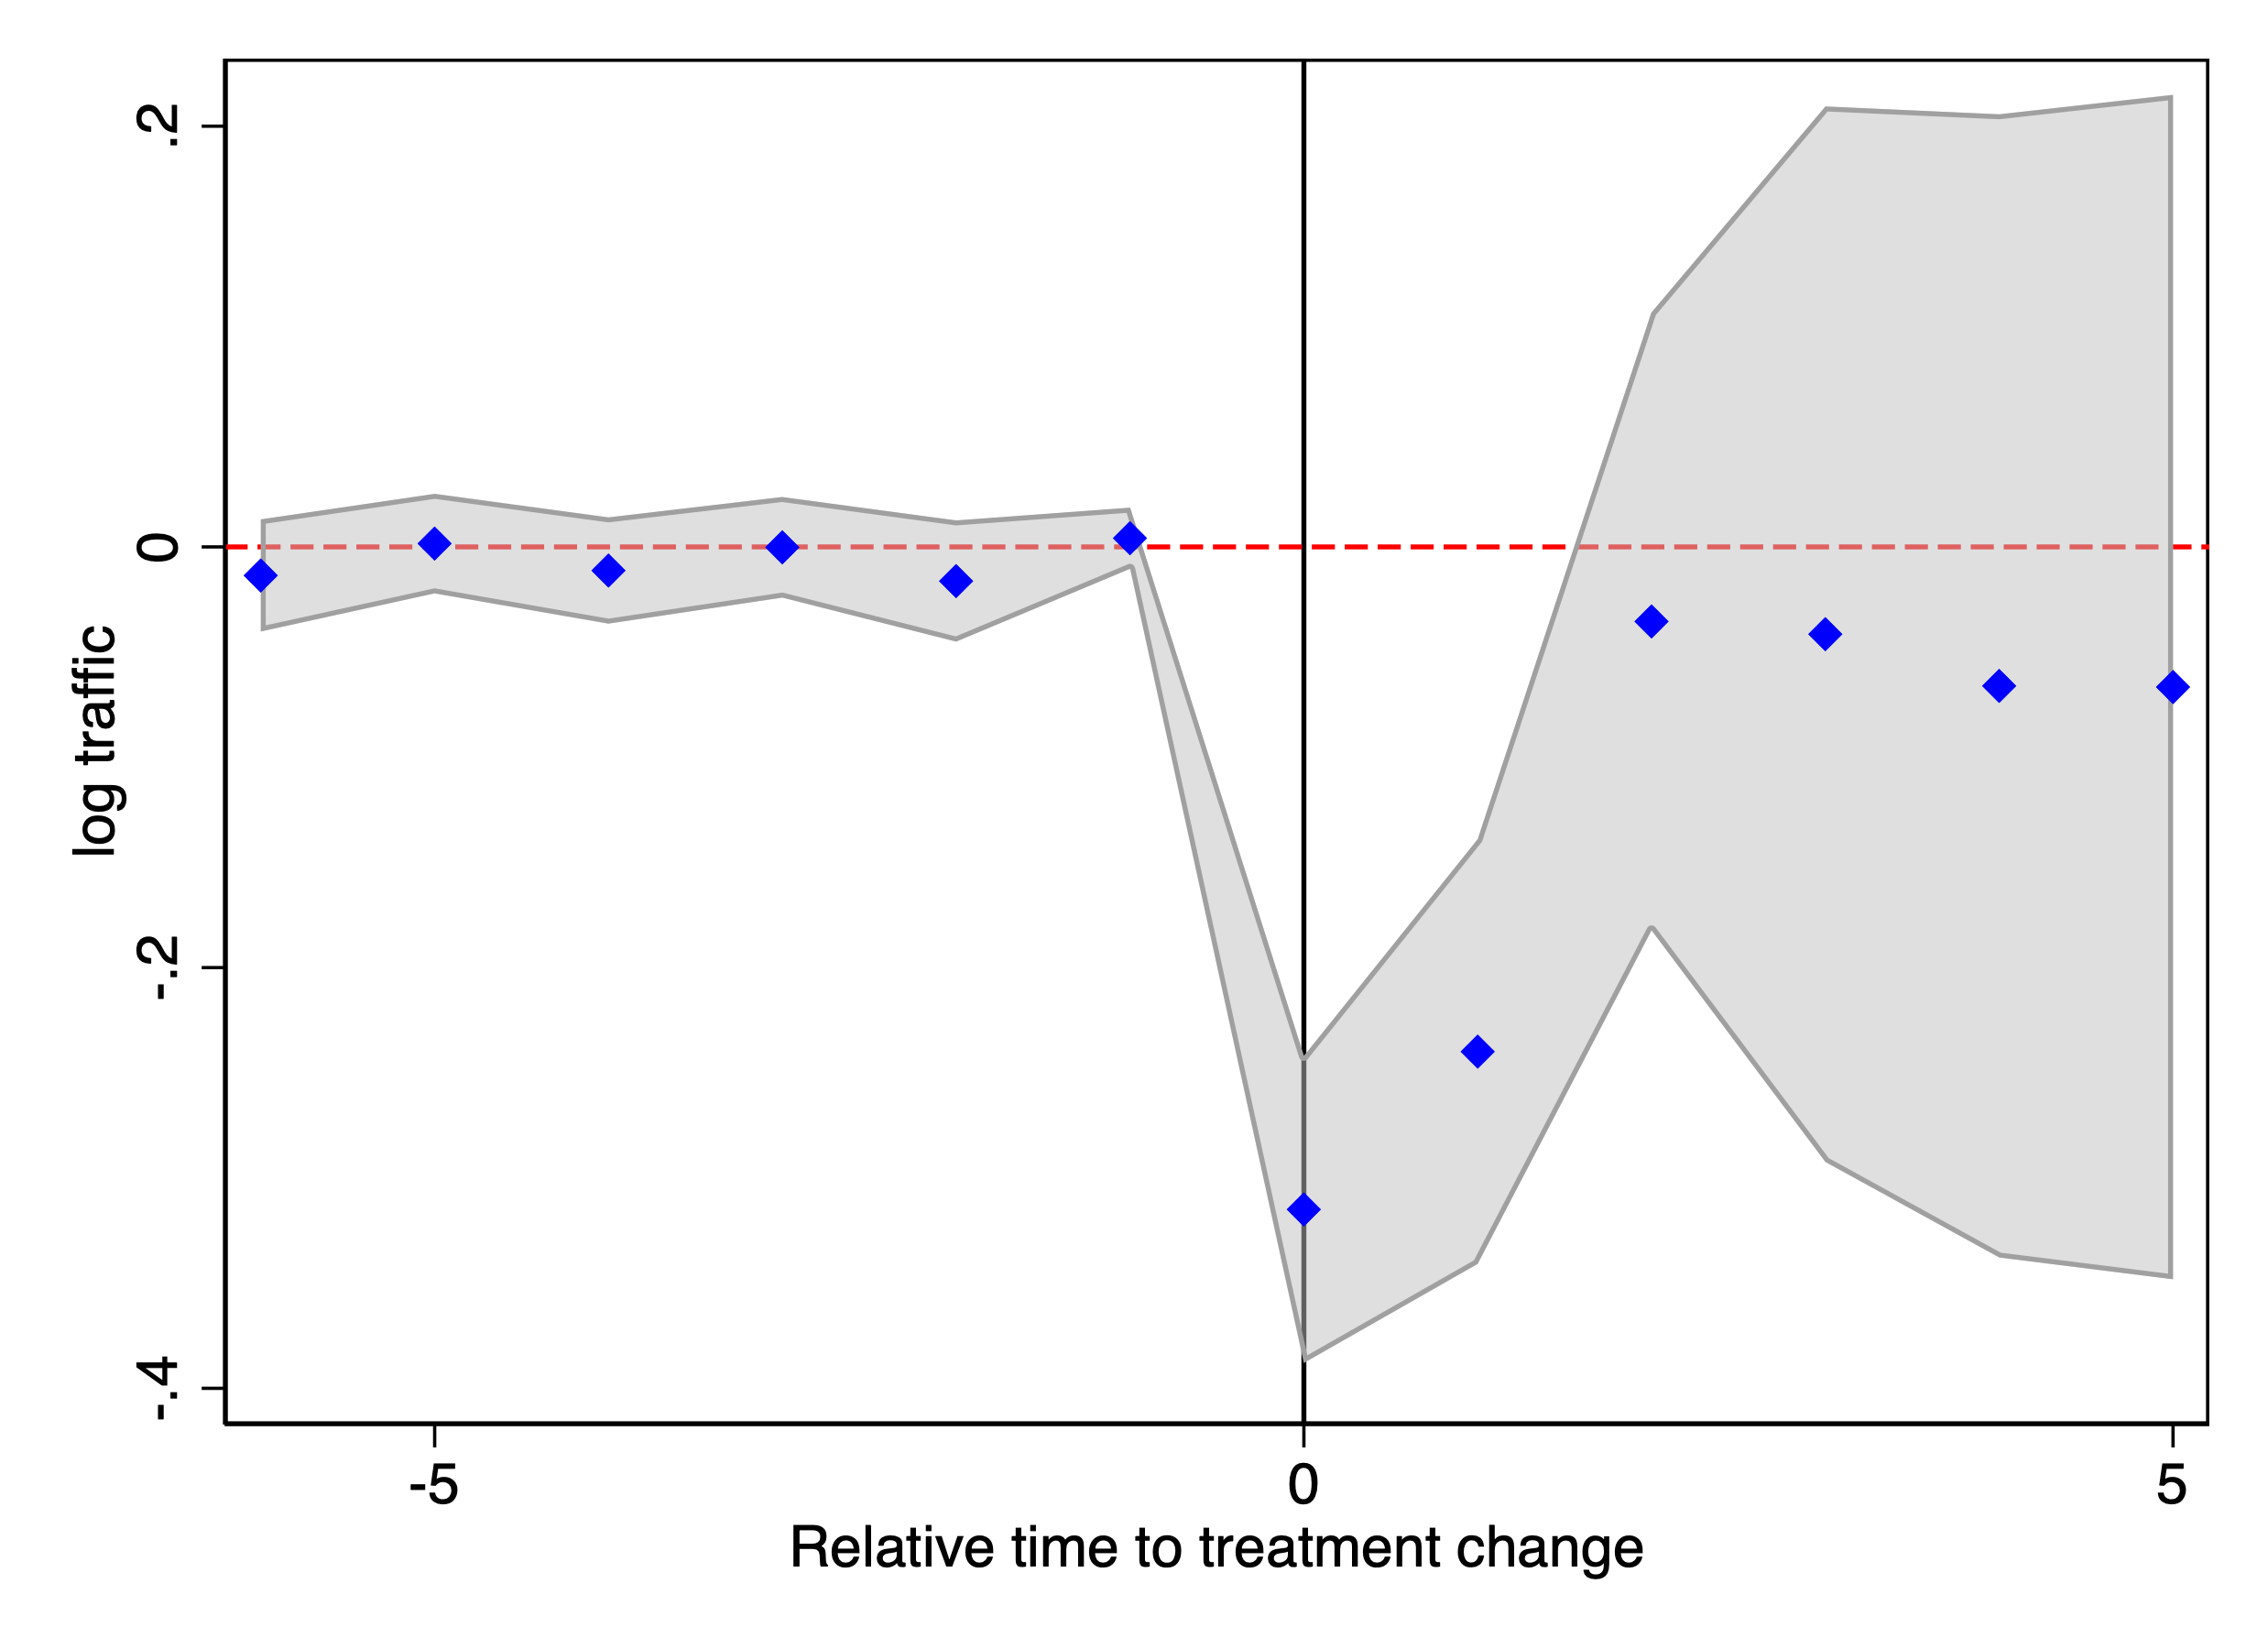
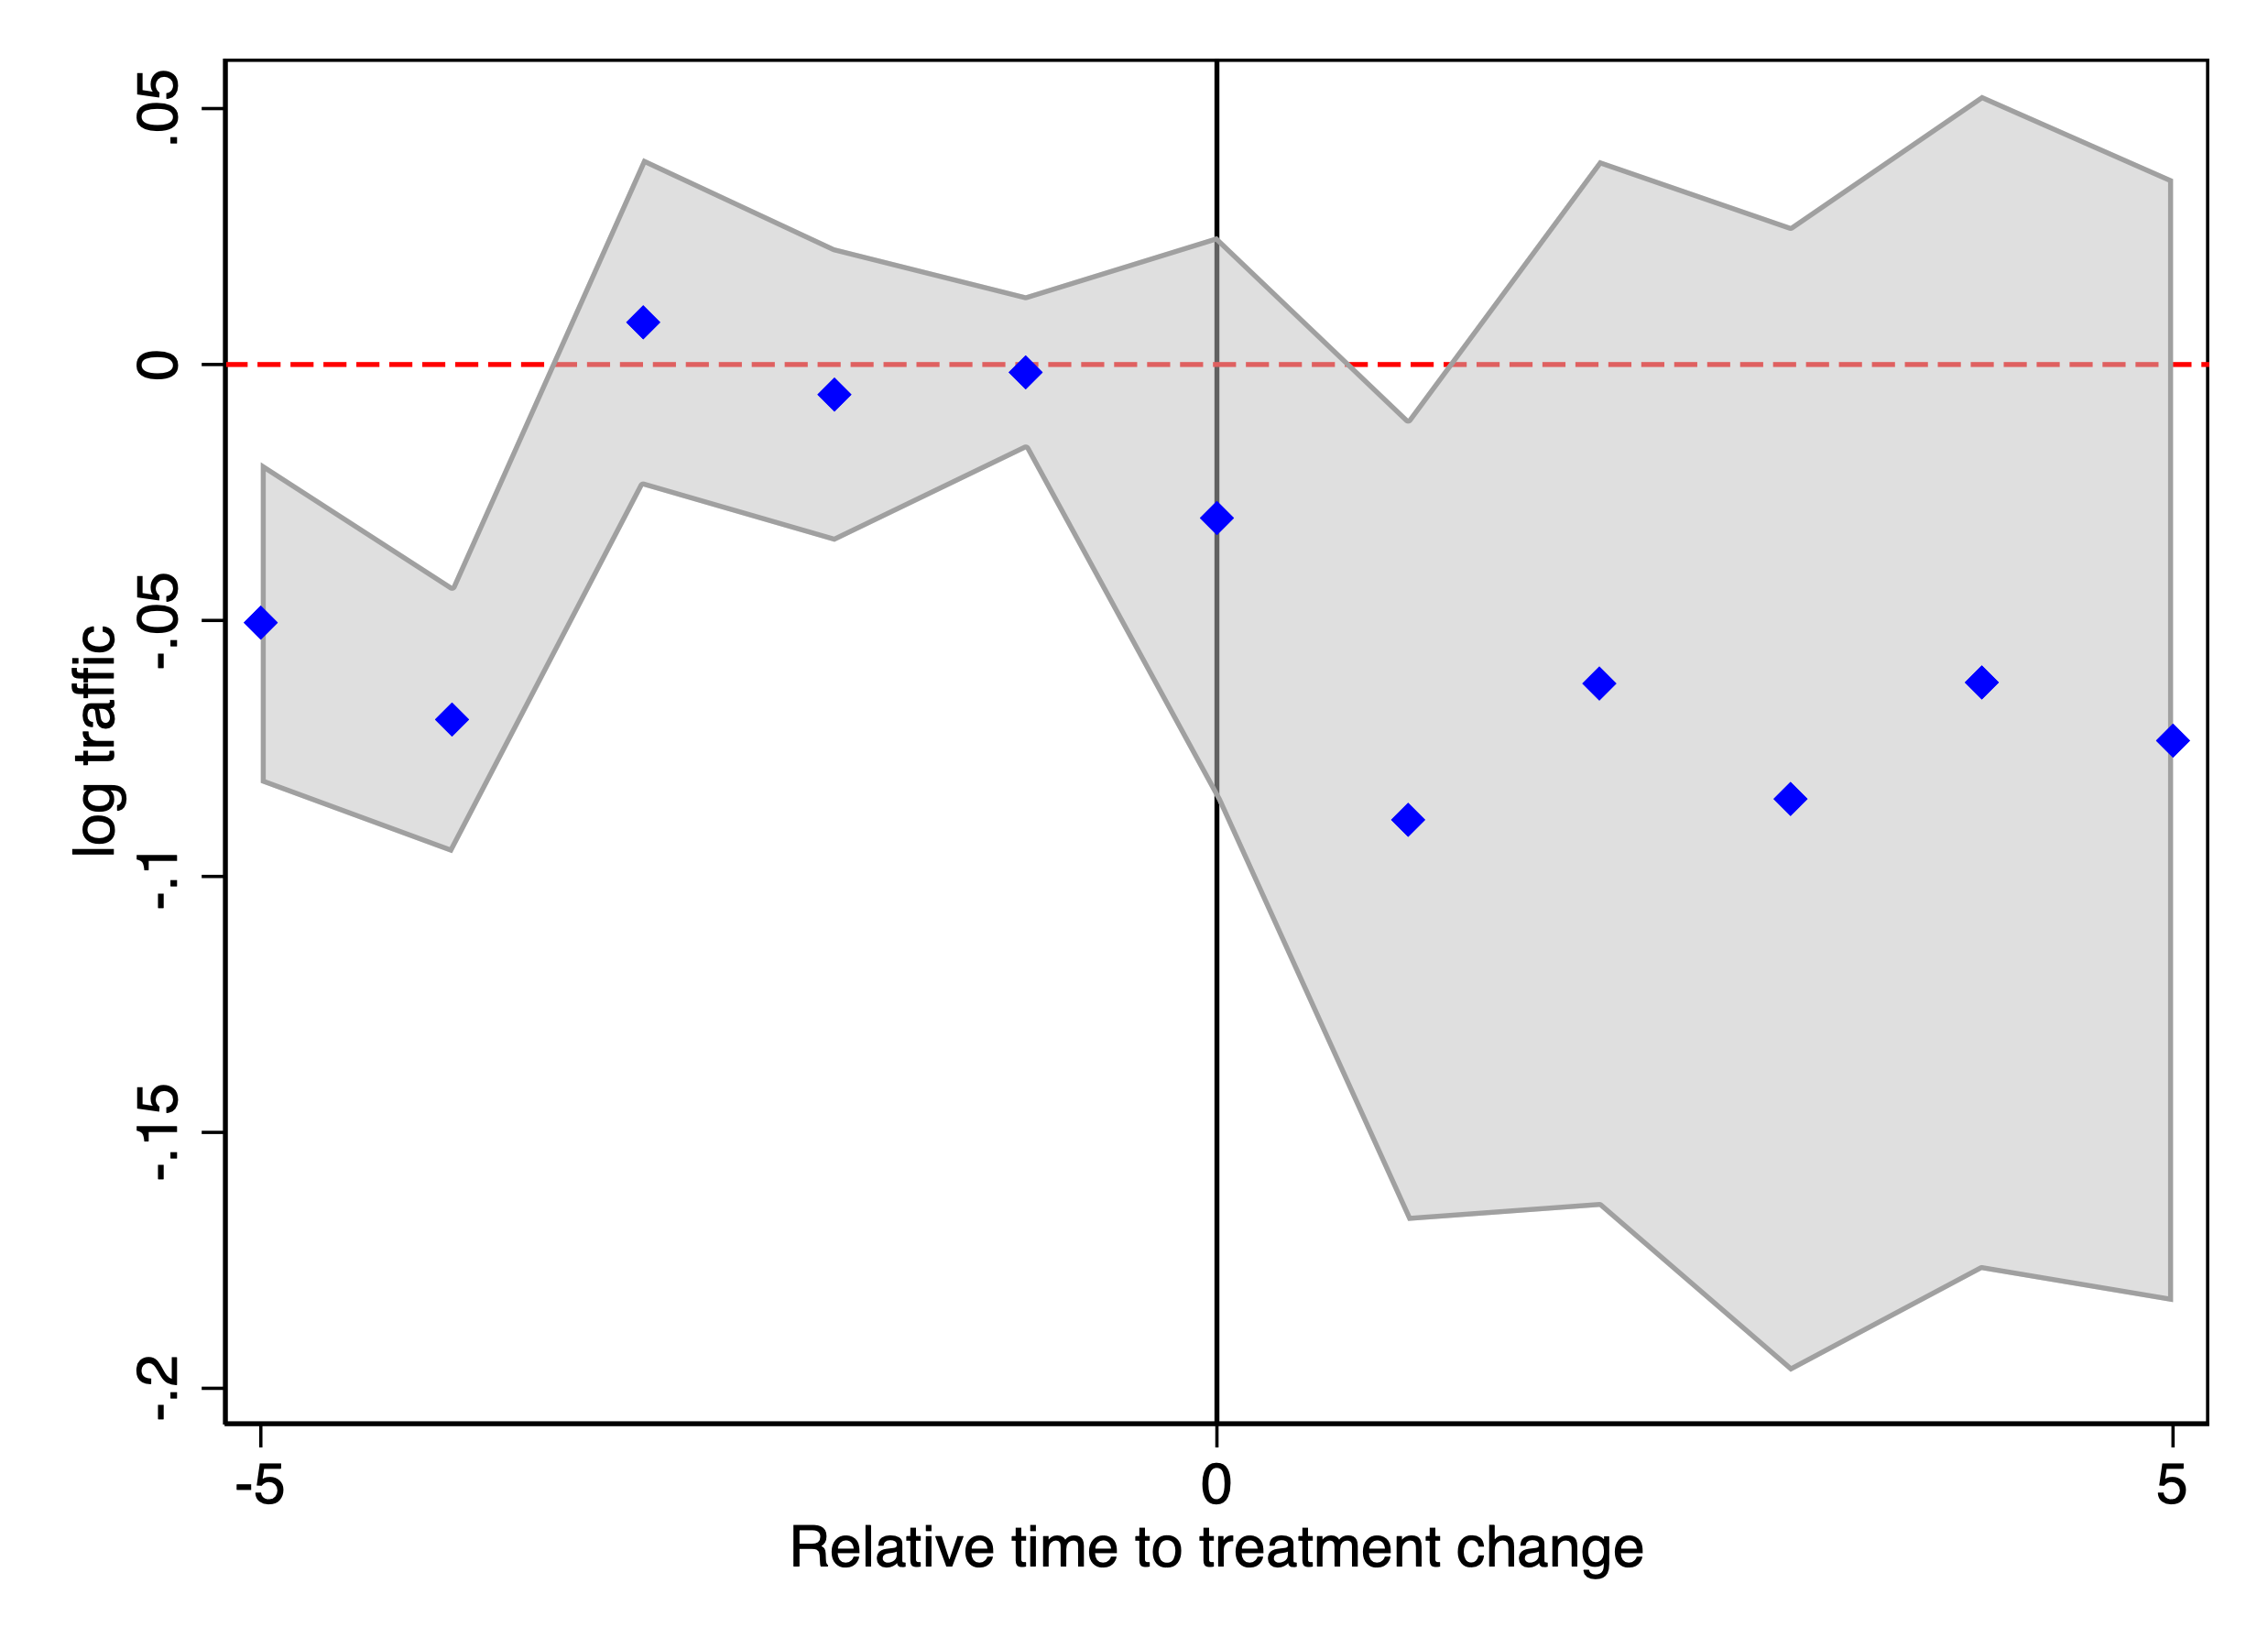
A natural concern is that the reduction in traffic might primarily reflect a drop in automated/bot visits rather than human visits. To examine this, we replicate the analysis using log monthly human traffic from Comscore as the dependent variable. Figure 5 shows that there is also a sizable and statistically significant decline in human traffic following blocking, suggesting that the effect is not driven solely by bot traffic. We report the ATT in Table 1. The estimates imply that after blocking GenAI crawlers, publishers experience a 23% decline in SimilarWeb traffic and a 13.9% decline in Comscore traffic, relative to periods before they blocked the crawlers. We also report ATT estimates from Synthetic DiD and Two-Way Fixed Effects in Table 6, which yield similarly significant negative effects.16
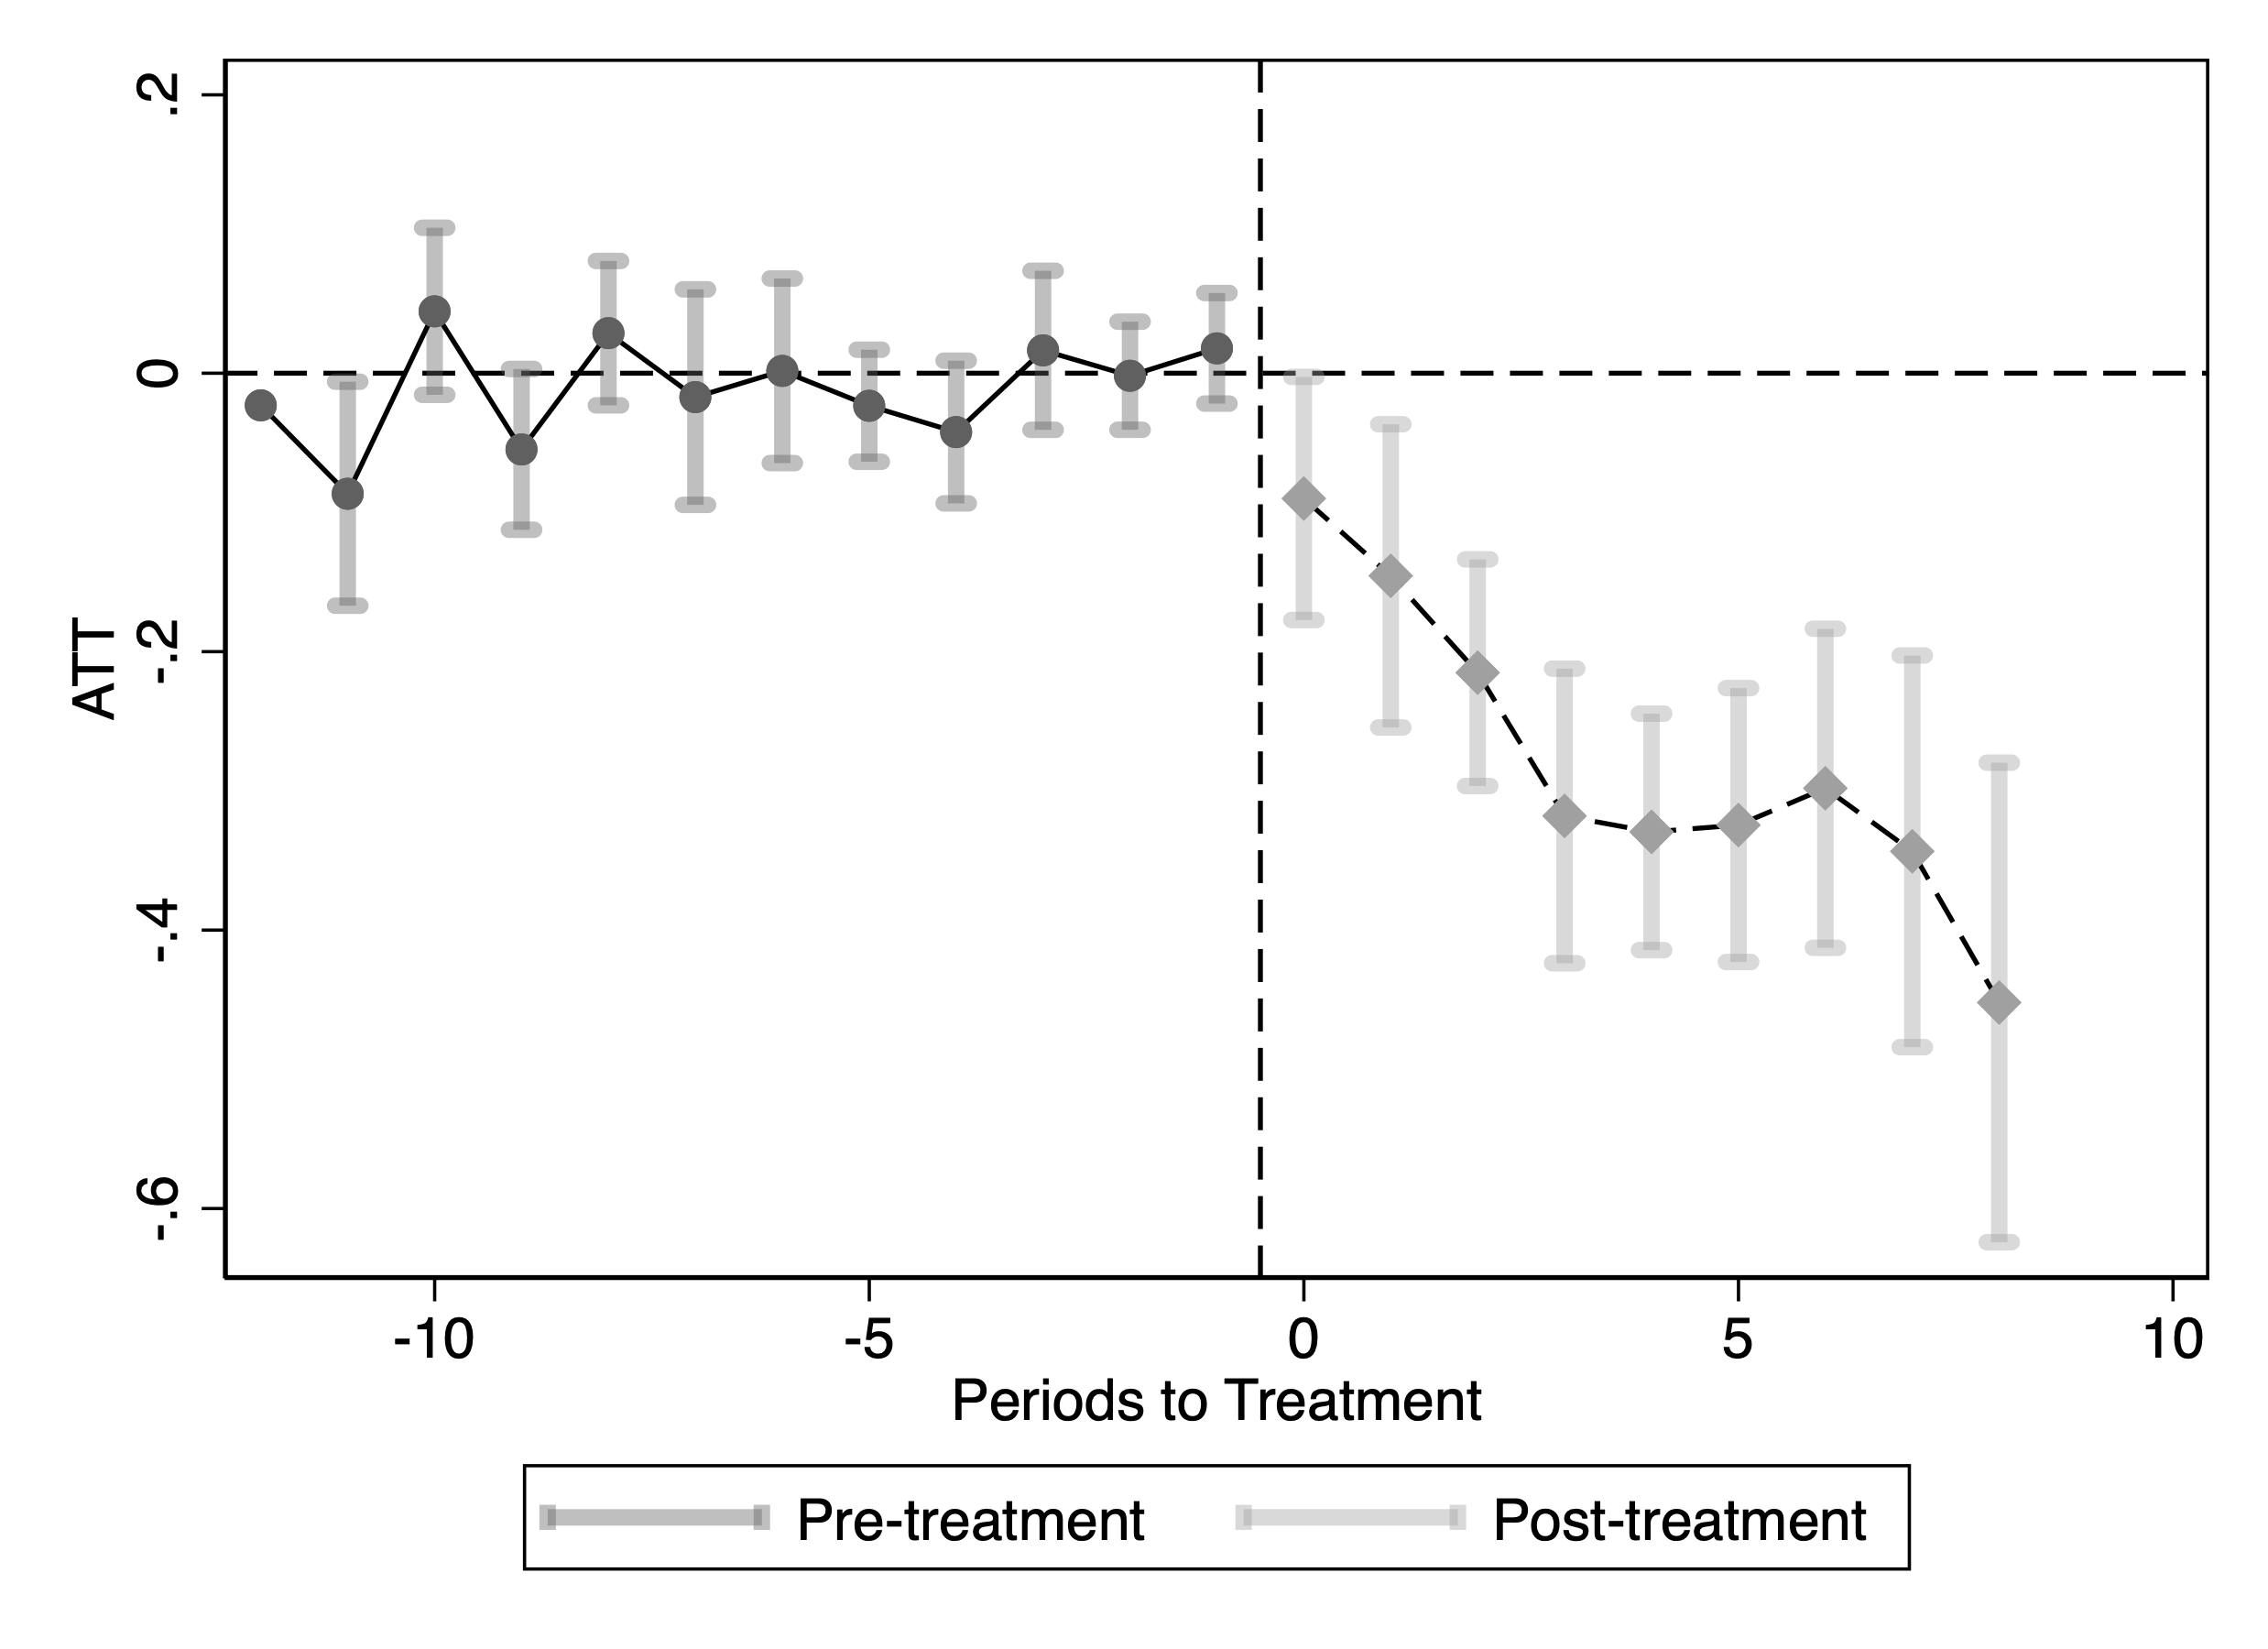
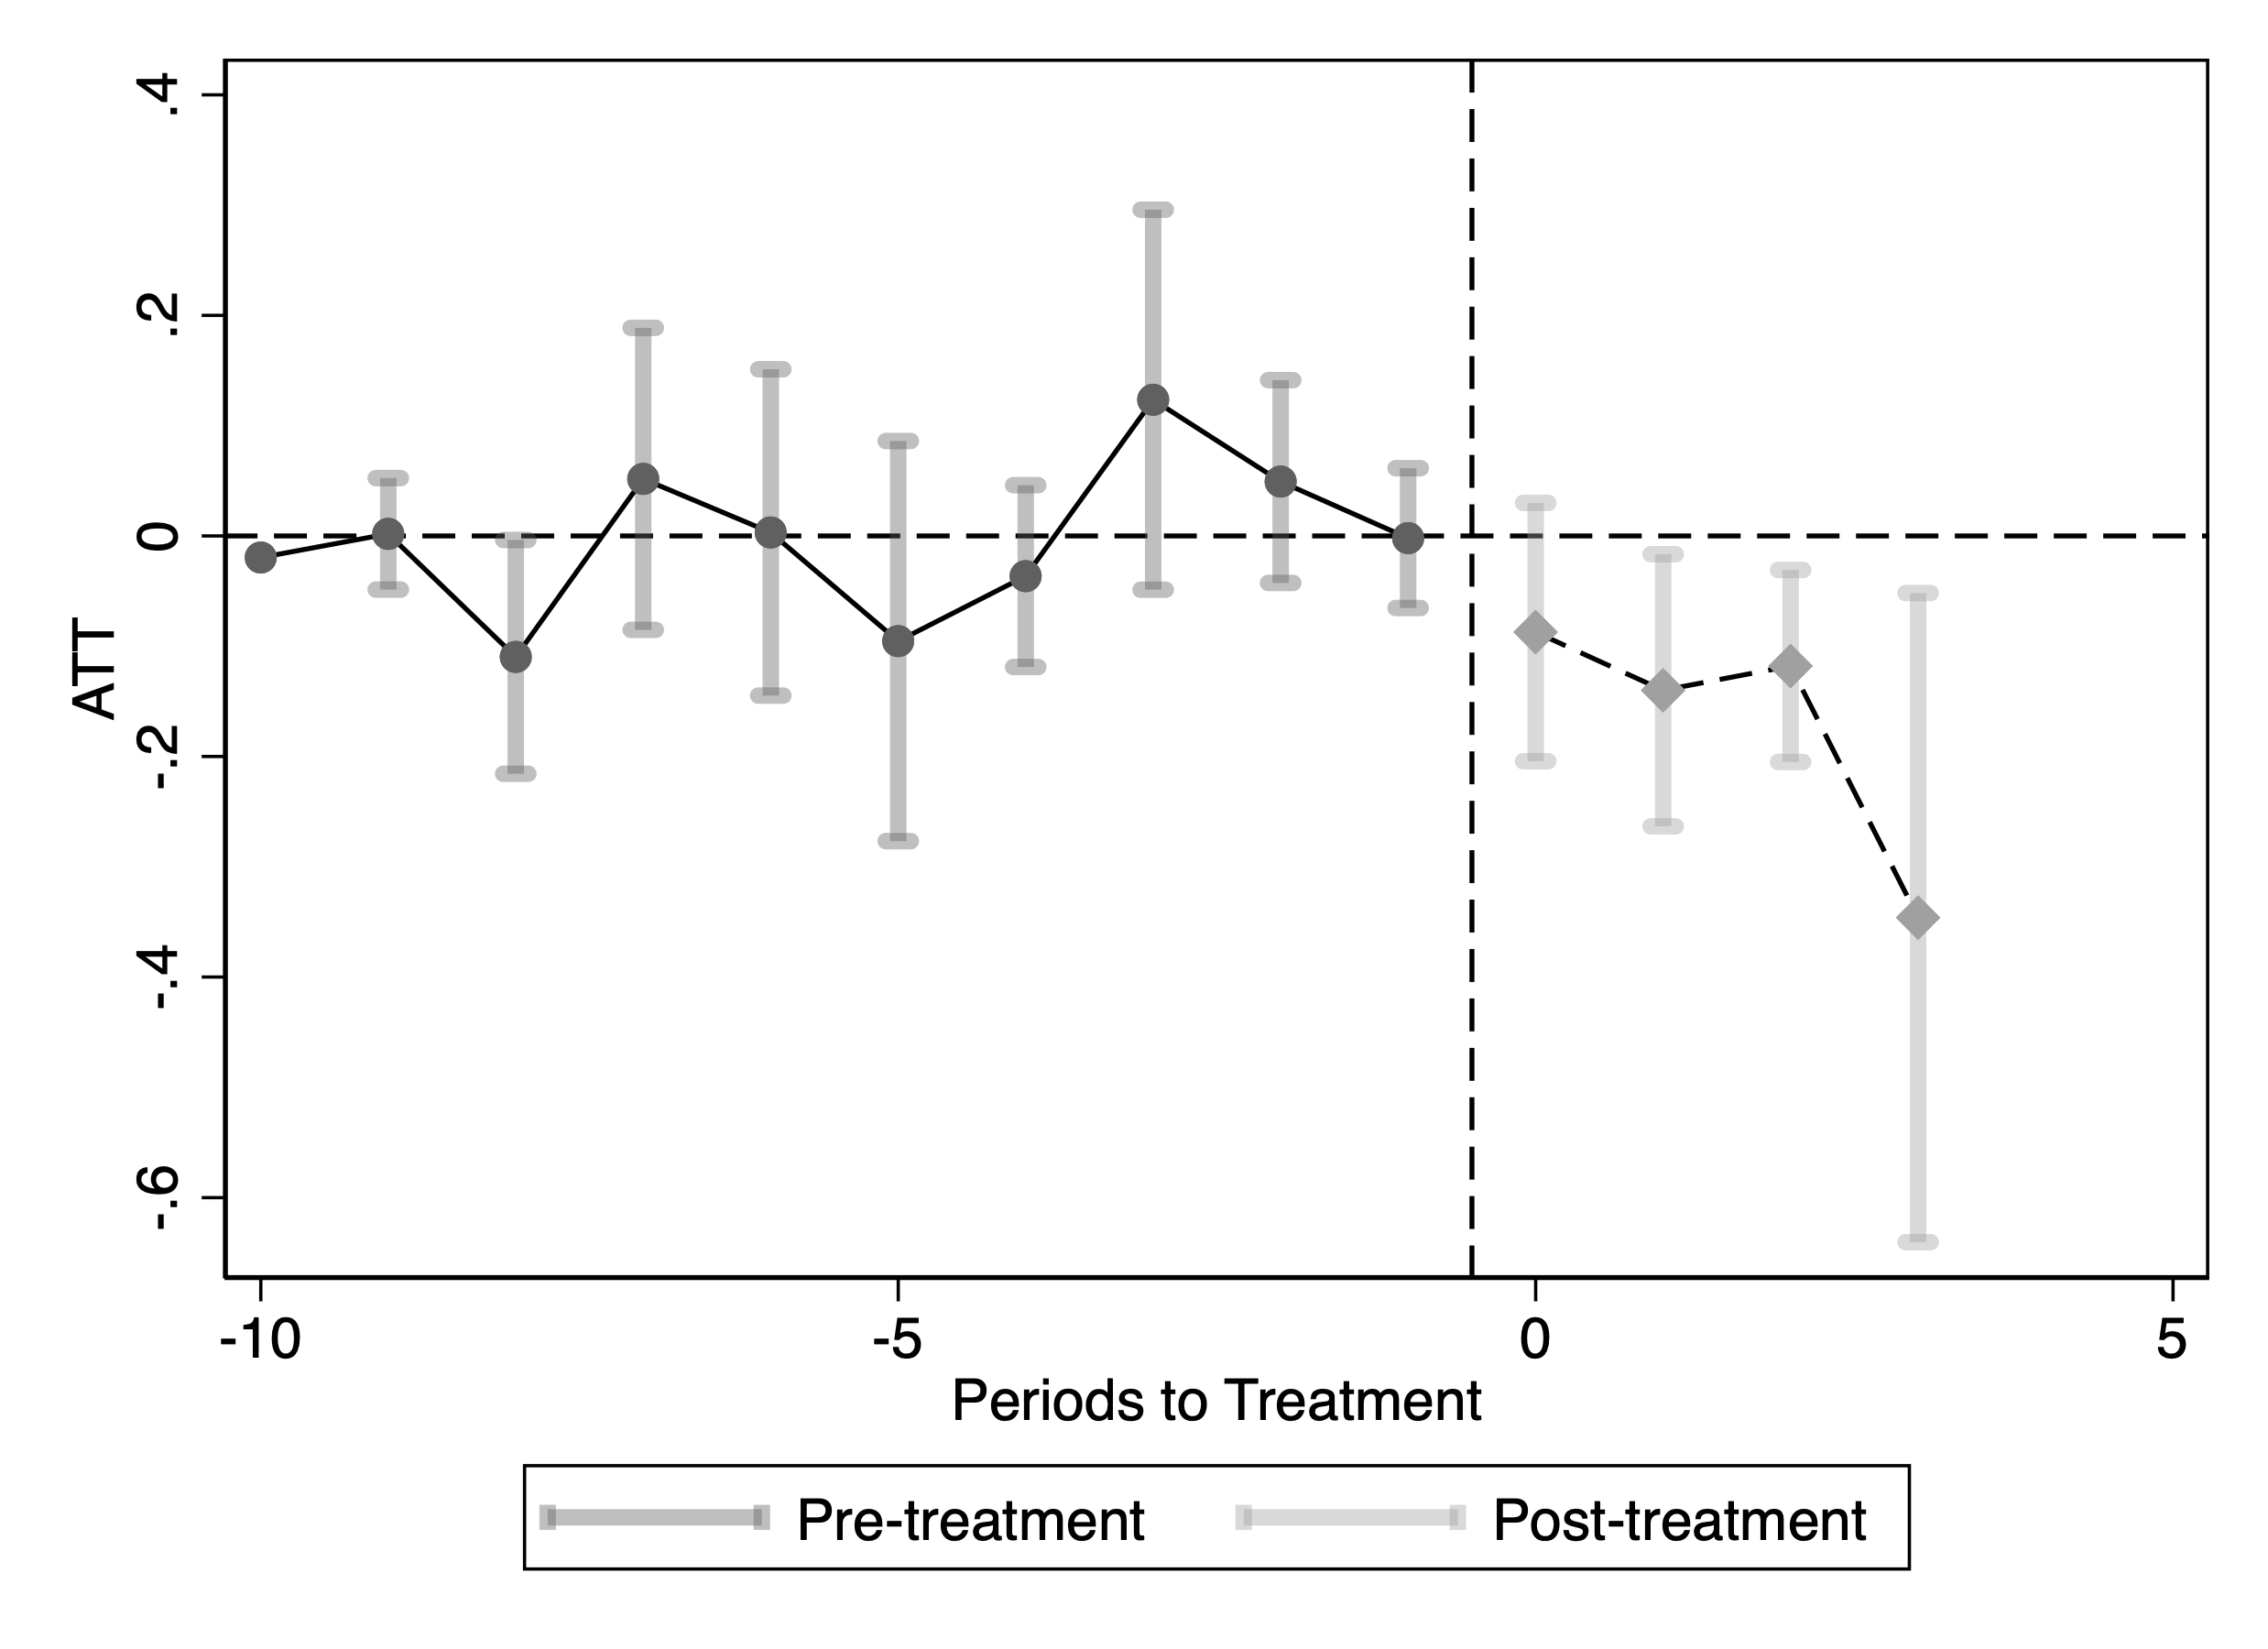
This figure reports staggered DiD event-study estimates of the effect of blocking GenAI web crawlers on publisher traffic. Panel (a) uses SimilarWeb traffic; Panel (b) uses Comscore traffic. The outcome in each panel is the logarithm of monthly visits. Confidence intervals are based on 50 bootstrap replications.
| Staggered DiD | ||
| Log(SimilarWeb traffic) | Log(Comscore traffic) | |
| ATT | -0.262 | -0.150 |
| [-0.352,-0.173] | [-0.275,-0.025] | |
This table reports staggered DiD ATT estimates of the effect of blocking GenAI web crawlers on publisher traffic. The dependent variables in the columns are the logarithm of monthly visits from SimilarWeb and Comscore data, respectively. Confidence intervals are based on 50 bootstrap replications. *$`p<`$0.1; **$`p<`$0.05; ***$`p<`$0.01.
We then replicate the analysis for the top 500 news publishing websites. The results are heterogeneous and vary by website size. For websites averaging more than 10 visits per day in our Comscore panel, the estimated effects are negative, consistent with our earlier findings. In contrast, for websites averaging 1–10 visits per day (corresponding to ranks 34–164 by average daily visits in our Comscore panel), the estimated effects are positive (Figure 8). Finally, for websites averaging fewer than 1 visit per day, traffic is extremely low and we do not find statistically significant effects. Table 2 reports the aggregate ATT estimates by publisher rank group.
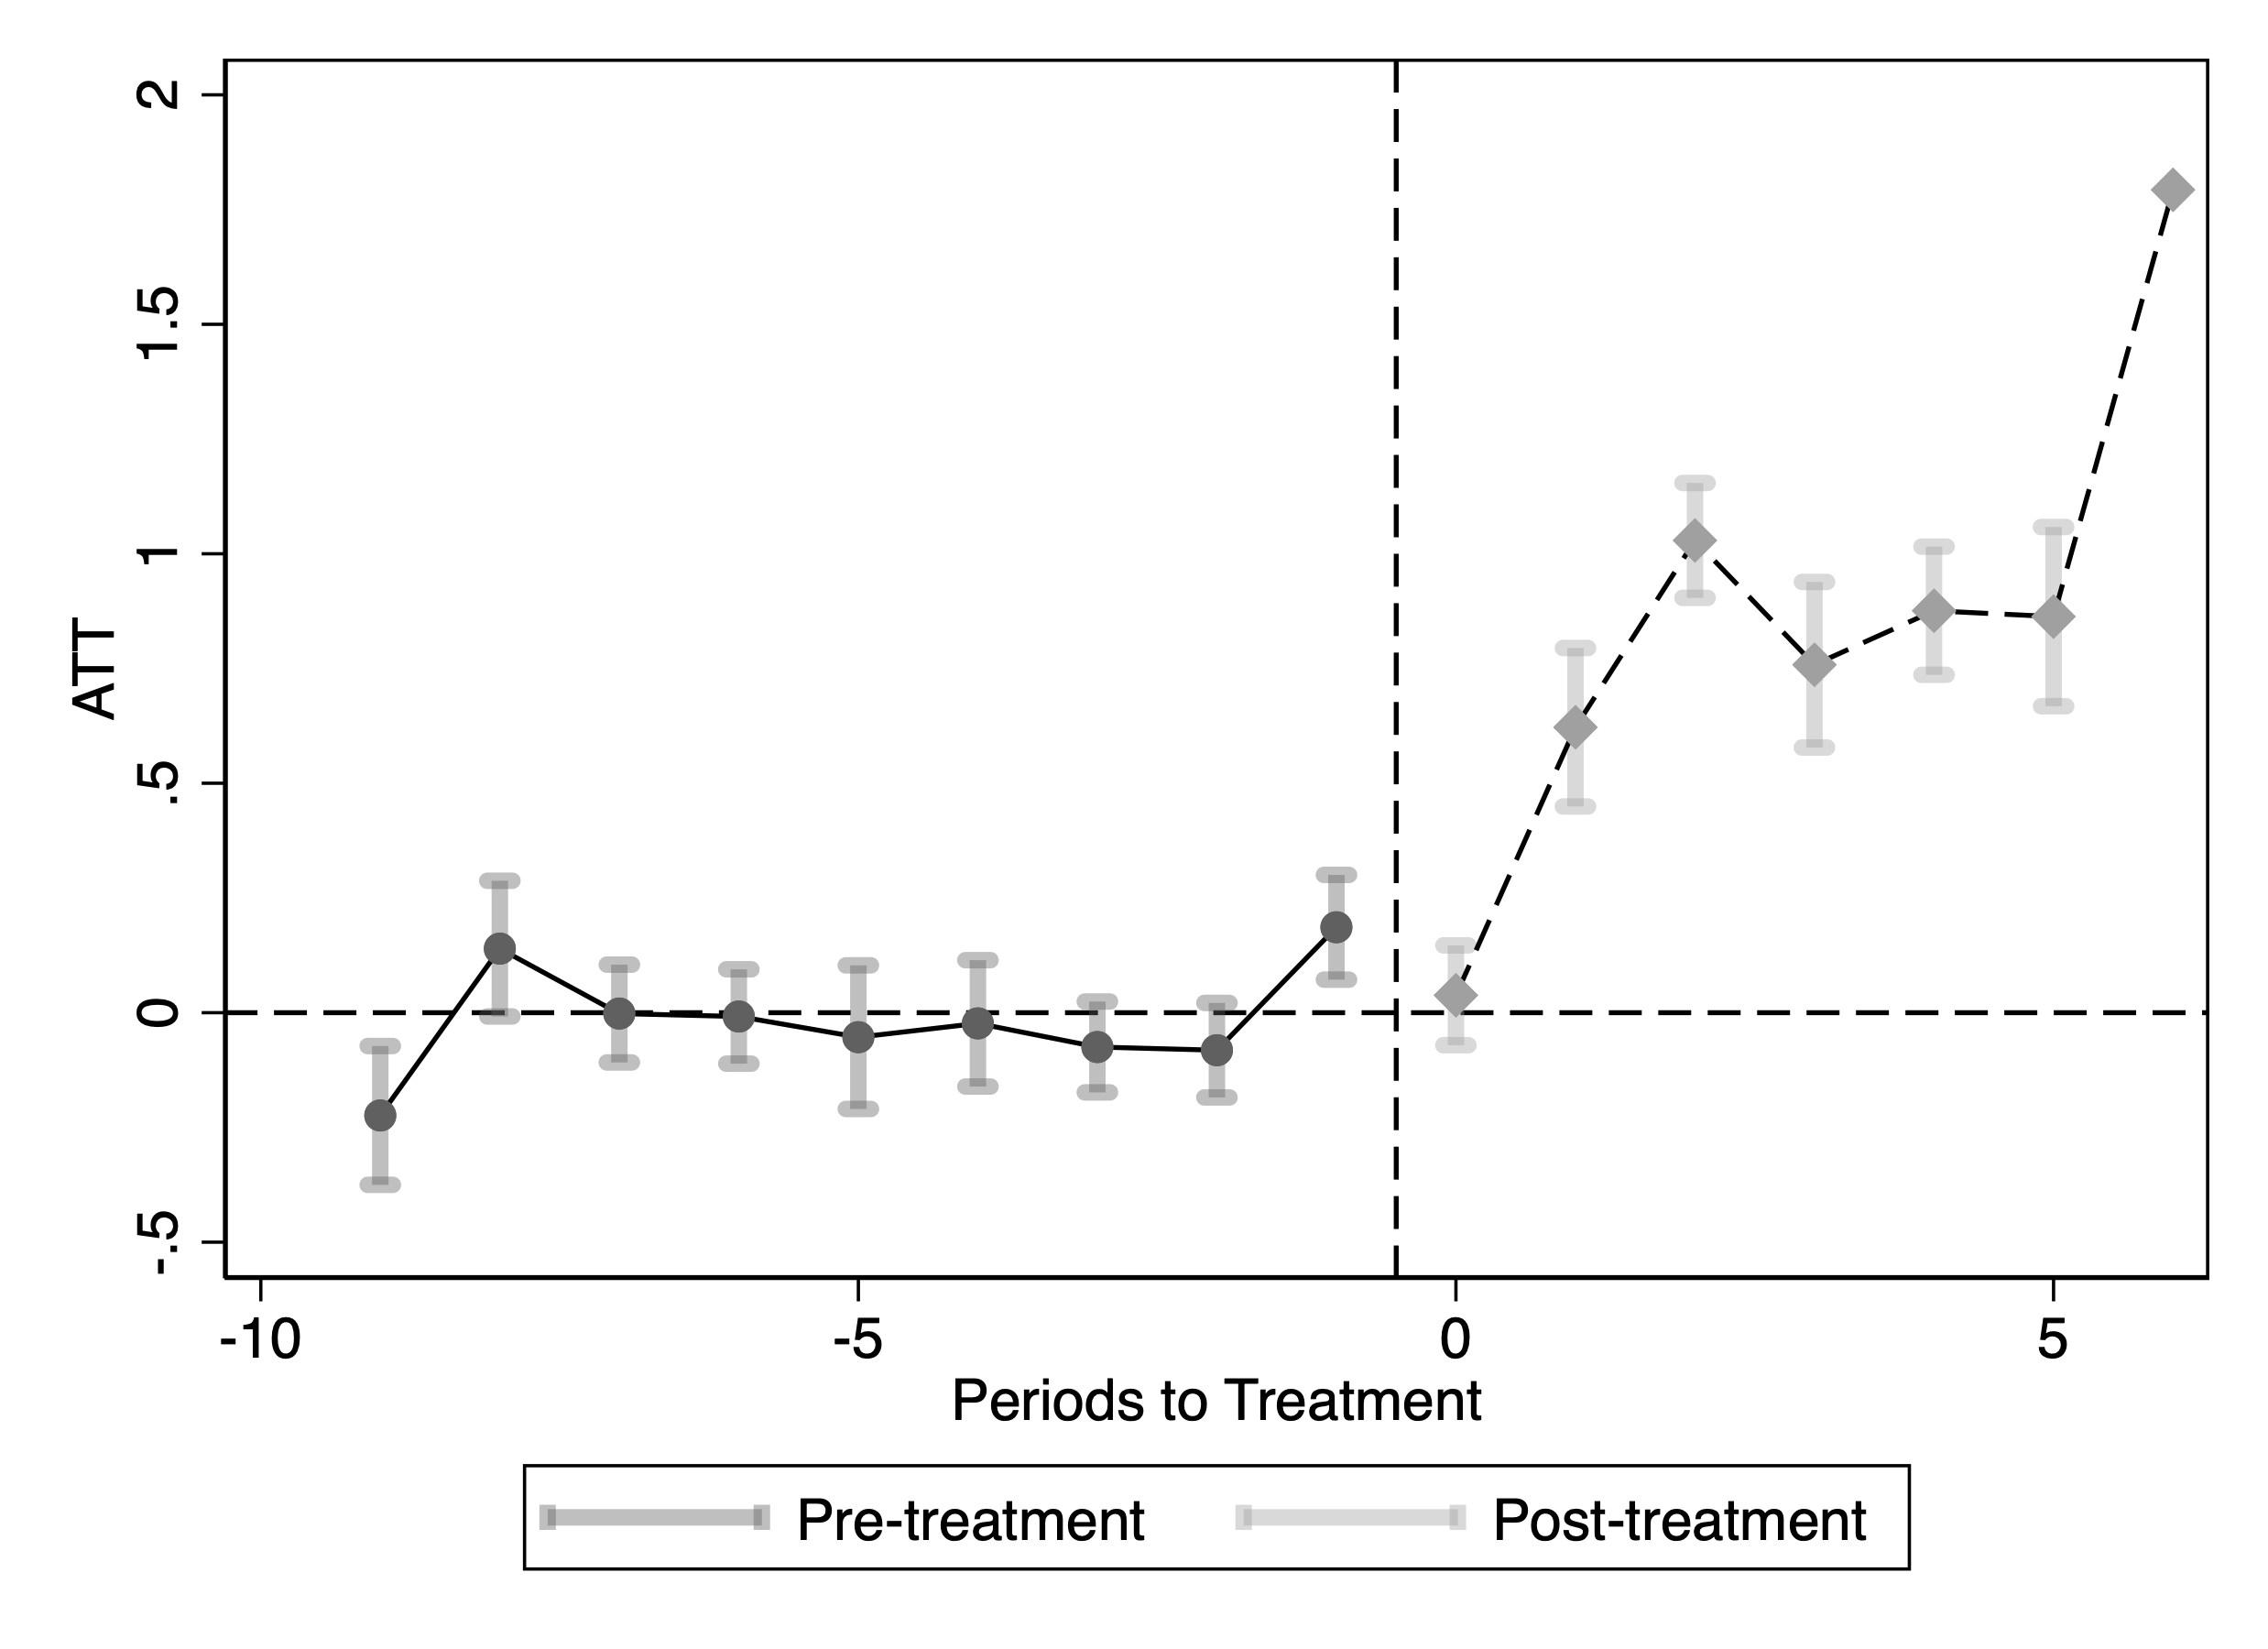
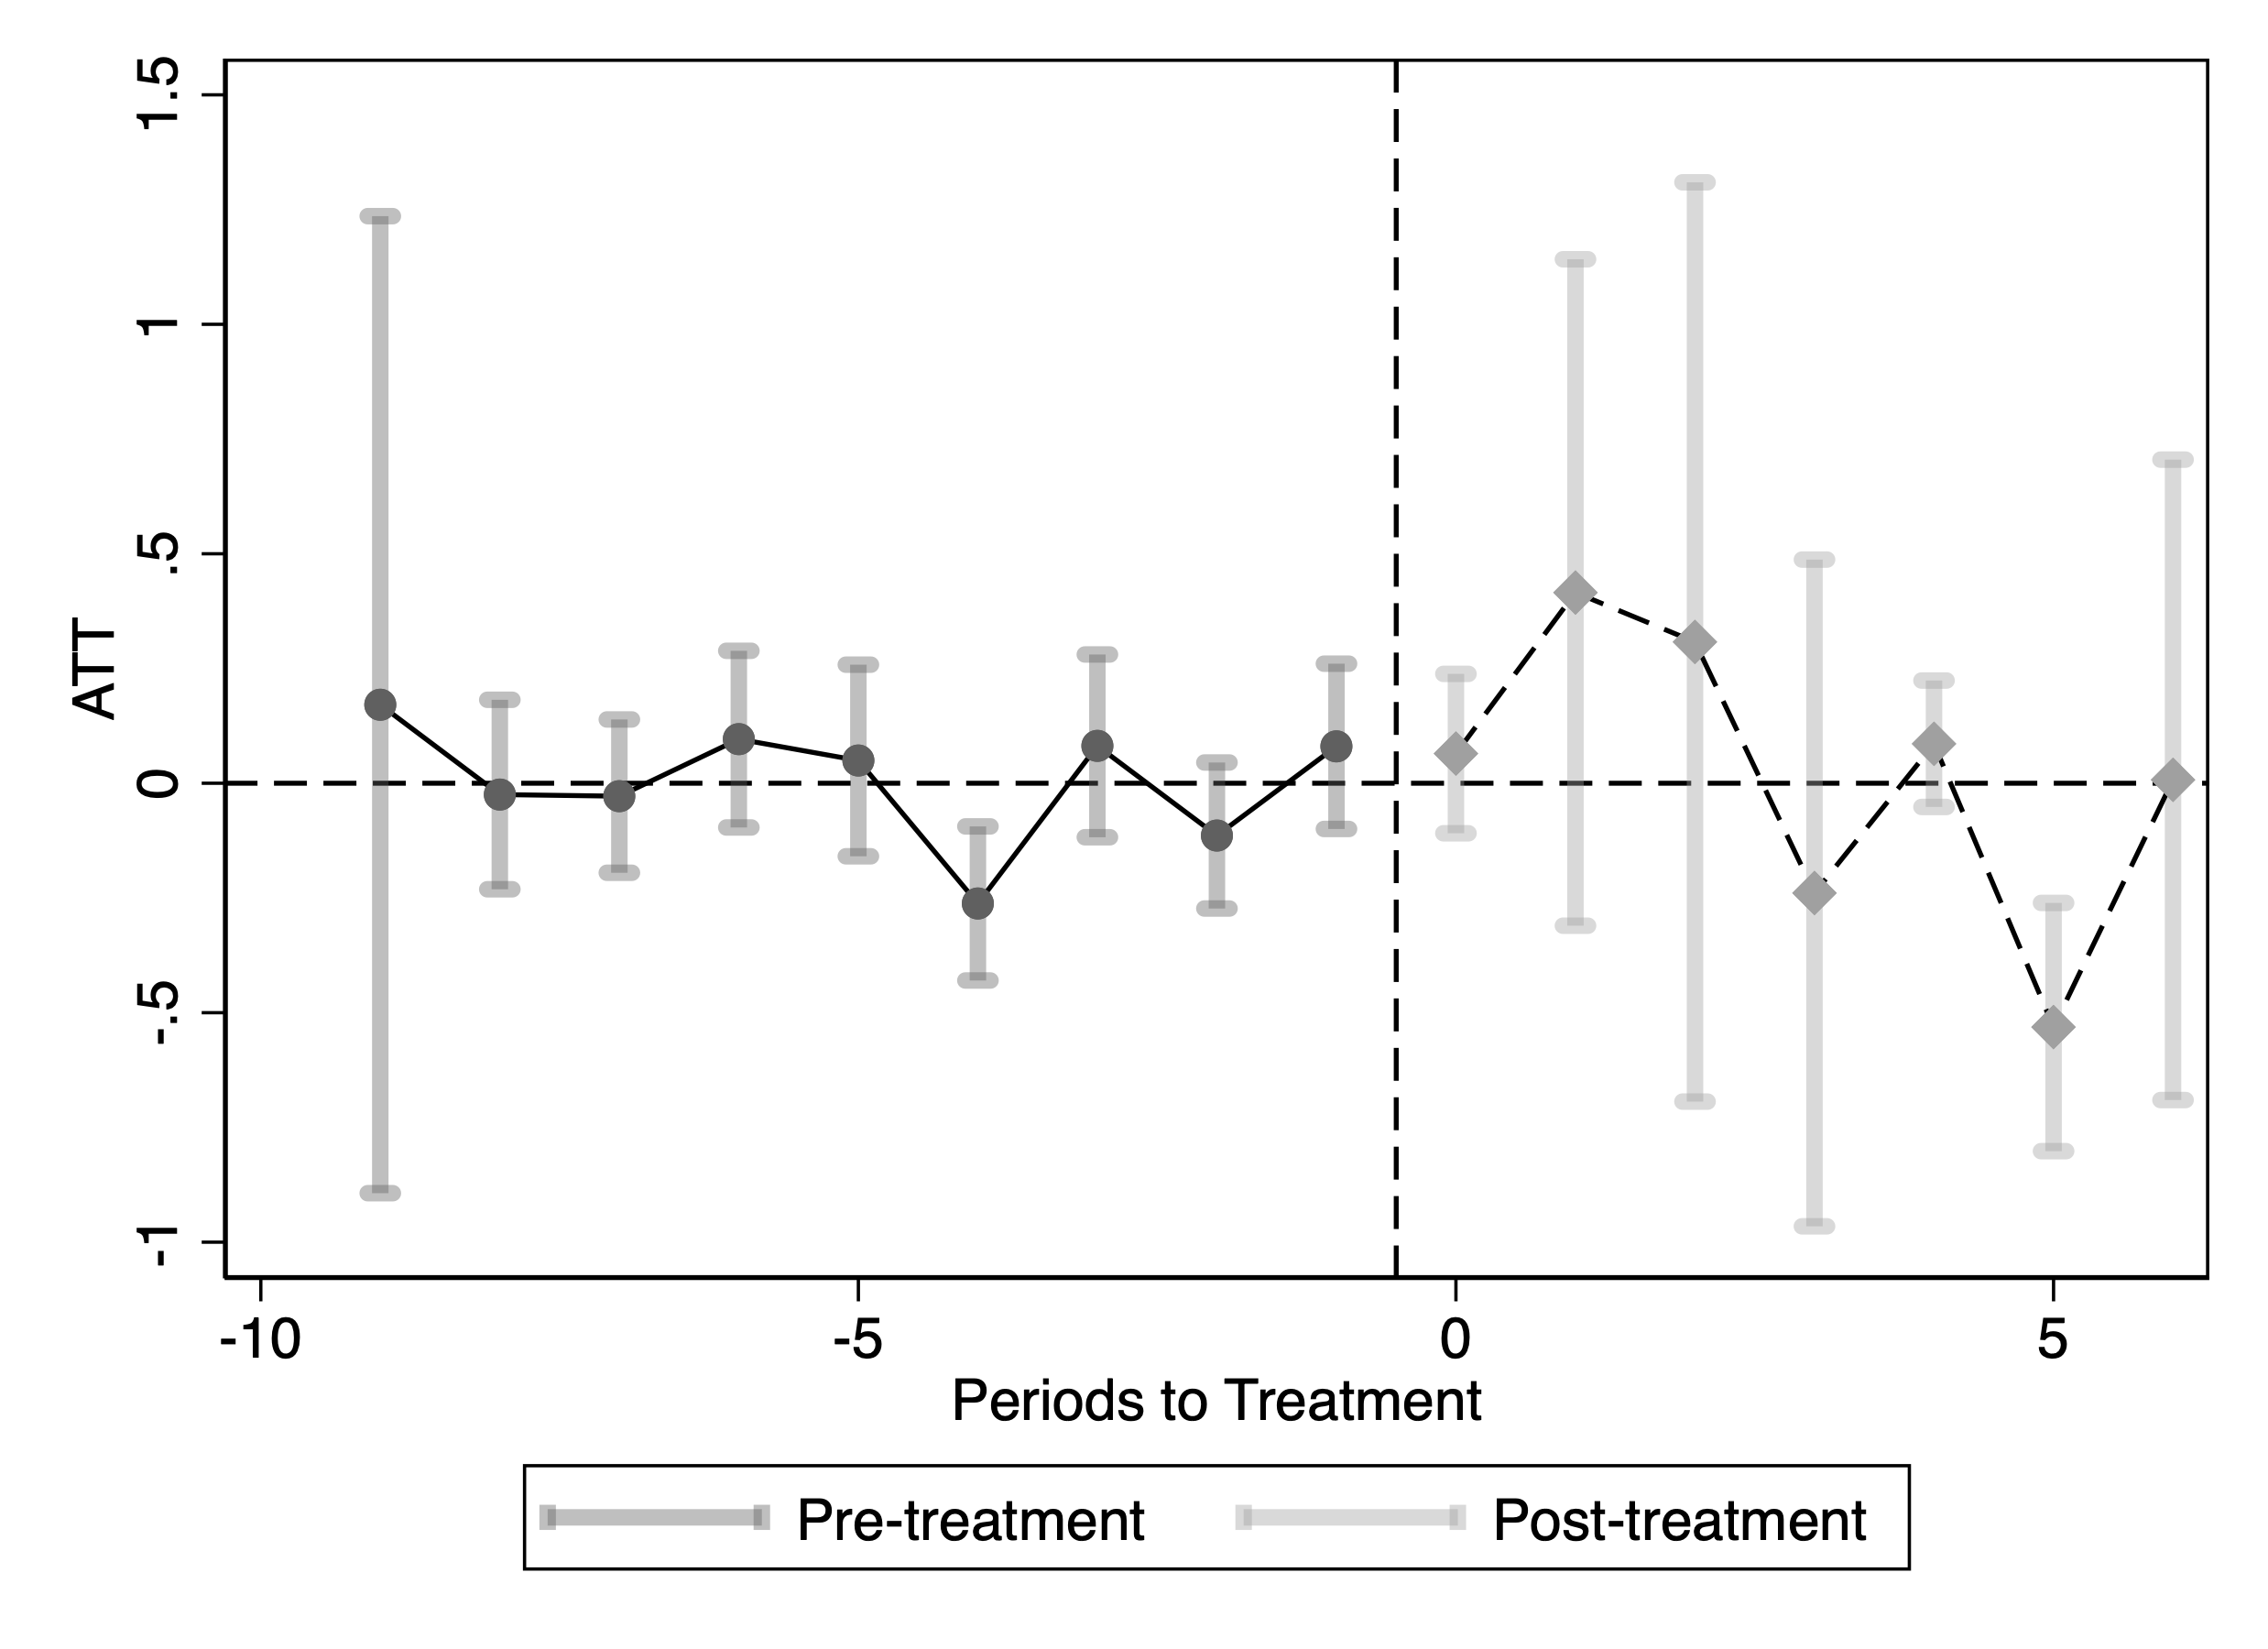
This figure reports staggered DiD event-study estimates of the effect of blocking OpenAI crawlers on publisher traffic measured using Comscore data. Panel (a), Group 1, includes the largest publishers (more than 10 visits per day on average); Panel (b), Group 2, includes mid-sized publishers (1–10 visits per day; ranked 34th–164th by average daily visits); and Panel (c), Group 3, includes the smallest publishers (fewer than 1 visit per day on average). The outcome variable is the logarithm of Comscore monthly visits. Confidence intervals are based on 50 bootstrap replications.
| Log(Comscore traffic) | |||
|---|---|---|---|
| ATT | -0.099 | 0.472 | 0.233 |
| [-0.162,-0.037] | [0.376,0.567] | [-0.246,0.712] | |
| Group (websites daily traffic in Comscore) | ≥ 10 | 1-10 | ≤1 |
This table reports staggered DiD ATT estimates of the effect of blocking GenAI web crawlers on publisher traffic. The dependent variables in the columns are the logarithm of monthly visits from Comscore data. Confidence intervals are based on 50 bootstrap repetitions. *$`p<`$0.1; **$`p<`$0.05; ***$`p<`$0.01.
Effect 3: No Near-Term Contraction in Newsroom Hiring Relative to Other Roles
We next examine whether GenAI adoption is associated with a contraction in publishers’ demand for editorial labor. We measure editorial hiring using monthly job postings from Revelio and classify postings into (i) producer/editorial roles (e.g., writer, editor, content specialist, technical writer) and (ii) all other roles.
Figure 11 plots the monthly number of producer-role postings over time. While job postings fluctuate month to month and exhibit a secular post-COVID decline in overall hiring, we do not observe a discrete collapse in producer-role postings coinciding with the expansion of GenAI use. Instead, producer-role postings appear to decline more gradually than other roles. Figure 12 plots the share of producer/editorial postings relative to total postings among newspaper publishers. The plot shows that the editorial share does not fall in the post-GenAI period and, in several periods, it increases. This pattern indicates that publishers do not disproportionately reduce demand for editorial labor relative to other job categories.
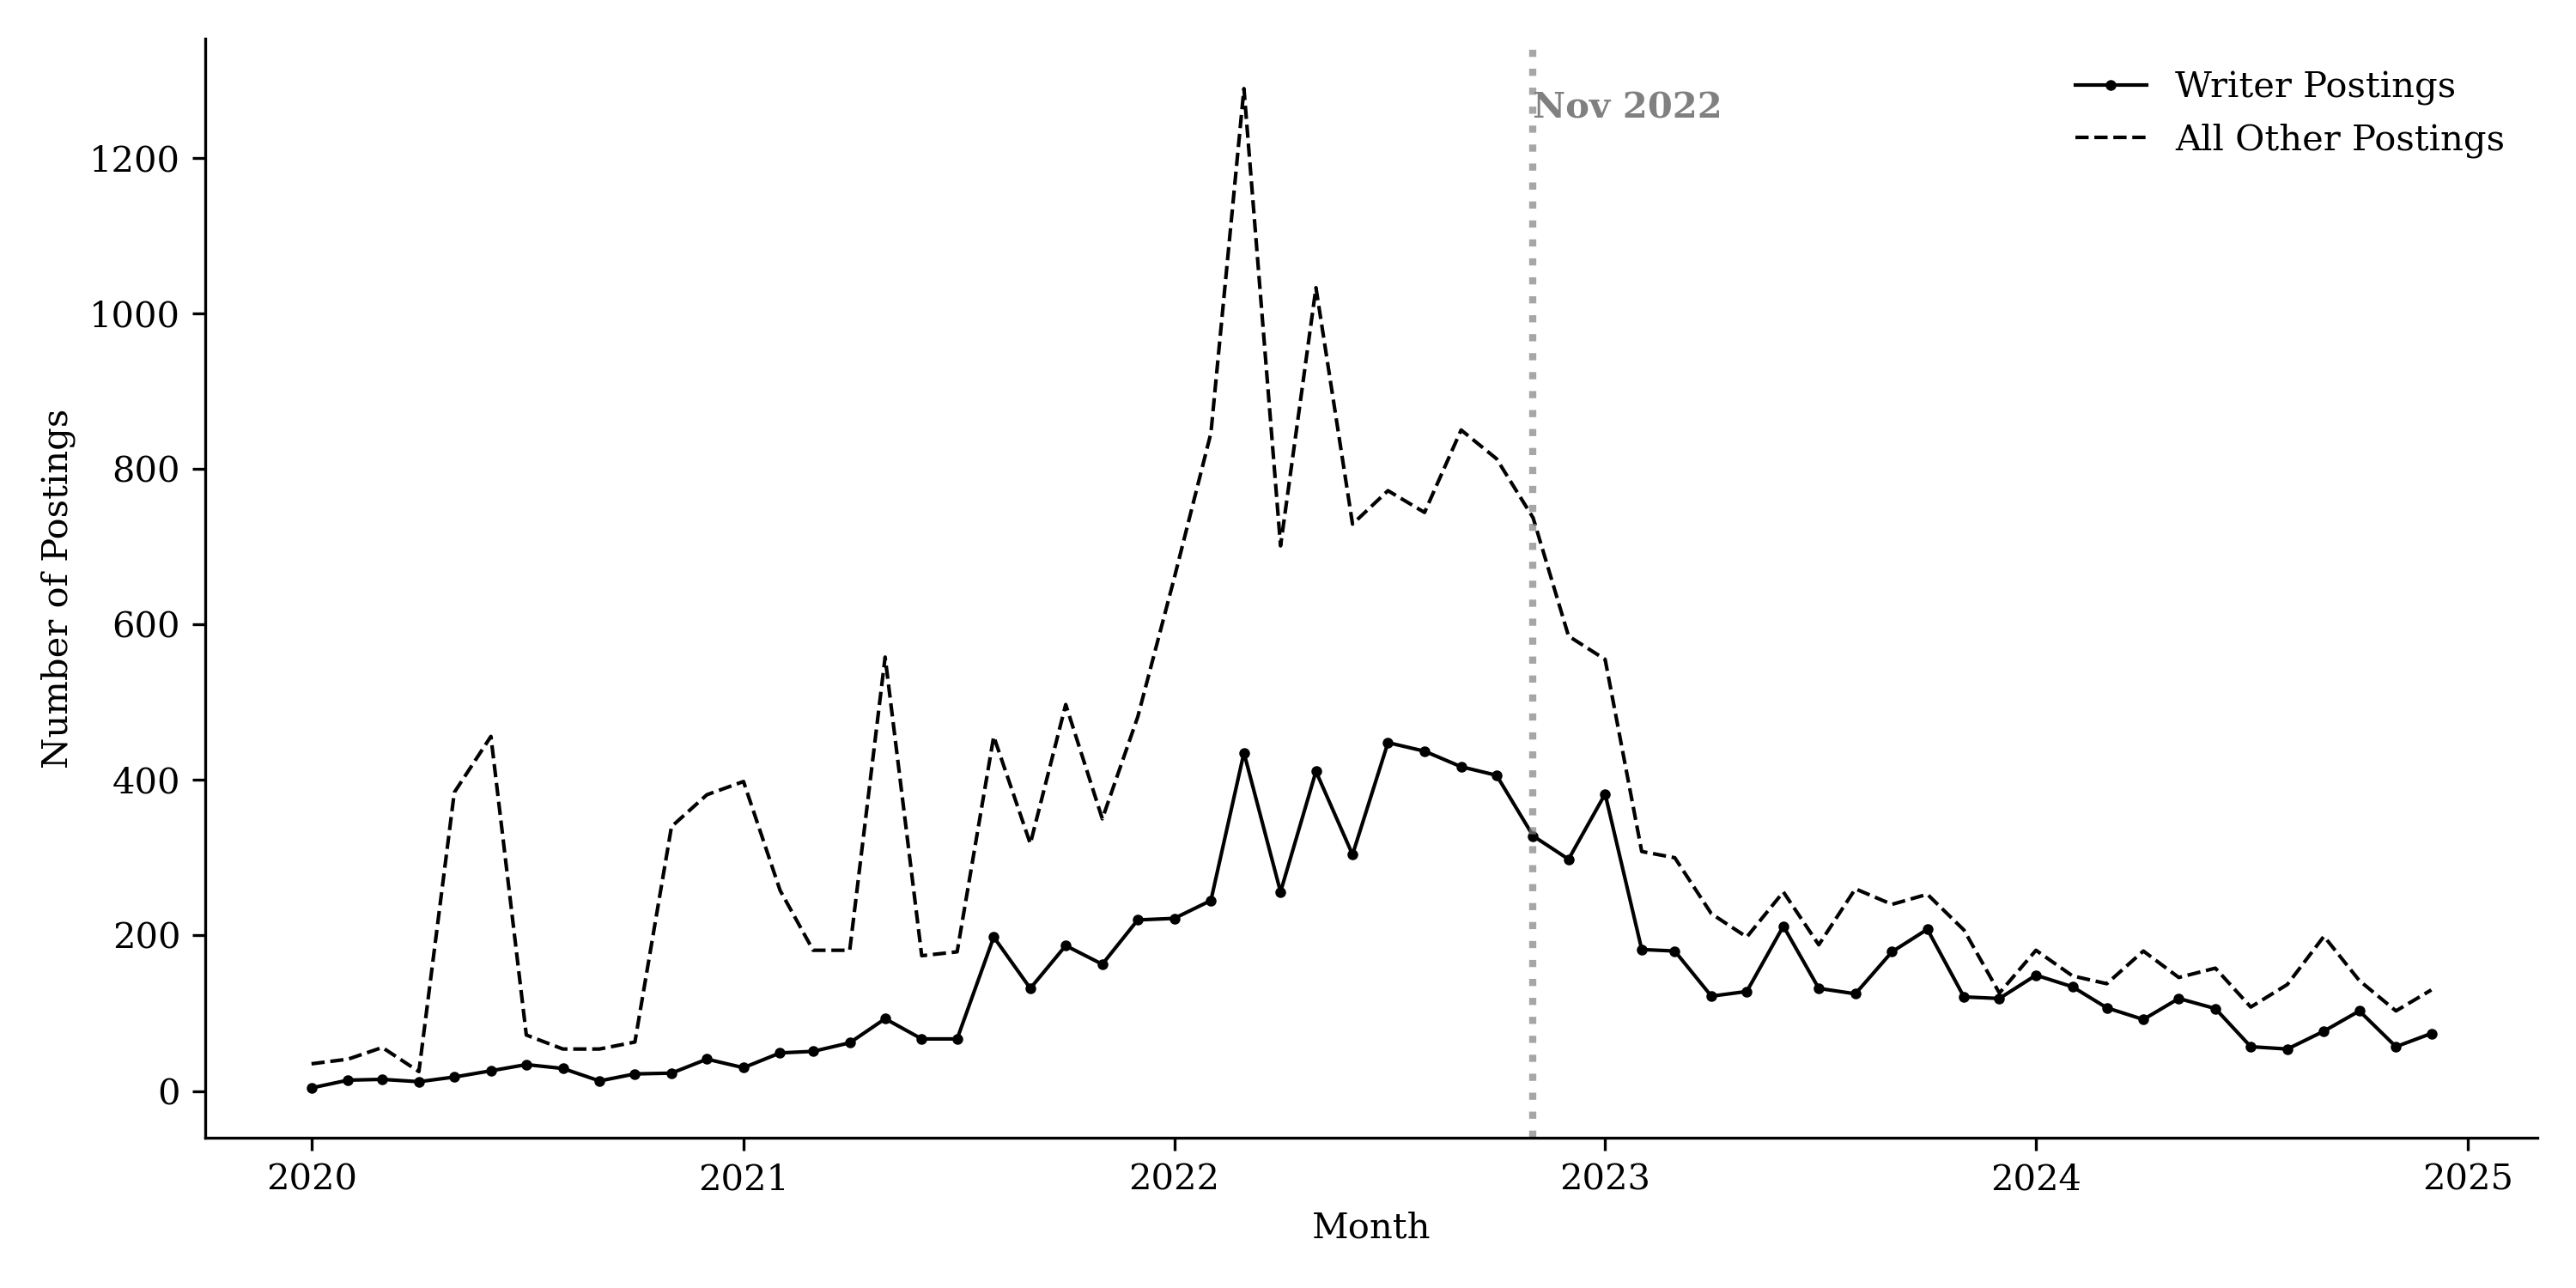
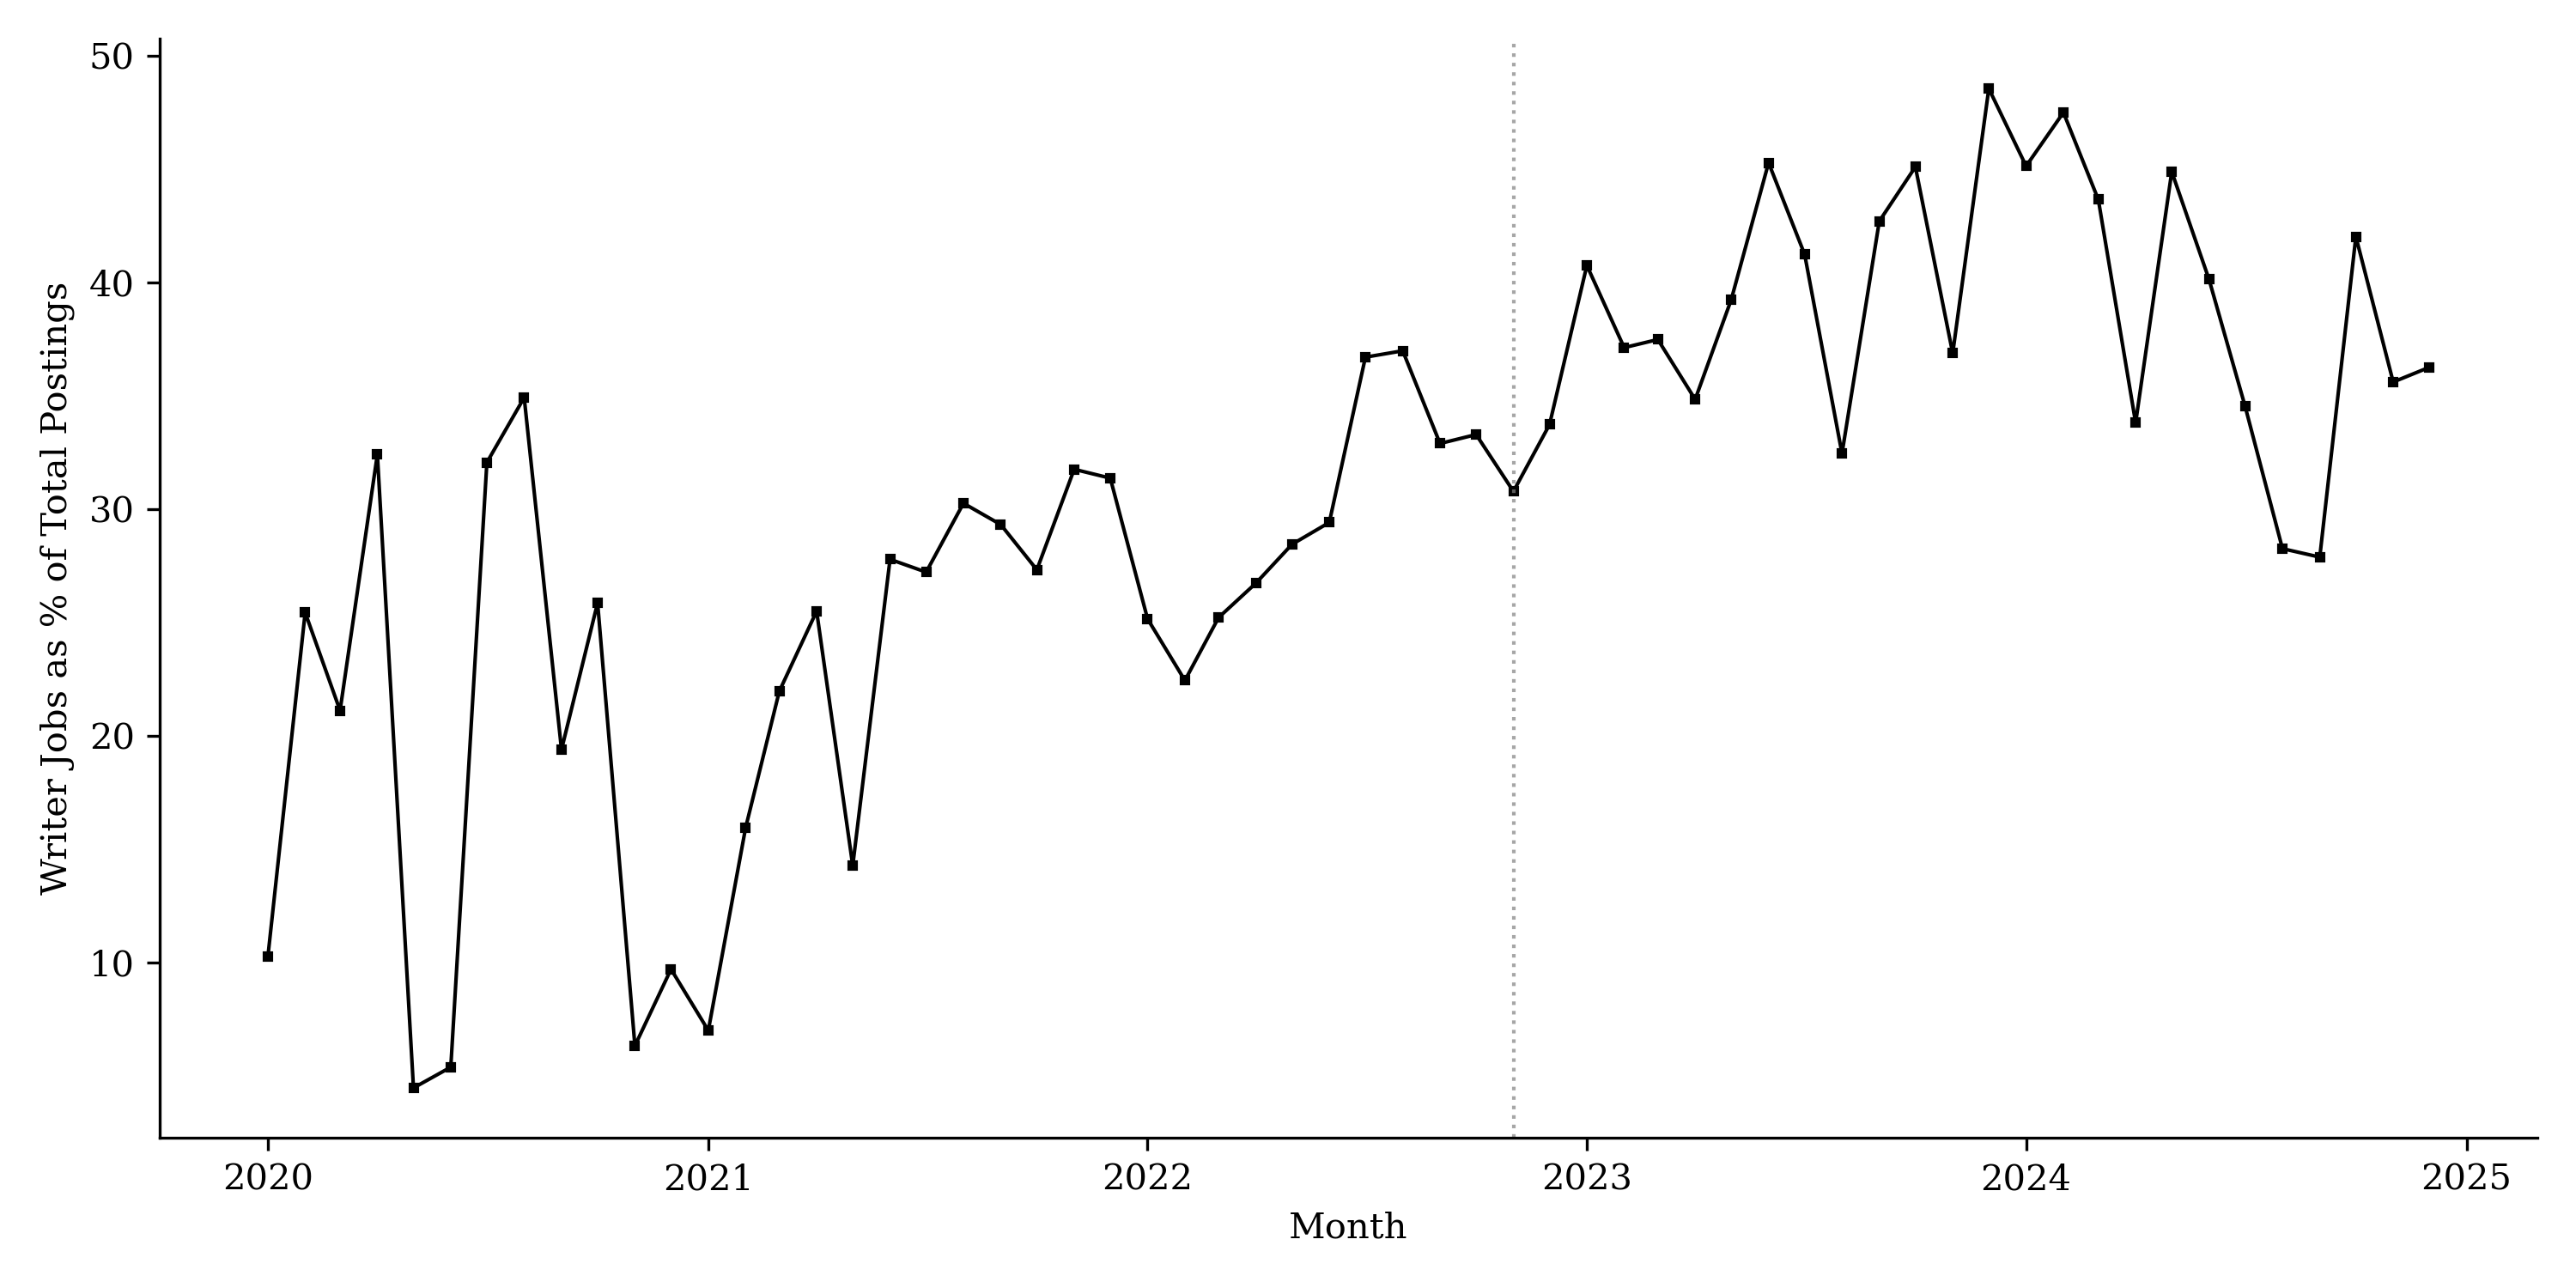
This figure plots the timeline of job postings for newspapers in the sample. Panel (a) displays the counts of writer-related postings (solid line) versus all other roles (dashed line). Panel (b) shows the percentage share of writer roles relative to the total number of postings. The vertical gray line indicates the release of ChatGPT in November 2022. The writer category includes Producers, Writers, Content Specialists, and Technical Writers.
We construct a publisher–month–category panel where $`g \in \{\text{editorial},\text{non-editorial}\}`$. Let $`\text{Editorial}_g \equiv \mathbf{1}\{g=\text{editorial}\}`$ and $`\text{Post}_t \equiv \mathbf{1}\{t \ge \text{November 2022}\}`$. We estimate a two-way fixed effects DiD model, controlling for publisher and month fixed effects, as reported in Table 3.17 The treatment indicator equals one in months after November 2022. Consistent with the plots, the estimated treatment effect on editorial hiring after November 2022 is not statistically significant and negative; instead, it is positive, indicating no disproportionate contraction in editorial roles relative to non-editorial hiring. This evidence aligns with our broader interpretation that GenAI has not yet functioned as a direct substitute for core newsroom labor demand during our sample period, even though job postings measure labor demand rather than realized employment and may also reflect changes in recruiting intensity or posting practices.
| Number of job posting | |
| TWFE | |
| ATT | 7.578$`^{***}`$ |
| [2.897,12.260] |
Effect on Editorial Job Posting
This table reports TWFE ATT estimate for editorial job postings relative to non-editorial roles, where the treatment indicator equals one in the post–November 2022 period. 95% confidence intervals are reported in brackets and are based on robust standard errors clustered at the publisher level.*$`p<`$0.1; **$`p<`$0.05; ***$`p<`$0.01.
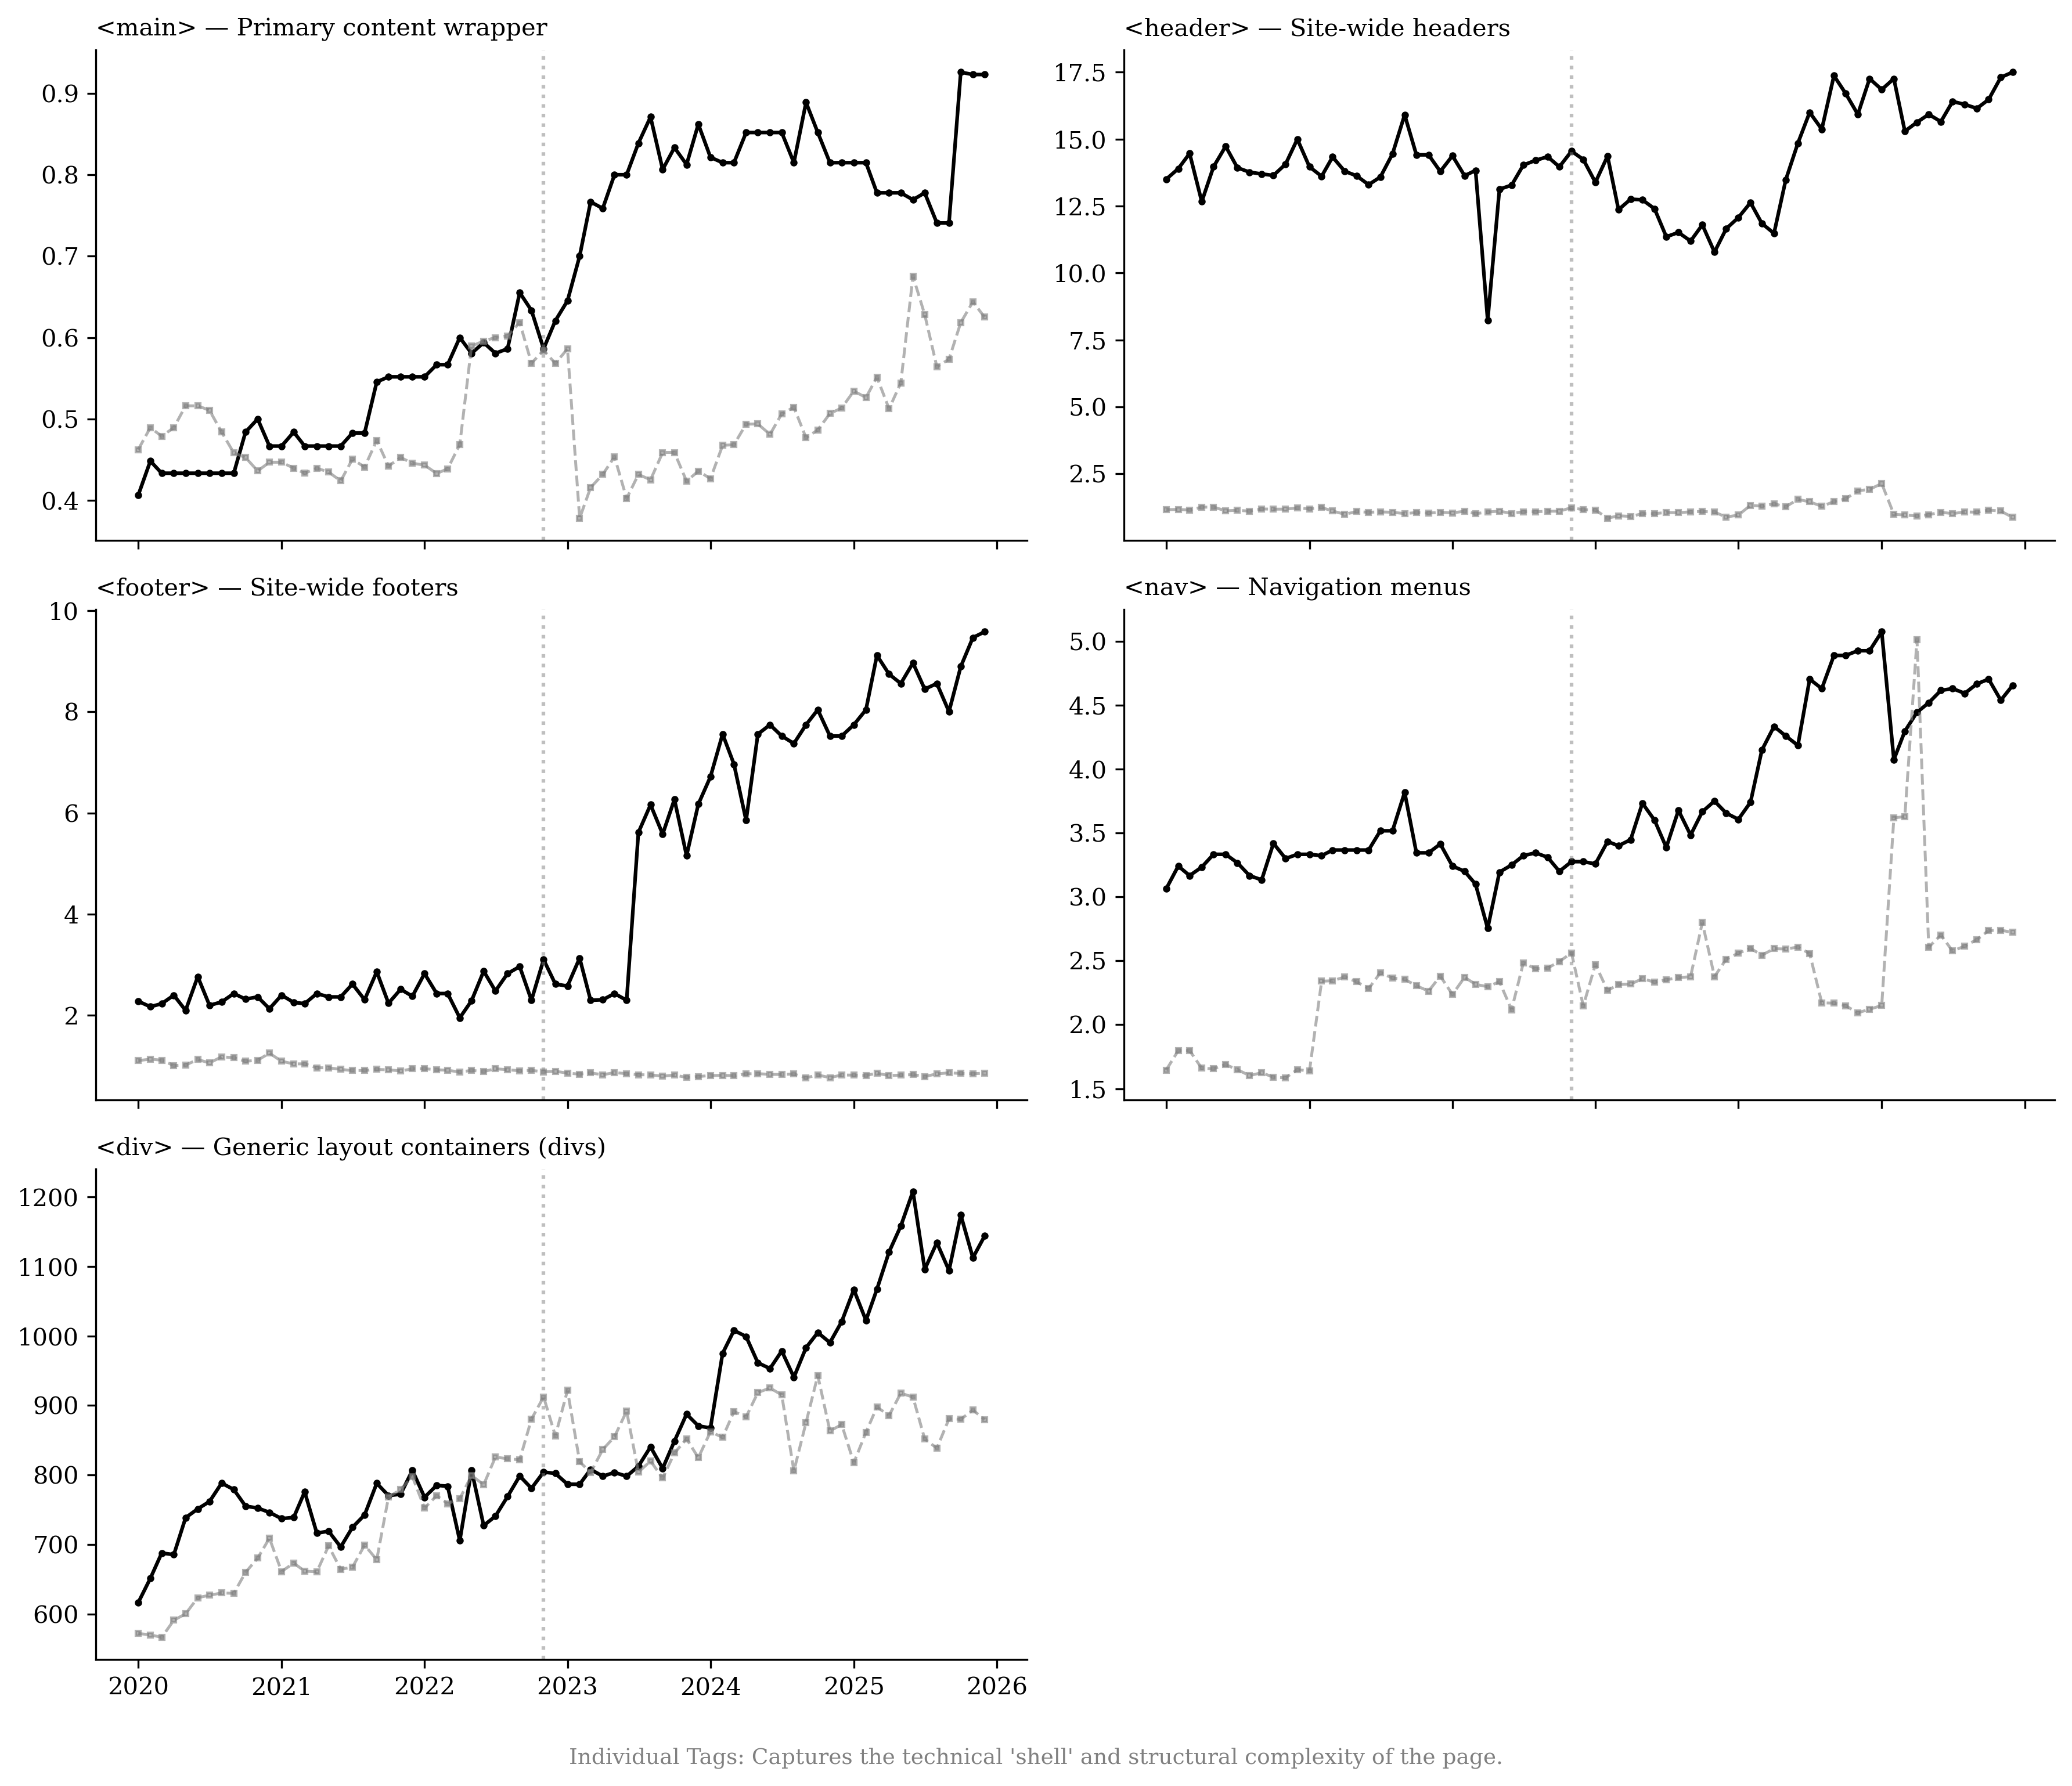
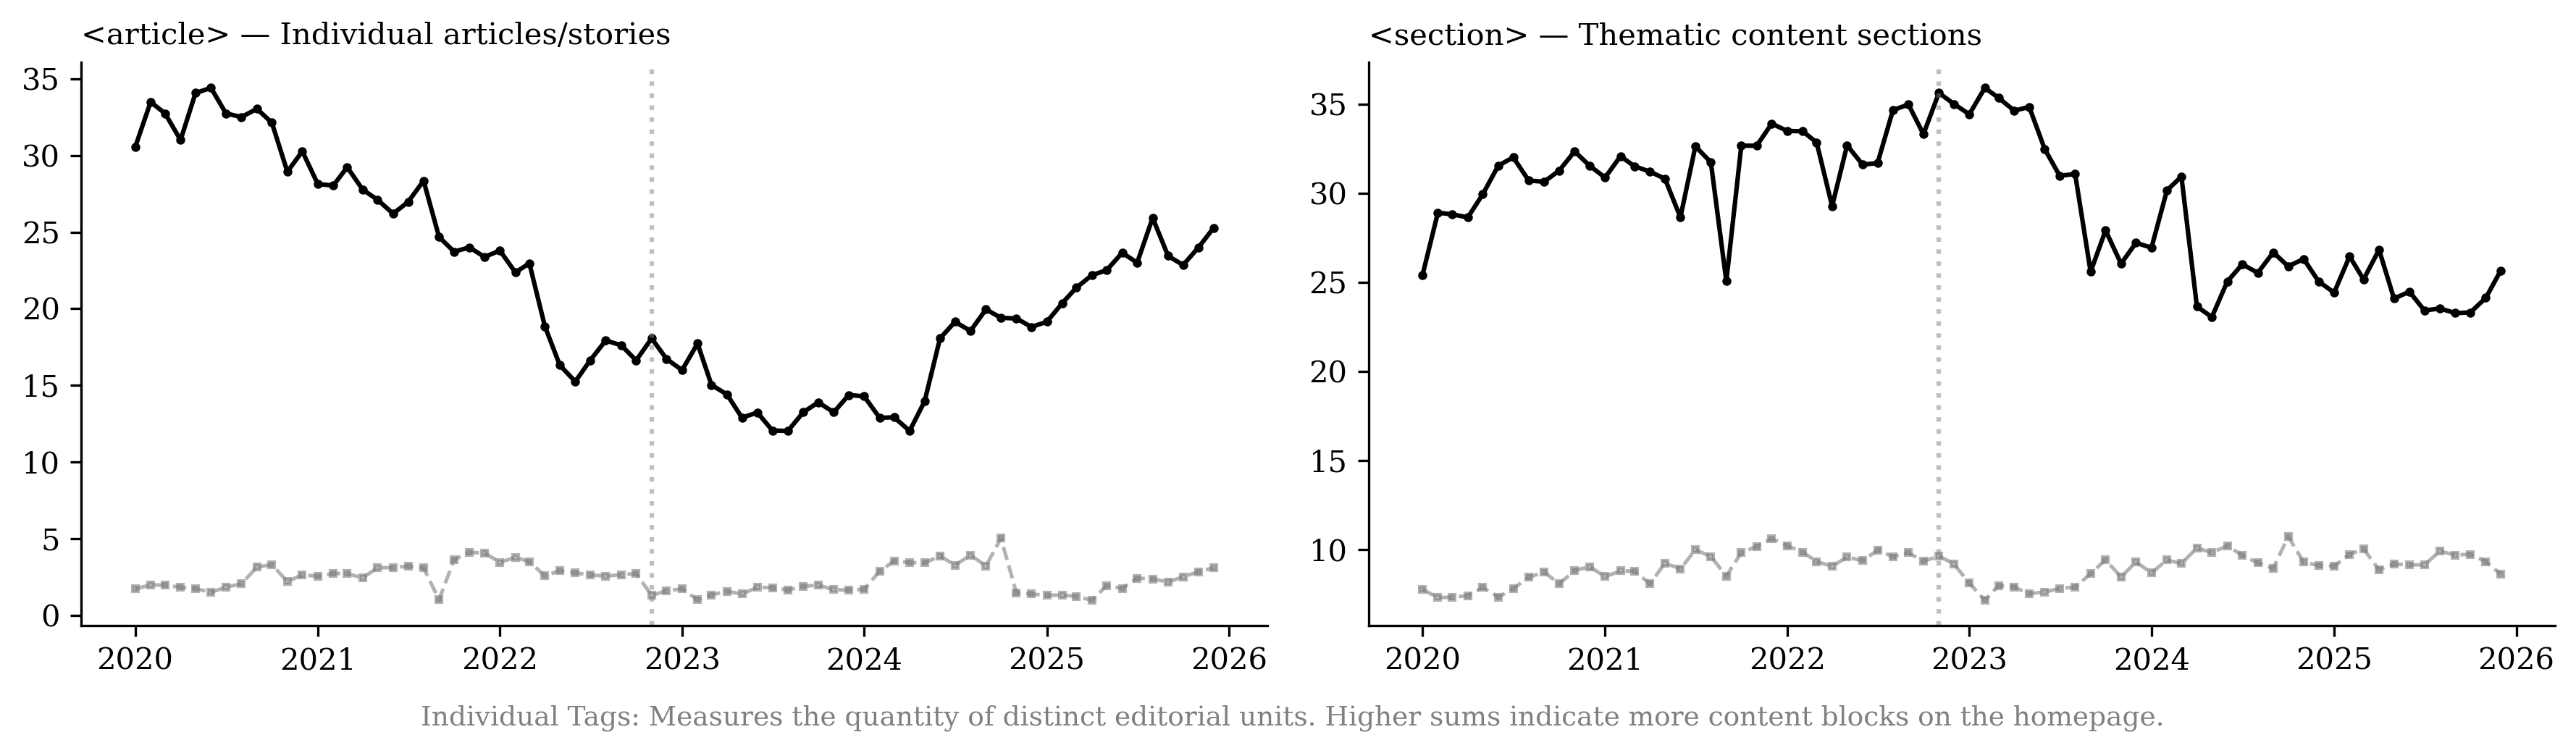
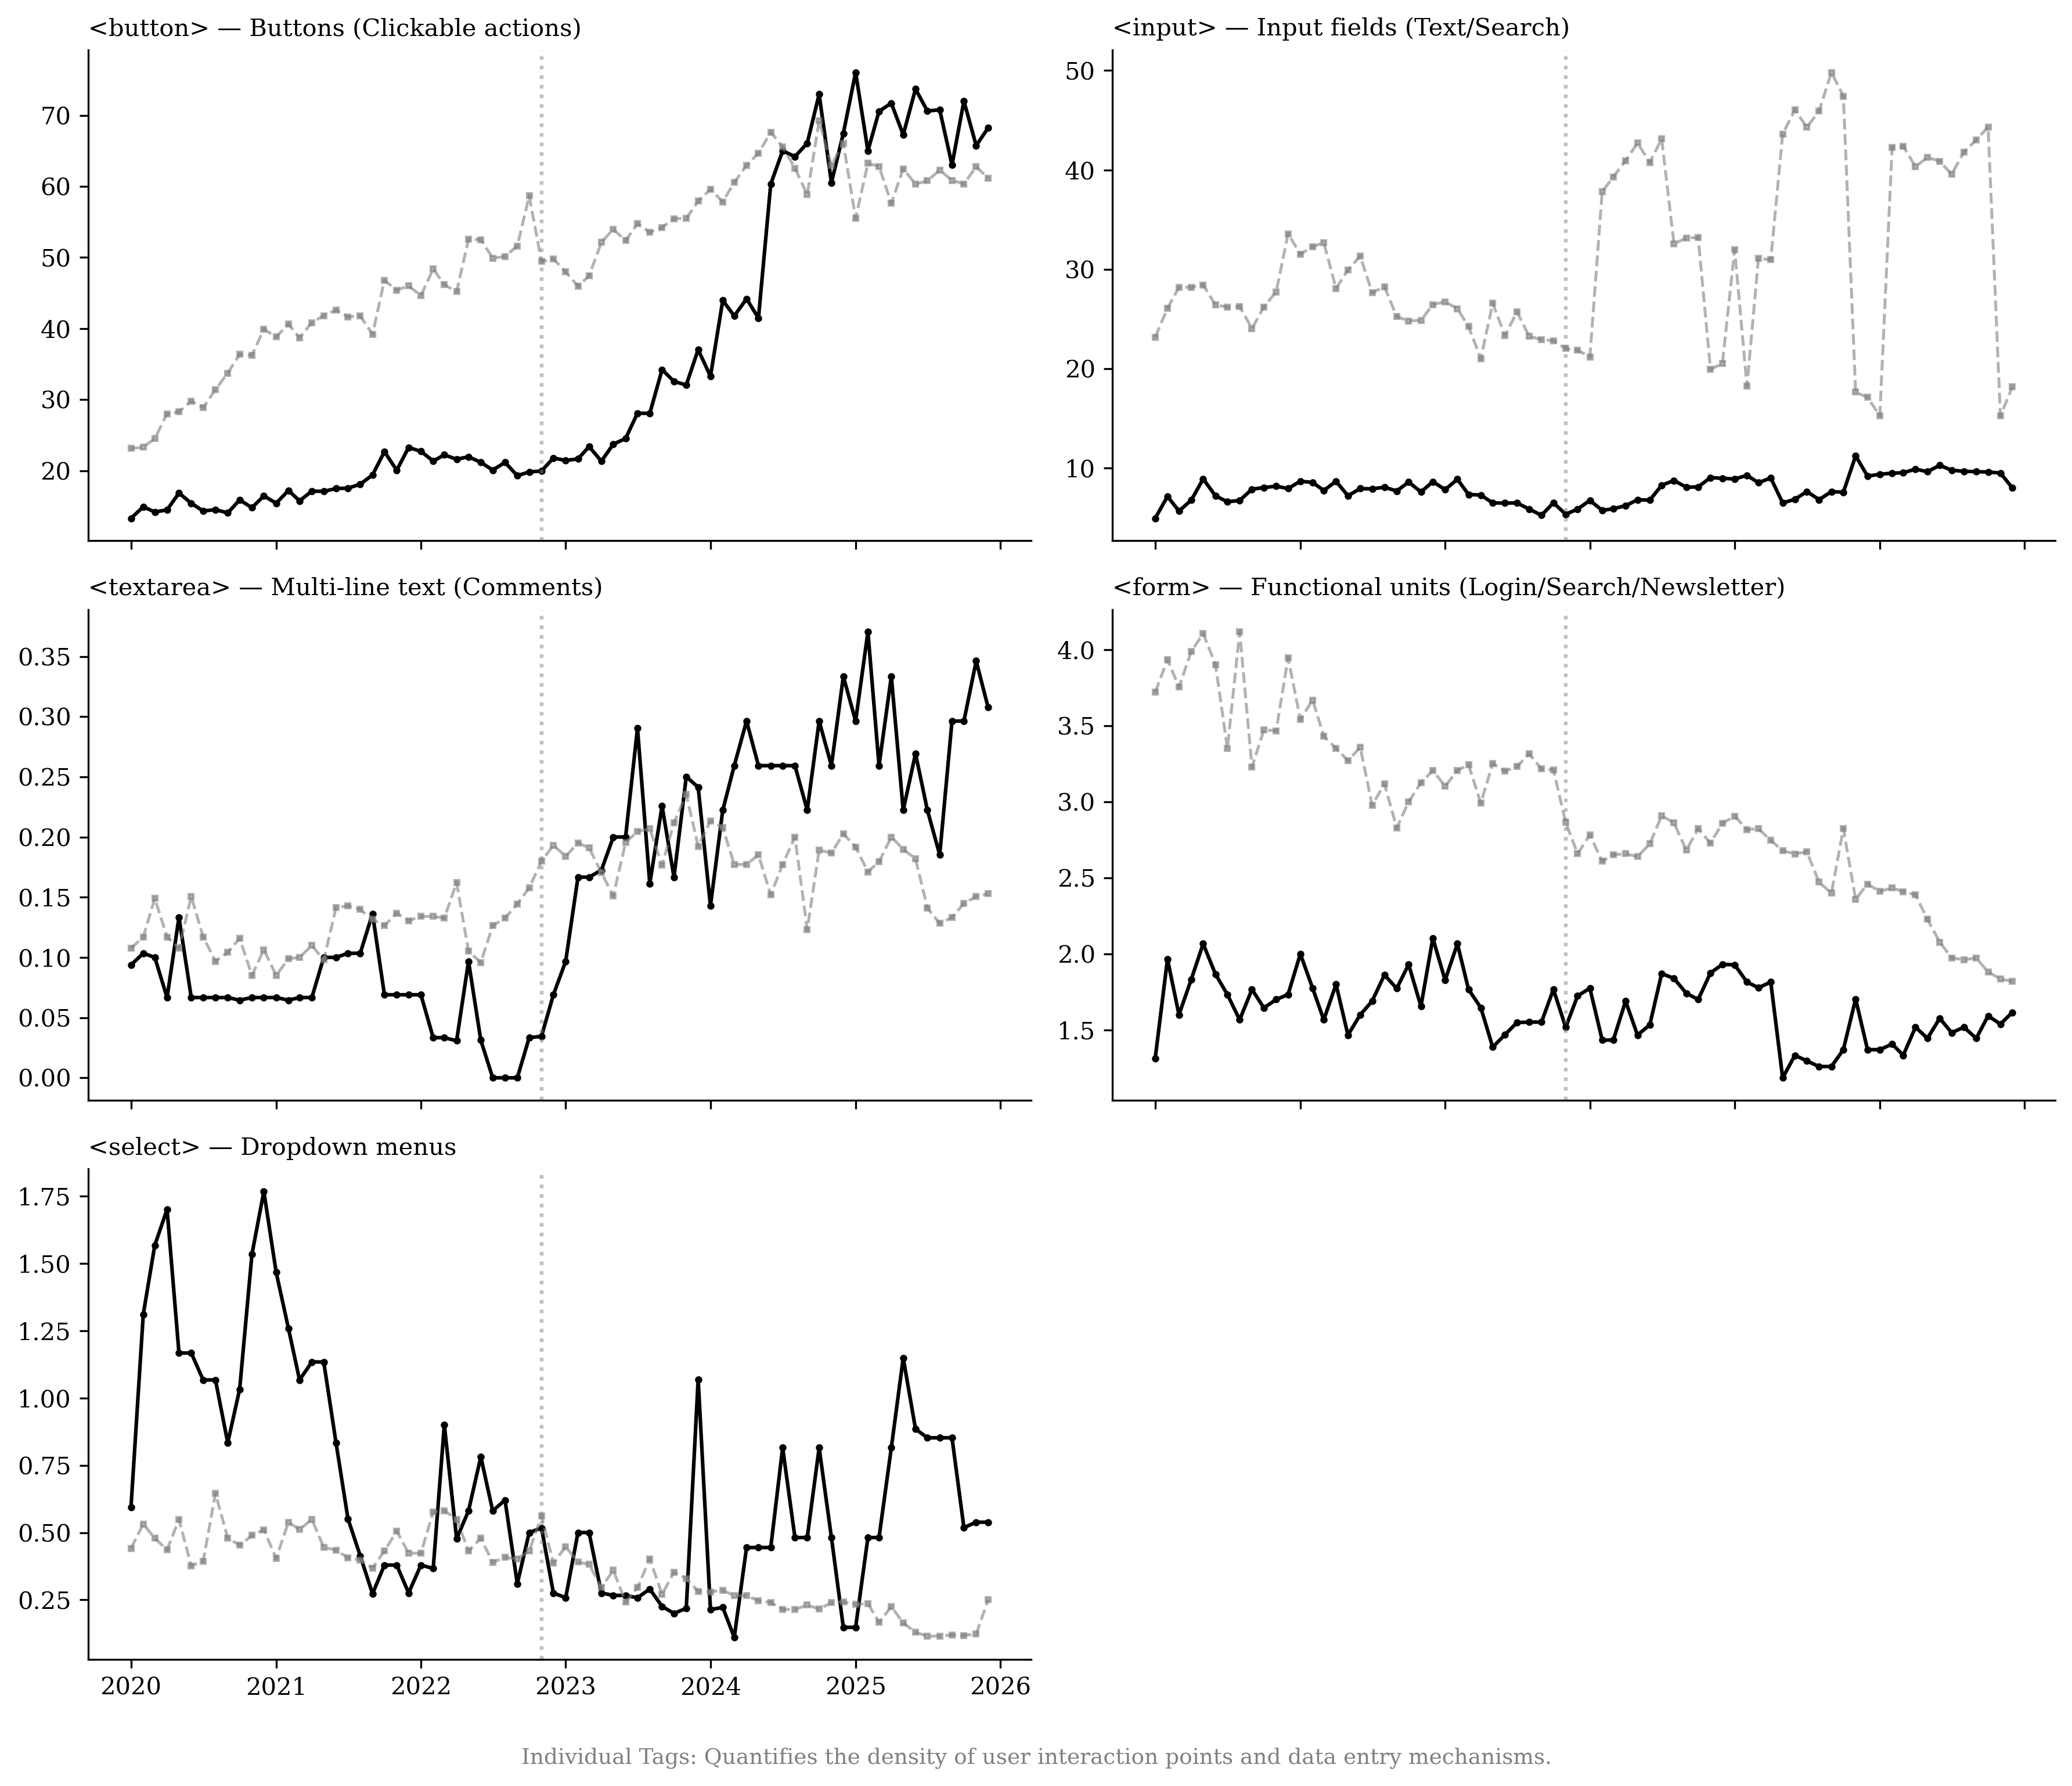
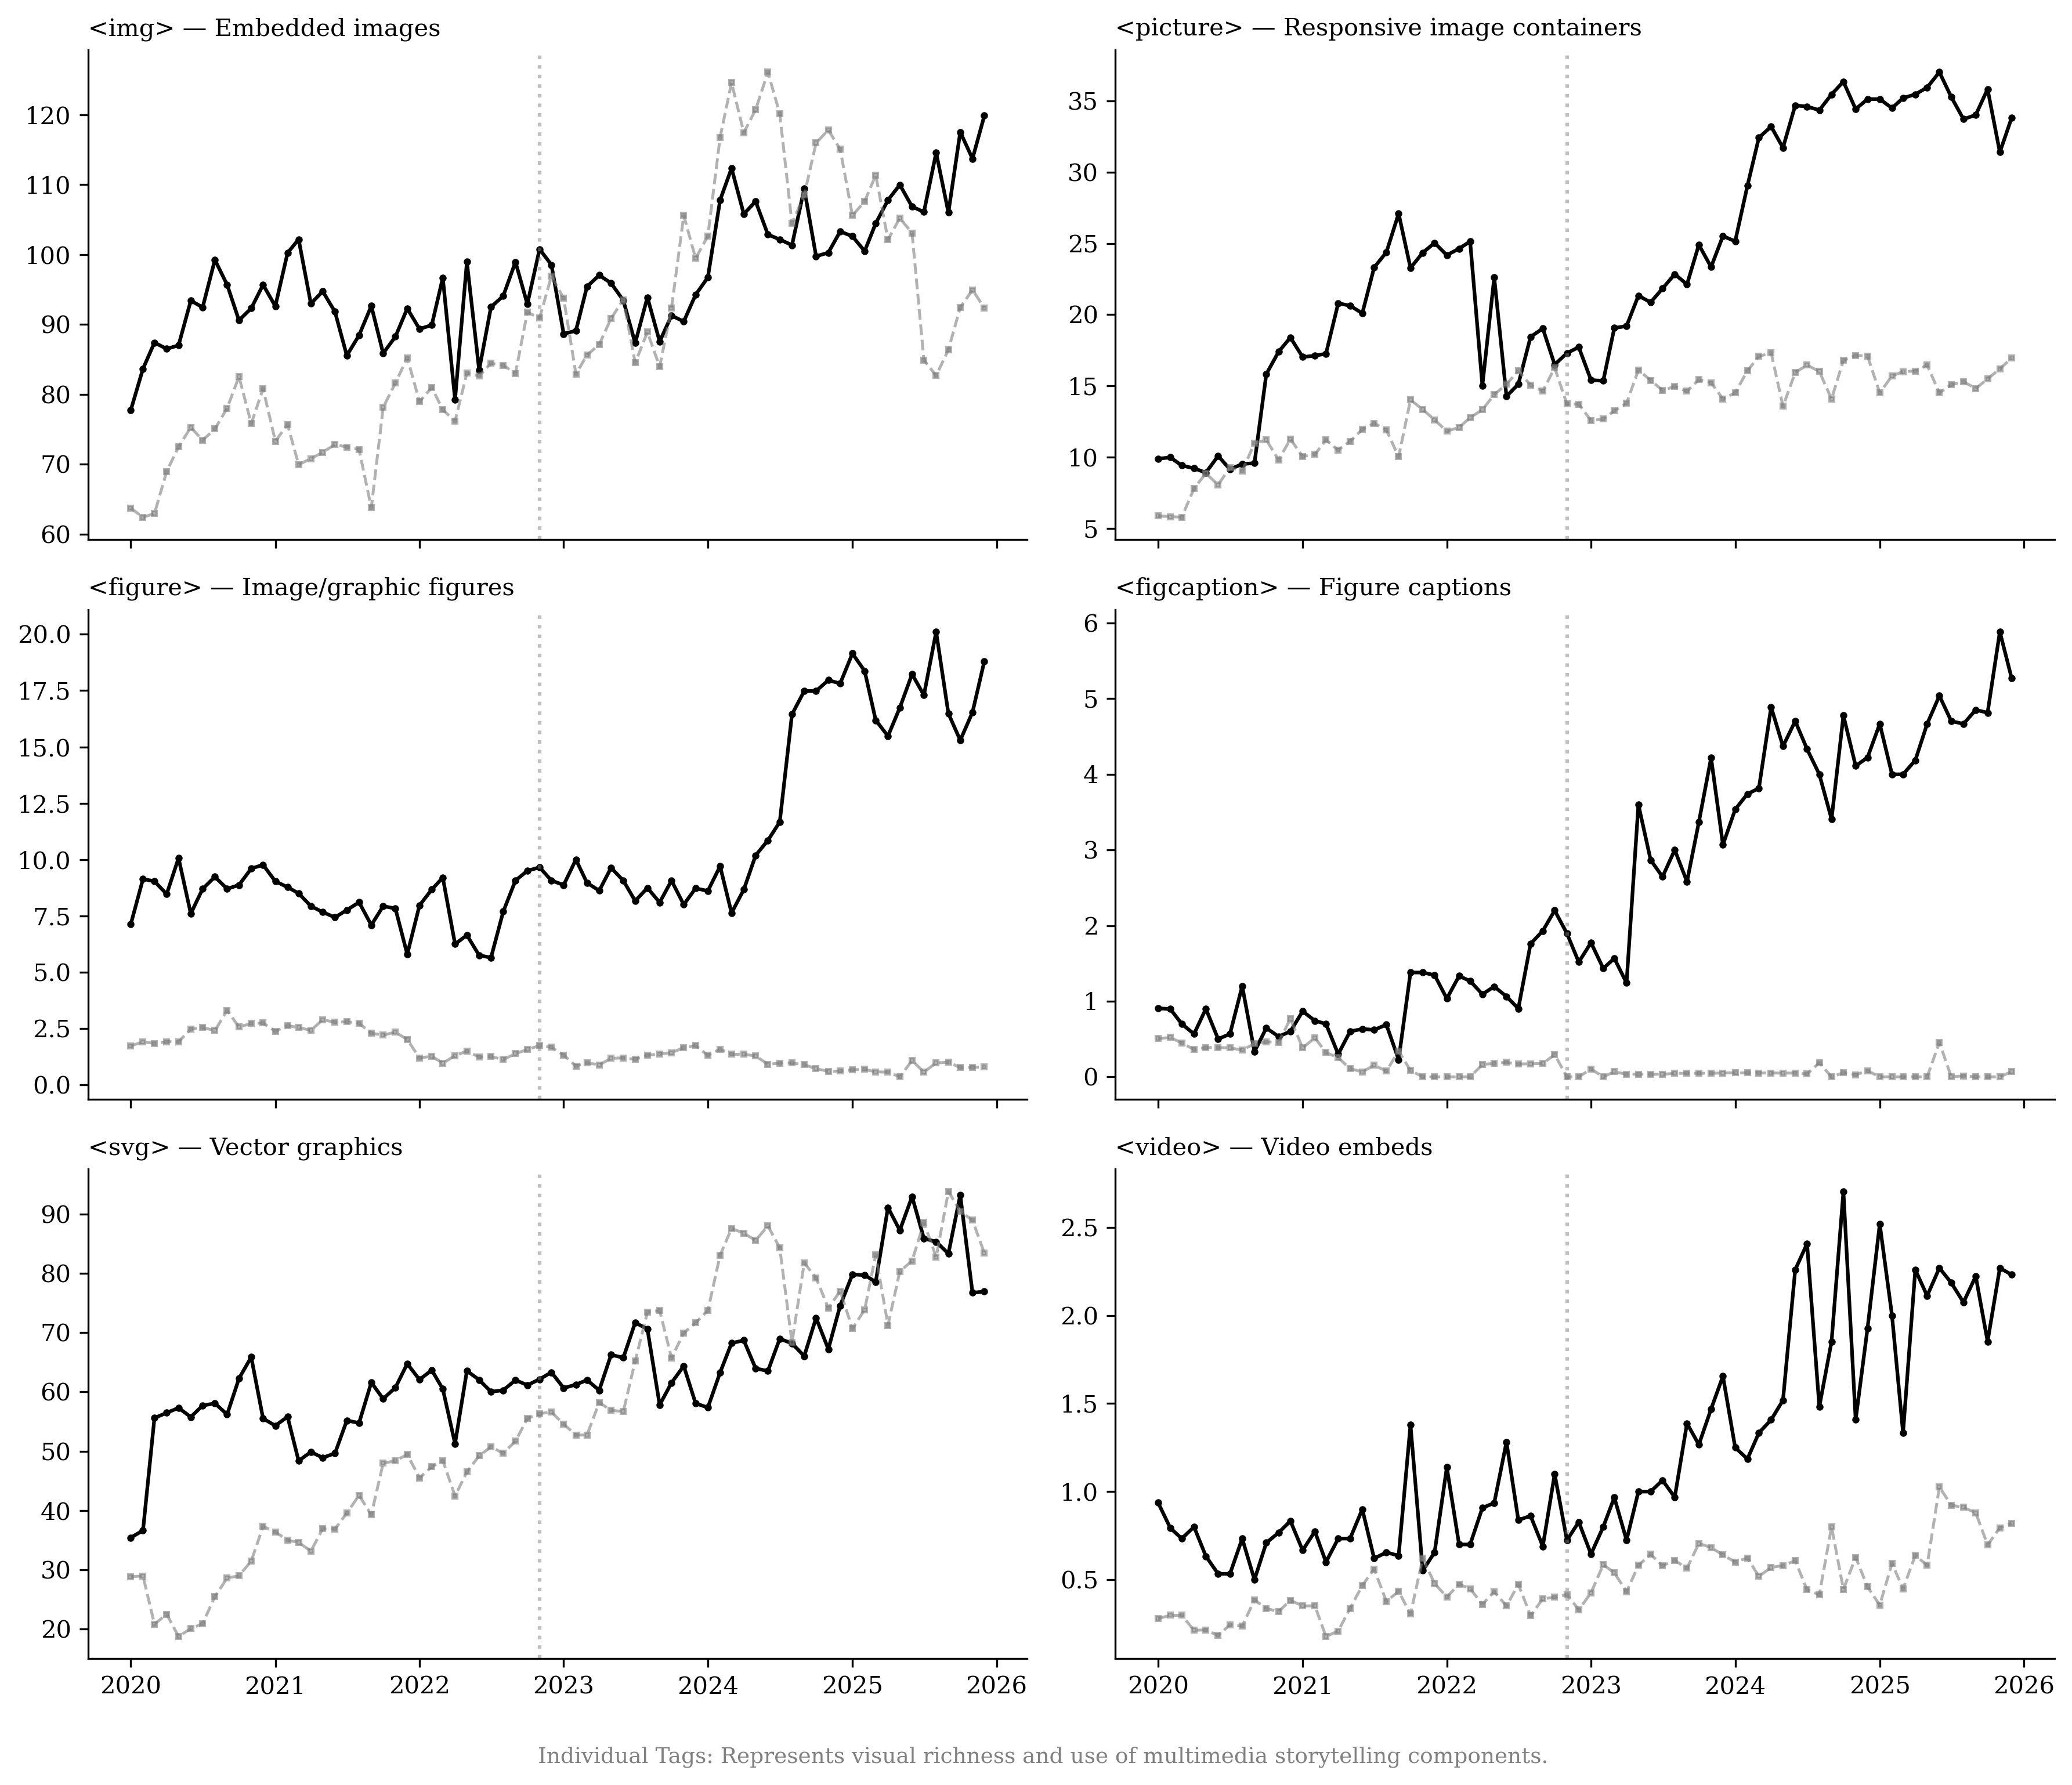
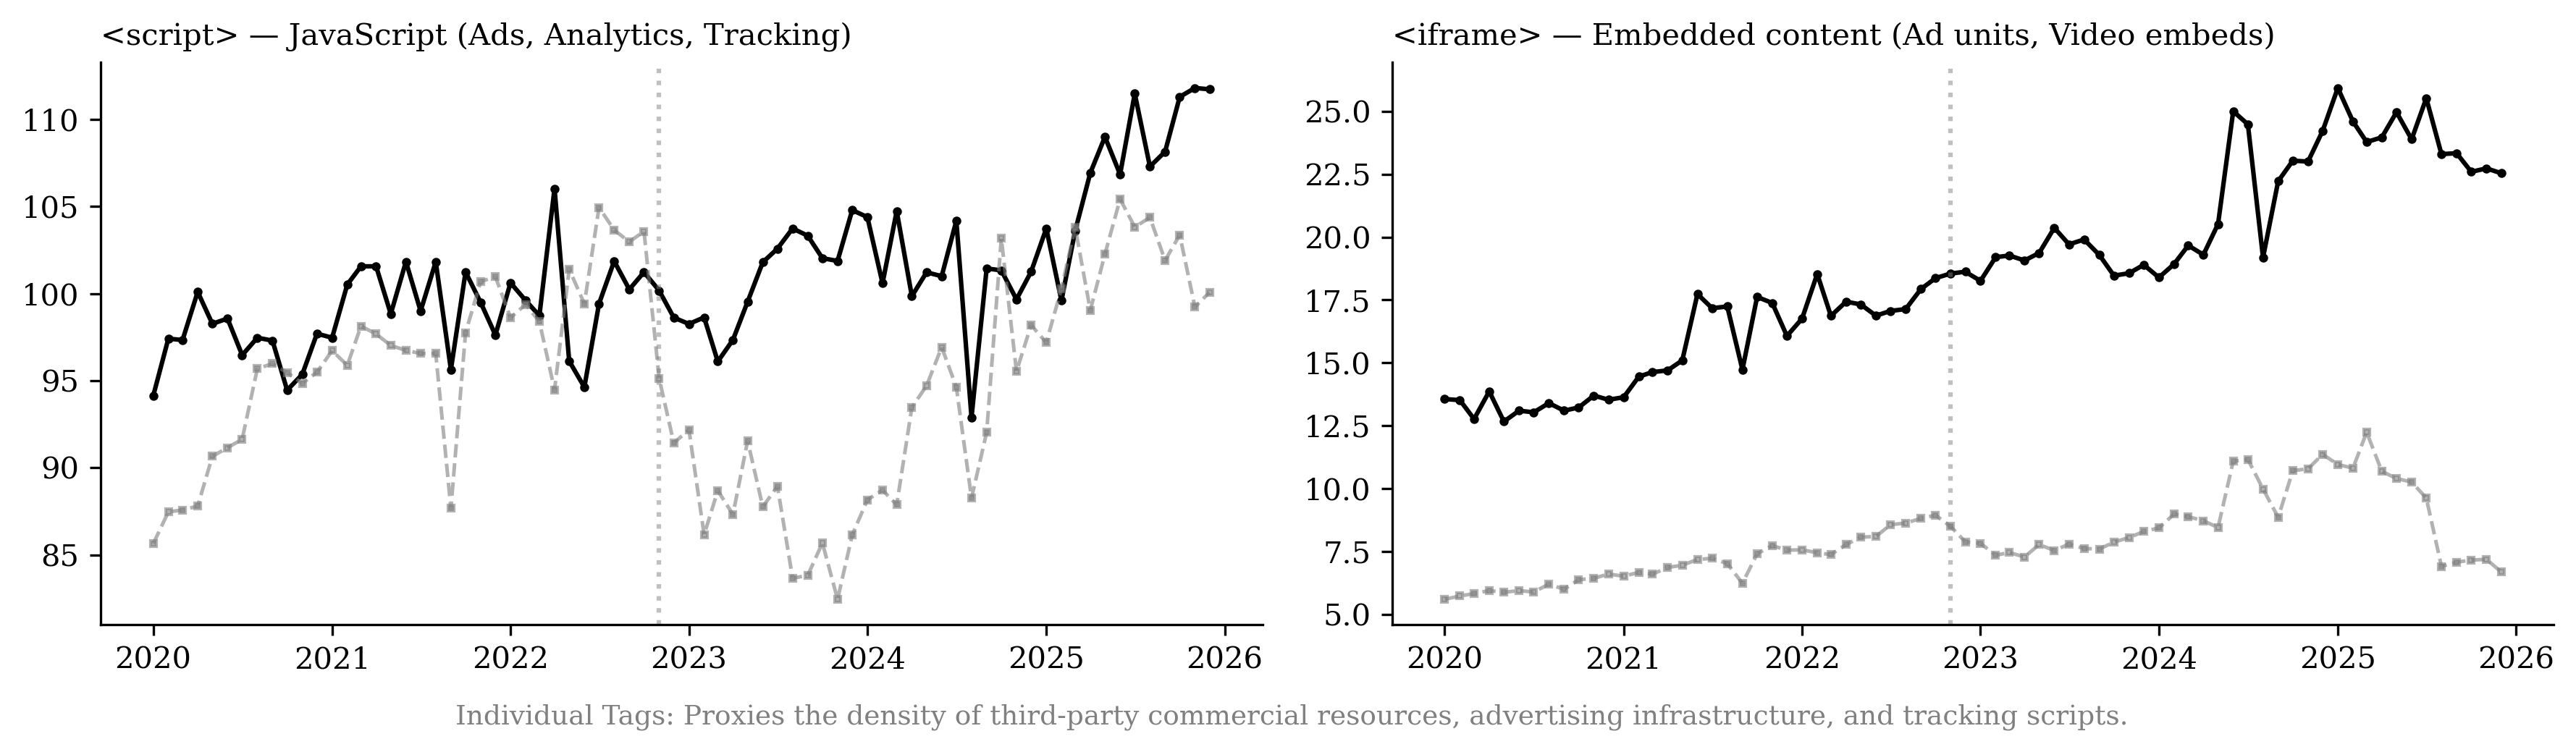
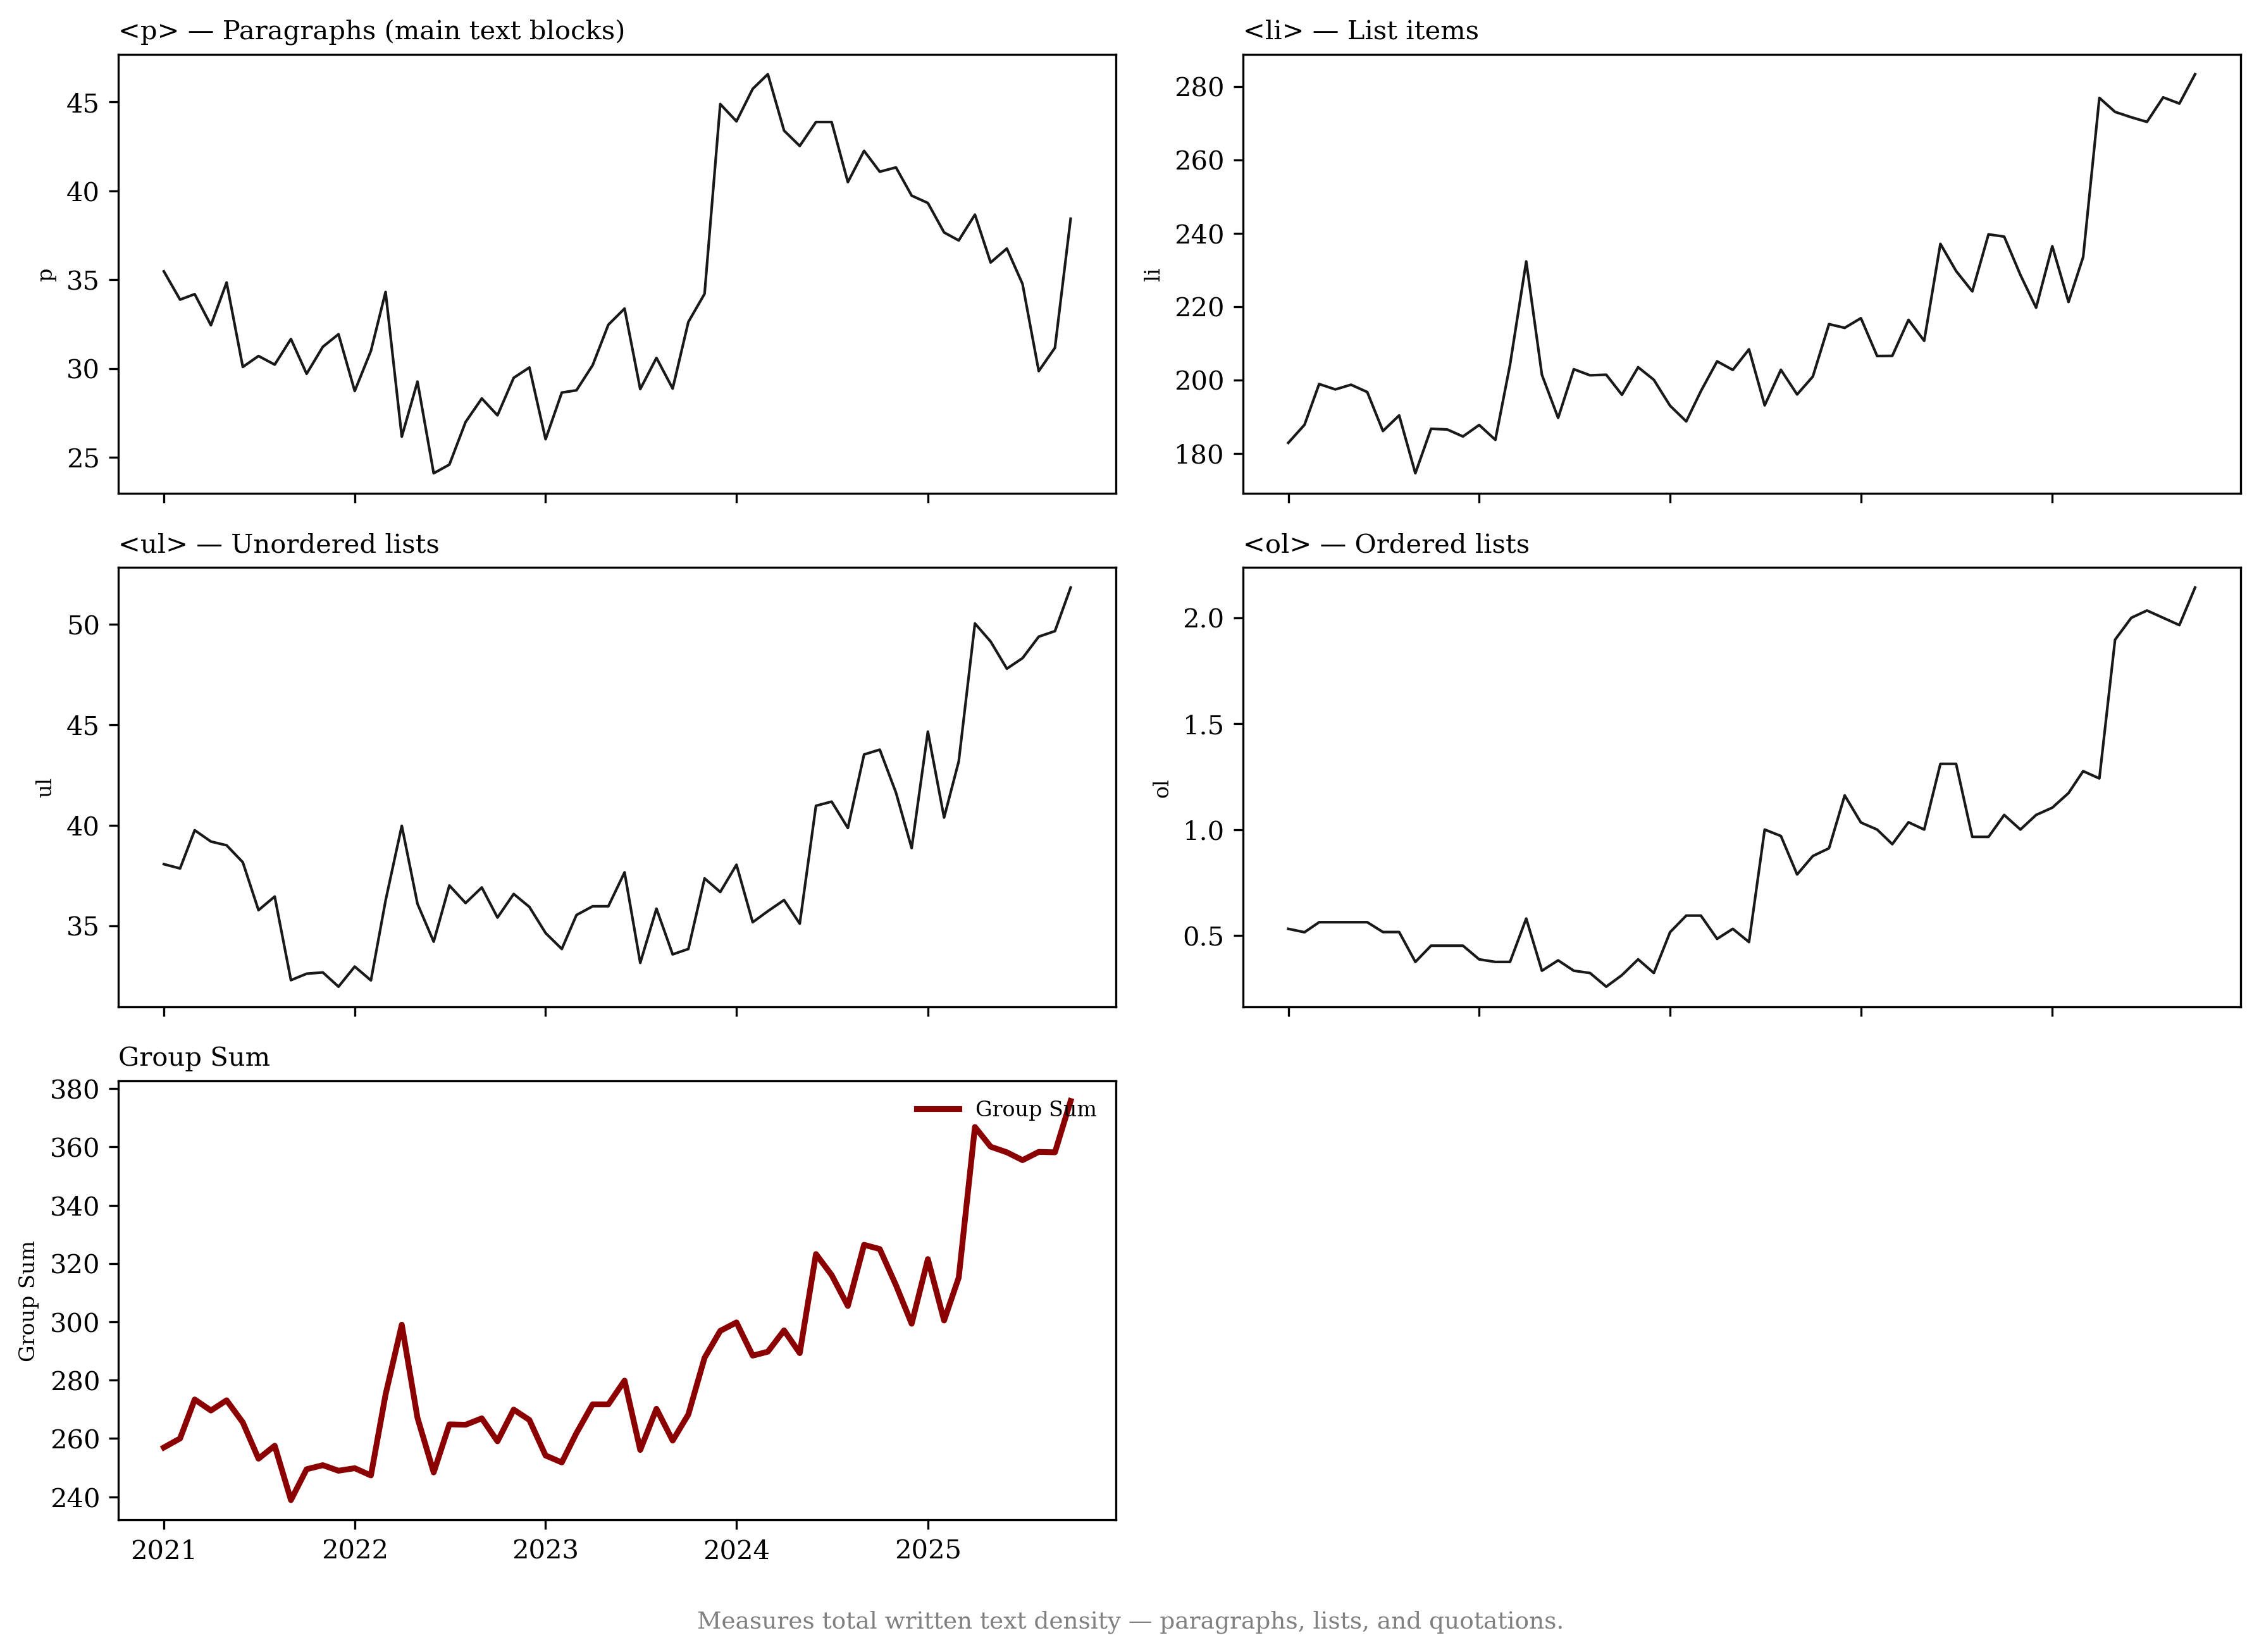
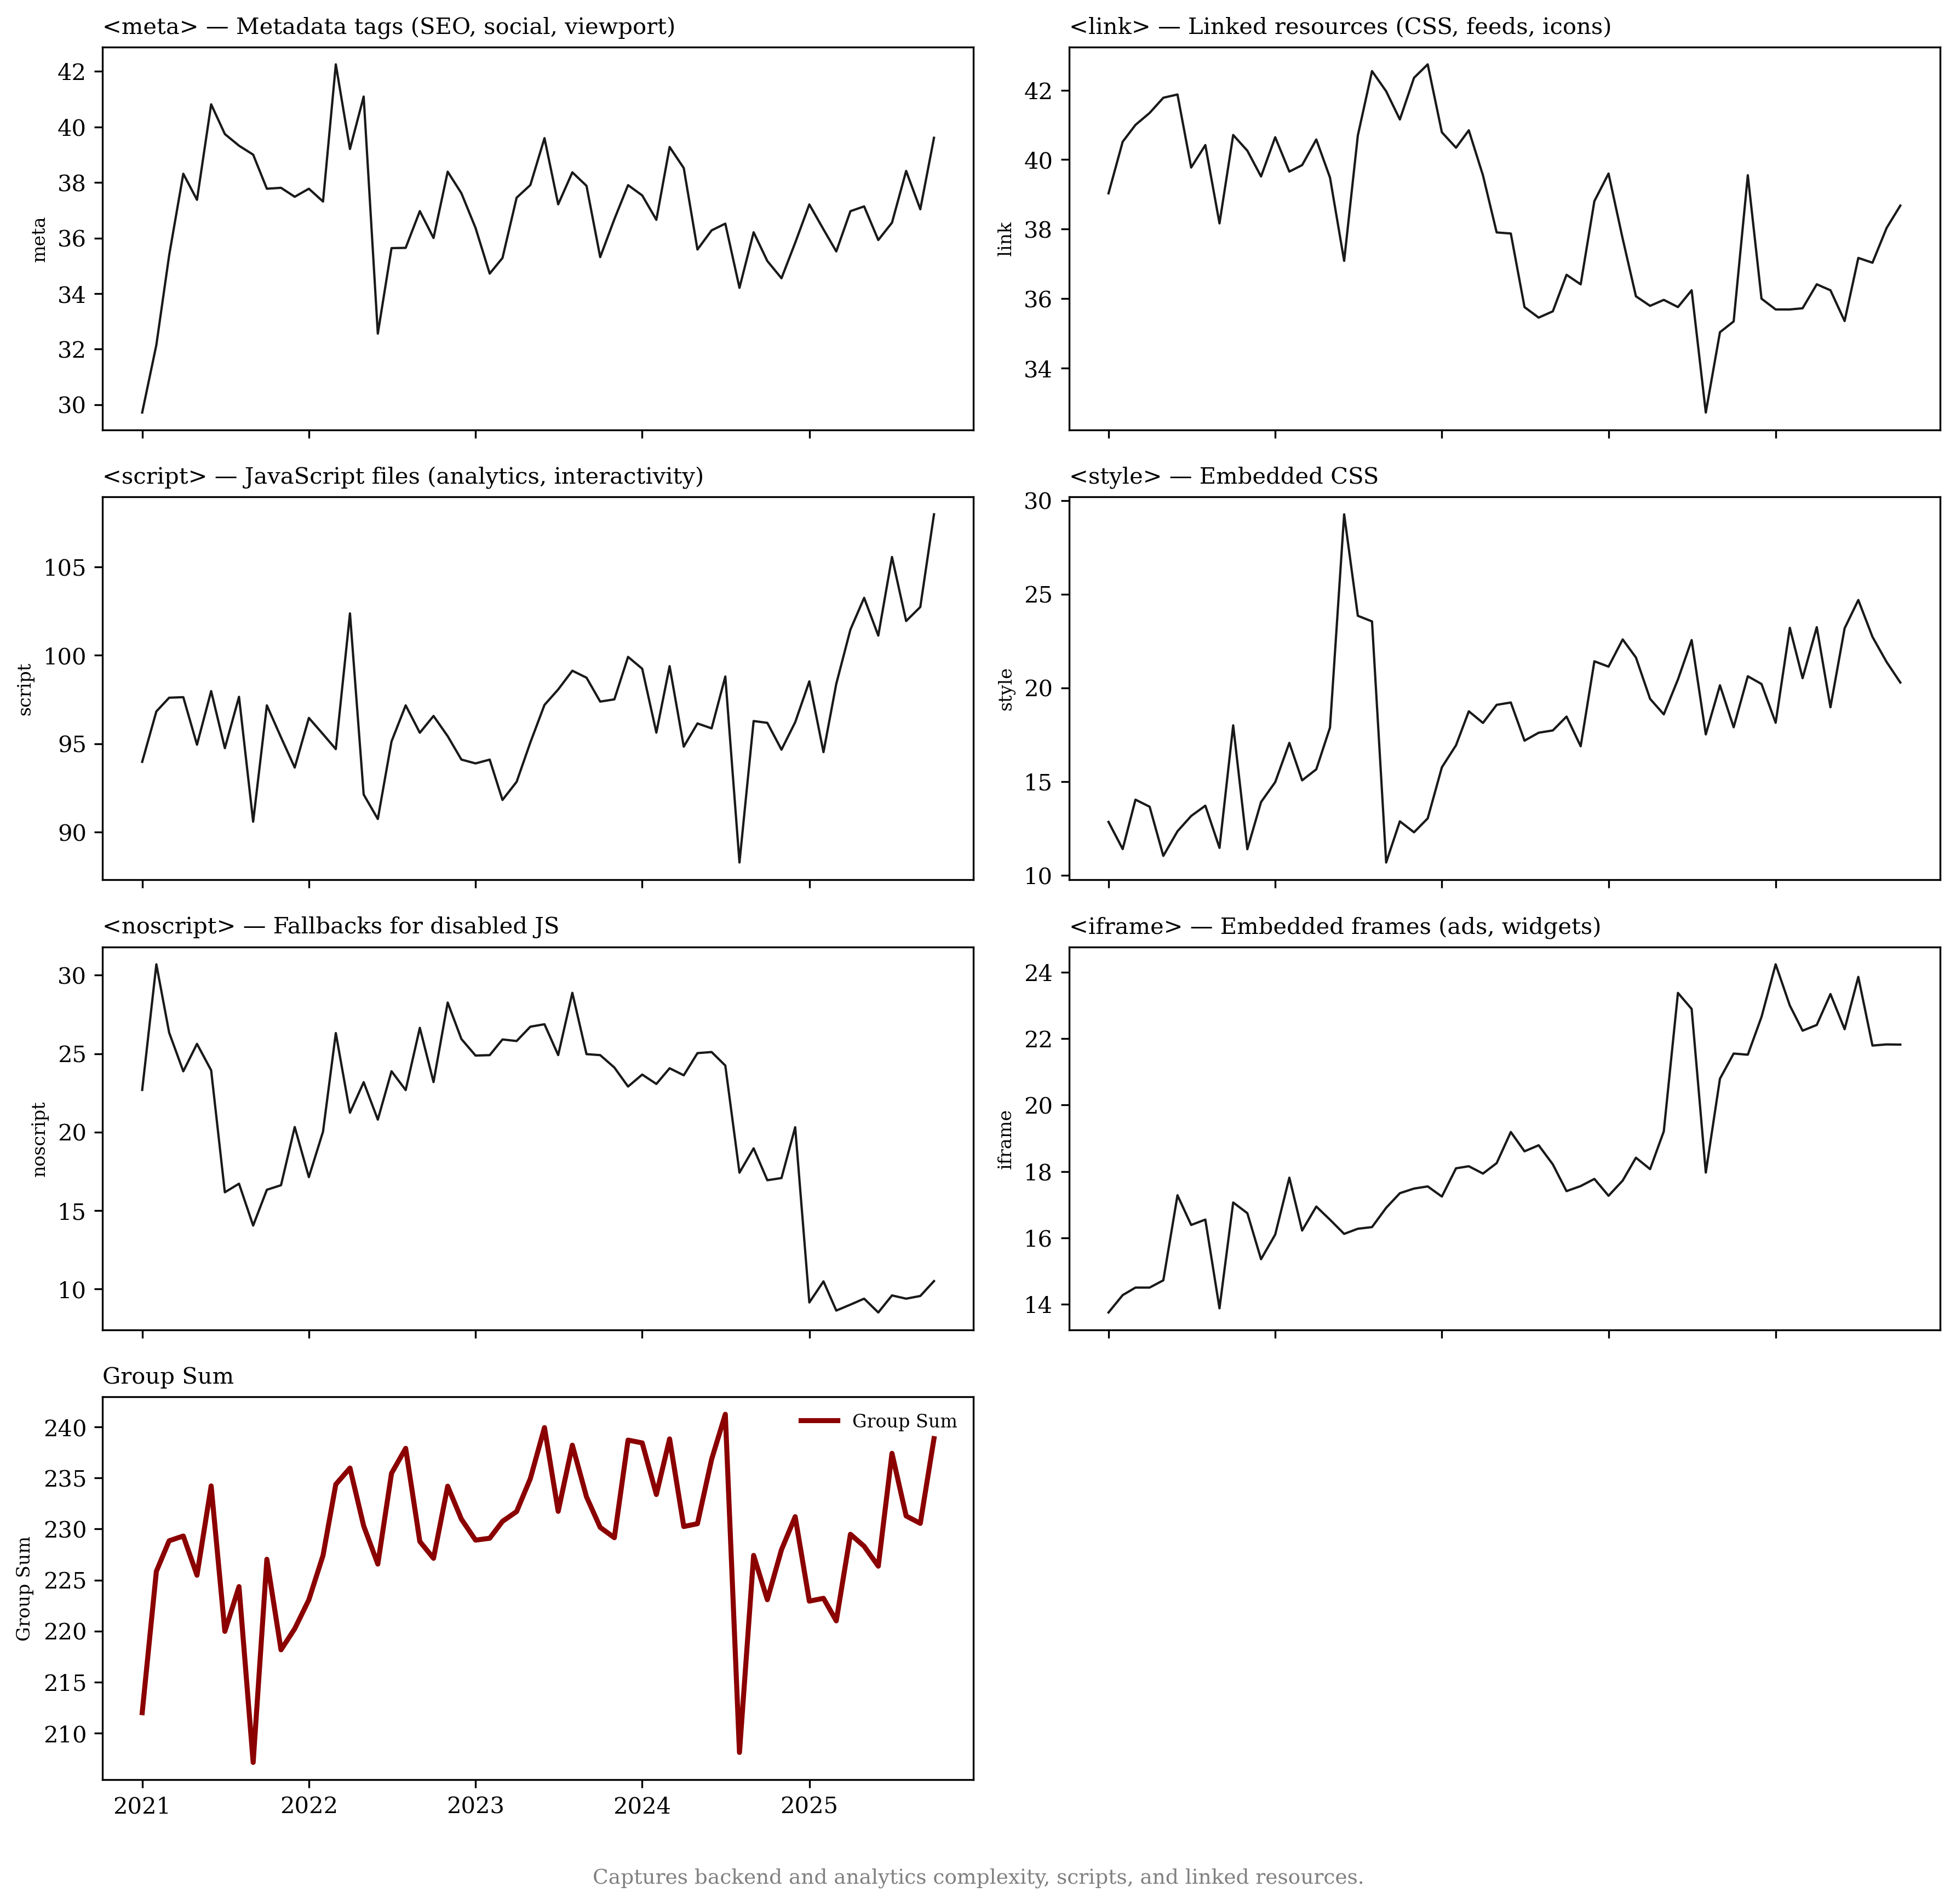
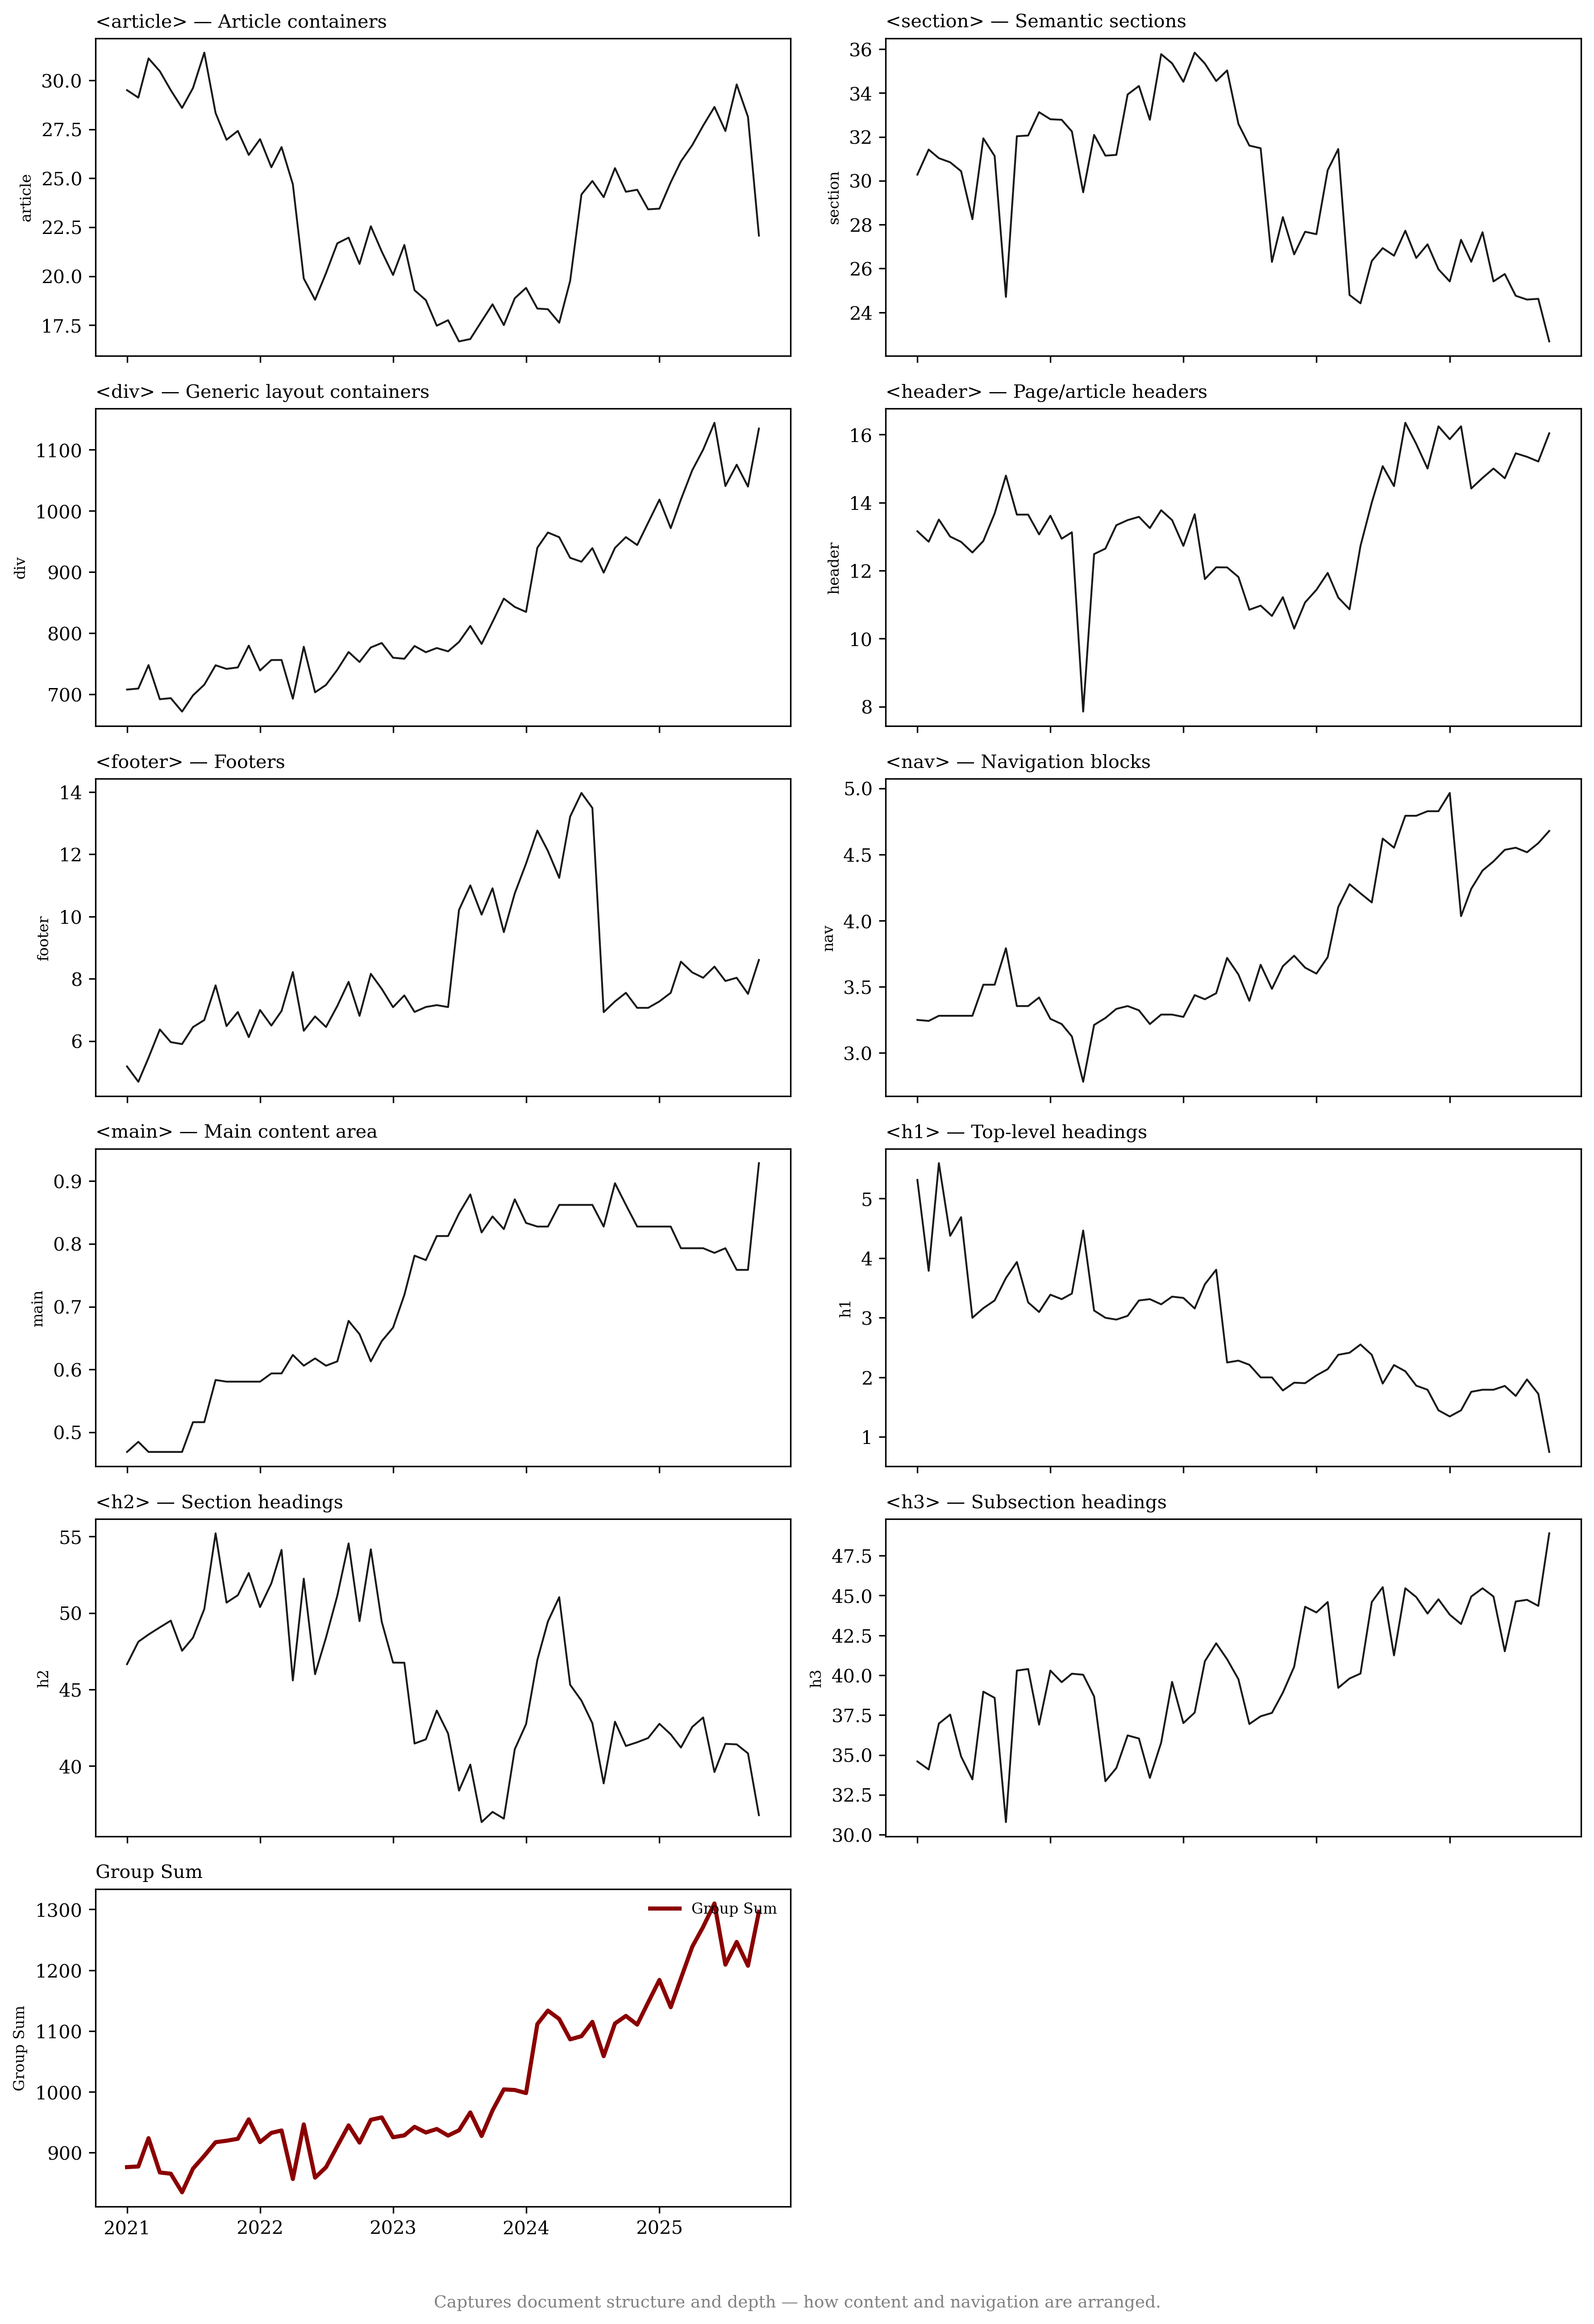
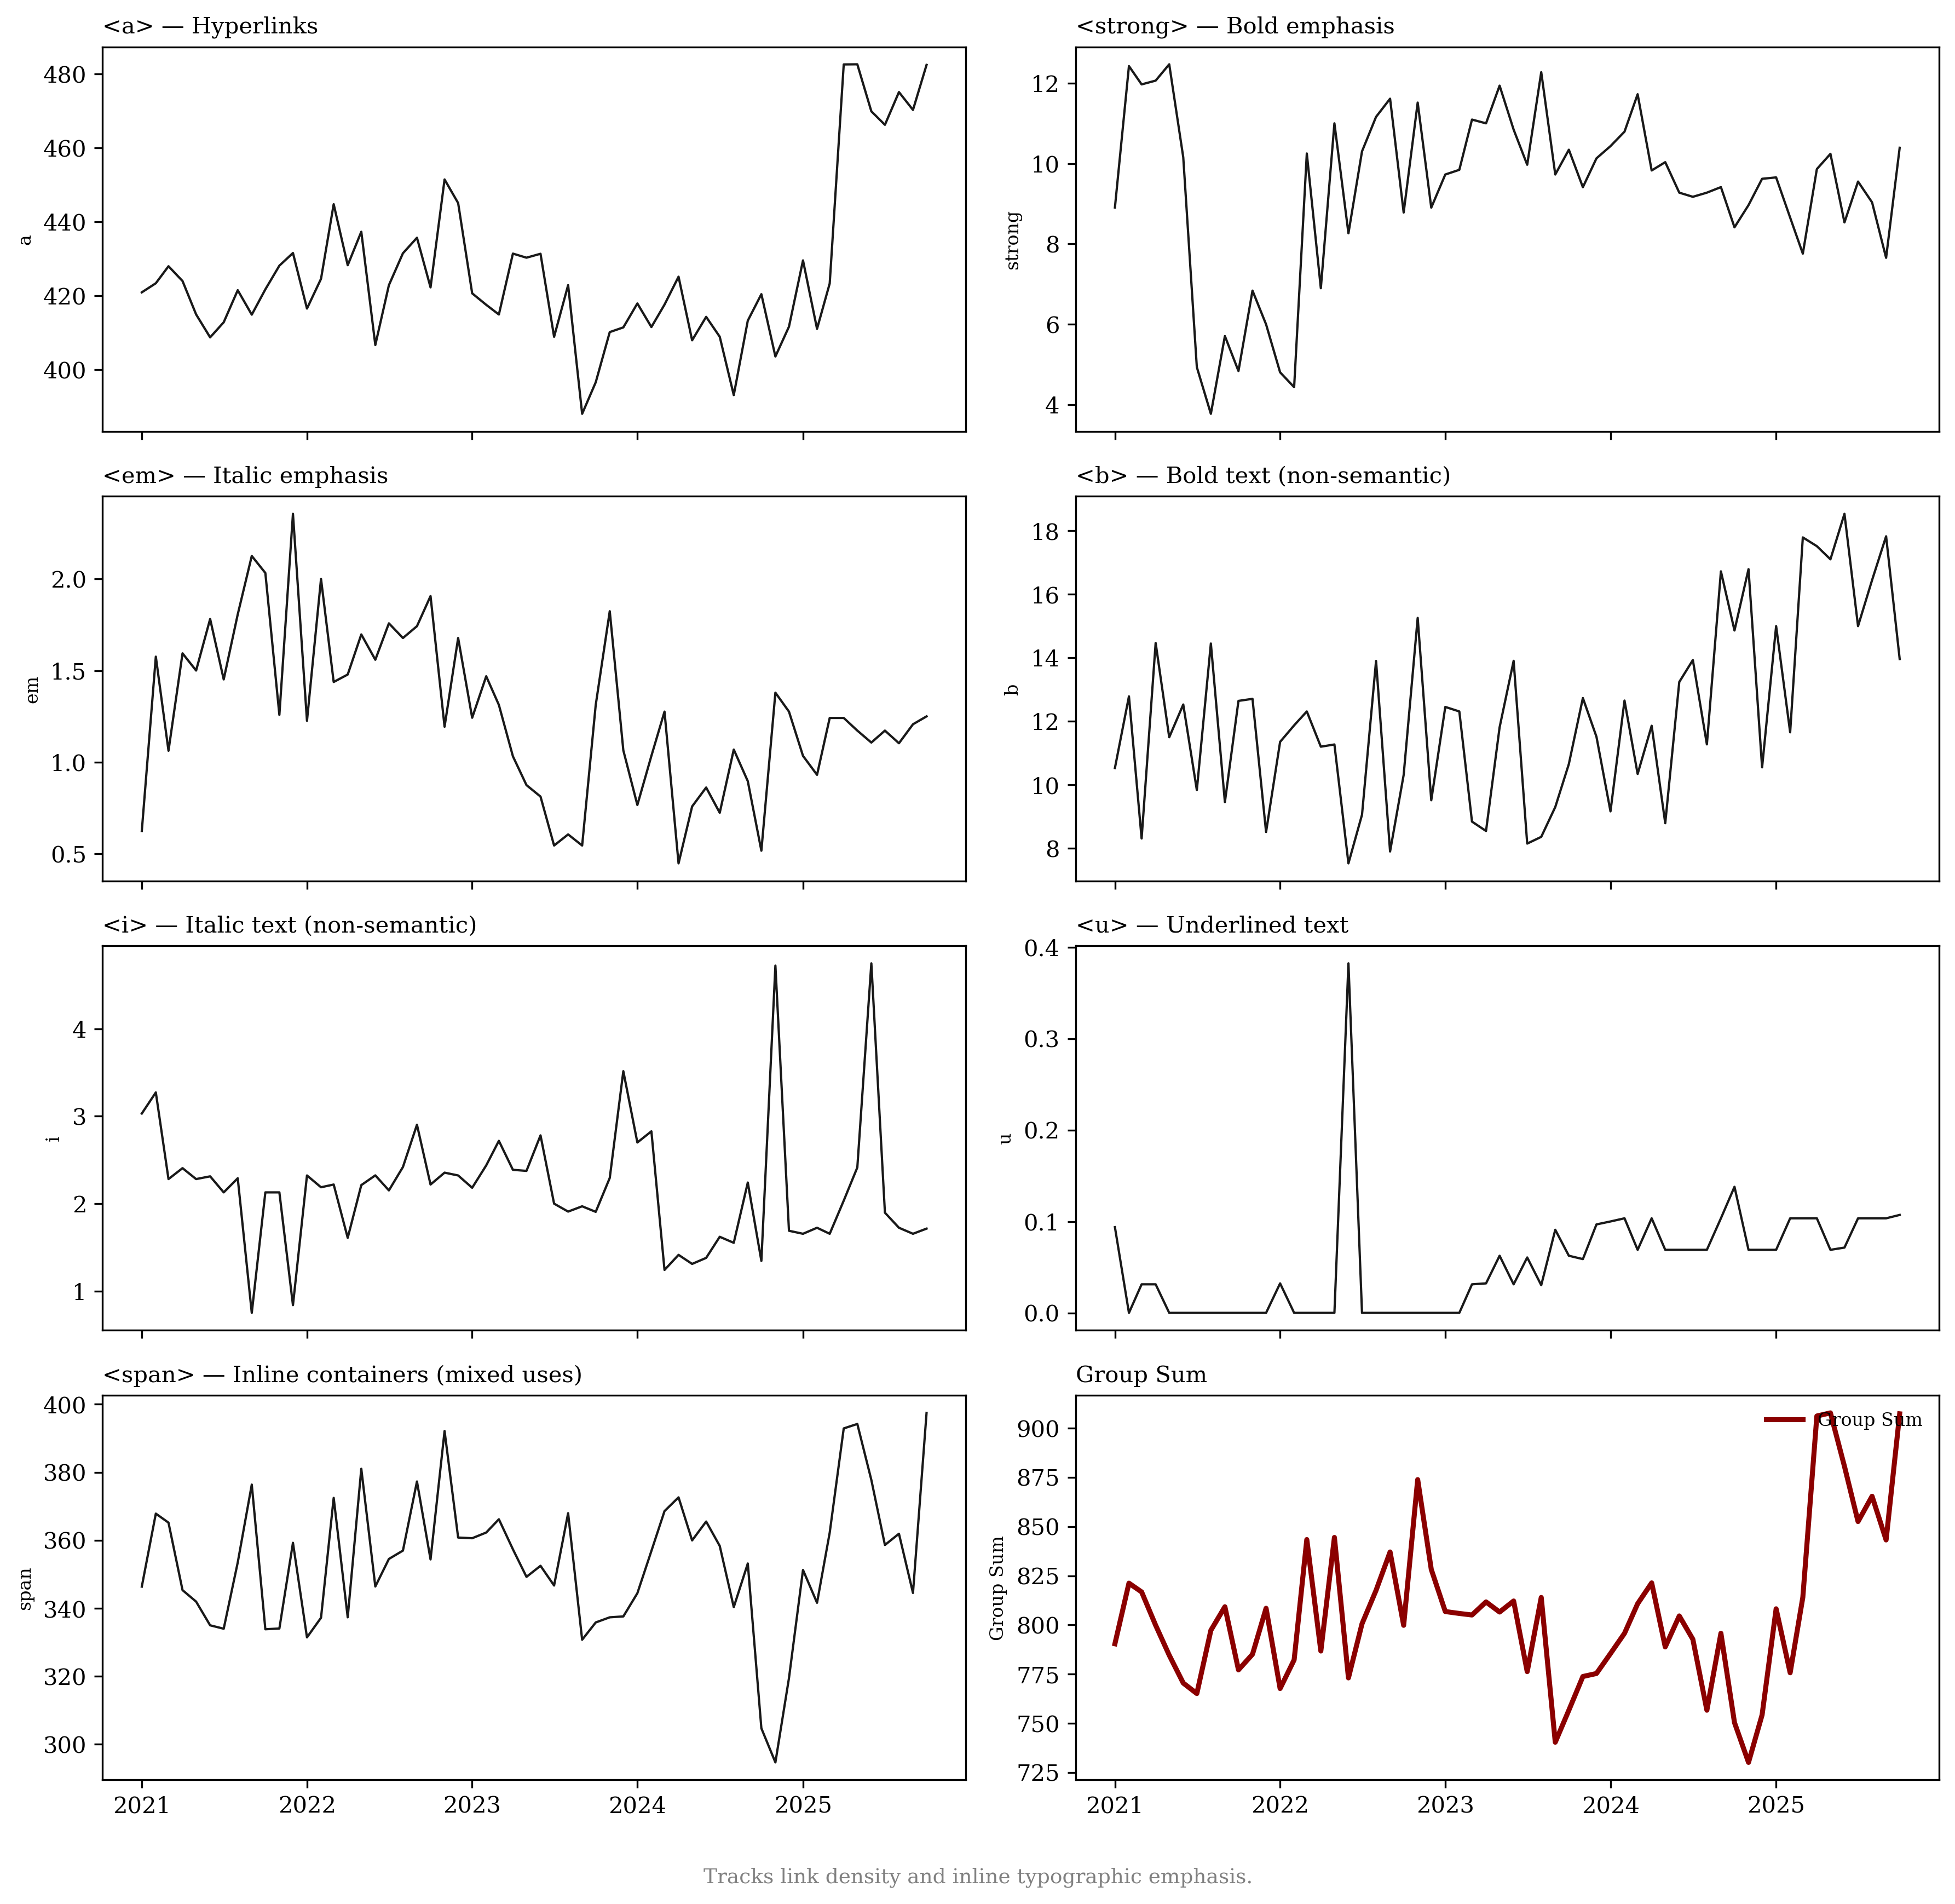
Effect 4: Publishers Shift Toward Media-Rich Content Rather Than Scaling Text
We next examine how publishers adjust their content-supply strategies.
Using the HTTP Archive, we measure webpage composition by counting
specific HTML elements across functional categories: article volume
(e.g., <article>, <section>), visual and multimedia richness (e.g.,
<img>, <video>, <figure>), interactive mechanisms (e.g.,
<button>, <input>), and advertising and targeting technologies
(e.g., <script>, <iframe>). To control for broader web development
trends, we compare these patterns with a control group of the top 100
retail domains. Figure
20 plots time series of
average element counts for each category for both the publisher and
retail sectors, while Figures
36 through
39 present the
corresponding disaggregated element counts.
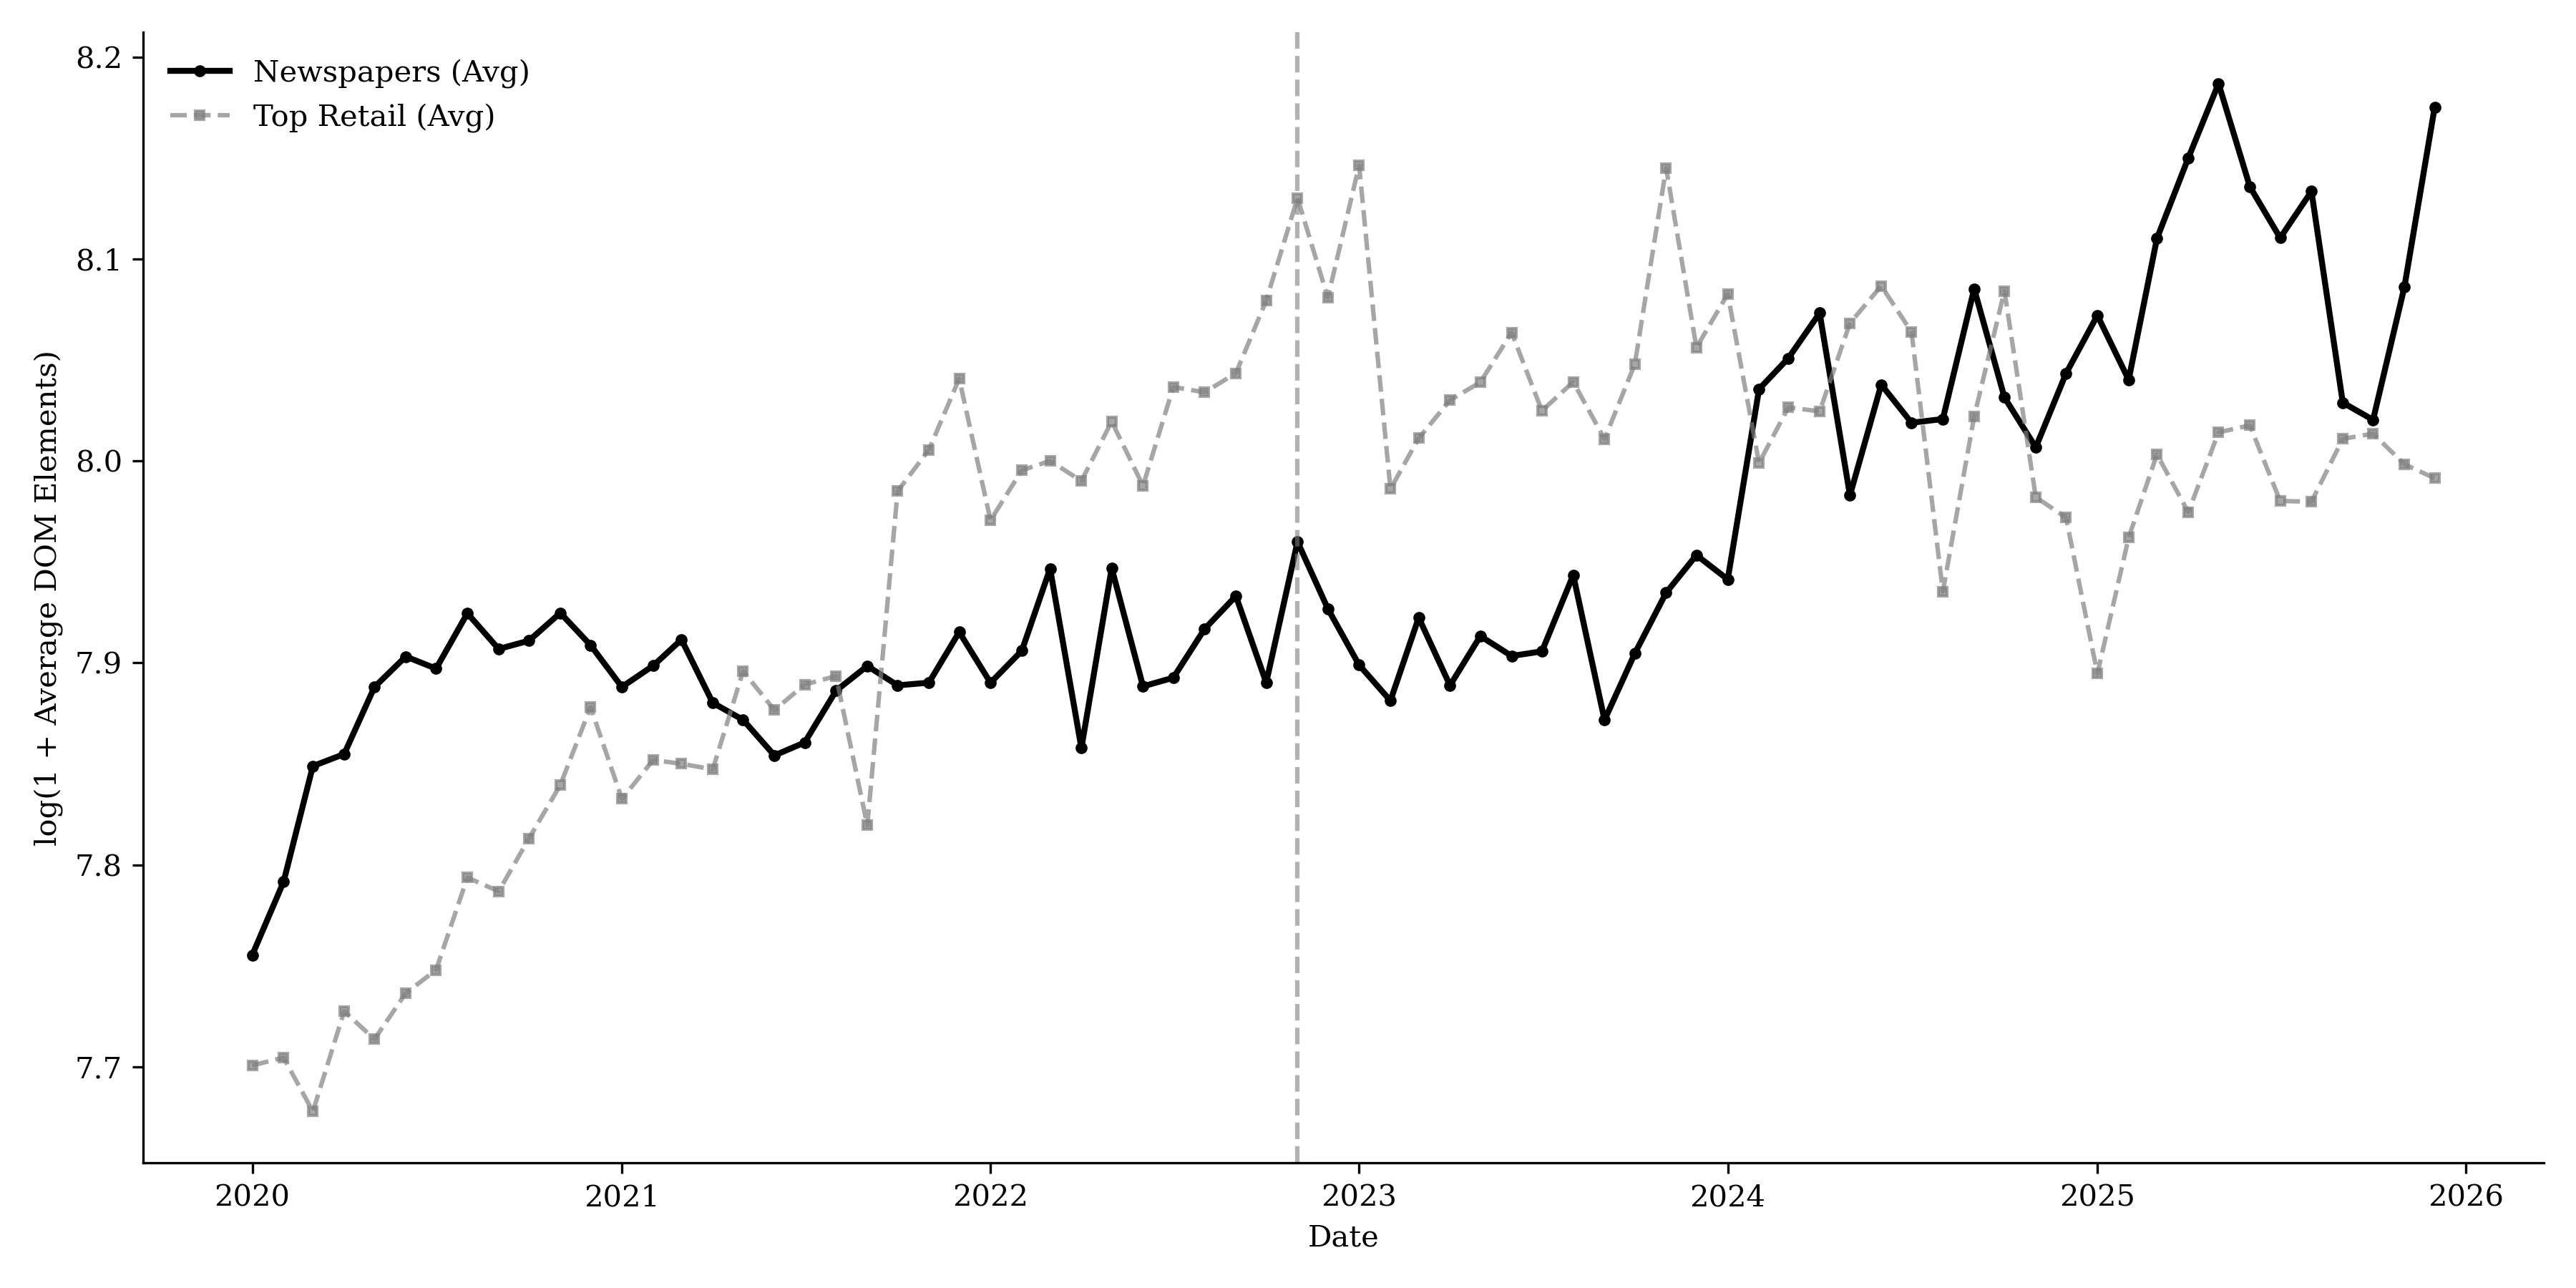
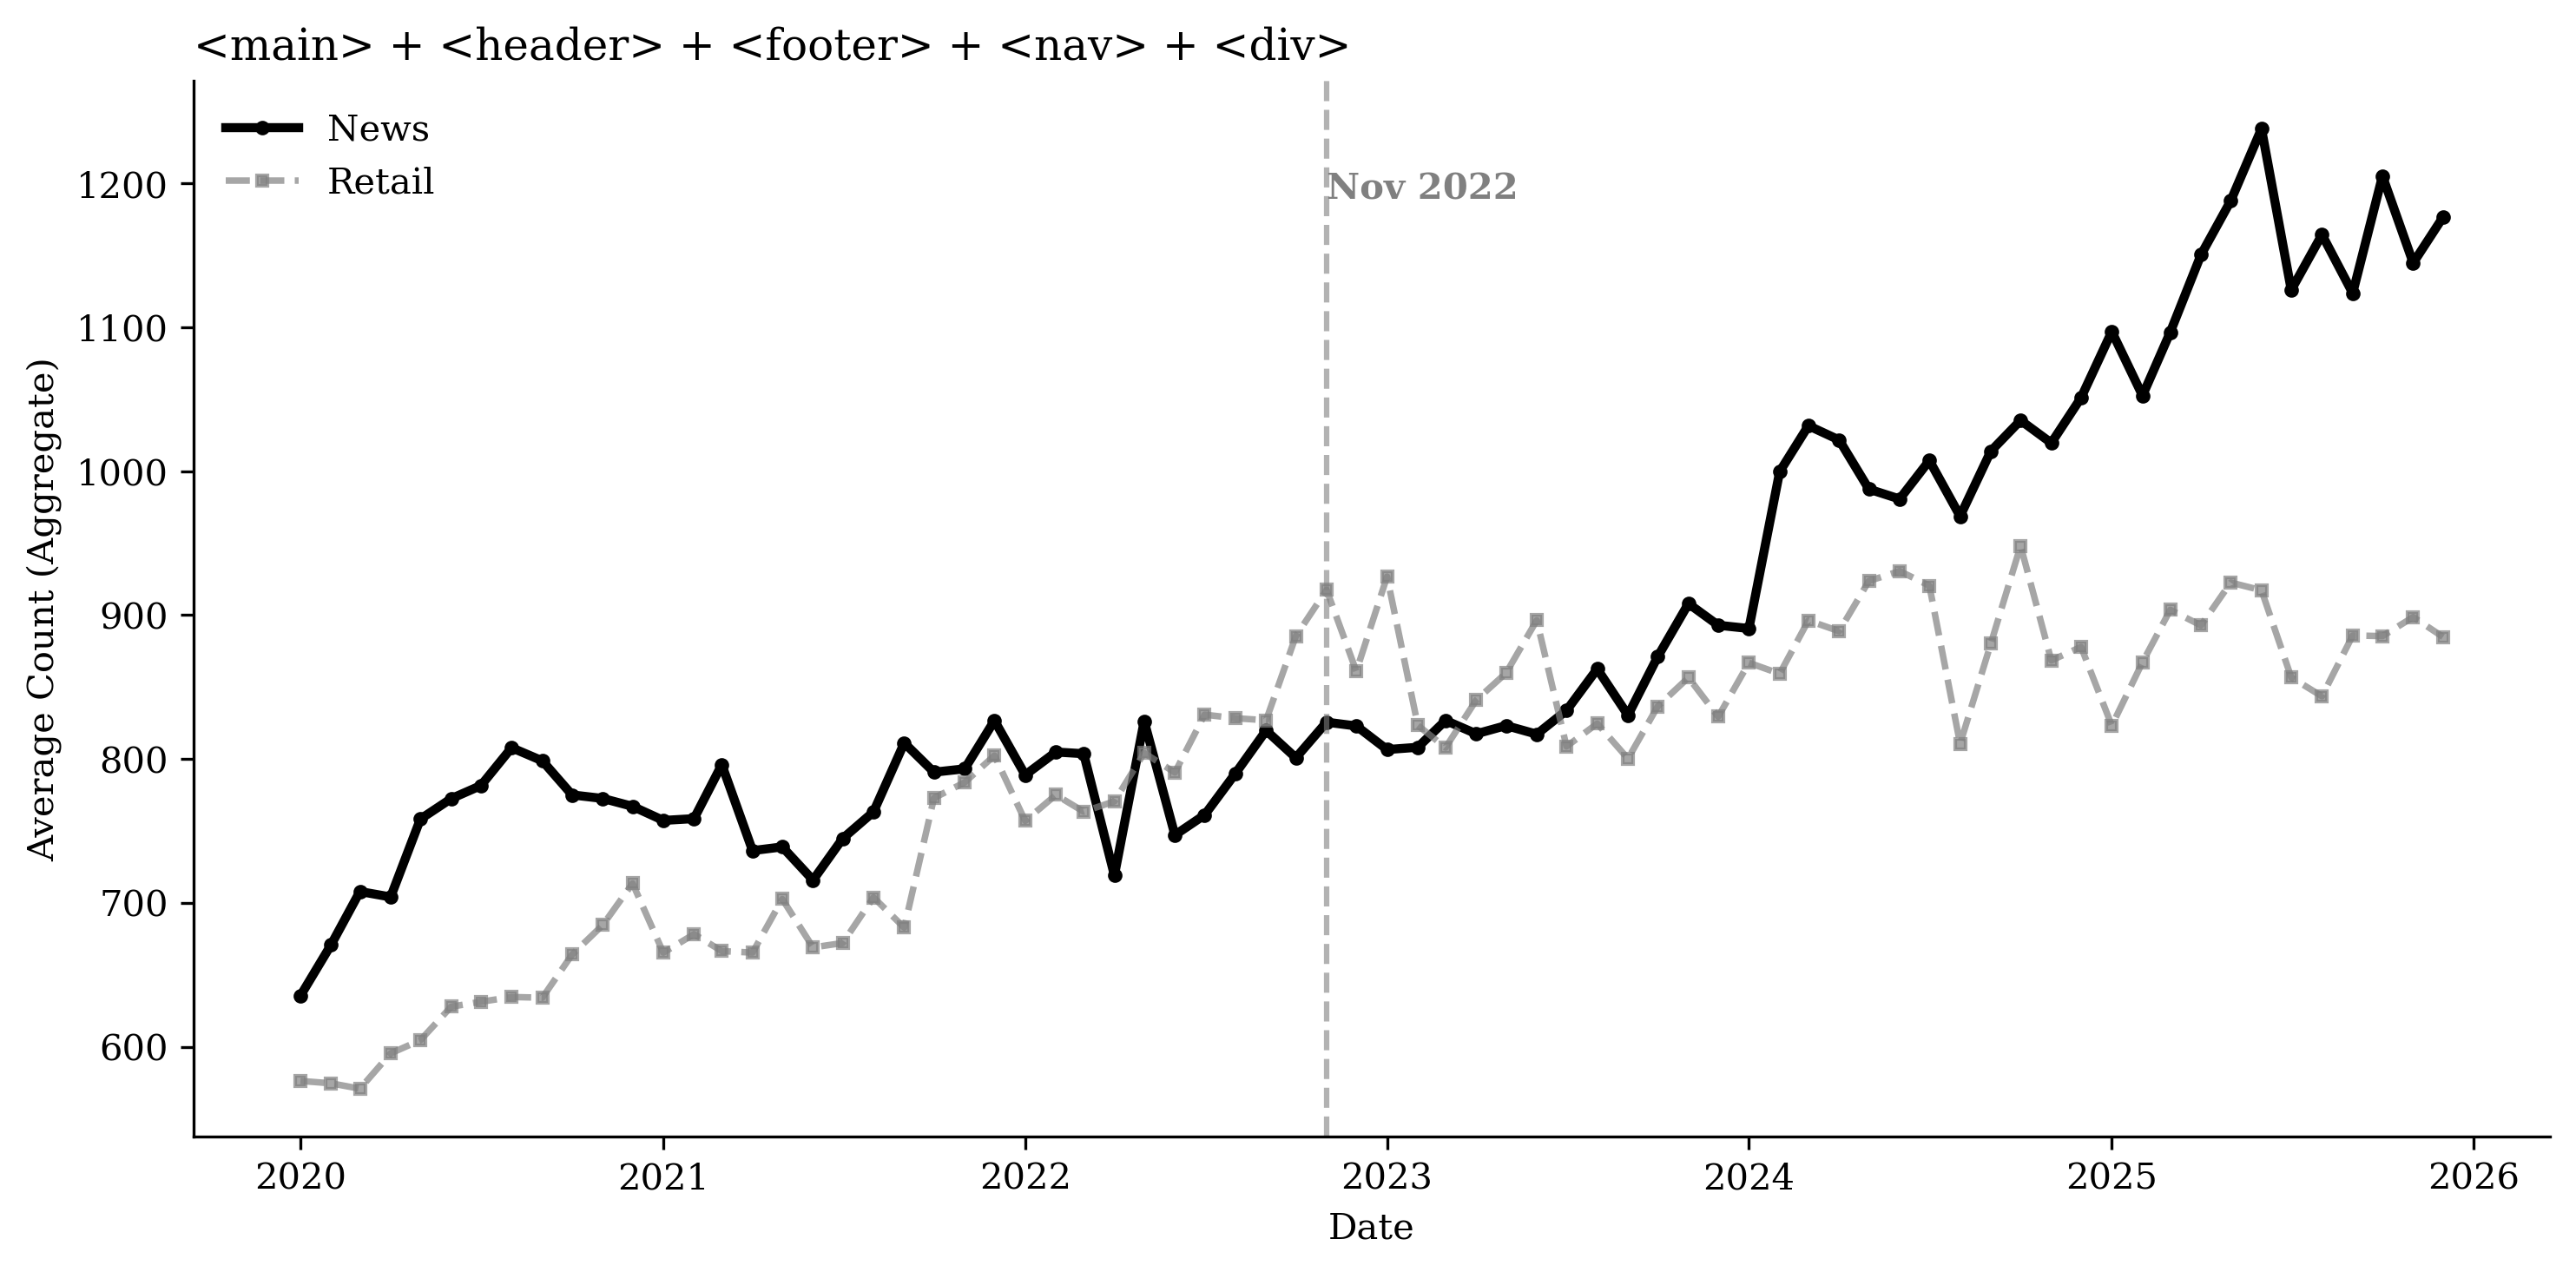
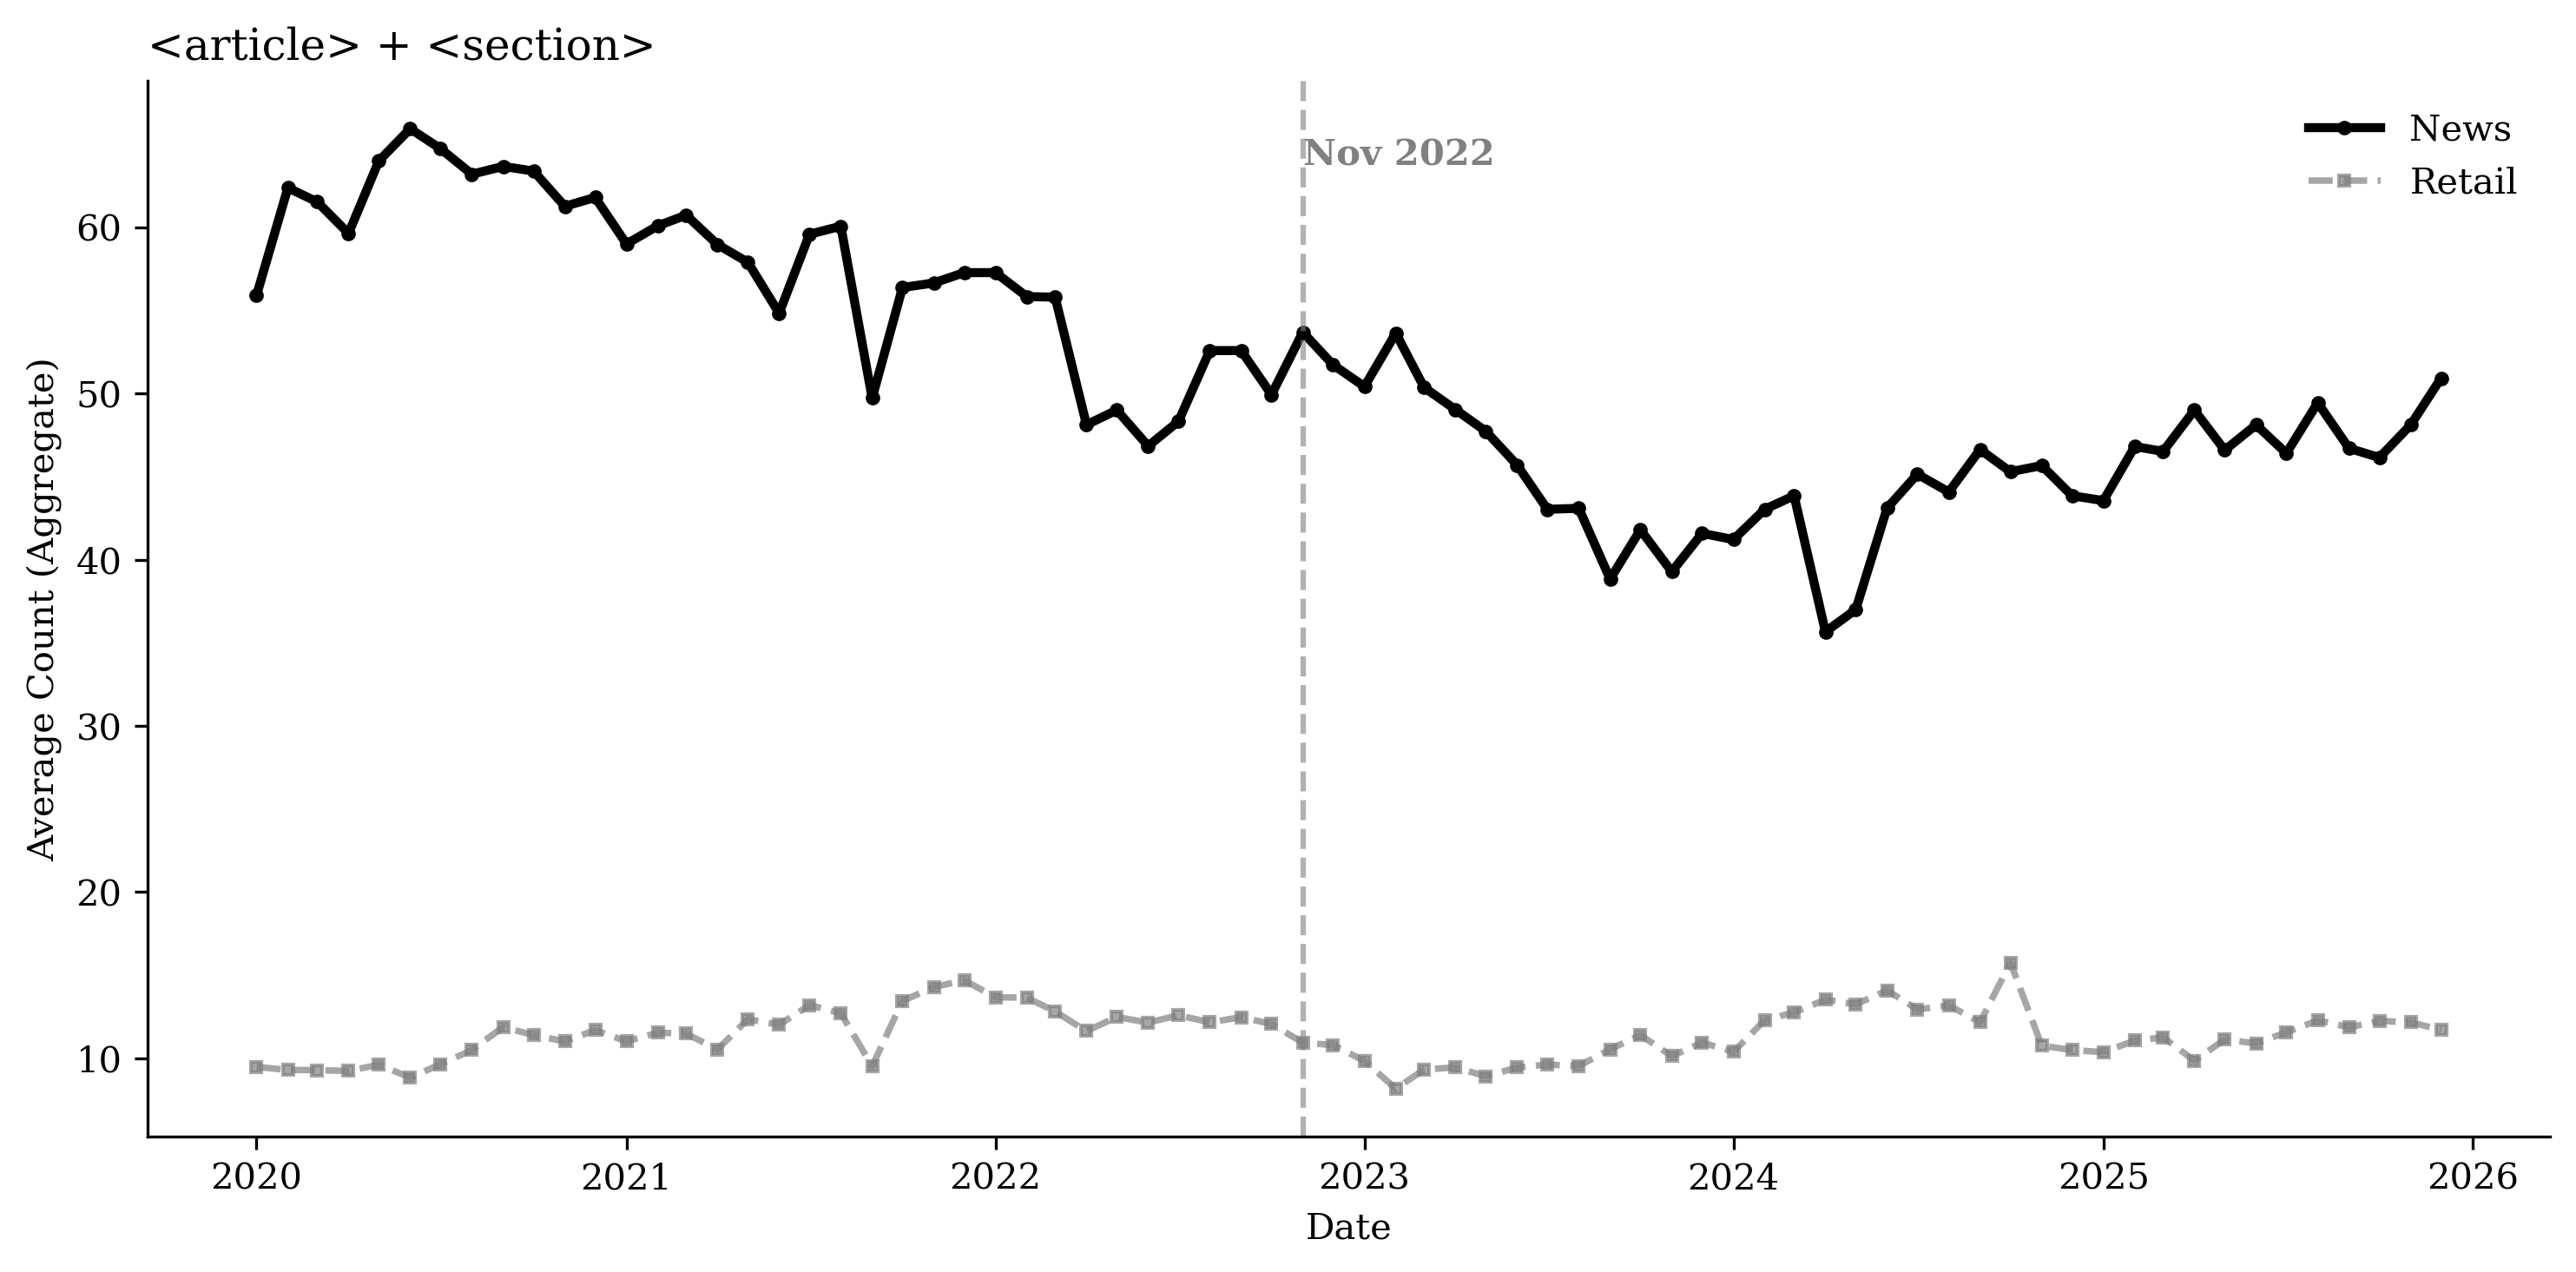
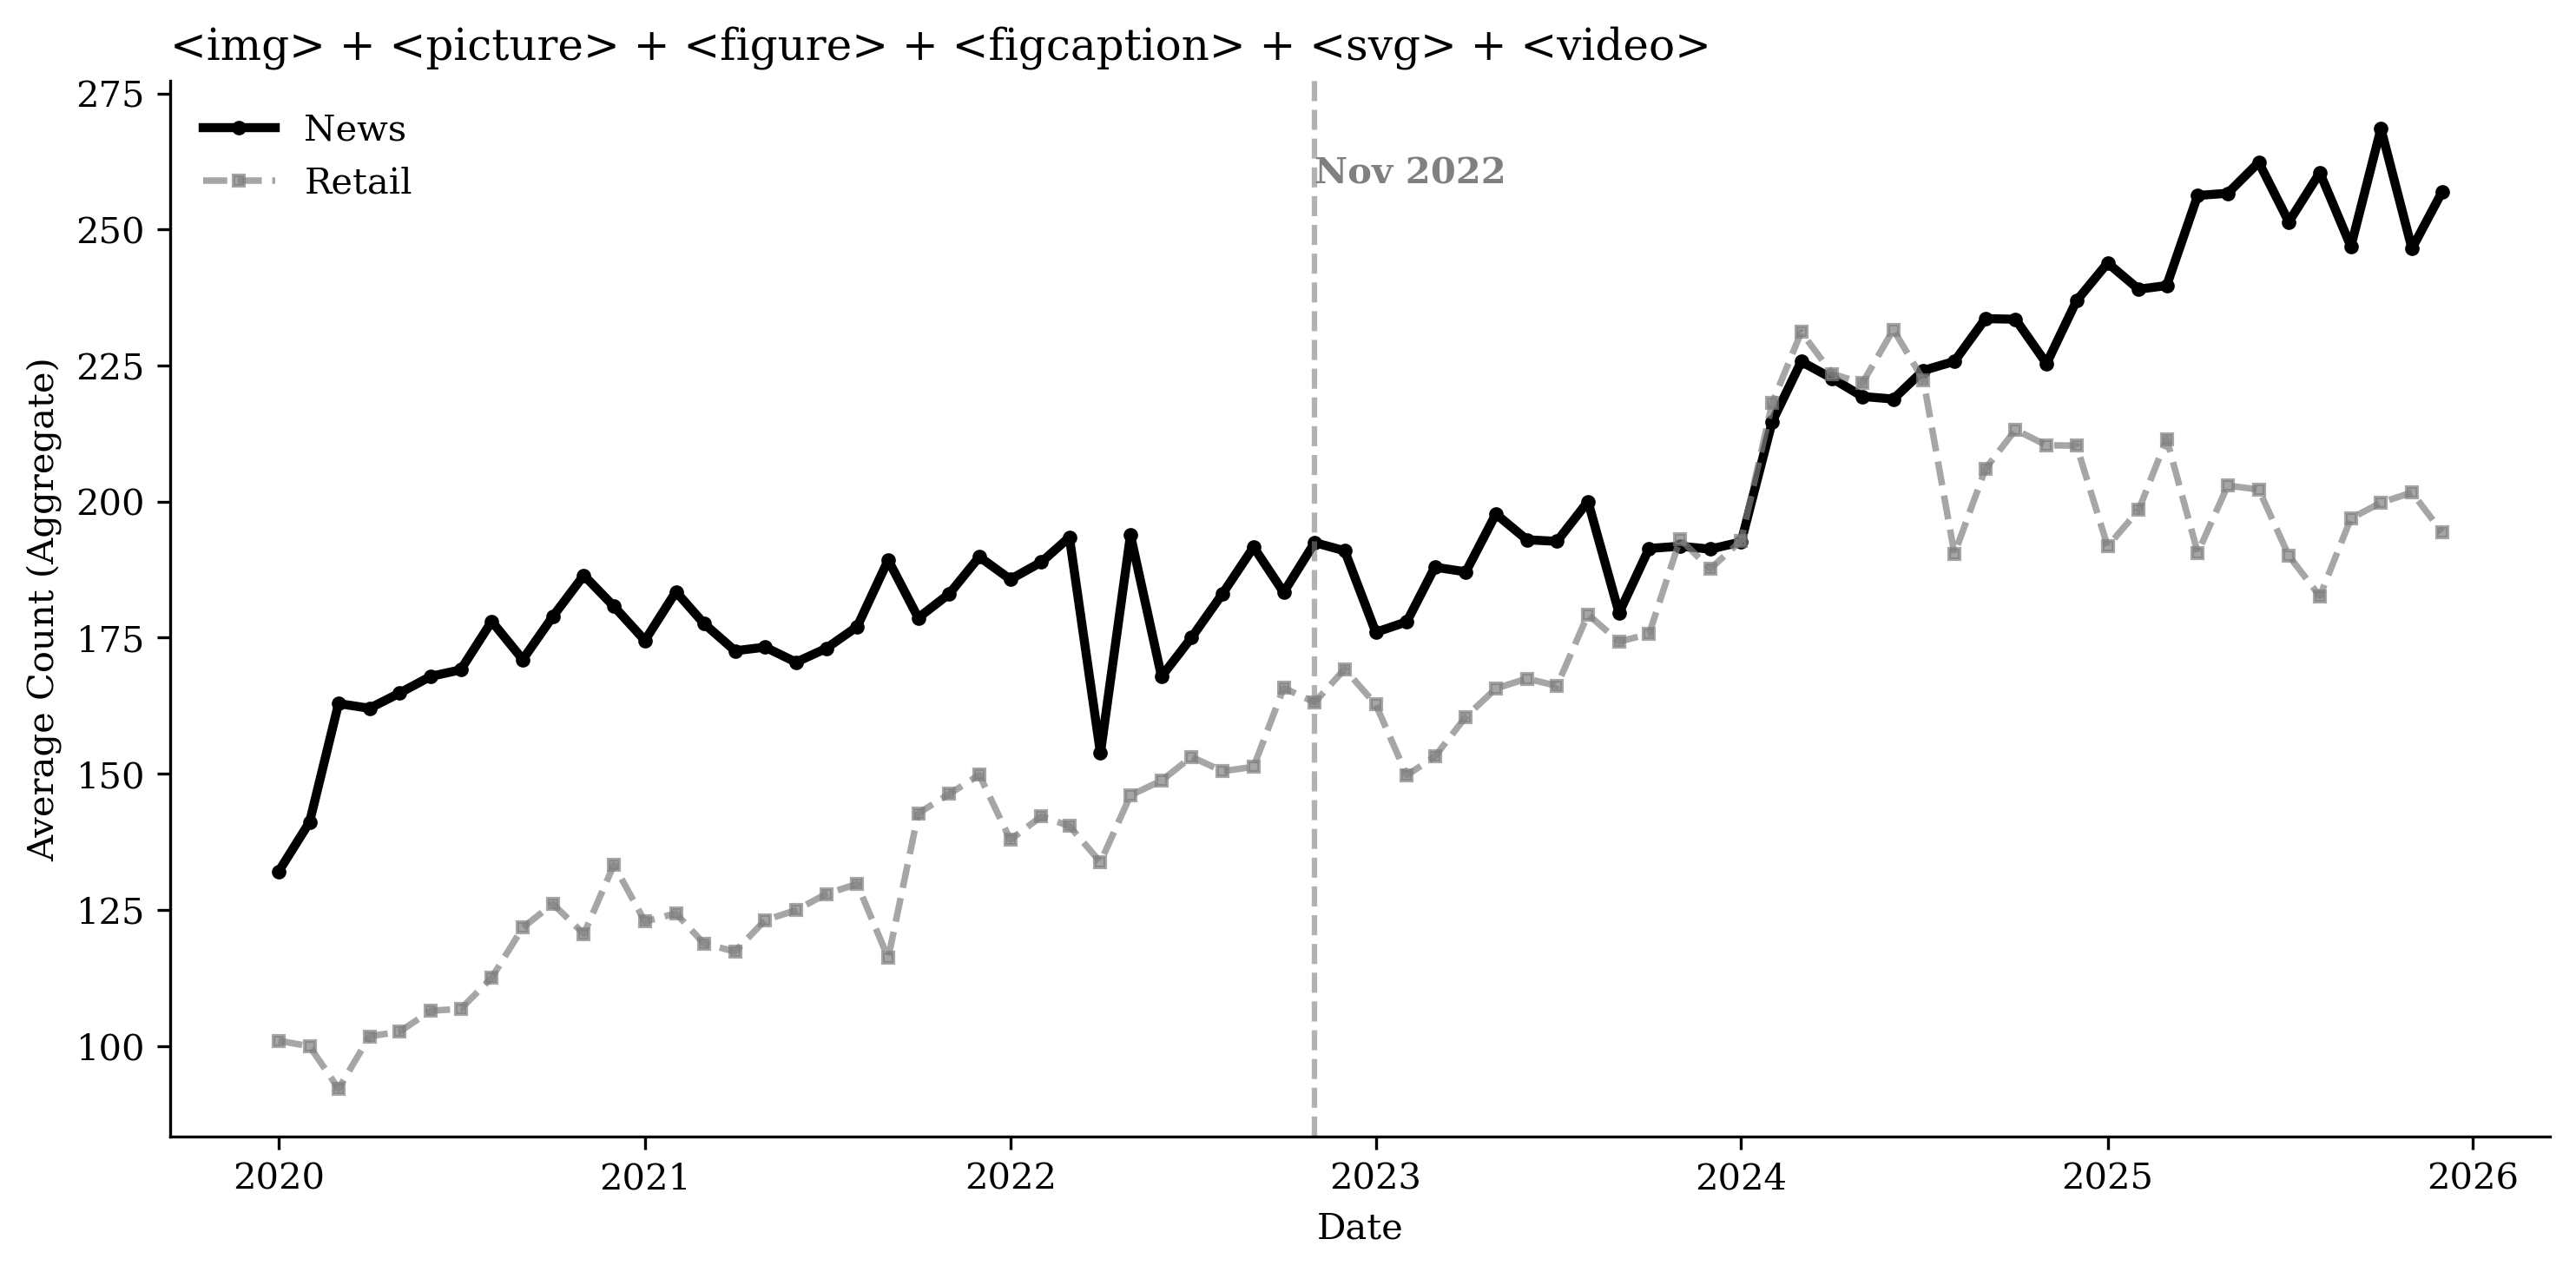
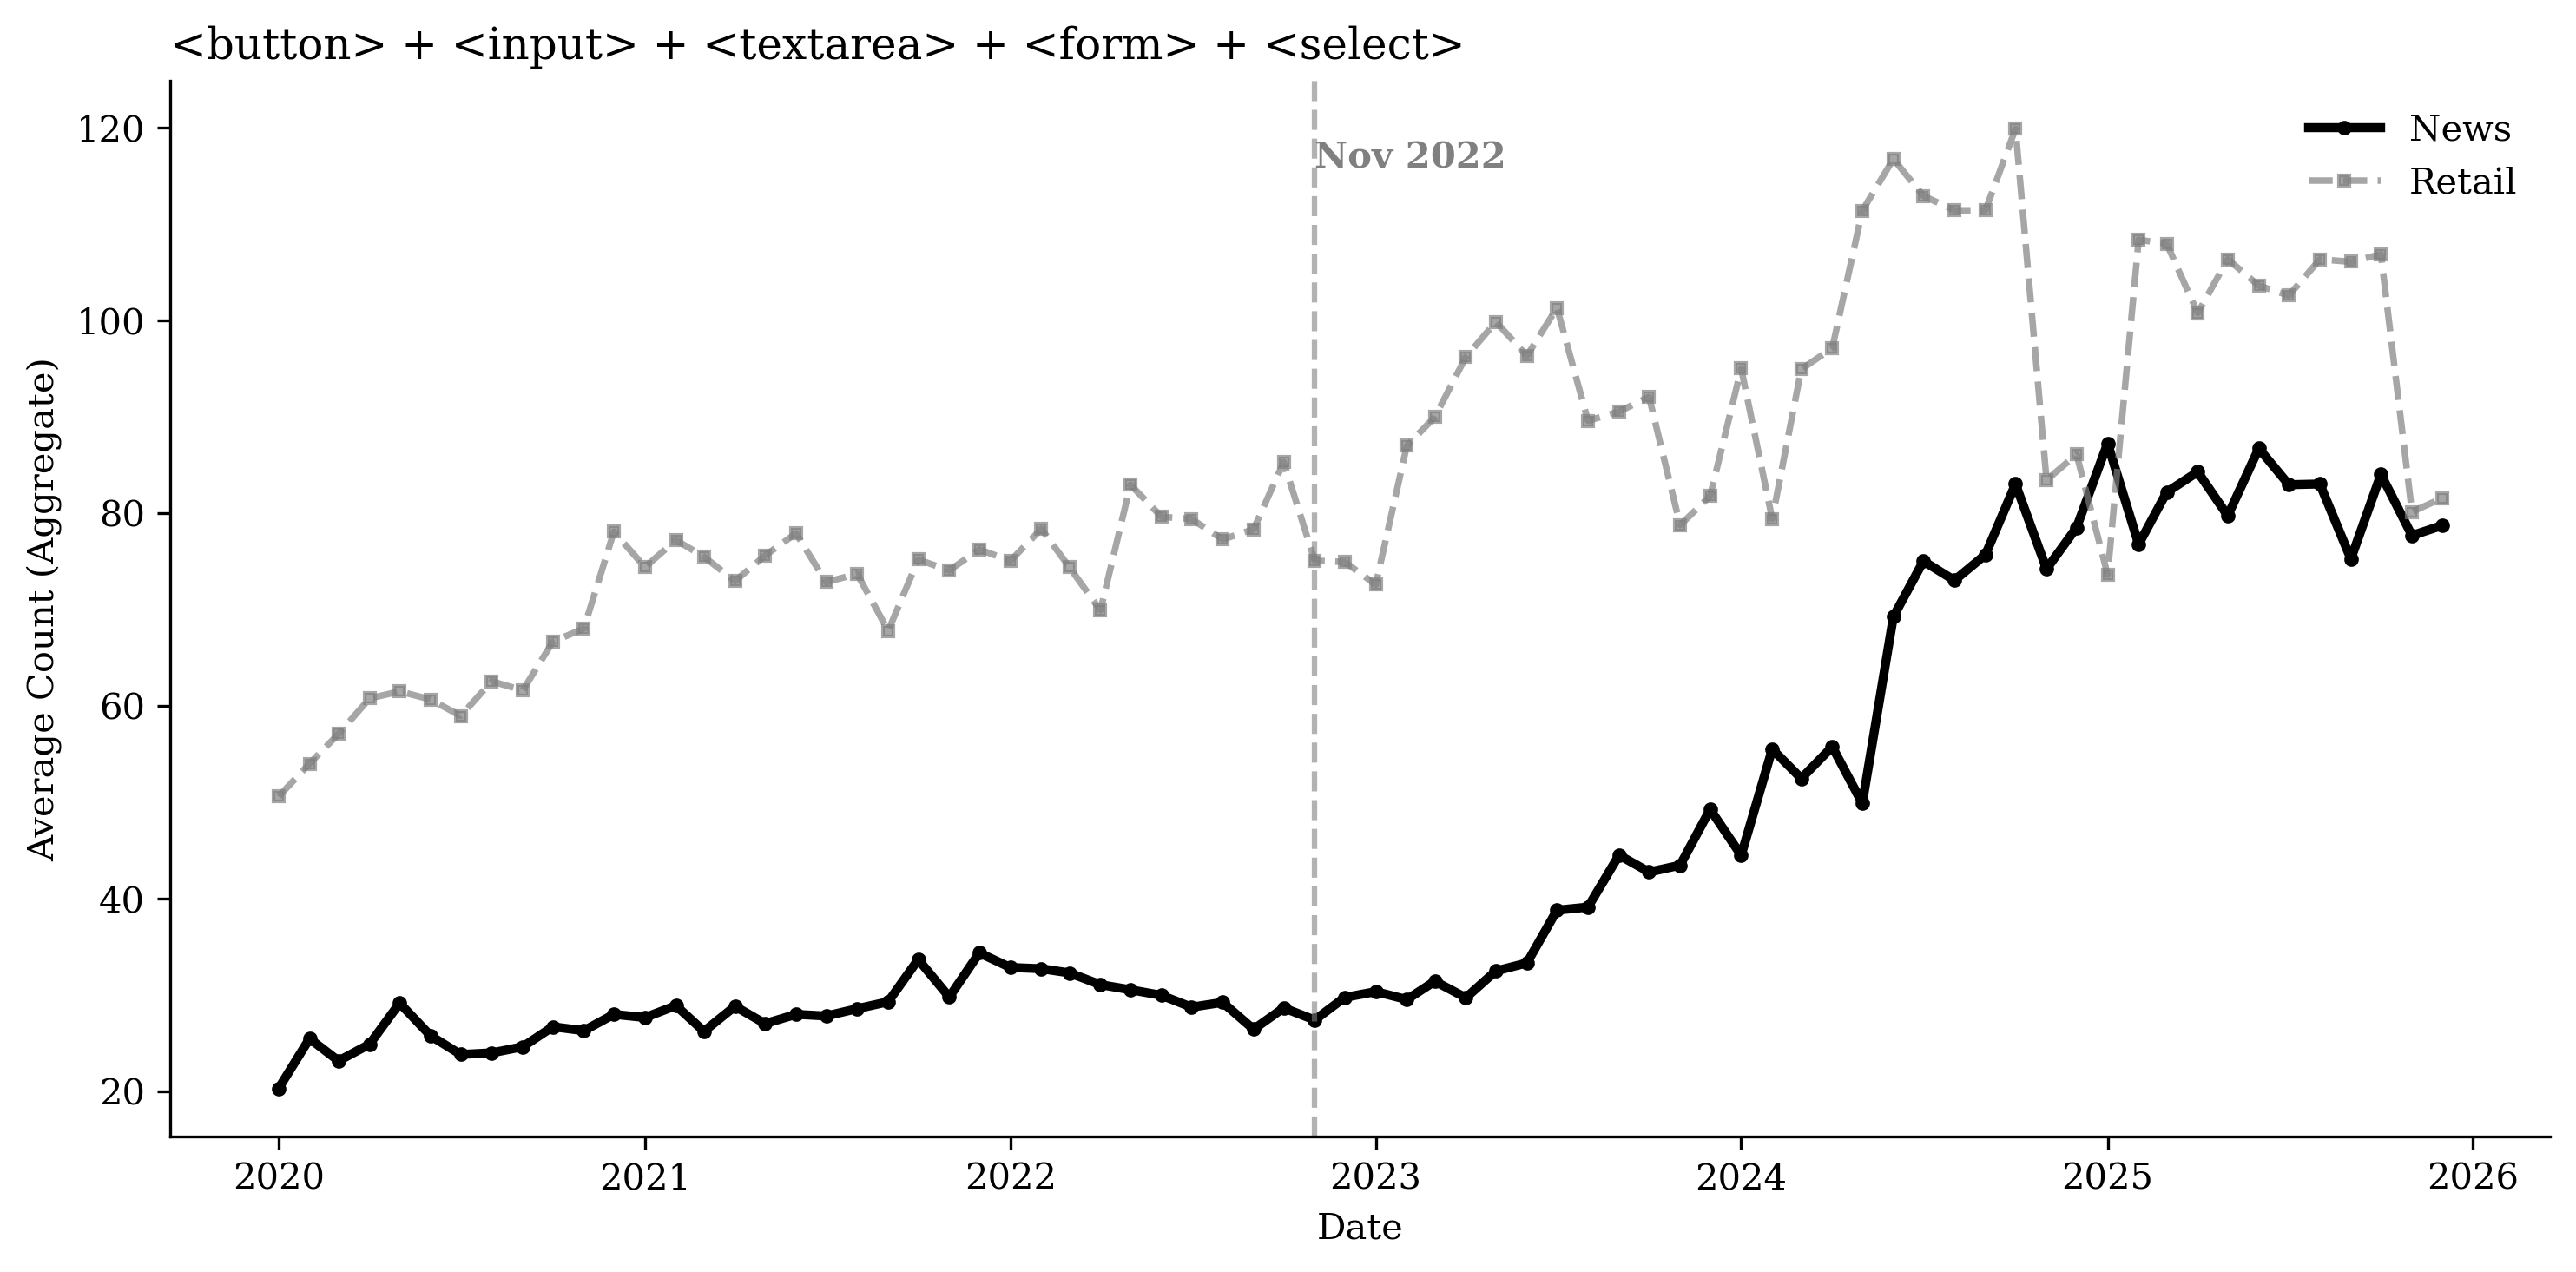
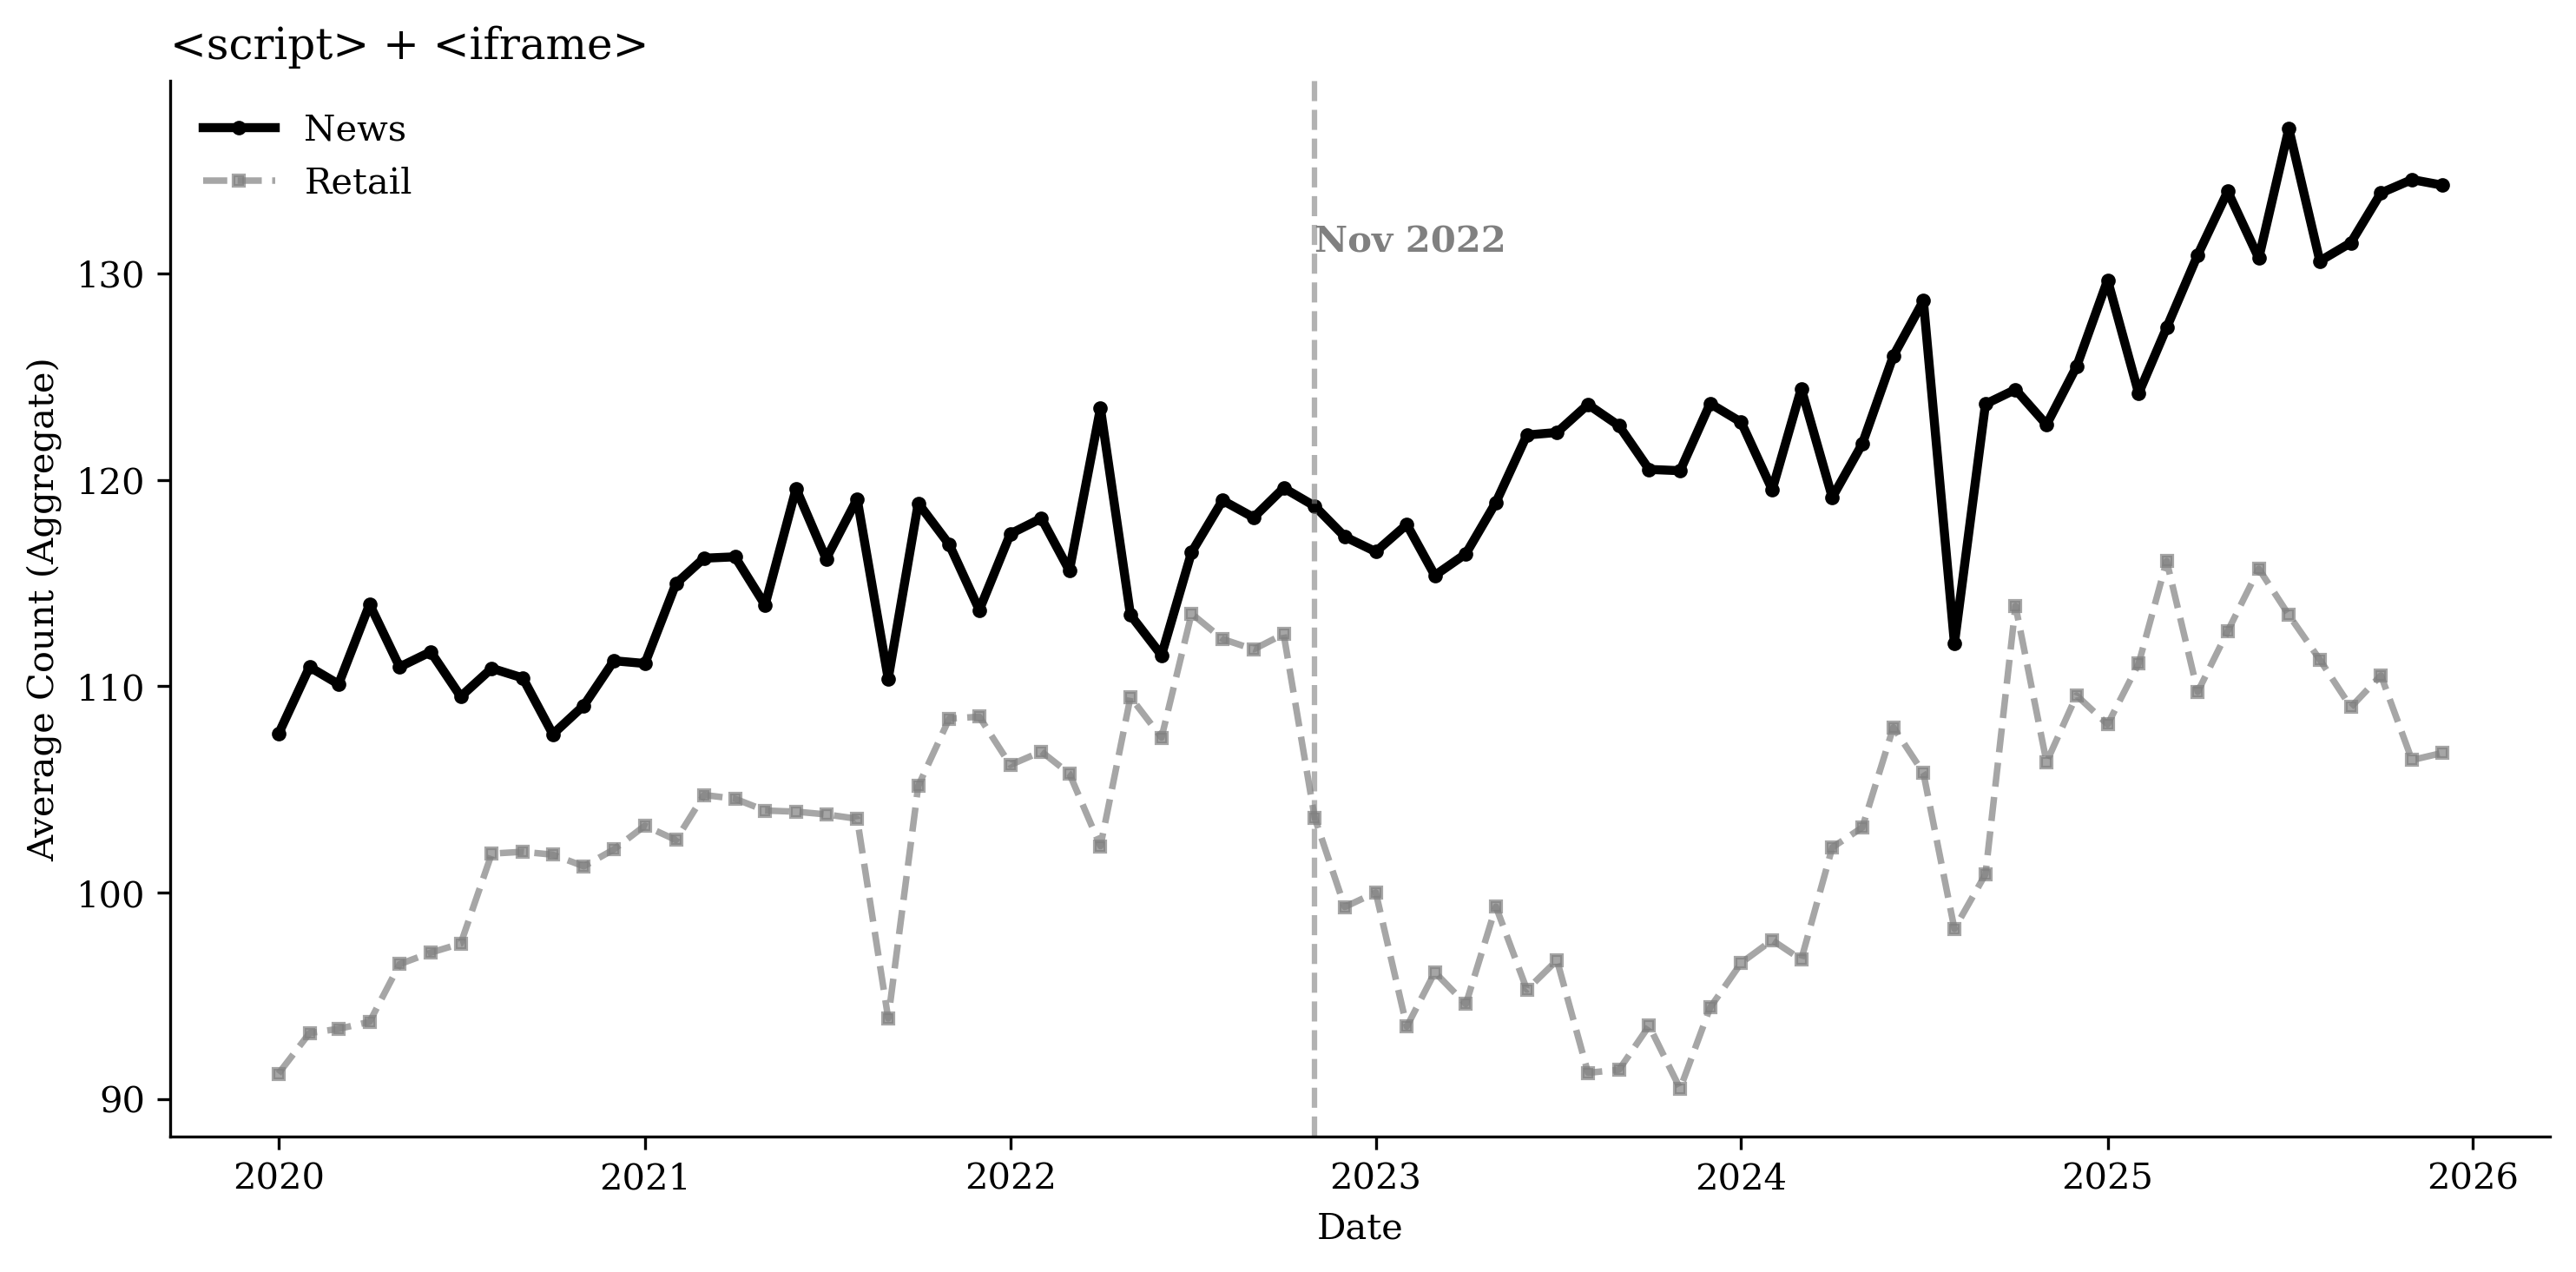
While overall page “weight” increased, as shown by the rise in average
DOM elements (Figure
14, with a lagged increase
relative to retailers) and general layout containers (Figure
15), the growth is not driven by
expanded content volume. In fact, article volume declines, reflected in
a reduction in the core <article> and <section> tags (Figure
16). News sites are becoming
more multimedia-heavy: visual assets increase at a similar rate to the
retail sector (Figure
17), while interactive
engagement mechanisms, such as buttons and forms, increase at a
significantly faster rate than the retail control group (Figure
18). Additionally,
growth in advertising and targeting technologies (Figure
19) indicates greater
reliance on third-party scripts and embedded <iframe> modules, likely
as publishers expand advertising and targeting to recoup revenue in a
shifting traffic landscape.
Table [tab:content_structure] presents two-way fixed effects regression results for the different content and structure measures, controlling for URL and month fixed effects, consistent with the patterns in Figure 20. Relative to the top retail websites, publishers’ advertising and targeting technologies increase by about 50% in the post–November 2022 period. Interactive elements increase by 68.1%, and site framework and layout increase by about 70.2%, while article volume decreases by 31.2%. We do not find evidence that newspapers’ overall DOM elements or multimedia elements increase faster than those of retailers.
This table reports estimates from TWFE regressions with publisher and month fixed effects. The treatment indicator equals one in the post–November 2022 period. P-values are reported in parentheses, and Benjamini–Hochberg adjusted p-values are reported to account for multiple hypothesis testing. Robust standard errors are clustered at the publisher level. *$`p<`$0.1; **$`p<`$0.05; ***$`p<`$0.01 based on Benjamini–Hochberg adjusted $`p`$-values.
Using the Internet Archive’s Wayback Machine, we collect annual counts of newly observed URLs by content type. Figure [fig:content_evolution_comparison] plots the number of unique URLs of different types, which is consistent with findings from the HTTP Archive’s element counts. We do not find the number of new text/article URLs to be increasing over the years; rather, there is a moderate decrease, suggesting that publishers are not responding by producing more articles. Instead, growth is concentrated in non-text assets: the number of unique image URLs increases substantially. Together, these patterns imply that publishers’ primary adjustment margin is to enrich existing content with additional media and embedded components rather than scaling up text output.
Discussion and Conclusion
We study how generative AI is reshaping the newspaper publishing industry by linking high-frequency measures of audience demand, access control, organizational hiring, and content format. Across multiple data sources, we document four effects. First, total visits to publishers are broadly stable until mid-2024, with a noticeable and persistent decline emerging only after August 2024. Second, publishers adopt GenAI crawler blocking in a staggered pattern starting in mid-2023, and staggered DiD estimates suggest that blocking is followed by a persistent decline in total traffic; importantly, the decline also appears in Comscore-based human browsing, indicating economically meaningful audience effects rather than a purely mechanical removal of bot activity for large publishers. Third, publisher hiring does not exhibit a disproportionate contraction in core editorial/content roles relative to other roles, suggesting limited near-term labor substitution away from newsroom production. Fourth, publishers do not scale text output; instead, they shift toward richer pages with more interactive components and greater use of advertising and targeting technologies, with growth concentrated in image-related URLs and interactive elements. Together, these facts suggest that generative AI is not yet functioning as a complete substitute for traditional news production and monetization; rather, publishers appear to be adjusting along multiple domains: access control, hiring composition, and content format and quantity production.
These findings provide early, publisher-focused benchmarks for how an LLM-mediated discovery layer translates into realized changes in demand and strategic response, and highlight a concrete managerial tradeoff: technical access control is a salient lever, but it is associated with unintended negative consequences.
Several limitations qualify interpretation. Our traffic measures combine modeled aggregates (SimilarWeb) with a U.S. desktop panel (Comscore), and neither directly observes LLM-mediated consumption paths (e.g., in-chat answers, referrals, or citation links). Robots.txt measures stated restrictions rather than enforceable access control, and blocking decisions may coincide with other time-varying publisher actions (paywall changes, SEO strategy, site redesigns, or platform shocks). Finally, the study covers an early phase of the technology, before newer interfaces and integration (e.g., more prominent AI summaries and search-chat products) may fully diffuse.
Future work can sharpen mechanisms by incorporating direct measures of LLM discovery and referral, richer firm-level data on AI access/licensing negotiations and enforcement. More broadly, continued monitoring will help determine whether the patterns documented here intensify, attenuate, or shift toward new adjustments as AI capabilities and adoption change.
[appsection]
[webappsection]
Appendix
This table summarizes the number of unique URLs and their proportions in each NAICS sector. A single URL may be associated with multiple NAICS codes.
| URL | Traffic ($`10^9`$) | URL | Traffic ($`10^9`$) |
|---|---|---|---|
| cnn.com | 6.81 | nbcnews.com | 1.29 |
| nytimes.com | 6.49 | businessinsider.com | 1.23 |
| espn.com | 5.66 | screenrant.com | 1.18 |
| bbc.com | 5.55 | buzzfeed.com | 1.07 |
| theguardian.com | 3.89 | reuters.com | 1.07 |
| foxnews.com | 3.71 | npr.org | 1.00 |
| dailymail.co.uk | 3.65 | wsj.com | 0.98 |
| usatoday.com | 2.26 | si.com | 0.95 |
| people.com | 2.22 | cbssports.com | 0.80 |
| forbes.com | 2.01 | tmz.com | 0.67 |
| nypost.com | 1.97 | marketwatch.com | 0.61 |
| ign.com | 1.51 | the-sun.com | 0.58 |
| washingtonpost.com | 1.43 | 247sports.com | 0.45 |
| cnbc.com | 1.39 | newsnow.co.uk | 0.38 |
| apnews.com | 1.33 | insider.com | 0.02 |
Website Traffic in 2024 SimilarWeb Data
This table presents the total website traffic for 2024 from SimilarWeb data.
Each column reports an AR(1) regression estimated around the indicated cutoff date. The post indicator equals 1 for observations in the post-break segment (from the cutoff date up to the next detected change point) *p$`<`$0.1; **p$`<`$0.05; ***p$`<`$0.01.
| Dependent variable: log traffic residuals | ||||
|---|---|---|---|---|
| 2-5 Placebo dates | 2023-07-01 | 2024-03-08 | 2024-11-19 | 2024-12-30 |
| Lagged residuals ρ0 | 0.700*** | 0.815*** | 0.660*** | 0.672*** |
| (0.052) | (0.058) | (0.046) | (0.046) | |
| (lag × post) ρ1 | 0.112 | -0.160** | 0.042 | 0.100 |
| (0.068) | (0.075) | (0.092) | (0.080) | |
| Post indicator ρ2 | 0.002 | 0.005 | -0.011 | -0.011 |
| (0.004) | (0.005) | (0.008) | (0.008) | |
| Constant | -0.001 | -0.002 | 0.005 | 0.006 |
| (0.003) | (0.003) | (0.005) | (0.005) | |
| Observations | 365 | 366 | 359 | 359 |
| Adjusted R2 | 0.587 | 0.525 | 0.457 | 0.511 |
| F Statistic | 173.602*** | 135.613*** | 101.537*** | 125.495*** |
| p<0.1; **p<0.05; ***p<0.01 | ||||
Each column reports the AR(1) regression estimates within a six-month window before and after four random placebo cutoff dates. The post indicator equals 1 for observations in the post-break segment (from the cutoff date up to the next detected change point). *p$`<`$0.1; **p$`<`$0.05; ***p$`<`$0.01.
This table reports the average treatment effect on the treated (ATT) for website traffic following August 2024. The dependent variable is the logarithm of daily website traffic (log (Traffic)). The control group consists of the top 100 retail websites ranked by daily traffic. The left panel plots the Synthetic Difference-in-Differences (SDID) estimator, while the right panel shows the standard TWFE DiD estimator. Standard errors are calculated using 50 bootstrap repetitions for SDID and robust standard errors clustered at the publisher level for TWFE DiD.
This table reports the average treatment effect on the treated (ATT) for website traffic following November 2023. The dependent variable is the logarithm of daily website traffic (log (Traffic)). The control group consists of the top 100 retail websites ranked by daily traffic. The left panel plots the Synthetic Difference-in-Differences (SDID) estimator, while the right panel shows the standard TWFE DiD estimator. Standard errors are calculated using 50 bootstrap repetitions for SDID and robust standard errors clustered at the publisher level for TWFE DiD.
This table reports the average treatment effect on the treated (ATT) for website traffic following the April 2023 treatment. The dependent variable is the logarithm of daily website traffic (log (Traffic)). The control group consists of the top 100 retail websites ranked by daily traffic. The left panel plots the Synthetic Difference-in-Differences (SDID) estimator, while the right panel shows the standard TWFE DiD estimator. Standard errors are calculated using 50 bootstrap repetitions for SDID and robust standard errors clustered at the publisher level for TWFE DiD.
| Log(SimilarWeb traffic) | Log(Comscore traffic) | |||
| SDID | TWFE DiD | SDID | TWFE DiD | |
| ATT | -0.179 | -0.179 | -0.199 | -0.199 |
| [-0.273,-0.085] | [-0.279,-0.079] | [-0.258,-0.139] | [-0.252,-0.145] | |
This table reports Synthetic and TWFE DiD ATT estimates of the effect of blocking GenAI web crawlers on publisher traffic. The dependent variables in columns (1)–(2) and (3)–(4) are the logarithm of monthly visits from SimilarWeb and Comscore, respectively. Confidence intervals are based on 50 bootstrap repetitions. *p$`<`$0.1; **p$`<`$0.05; ***p$`<`$0.01.
![]()
![]()
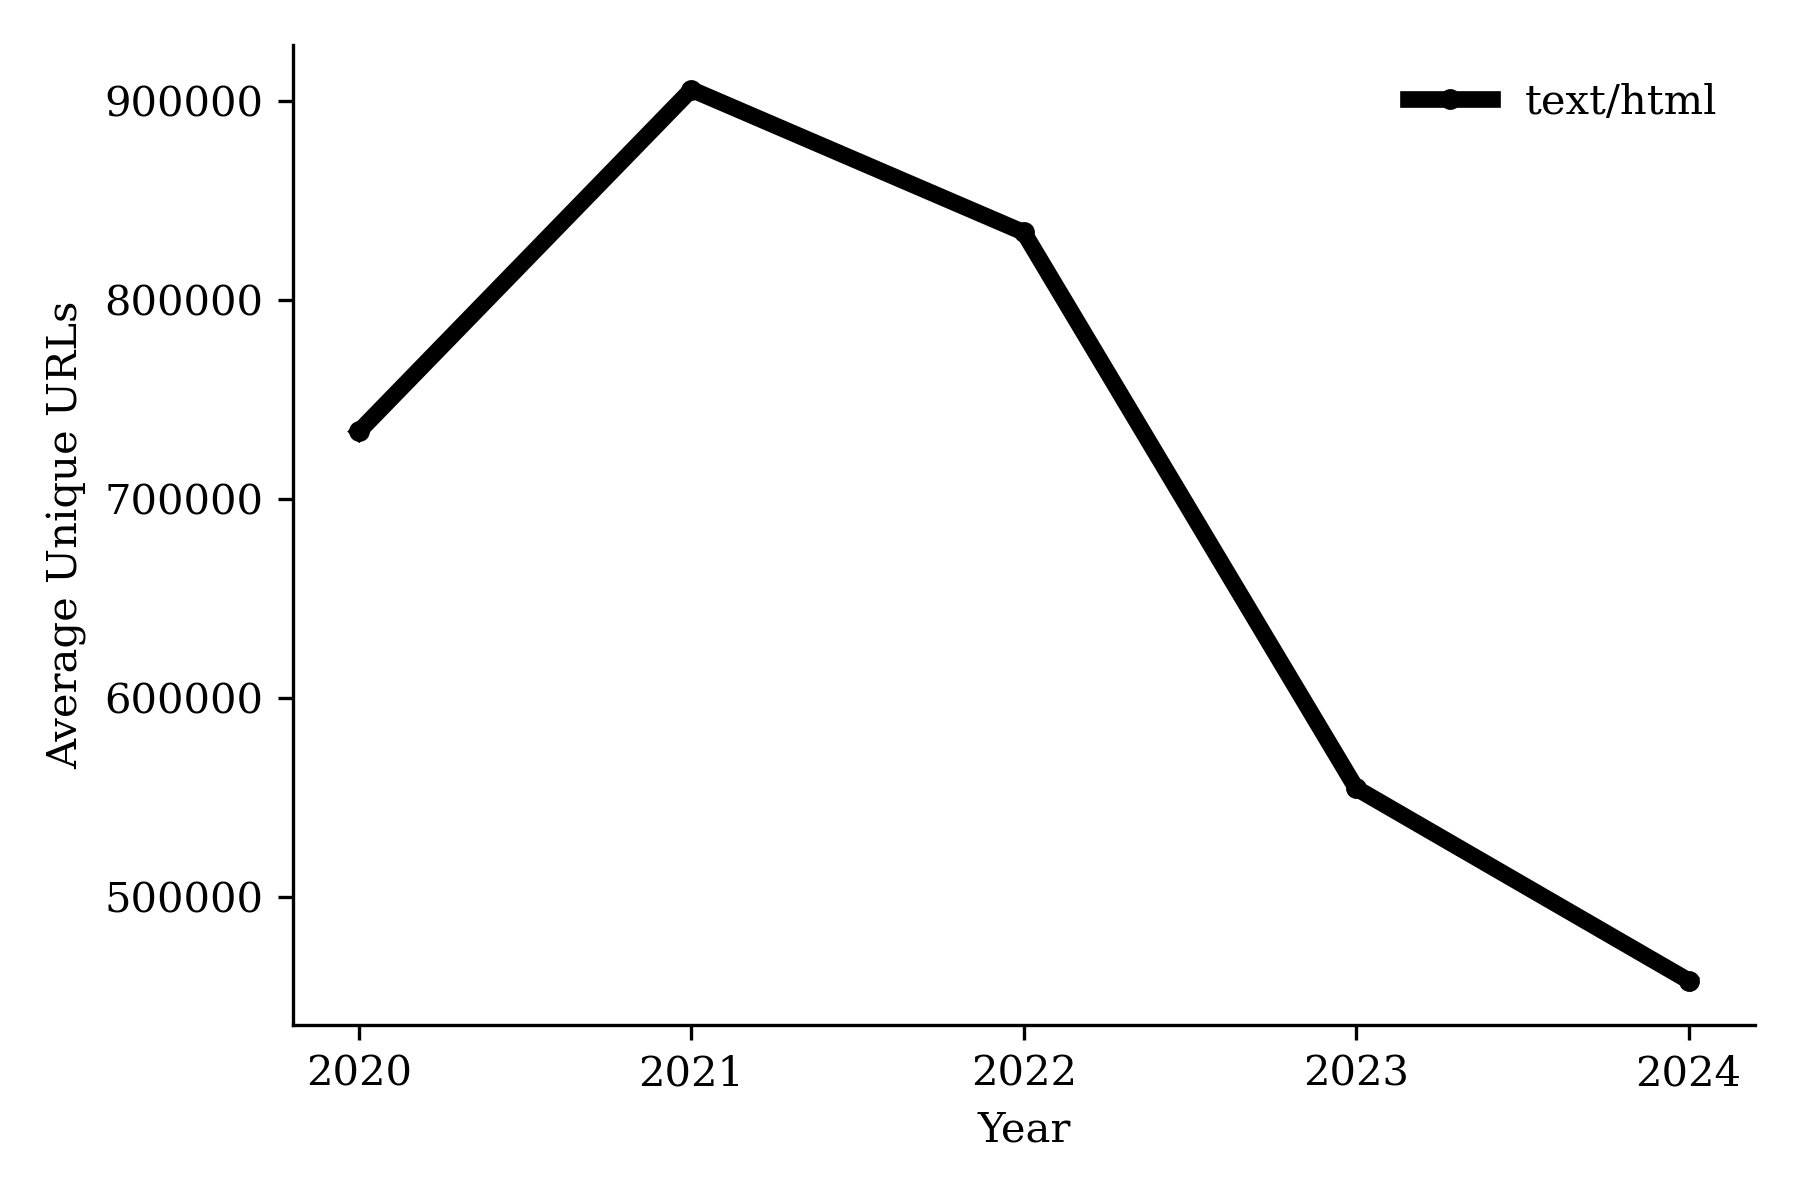
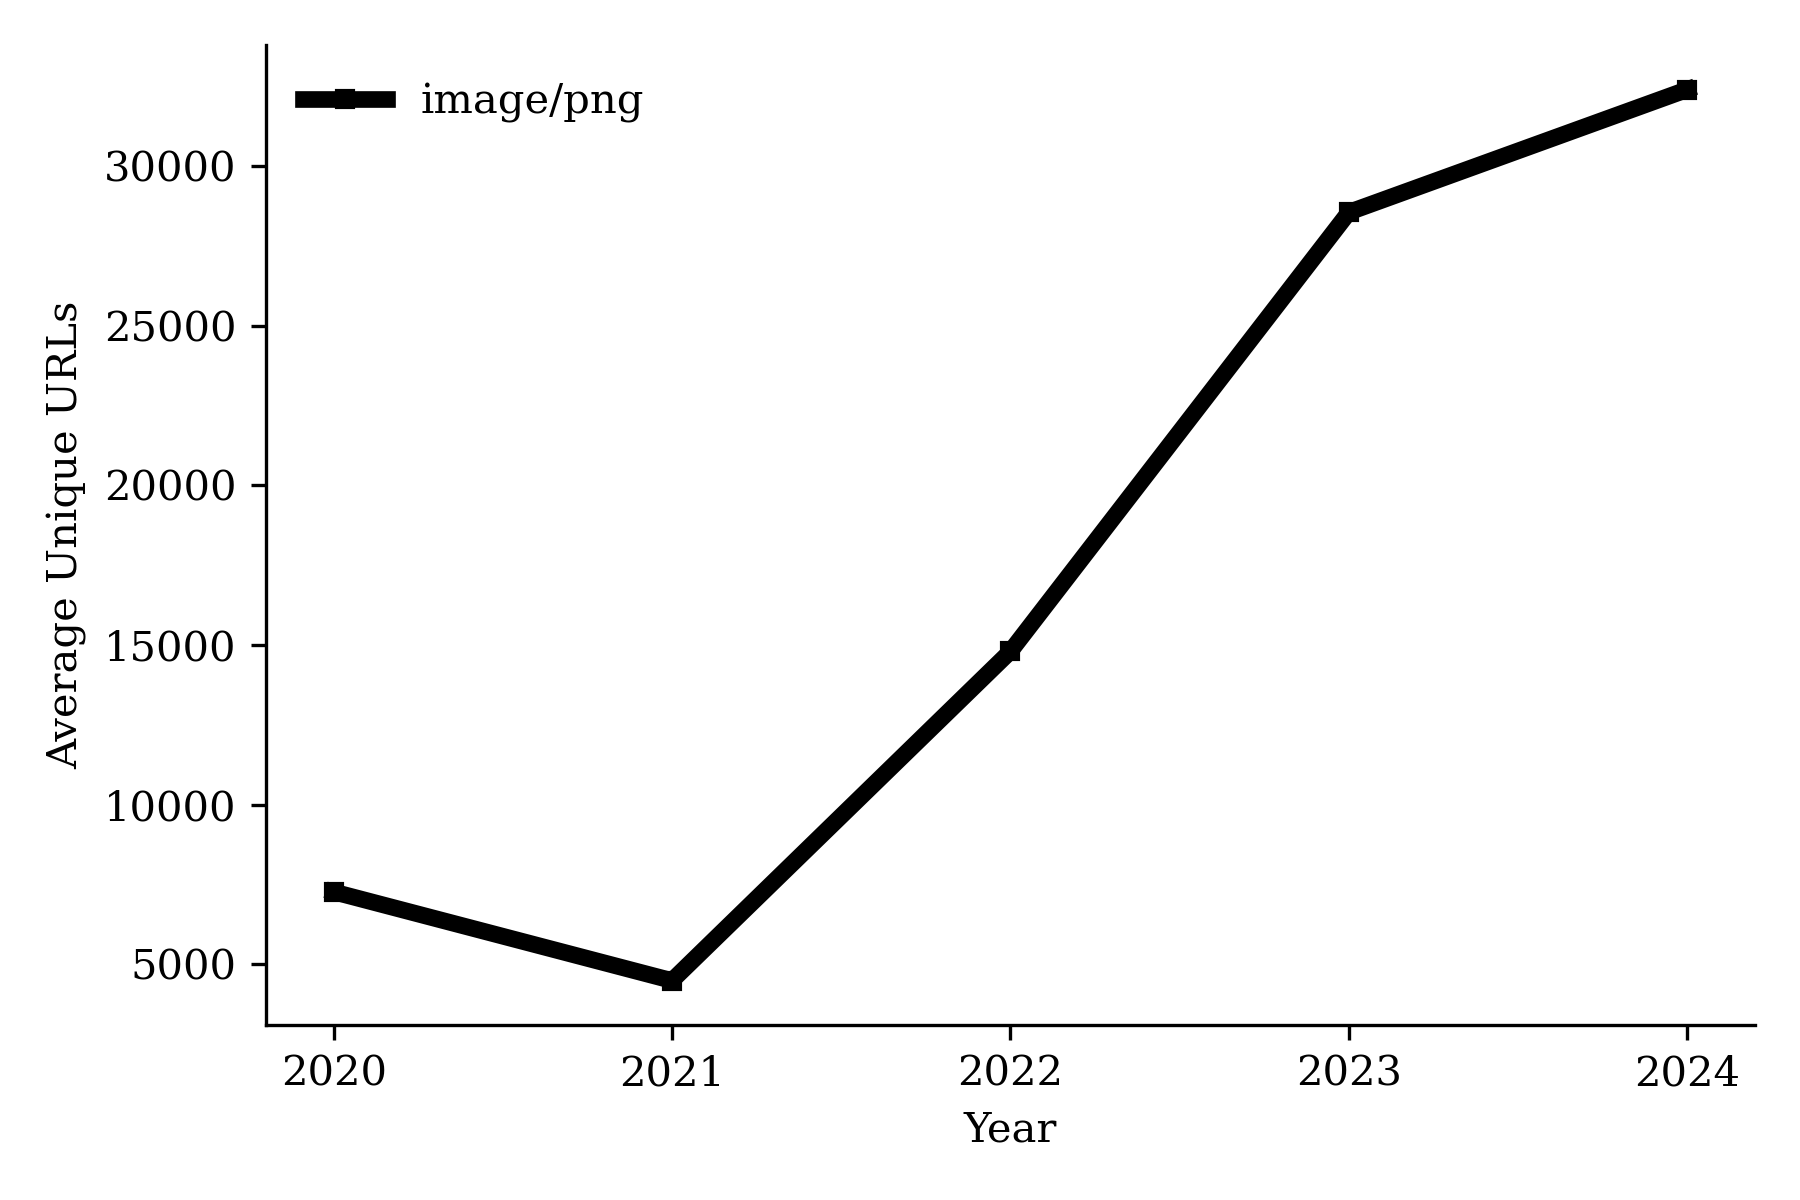
Subfigure (a) displays trends in unique URLs for text-based content, while subfigure (b) displays trends in image-based content from the Internet Archive’s Wayback Machine.
📊 논문 시각자료 (Figures)
![]()
![]()
A Note of Gratitude
The copyright of this content belongs to the respective researchers. We deeply appreciate their hard work and contribution to the advancement of human civilization.-
The Economist, “AI is killing the web. Can anything save it?” https://www.economist.com/business/2025/07/14/ai-is-killing-the-web-can-anything-save-it , accessed Dec 18, 2025. ↩︎
-
Pew Research Center 2025, “Google users are less likely to click on links when an AI summary appears in the results,” https://www.pewresearch.org/short-reads/2025/07/22/google-users-are-less-likely-to-click-on-links-when-an-ai-summary-appears-in-the-results/ , accessed Dec 18, 2025. ↩︎
-
RFC 9309 https://www.rfc-editor.org/rfc/rfc9309.html , accessed Dec 18, 2025. ↩︎
-
https://wrds-www.wharton.upenn.edu/pages/about/data-vendors/comscore/ ↩︎
-
“Digital content of low quality that is produced usually in quantity by means of artificial intelligence”, Merriam-Webster.com Dictionary. Retrieved December 21, 2025, from https://www.merriam-webster.com/dictionary/slop . ↩︎
-
RFC 9309 states: “These rules are not a form of access authorization.” https://www.rfc-editor.org/rfc/rfc9309.html , accessed Dec 18, 2025. ↩︎
-
https://app.deweydata.io/data/similarweb/Website-Traffic-Visits/website-traffic-visits ↩︎
-
https://wrds-www.wharton.upenn.edu/pages/about/data-vendors/revelio-labs/ ↩︎
-
A URL can have multiple NAICS codes. We count a URL in a sector if at least one of its NAICS codes belongs to that sector. Economic Census: NAICS Codes Understanding Industry Classification Systems, https://www.census.gov/programs-surveys/economic-census/year/2022/guidance/understanding-naics.html . ↩︎
-
Traffic to the 30 publishers accounts for 69% of total Comscore traffic among the top 500 publishers. ↩︎
-
We restrict the sample to 2023 for a balanced panel. So the SimilarWeb estimates differ slightly from those in Table 1, because the restricted sample includes only the first few months after blocking. ↩︎
-
The reason we do not implement a synthetic DiD is that the same company can appear in both the treatment and control groups for editorial and non-editorial jobs, which makes inference at the company level challenging. ↩︎