DarkEQA Benchmarking Vision-Language Models for Embodied Question Answering in Low-Light Indoor Environments
📝 Original Paper Info
- Title: DarkEQA Benchmarking Vision-Language Models for Embodied Question Answering in Low-Light Indoor Environments- ArXiv ID: 2512.24985
- Date: 2025-12-31
- Authors: Yohan Park, Hyunwoo Ha, Wonjun Jo, Tae-Hyun Oh
📝 Abstract
Vision Language Models (VLMs) are increasingly adopted as central reasoning modules for embodied agents. Existing benchmarks evaluate their capabilities under ideal, well-lit conditions, yet robust 24/7 operation demands performance under a wide range of visual degradations, including low-light conditions at night or in dark environments--a core necessity that has been largely overlooked. To address this underexplored challenge, we present DarkEQA, an open-source benchmark for evaluating EQA-relevant perceptual primitives under multi-level low-light conditions. DarkEQA isolates the perception bottleneck by evaluating question answering from egocentric observations under controlled degradations, enabling attributable robustness analysis. A key design feature of DarkEQA is its physical fidelity: visual degradations are modeled in linear RAW space, simulating physics-based illumination drop and sensor noise followed by an ISP-inspired rendering pipeline. We demonstrate the utility of DarkEQA by evaluating a wide range of state-of-the-art VLMs and Low-Light Image Enhancement (LLIE) models. Our analysis systematically reveals VLMs' limitations when operating under these challenging visual conditions. Project website: https://darkeqa-benchmark.github.io/💡 Summary & Analysis
1. **Introduction of a New Benchmark**: The paper introduces DarkEQA, a new benchmark for evaluating the performance of vision-language models (VLMs) in low-light indoor conditions. This is crucial because existing benchmarks largely overlook real-world robustness under poor visibility. - **Metaphor**: Just as it’s difficult to find objects in a dark room, robots also struggle with information recognition in such environments. DarkEQA serves as a tool to evaluate this challenge.-
Data Generation Methodology: The paper presents methods for synthesizing low-light images to create datasets, addressing the challenges of collecting real-world low-light images.
- Metaphor: Instead of taking photos in an actual dark room, the computer creates these scenarios virtually.
-
Evaluation Results Analysis: It discusses evaluation results that show how VLMs perform under low-light conditions and highlights areas for improvement to enhance robustness in such environments.
- Metaphor: By measuring a robot’s ability to recognize objects and answer questions in a dark room, we can identify ways to improve its performance.
📄 Full Paper Content (ArXiv Source)
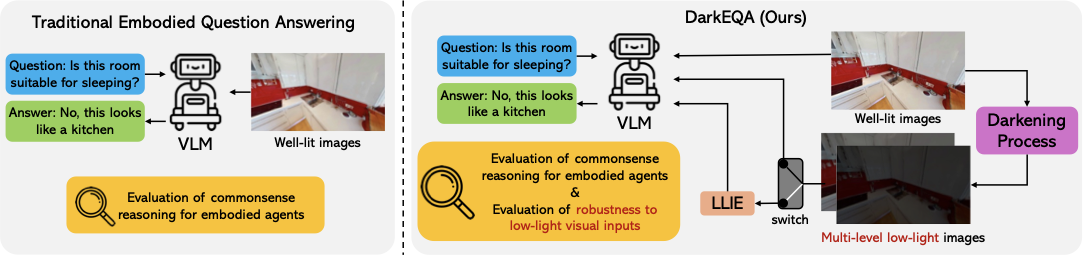
Advances in vision-language models (VLMs) have significantly enhanced robotic capabilities, improving semantic scene understanding , spatial reasoning , and vision-language-action (VLA) policies . Numerous Embodied Question Answering (EQA) benchmarks have been proposed to assess this commonsense reasoning for embodied agents, largely assuming well-lit, ideal visual conditions . However, household robots are often intended for 24/7 operation, which means they will frequently encounter low-light scenarios, such as nighttime, entering dark rooms or power blackouts. As robot deployment in varied environments grows, robust perception under these conditions is not an edge case but a core necessity . Accordingly, benchmarks that explicitly stress-test embodied VLM reasoning under low illumination are essential to quantify real-world robustness. Nevertheless, acquiring large-scale, real-world low-light images with clean, paired annotations—ideally with corresponding well-lit reference views—is challenging and costly, which has hindered the construction of such benchmarks. As a result, existing benchmarks have largely overlooked systematic evaluation of VLM-based reasoning and perception under degraded illumination, limiting their ability to predict real-world robustness.
To fill this evaluation void, we present DarkEQA, an open-source benchmark to systematically measure the perceptual primitives for embodied tasks under low-light conditions. The design of DarkEQA is primarily grounded in a physically based formulation, where all visual degradations are modeled at the RAW sensor data level (or in linear RGB space). This follows the physics of illumination and sensor noise to realistically simulate real-world Image Signal Processing (ISP) scenarios. Moreover, to ensure benchmark integrity and prevent potential data contamination , all Question Answering (QA) pairs are deterministically generated via rule-based procedure, rather than depending on commodity VLM services. QA generation results in a family of queries targeting perceptual primitives, including from simple object recognition (e.g., “Is there a cushion in the image?”) to affordance reasoning (e.g., “I want to sleep, is this room suitable for this?”).
DarkEQA provides 9.4k question–image pairs, a standardized evaluation protocol, and a public codebase to reproduce our low-light degradation pipeline. Our DarkEQA benchmarks a diverse set of vision–language models (VLMs), including both open- and closed-source systems . We also evaluate a state-of-the-art low-light image enhancement (LLIE) model as a preprocessing baseline. Our evaluation yields two observations. First, while humans can recognize structural scene information of input images from intensity contrast, all tested VLMs show a clear performance decline as the images degrade. Second, while LLIE preprocessing can improve performance under certain degradation levels, its effects are not consistently positive; in some cases, it yields limited gains or even leads to performance degradation, highlighting its practical limitations. Together, these results show that current VLM-based EQA pipelines remain brittle under low-light corruption, and that perceptual enhancement alone is insufficient as a general solution, motivating robustness-oriented evaluation and method development.
RELATED WORK
Embodied Question Answering Benchmark
Embodied Question Answering (EQA), first introduced by Das et al. , requires an agent to navigate and interact with an environment to answer a question. Early benchmarks primarily centered on static 3D scenes, such as ScanQA , to evaluate tasks like object identification and basic spatial relationships. OpenEQA is introduced to assess an agent’s exploration capabilities, posing diverse questions related to scene state, agent knowledge, and object attributes. Concurrently, a substantial body of research has focused on benchmarking deep spatial reasoning , evaluating complex object relationships . Other works have pushed towards dynamic and procedural understanding, utilizing 3D scene graphs or focusing on multimodal reasoning .
However, those existing EQA benchmarks often overlook real-world robustness. While NoisyEQA addresses query noise, robustness to adverse environmental conditions remains a significant gap. Notably, no current benchmark evaluates EQA in dark or low-light situations, which are common in the real world. We therefore introduce the first benchmark for indoor embodied question answering in dark environments to assess robustness under poor visibility.
Handling Low-Light Images
Recent research has explored two main directions for addressing the challenges of low-light visual perception. The first line of work targets robust recognition under low-light conditions, aiming to improve performance on specific vision tasks such as depth estimation, object detection, or pose estimation . Although these approaches demonstrate impressive robustness, they are typically constrained to single-task, highlighting a gap between low-light robustness in isolated perception and the embodied reasoning required in EQA. The second research stream focuses on low-light image enhancement (LLIE), where the goal is to improve the visual quality of dark images for human perception or downstream models . These methods enhance brightness, contrast, and detail visibility using learning-based or physically inspired approaches. While LLIE methods improve visual quality, it remains unclear how they influence general embodied agents in low-light conditions. Therefore, we further explore whether LLIE can help EQA agents overcome the challenges they face in dark environments.
DarkEQA: Dataset Construction and QA Pair Generation
Our DarkEQA is designed to evaluate VLMs’ recognition of core perceptual primitives from a single image-question pair under controlled low-light conditions. However, acquiring real-world low-light images with clean, paired annotations is challenging. To address this, we synthesize low-light images from the well-established indoor scene dataset (i.e., HM3D-Sem ). This section describes the low-light image synthesis for benchmark inputs (Sec. 3.1) and the EQA dataset construction process (Sec. 3.2). A key feature of our work is a dataset construction pipeline designed for high reproducibility and expandability.
Low-Light Image Synthesis for Benchmark Inputs
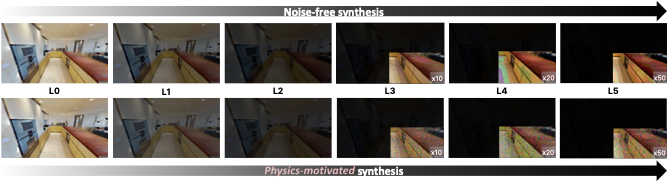
Low-light images suffer from two distinct physical degradations. First, the reduced photon count leads to a fundamental loss of signal, which we term illumination degradation (i.e., exposure-value (EV) drop). Second, this weakened signal yields a low Signal-to-Noise Ratio (SNR), as sensor noise (e.g., shot, read, pattern, and quantization noise) becomes dominant relative to the remaining signal . To reproduce these conditions for benchmark inputs, we design a physics-based low-light synthesis pipeline. Specifically, across multiple degradation severities (L1–L5, increasing severity), we synthesize two paired low-light variants per original image: (i) A noise-free EV-drop variant and (ii) a physics-motivated variant with level-dependent sensor noise injection in the RAW domain, as in Fig. 2. This design enables disentangling the respective impacts of illumination degradation and sensor noise on perceptual peformance of VLMs.
Noise-free low-light image synthesis
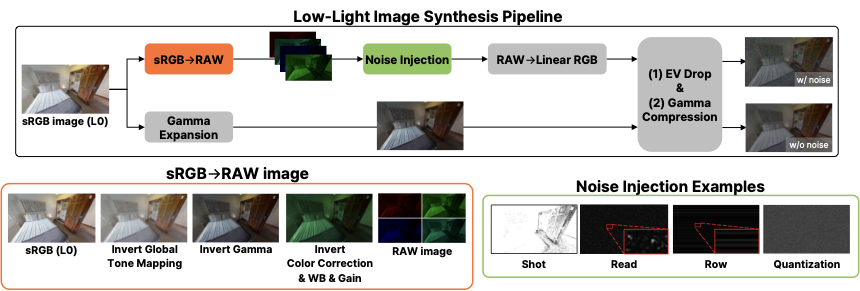
Exposure-value (EV) drop is applied at linear RGB space after decoding sRGB images as shown in the lower branch of low-light image synthesis pipeline depicted in Fig. 1. Decoding to linear RGB. First, we approximate linearization using gamma expansion. Let $`x_{\mathrm{sRGB}}`$ represent a sRGB pixel value in an input image and $`x_{\mathrm{lin}}`$ its linear form. Following , we compute
\begin{equation}
x_{\mathrm{lin}} = \left( \max(x_{\mathrm{sRGB}}, \epsilon) \right)^{2.2},
\label{eq:linearization}
\end{equation}where $`\epsilon = 10^{-8}`$ ensures numerical stability.
Exposure scaling. Next, let $`\Delta\mathrm{EV}`$ denote the absolute change in exposure value. Reducing the exposure by $`\Delta\mathrm{EV}`$ scales the $`x_{\mathrm{lin}}`$ by $`2^{-\Delta\mathrm{EV}}`$. The exposure-scaled pixel value is computed by
\begin{equation}
 x'_{\mathrm{lin}} = 2^{-\Delta\mathrm{EV}} \, x_{\mathrm{lin}}. \label{eq:ev_scaling}
\end{equation}Re-encoding to sRGB. Finally, the exposure-scaled pixel value $`x'_{\mathrm{lin}}`$ is mapped back to sRGB via gamma encoding:
\begin{equation}
x'_{\mathrm{sRGB}} = (x'_{\mathrm{lin}})^{1/2.2}.
\label{eq:srgb_encoding}
\end{equation}We standardize an degradation levels L1–L5 with $`\Delta\mathrm{EV} \in \{2.0,4.0,6.0,7.5,9.0\}`$, respectively (L0 is the original).
Physics-motivated low-light image synthesis
We synthesize realistic low-light images using a physics-based pipeline that combines ISP inversion/forward pass and raw-domain noise modeling . The process is shown in the upper branch of low-light image synthesis pipeline of Fig. 1.
Unprocessing (sRGB $`\rightarrow`$ RAW). We first normalize an 8-bit sRGB image $`\mathbf{I} \in \{0,\ldots,255\}^{H \times W \times 3}`$, where $`H`$ and $`W`$ denote the image height and width, respectively, to
\mathbf{I}_{\mathrm{sRGB}} = \frac{\mathbf{I}}{255} \in [0,1]^{H \times W \times 3}.To obtain a camera-linear RAW image from $`\mathbf{I}_{\mathrm{sRGB}}`$, we invert the ISP following . We denote the unprocessing operator by $`{u}(\cdot)`$, and express the resulting Bayer RAW mosaic as
\begin{equation}
\mathbf{B} = {u}(\mathbf{I}_{\mathrm{sRGB}}),
\label{eq:unprocess_operator}
\end{equation}where $`\mathbf{B} \in [0,1]^{\frac{H}{2} \times \frac{W}{2} \times 4}.`$ The unprocessing operator $`{u}(\cdot)`$ consists of five steps: (i) inverse tone mapping, (ii) gamma expansion, (iii) RGB$`\rightarrow`$Camera color correction with sampled matrix $`\mathbf{M}_{\text{rgb}\rightarrow\text{cam}}`$, (iv) inversion of white-balance/brightness gains with highlight preservation, and (v) mosaic extraction into RGGB Bayer representation. This restores a scene-referred signal where noise statistics are defined with respect to photon counts and sensor readout electronics, not post-ISP perceptual tone curves.
Noise formation in RAW. Following the physics-based formation model of , we inject four noise components into the camera-linear RAW signal. Let $`\mathbf{B}`$ denote the clean, mosaiced RAW image obtained from unprocessing. After converting $`\mathbf{B}`$ from normalized units to the sensor’s ADU domain, we sample a system gain $`K`$ log-uniformly from $`[0.1, 6.0]`$. The noisy RAW image is then expressed as
\begin{equation}
\mathbf{B}_{\text{noisy}} = \mathcal{N}_4 \circ \mathcal{N}_3 \circ \mathcal{N}_2 \circ \mathcal{N}_1 (\mathbf{B}, K),
\label{eq:raw_noise_operator}
\end{equation}where $`\mathcal{N}_i`$ denotes the $`i`$-th noise operator mapping a
Bayer RAW tensor and system gain K to a Bayer RAW tensor described
below.
(1) Photon shot noise. Photon arrival is discrete and stochastic.
For each pixel, the number of photoelectrons $`N`$ follows
$`N \sim \mathrm{Poisson}(\lambda)`$ where $`\lambda`$ is proportional
to scene irradiance. To simulate extreme low-light capture, we apply an
ISO amplification ratio $`r \in [100, 300]`$: (i) reduce the signal by
$`r`$ (low-light capture), (ii) add Poisson noise, (iii) amplify back by
$`r`$ using sensor gain. This preserves the characteristic of
low-photon-count statistics while allowing the final output brightness
to be controlled independently via the EV drop.
(2) Read noise. Readout electronics introduce an additive noise
term $`N_{\text{read}}`$. We model it using a Tukey–$`\lambda`$
distribution with a channel-wise DC offset (color bias). The scale
parameter $`\sigma_{\mathrm{TL}}`$ grows log-linearly with the system
gain $`K`$:
\log \sigma_{\mathrm{TL}} = a_{\mathrm{TL}} \log K + b_{\mathrm{TL}} + \epsilon,capturing the heavy-tailed distribution observed under extreme
low-light .
(3) Row noise. Line-wise variations in the readout circuitry
produce banding artifacts. Each row $`i`$ receives a shared offset
$`n_r^{(i)} \sim \mathcal{N}(0, \sigma_r^2)`$, where $`\sigma_r`$ also
scales log-linearly with $`K`$.
(4) Quantization noise. Analog-to-digital conversion introduces
rounding error $`N_q`$ modeled as $`N_q \sim \mathcal{U}(-0.5,0.5)`$,
where $`\mathcal{U}`$ represents a uniform distribution on
$`[-0.5, 0.5]`$, assuming a standard unit (1 ADU) quantization step.
Simplified ISP (RAW $`\rightarrow`$ sRGB). Converting RAW to sRGB is an inverse operation of unprocessing: (i) white balance with sampled gains, (ii) bilinear demosaicing from RGGB Bayer to RGB, (iii) color correction using $`\mathbf{M}_{\text{cam}\rightarrow\text{rgb}}`$, (iv) EV drop by $`\Delta\mathrm{EV}`$ in linear space (multiplying intensities by $`2^{-\Delta\mathrm{EV}}`$) to match the target degradation levels L1–L5, (v) gamma compression, and (vi) quantization to 8-bit sRGB.
Scene set $`\mathcal{S}`$; frames $`\mathcal{F}_s`$ for each $`s \in \mathcal{S}`$ QA pairs $`\mathcal{Q}`$ with ground-truth answers Definitions: $`\Omega_f = \{1,\dots,W\}\times\{1,\dots,H\}`$: Pixel grid of frame $`f`$ $`M_i^f \in \{0,1\}^{H\times W}`$: Mask for segment $`i`$ in frame $`f`$ $`\mathcal{A}_i \in \mathbb{R}^d`$: Attribute vector for segment $`i`$ (semantic class, color, depth, area, bbox) $`\Phi_f = \{\mathcal{A}_i\}_{i=1}^{N_f}`$: Frame statistics (all segment attributes) $`r_f`$: Room type label for frame $`f`$ $`\mathcal{C}_f \subseteq \{1,2,3,4,5\}`$: Viable question families of frame $`f`$ Generate QA from Frames $`\mathcal{Q} \gets \emptyset`$ — 1. Extract Statistics Load $`I_{\text{RGB}}^f, I_{\text{depth}}^f, I_{\text{sem}}^f, I_{\text{over}}^f`$ $`M_i^f(x,y) \gets \mathbf{1}[(x,y)\in\Omega_f \wedge I_{\text{over}}^f(x,y)=i]`$ $`\mathcal{A}_i \gets \text{ComputeStats}(M_i^f, I_{\text{RGB}}^f, I_{\text{depth}}^f, I_{\text{sem}}^f)`$ $`\Phi_f \gets \{\mathcal{A}_i : \forall i\}`$ — 2. Generate QA $`r_f \gets \text{ClassifyRoom}(\Phi_f)`$ $`\mathcal{C}_f \gets \text{Survey}(\Phi_f, r_f)`$ $`q \gets \text{Rule}_k(\Phi_f, r_f)`$ $`\mathcal{Q} \gets \mathcal{Q} \cup \{q\}`$ $`\mathcal{Q}`$
Dataset Construction
We build the dataset for evaluation upon a representative subset of 52 scenes from HM3D-Sem , selected for diversity and semantic richness. For each scene, we record a human-demonstrated navigation trajectory that systematically explores the environment to maximize spatial coverage. To generate the ground-truth QA pairs, we uniformly subsample the trajectory and select keyframes at a fixed time interval (e.g., one frame every 2,s), rendering their geometric and semantic modalities (e.g., RGB, depth, segmentation). We then use Algorithm [alg:engine] as deterministic procedure to automatically generate QA pairs from the pre-computed per-keyframe statistics. This approach ensures each question has a single, verifiable answer by filtering ambiguities (e.g., tiny objects), requires no manual annotation, and avoids potential data contamination by not using commodity VLM services. This entire process is fully reproducible.
Algorithm [alg:engine] operates in two stages: frame-statistics extraction (Stage 1) and QA generation (Stage 2). In Stage 1, we cache the frame statistics $`\Phi_f`$ required for Stage 2. Each frame $`f`$ is represented as a quadruple $`f = (I_{\mathrm{RGB}}^f, I_{\mathrm{depth}}^f, I_{\mathrm{sem}}^f, I_{\mathrm{over}}^f)`$, comprising an RGB image, depth map, semantic label map, and over-segmentation map, respectively (the RGB image is three-channel, whereas the others are single-channel). Using these frame-wise statistics and a set of predefined rules, Stage 2 predicts the room type for each frame, enumerates applicable question templates, and generates the corresponding per-frame QA pairs.
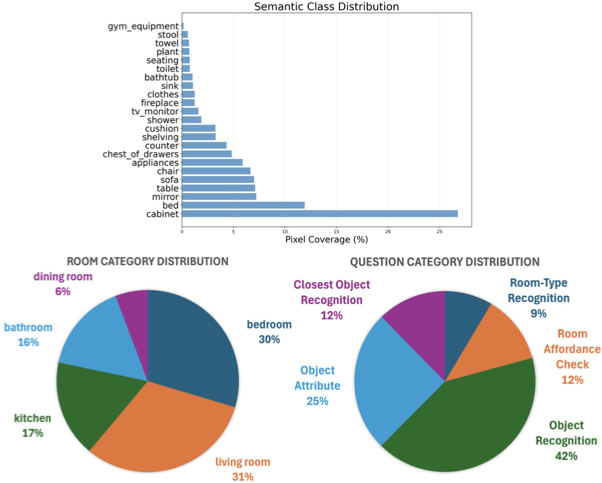
For example, consider the “Closest Object Recognition” question in Fig. 3. Object-level statistics are first extracted. The QA generation pipeline validates two conditions: (i) at least two non-structural, non-quasi-2D object instances with valid depth measurements exist, and (ii) the depth gap between top-two closest objects exceeds a minimum threshold to ensure perceptual validity. If satisfied, the closest object is determined as the ground-truth answer. In this example, “chair” is identified as the closest object.
This pipeline generates five question families targeting visual primitives for embodied operation: Room-Type Recognition, Room Affordance Check, Object Recognition, Object Attribute, and Closest Object Recognition. The examples for each family are provided in Fig. 3.
Dataset Statistics
Our DarkEQA comprises 52 scenes selected from HM3D-Sem, yielding 3,911 frames at $`1440 \times 2560`$ resolution with $`\sim`$9.4K QA pairs. Fig. 4 shows that the dataset exhibits semantic class and room category distributions that are representative of typical residential environments. The semantic annotation covers 23 non-structural object classes, with the most prevalent being cabinet, bed, mirror, and table taking up about 53%. Room category distribution reflects the natural spatial composition of household scenes. The question distribution across the five question families shows moderate imbalance, with frequencies determined by the geometric and semantic constraints of our rule-based QA generation pipeline and subsequent validation through human sanity checks to ensure answer correctness.
EXPERIMENTS
In this section, we describe our experimental settings and provide quantitative evaluation results of various VLMs on DarkEQA, along with an analysis of the effects of illumination degradation, noise injection, and LLIE models used as a pre-processing module.
Experimental Setup
We evaluate DarkEQA on both VLMs and text-only LLMs (blind LLMs). For each keyframe and degradation condition, we present a single question together with a fixed, small set of candidate answers (room-type labels, object classes, color names, or a candidate list for closest objects). VLMs receive the image and the question–choice template, whereas blind LLMs see only the textual question and choices. Each question is thus cast as a multiple-choice problem, and models are instructed to output exactly one answer from the choices. This constrains the response space, avoids ambiguities in free-form generation, and enables exact-match scoring.
Baseline Models
Blind LLMs. We set the scenario of blind agents that produces an answer based on the question that requires visual information to answer . Even though our DarkEQA focuses on the VLM’s behavior according to illumination change and noise injection, we use the result of blind LLMs to catch the possible bias of our dataset while also testing how well the questions may be answered with an assumption of indoor environments. For the LLM choice, we report the results of GPT-4 and LLaMA-3.1-8B .
VLMs. We evaluate a range of VLMs across different parameter scales. For 7–8B models, we report results for LLaVA-1.6-7B , LLaVA-OneVision-8B , InternVL3.5-8B , and Qwen3-VL-8B . For larger-scale models ($`\geq`$ 30B), we additionally evaluate InternVL3.5-30B and Qwen3-VL-32B using the same respective series. Finally, we include GPT-4o as a upper bound.
LLIE model. We use DarkIR as our LLIE baseline throughout the evaluation for enhancing low-light images.
 />
/>
Results and Analysis
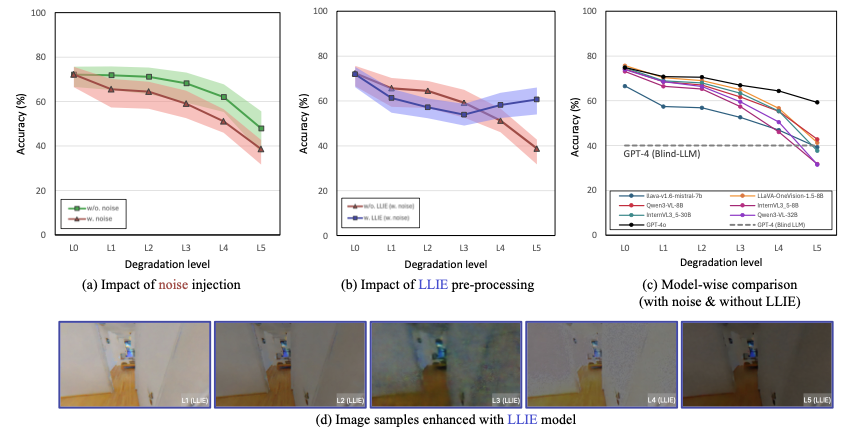
Impact of illumination drop and sensor noise. To understand the robustness of VLMs against visual illumination degradation, we first observe their performance under two types of low-light simulation: (1) pure EV drop and (2) EV drop with sensor noise. As shown in Fig. 5-(a), both degradations consistently lead to a significant decrease in VLM accuracy. Notably, the introduction of sensor noise compounds this decline, resulting in a more pronounced performance drop compared to pure EV reduction. This confirms that VLMs are indeed highly sensitive to such visual degradation, with noise being a critical factor.
Effectiveness of low-light image enhancement (LLIE) pre-processing. Given the observed performance degradation, we investigate whether pre-processing low-light images with a state-of-the-art Low-Light Image Enhancement (LLIE) model can mitigate these issues. We apply LLIE models to the noise-added low-light images before feeding them into the VLMs. As illustrated in Fig. 5-(b), this approach yields mixed results. While we observe a significant accuracy improvement at more severe low-light levels (L4 and L5), performance decreases at moderate levels (L1–L3). This unstable behavior highlights the challenge of reliably enhancing low-light images across different levels of degradation. While current LLIE models enhance perceptual quality, the results suggest that current LLIE models may be biased to certain degradation levels as in Fig. 5-(d).
Model-specific accuracy. Fig. 5-(c) provides a detailed comparison of the performance trends across individual VLMs under noisy inputs without LLIE preprocessing. While the specific degradation curves vary slightly across each models, the overall trend is a largely similar decline in accuracy as low-light conditions intensify. Although the commodity service GPT-4o consistently demonstrates the highest performance, it also shows performance degradation under low-light conditions. Furthermore, we observe an interesting point: at the most severe low-light level (L5), some VLMs achieve accuracy lower than that of GPT-4 (Blind-LLM baseline), which operates solely on textual input without any visual information. This indicates that for images under extreme degradation, the models are unable to effectively utilize these visual information, leading to a poorer understanding of semantic information compared to relying purely on language priors. Furthermore, this is more profound in that, the LLIE-enhanced image from L5 in Fig. 5-(d) seems to be perceivable to humans’ eyes. This hints that, 1) there is low correlation between the perceptual quality and VLMs’ task performance, and 2) effective LLIE integration in VLMs requires task-oriented LLIE modules for VLM perception.
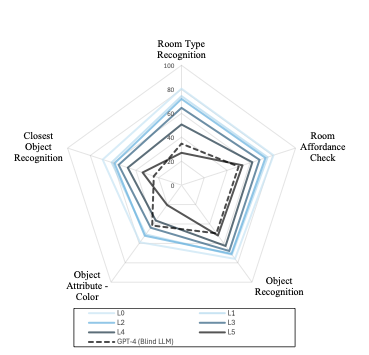
Question-wise accuracy. To gain a more granular understanding of the performance decline, we further analyze the accuracy degradation across different question types, as shown in Fig. 6. While most categories exhibit a steady decline, we observe a critical phenomenon in two specific types: “Room Type Recognition” and “Object Attribute - Color”. For these categories, the VLM accuracy drops below that of the GPT-4 (Blind-LLM) baseline at severe degradation levels (L5 for the former, and L4 and L5 for the latter). The fact that this effect is particularly pronounced for the “Color” category strongly suggests that VLMs struggle to extract or preserve essential visual semantic information, such as color, when processing heavily dark images. Interestingly, this observation is analogous to the behavior of the human vision in dark scenes, where the visual primarily relies on rod cells that are sensitive to luminance because color-sensitive cone cells function much less effectively.
For details and case-by-case results, please refer to Table [tab:complete], which contains the complete data supporting our analysis. L0 denotes the original images and serves as the baseline, while L1–L5 are darker images via the EV-drop, optionally combined with noise and/or LLIE. The (/) indicators specify active components, and the small gray numbers next to each score denote changes relative to L0.
| Model | L0 | EV Drop | Noise | LLIE | Degradation Level | ||||
|---|---|---|---|---|---|---|---|---|---|
| 6-10 | L1 | L2 | L3 | L4 | L5 | ||||
| (L1 → L5: darker; if Noise , noisier) | |||||||||
| LLaVA-1.6-7B | 66.55 | 65.21 -1.34 | 63.33 -3.22 | 59.48 -7.07 | 55.23 -11.32 | 47.09 -19.46 | |||
| 64.36 -2.19 | 64.40 -2.15 | 63.40 -3.15 | 62.57 -3.98 | 60.69 -5.86 | |||||
| 57.43 -9.12 | 56.85 -9.70 | 52.60 -13.95 | 46.93 -19.62 | 39.25 -27.30 | |||||
| 54.77 -11.78 | 52.31 -14.24 | 48.98 -17.57 | 52.40 -14.15 | 54.03 -12.52 | |||||
| LLaVA-OneVision-8B | 75.67 | 75.85 +0.18 | 75.33 -0.34 | 73.07 -2.60 | 67.72 -7.95 | 52.20 -23.47 | |||
| 74.56 -1.11 | 75.14 -0.53 | 74.41 -1.26 | 74.00 -1.67 | 72.64 -3.03 | |||||
| 70.31 -5.36 | 68.98 -6.69 | 65.01 -10.66 | 56.63 -19.04 | 41.28 -34.39 | |||||
| 65.42 -10.25 | 61.13 -14.54 | 58.75 -16.92 | 63.63 -12.04 | 66.00 -9.67 | |||||
| Qwen3-VL-8B | 74.09 | 73.86 -0.23 | 73.96 -0.13 | 71.76 -2.33 | 66.79 -7.30 | 55.60 -18.49 | |||
| 71.87 -2.22 | 73.25 -0.84 | 72.37 -1.72 | 71.43 -2.66 | 70.16 -3.93 | |||||
| 68.51 -5.58 | 67.06 -7.03 | 61.65 -12.44 | 55.32 -18.77 | 42.79 -31.30 | |||||
| 64.27 -9.82 | 59.03 -15.06 | 54.41 -19.68 | 59.87 -14.22 | 62.16 -11.93 | |||||
| InternVL3.5-8B | 72.77 | 72.31 -0.46 | 71.90 -0.87 | 68.48 -4.29 | 58.25 -14.52 | 36.77 -36.00 | |||
| 70.11 -2.66 | 70.94 -1.83 | 70.69 -2.08 | 69.88 -2.89 | 68.71 -4.06 | |||||
| 66.44 -6.33 | 65.29 -7.48 | 57.40 -15.37 | 46.05 -26.72 | 31.76 -41.01 | |||||
| 60.84 -11.93 | 56.23 -16.54 | 53.45 -19.32 | 57.00 -15.77 | 60.48 -12.29 | |||||
| InternVL3.5-30B | 74.81 | 74.96 +0.15 | 74.30 -0.51 | 72.01 -2.80 | 65.52 -9.29 | 49.23 -25.58 | |||
| 72.68 -2.13 | 73.29 -1.52 | 72.85 -1.96 | 72.07 -2.74 | 71.15 -3.66 | |||||
| 68.95 -5.86 | 68.02 -6.79 | 63.34 -11.47 | 55.37 -19.44 | 37.65 -37.16 | |||||
| 63.44 -11.37 | 57.81 -17.00 | 54.70 -20.11 | 58.71 -16.10 | 63.54 -11.27 | |||||
| Qwen3-VL-32B | 73.90 | 73.96 +0.06 | 73.10 -0.80 | 69.25 -4.65 | 62.89 -11.01 | 45.87 -28.03 | |||
| 71.92 -1.98 | 73.12 -0.78 | 71.95 -1.95 | 71.18 -2.72 | 70.00 -3.90 | |||||
| 68.50 -5.40 | 66.40 -7.50 | 59.50 -14.40 | 50.50 -23.40 | 31.50 -42.40 | |||||
| 63.30 -10.60 | 57.70 -16.20 | 53.30 -20.60 | 60.30 -13.60 | 62.83 -11.07 | |||||
| GPT-4o | 74.80 | 70.80 -4.00 | 70.50 -4.30 | 66.90 -7.90 | 64.40 -10.40 | 59.29 -15.51 | |||
CONCLUSION
We introduce DarkEQA, a new benchmark designed to address an overlooked and critical regime in VLM evaluation: the lack of systematic analysis for embodied reasoning in low-light conditions. Using a physically-grounded low-light image synthesis pipeline, we create a reproducible benchmark to measure VLM robustness against realistic visual degradations. Our findings reveal that current VLMs are brittle in the dark, and that seemingly straightforward solutions like LLIE pre-processing can yield unstable results. Although our benchmark provides evaluations based on HM3D-Sem, our contribution extends beyond this single dataset. The provided low-light image synthesis algorithm and rule-based QA generation pipeline can be leveraged to adapt numerous existing datasets for new training and evaluation purposes. While our benchmark reveal the vulnerabilities of both VLMs and LLIEs to indoor low-light conditions, a detailed causal analysis of these failures remains a valuable direction for future research. Furthermore, our adopted approach—synthesizing low-light images from rendered inputs—is a practical choice when considering physical and financial limitations. However, mitigating a potential real-to-sim gap presents another important avenue for subsequent work.
📊 논문 시각자료 (Figures)