The adoption of artificial intelligence in dermatology promises democratized access to healthcare, but model reliability depends on the quality and comprehensiveness of the data fueling these models. Despite rapid growth in publicly available dermatology images, the field lacks quantitative key performance indicators to measure whether new datasets expand clinical coverage or merely replicate what is already known. Here we present SkinMap, a multi-modal framework for the first comprehensive audit of the field's entire data basis. We unify the publicly available dermatology datasets into a single, queryable semantic atlas comprising more than 1.1 million images of skin conditions and quantify (i) informational novelty over time, (ii) dataset redundancy, and (iii) representation gaps across demographics and diagnoses. Despite exponential growth in dataset sizes, informational novelty across time has somewhat plateaued: Some clusters, such as common neoplasms on fair skin, are densely populated, while underrepresented skin types and many rare diseases remain unaddressed. We further identify structural gaps in coverage: Darker skin tones (Fitzpatrick V-VI) constitute only 5.8% of images and pediatric patients only 3.0%, while many rare diseases and phenotype combinations remain sparsely represented. SkinMap provides infrastructure to measure blind spots and steer strategic data acquisition toward undercovered regions of clinical space.
The integration of artificial intelligence (AI) into medicine revolutionizes many clinical specialties, including dermatology. However, the performance and clinical reliability of these models are fundamentally dependent on the quality, diversity, and scale of the data on which they are trained [1][2][3][4] . For years, the dermatology community has pointed to data scarcity, particularly diversity-related issues, as a primary obstacle to progress [5][6][7][8] , but the claim has remained largely unquantified. This gap masks deeper issues: Without a systematic audit of the global data landscape, the research community risks investing resources in collecting redundant data, while biases and blind spots go unaddressed. Furthermore, models trained on unexamined corpora of data can inadvertently learn and amplify biases related to skin tones, rare conditions, or specific demographics, leading to tools that fail in real-world clinical settings and potentially worsen existing health disparities. Previous initiatives to improve the data landscape have been largely unguided, focusing on presumed gaps and biases rather than those identified through systematic quantitative analysis 6;9;10 . Although these contributions are valuable, they lack a comprehensive perspective because a reproducible and scalable methodology to measure dataset coverage and marginal utility is missing. Consequently, the field operates without key performance indicators to quantify whether new data expand the clinical map or reinforce existing blind spots.
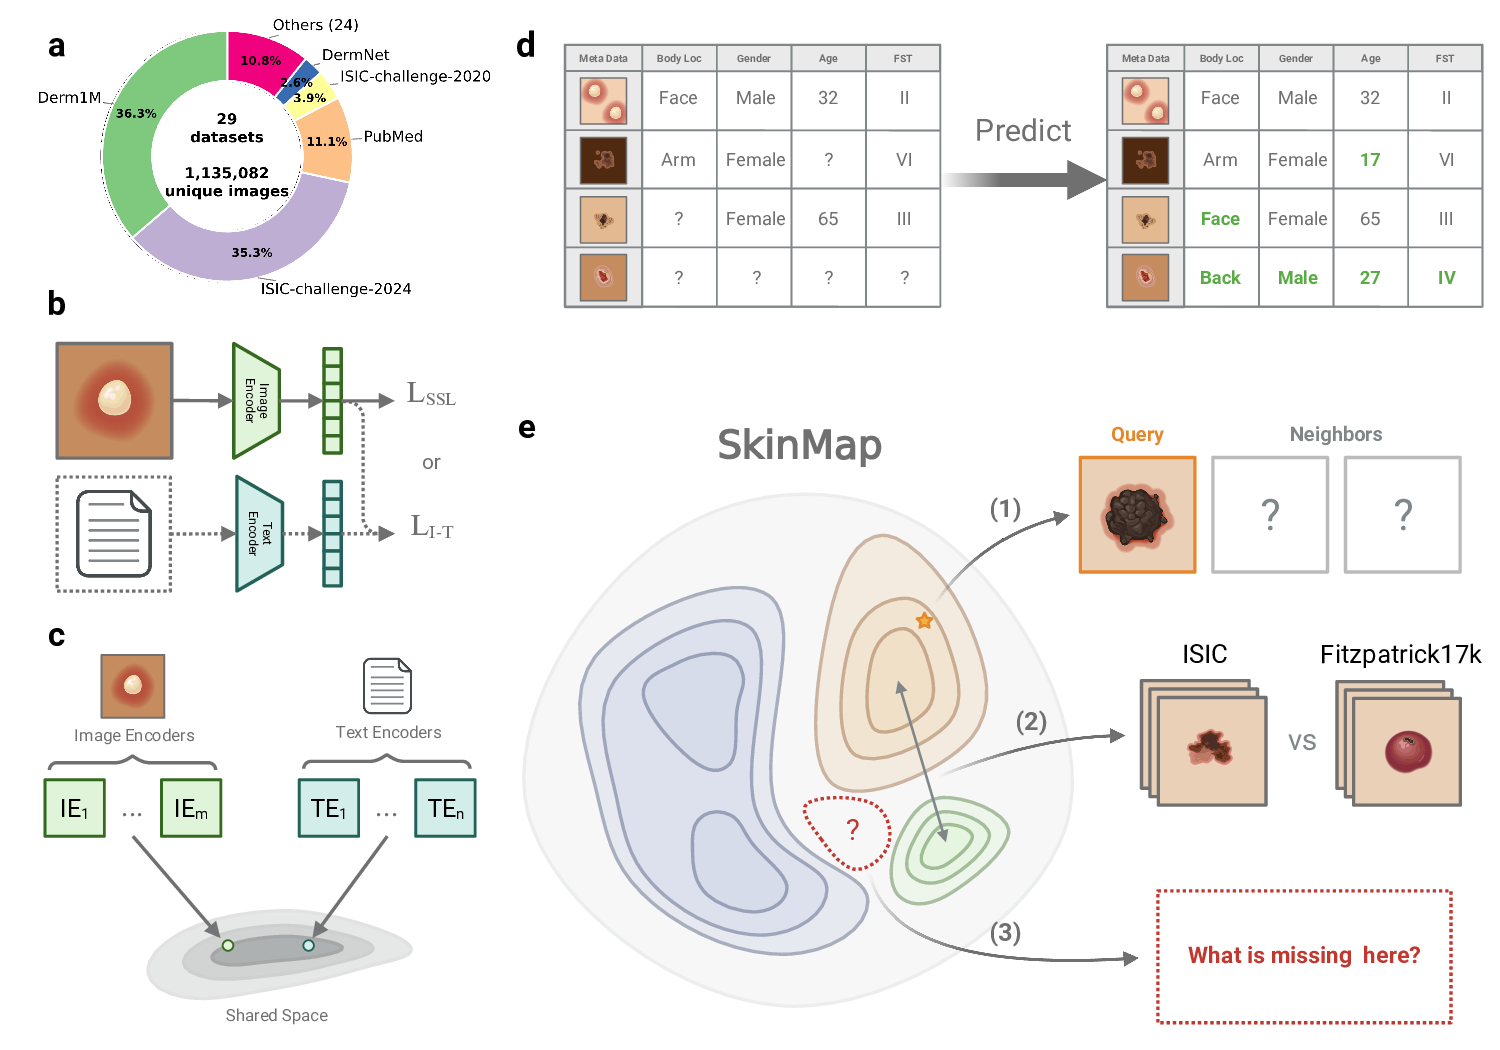
archive into a queryable, interactive digital atlas. Visualizing the data landscape in real time enables clinicians and researchers to search for clinically similar cases and to transparently assess data availability across collections. To achieve this, we construct a shared semantic embedding space that captures clinical similarities across datasets.
We aggregate 1,135,082 unique images from 29 public datasets, ranging from leading archives such as ISIC 11 to specialized cohorts 6;9;12-24 , and harmonize them to enable joint analysis. By employing a multi-modal approach that aligns images with standardized natural language captions, and combining them in an ensemble with purely image-trained models, we project these disparate samples into a common latent space where proximity corresponds to visual and clinical similarity. Crucially, this shared space enables us to quantitatively assess the central issue of unharmonized and missing metadata. Using the latent representations of annotated samples, we infer missing clinical attributes, such as Fitzpatrick skin type (FST), age, gender, and geographic origin, across the entire collection with clinically validated, high-accuracy. This imputation transforms the sparsely annotated archive into an actionable resource, enabling us to analyze the demographics of the entire 1.1 million-image collection rather than only the labeled and harmonized subset. Following unification, our audit indicates that the dermatology data landscape remains unrepresentative of the global population.
Current datasets are disproportionately composed of lightly pigmented skin images and are geographically concentrated in the Global North 5;9 , whilst darker skin tones (FST V-VI) comprise only 5.8% of available image data. Furthermore, a temporal analysis of data acquisition reveals that despite exponential growth in dataset sizes, novelty has plateaued across both visual information and associated labels, revealing a systemic inefficiency in current data collection strategies. Rather than exploring highgain gaps in rare conditions and underrepresented demographics, the community is investing scarce resources in the redundant accumulation of common neoplasms among fair-skinned individuals. Finally, by quantifying how similar datasets truly are, we show that several nominally distinct datasets share near-identical representations, implying that many so-called external validations in the literature may effectively be internal validations. This unrecognized data leakage artificially inflates performance metrics and risks deploying models that fail to generalize to truly new patient populations.
Ultimately, SkinMap shifts the paradigm from unguided data accumulation to strategic acquisition.
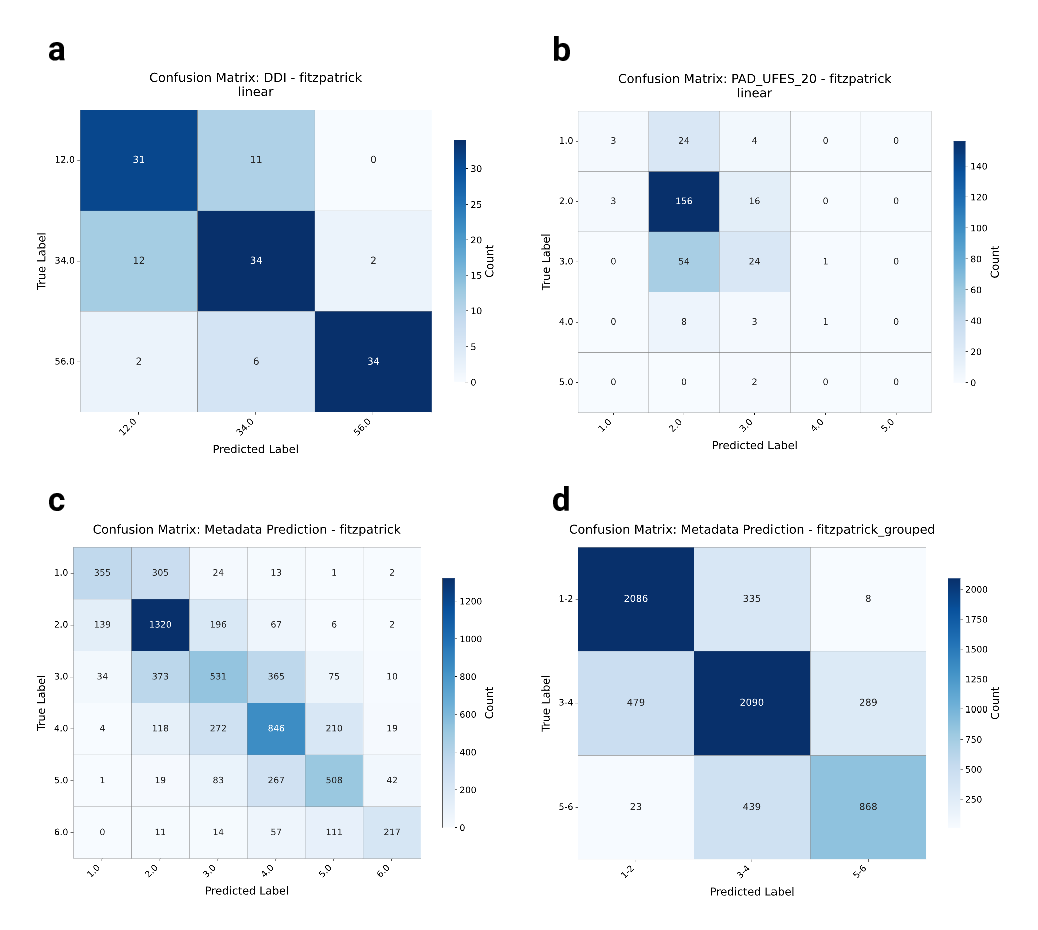
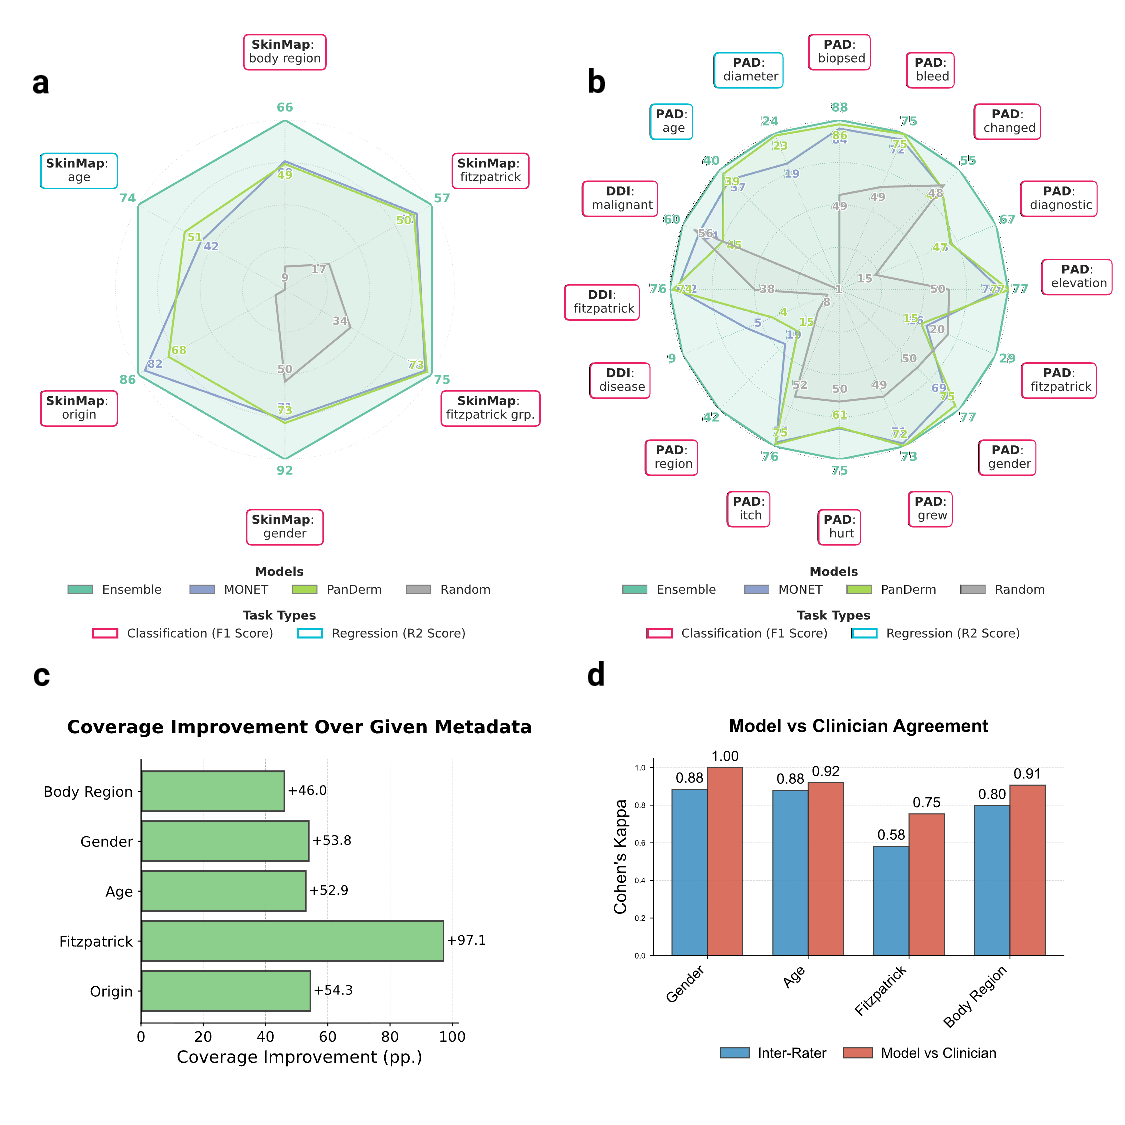
The vast majority of the 1.1 million images lack a complete set of demographic metadata, such as skin tone, age, and gender. To address this, we utilized the SkinMap embedding space to impute missing attributes, expanding the metadata coverage of the dataset by an average of 50.7 percentage points (Fig. 2c). We validated this imputation engine on an evaluation set and two datasets (DDI 6 and PAD-UFES-20 17 ) that were strictly held out, i.e., excluded from pretraining. The SkinMap ensemble demonstrates superior performance, robustly outperforming state-of-the-art foundation models, including MONET 25 that the ensemble faithfully estimates the demographics without hallucinating diversity or introducing algorithmic bias (Supplementary Fig. 2). This is further confirmed by validating the predictions for 150 cases against experienced, practicing dermatolo- (Fig. 2d). This densely annotated dataset overcomes the limitations of the original, sparse labels to assess the demographic composition of the entire digital archive.
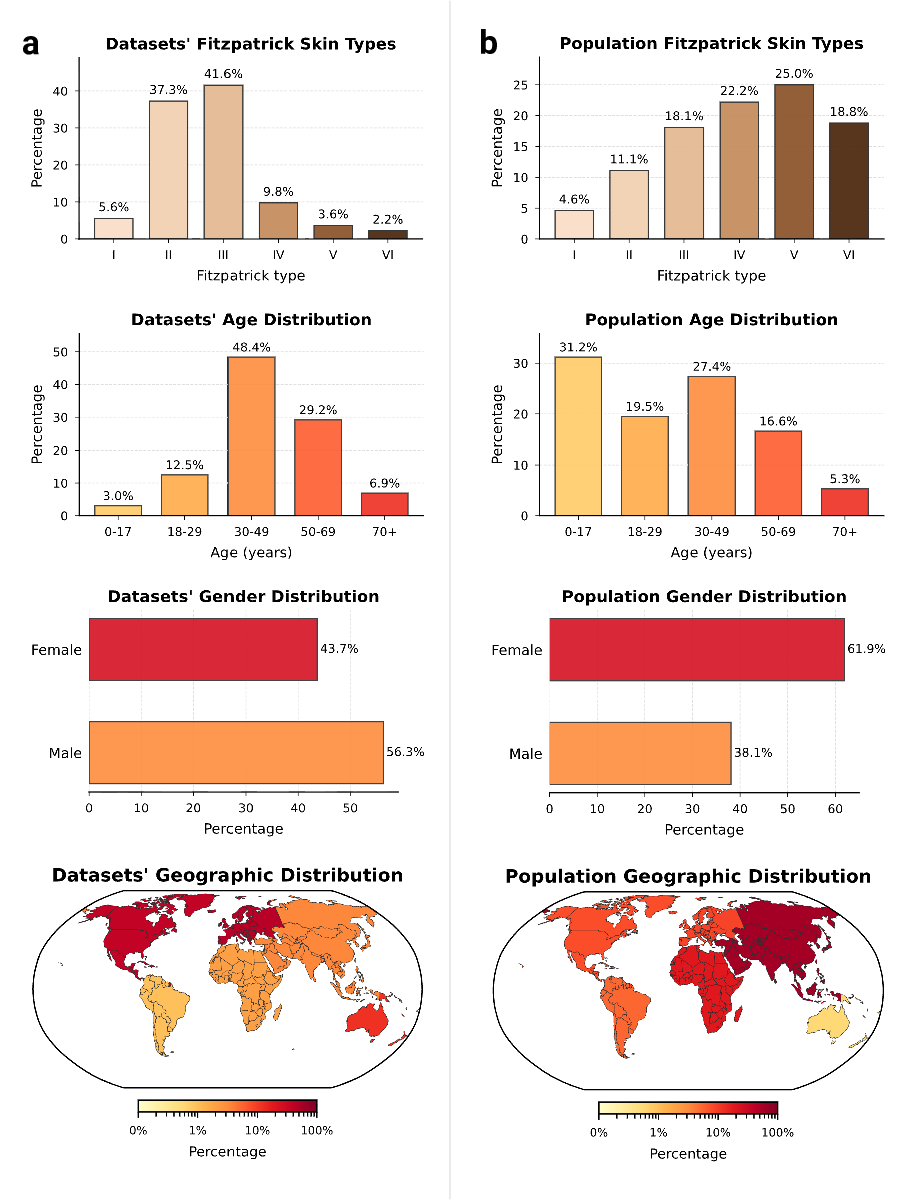
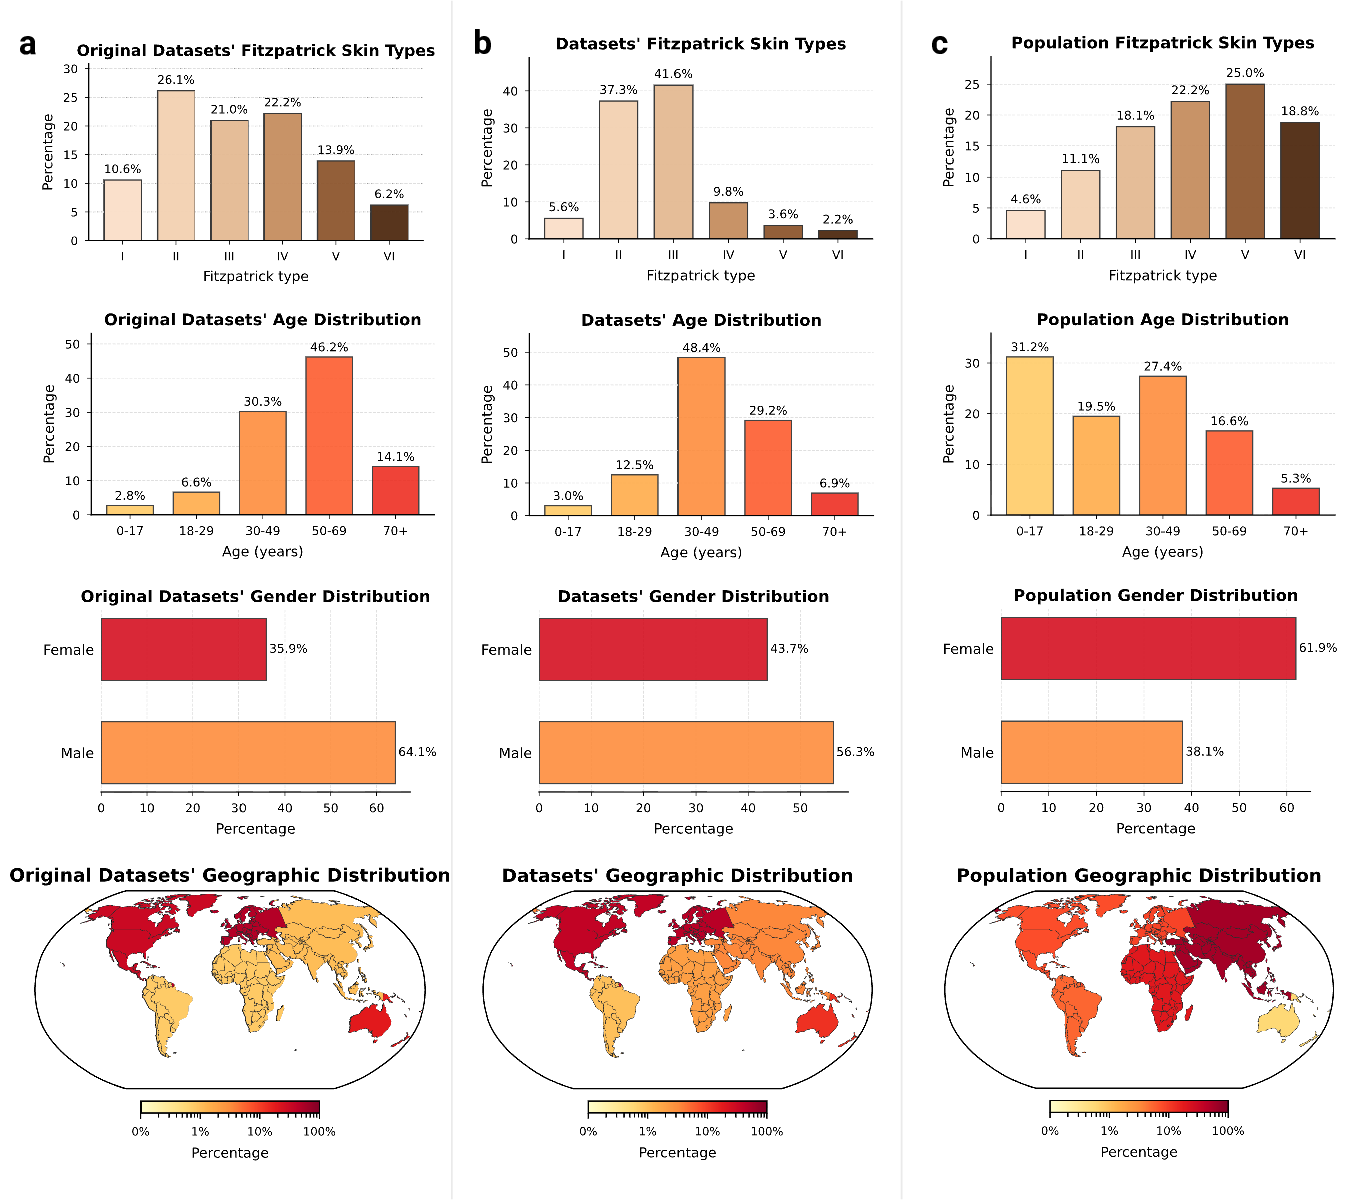
Comparing the demographic distribution in the available data with expected population demographics reveals a significant divergence between dataset collection and global demographics (Fig. 3a-b). To refute the argument that data scarcity merely reflects workforce shortages, we benchmarked against clinical prevalence statistics,
i.e., specifically outpatient encounters 27 and diverse study cohorts
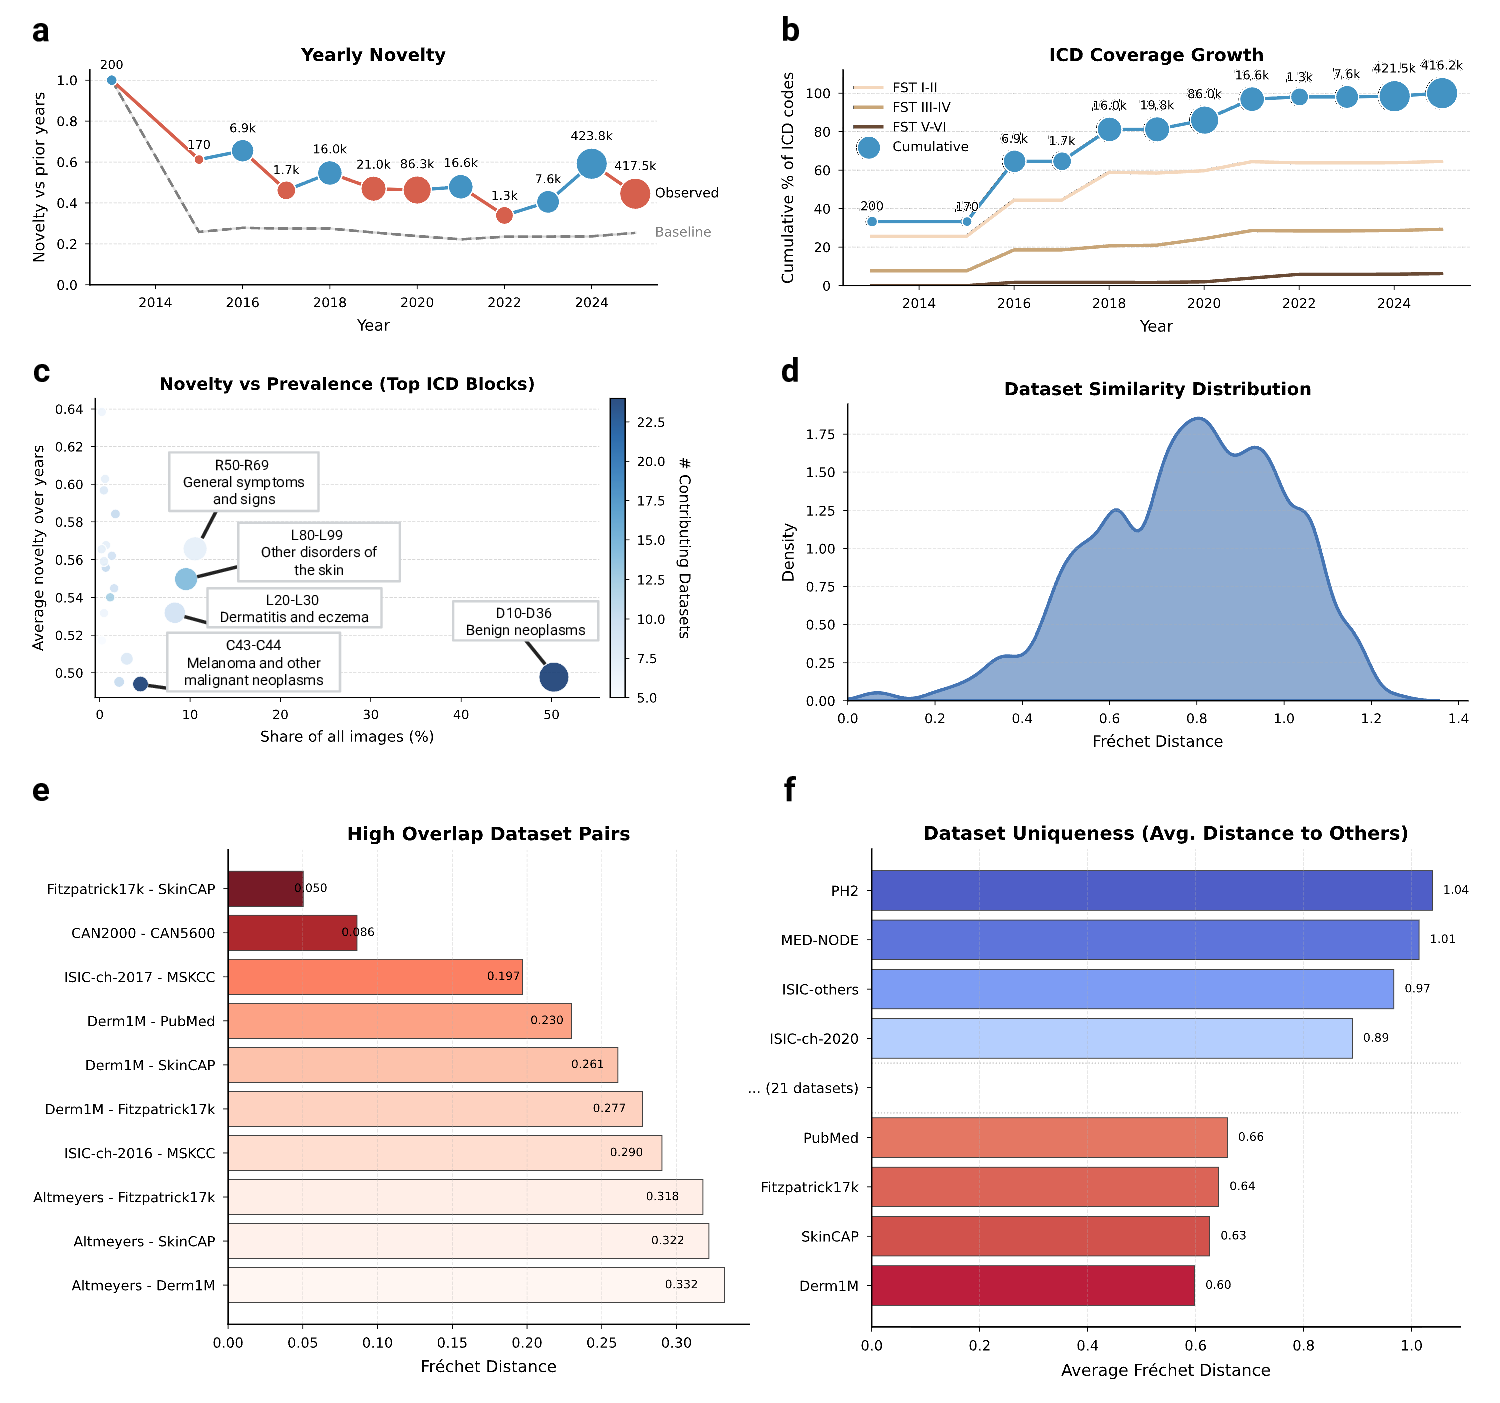
Model performance is often assumed to scale with data volume 32 . Our temporal audit suggests the field is nearing a saturation regime in which additional samples contribute less and less novel information. We quantify novelty as the embedding-space dissimilarity of collected samples relative to previously available data. To separate the exploration of new regions from the effect of increasing the sample size of the existing distribution, we compare the collected data against a dataset that is simply resampled from the historical pool. We define yearly novelty as the average distance of the samples released in a given calendar year from their neighbors, divided by the same average for the data resampled from previous years. Against this baseline, we observe a clear decline: Increases in raw sample counts no longer yield proportional gains in embedding-space novelty (Fig. 4a), indicating diminishing marginal informational return under our operational definition. Despite the large number of new samples collected, exceeding 1,000,000 in 2017-2025, novelty has plateaued near the random baseline. The main exception occurs in 2024, when the addition of total body photography (TBP) imagery from ISIC-challenge-2024 produces a transient spike in novelty. Together, these results indicate that recent datasets predominantly land within already-populated regions of the data space, and that future gains will require targeted collection in underrepresented regions rather than indiscriminate scaling. To determine if this saturation stems from visual redundancy or a lack of clinical diversity, we analyzed the yearly international classification of diseases (ICD) coverage growth stratified by skin tone (Fig. 4b). The analysis reveals a stark divergence: While disease diversity on fair skin (FST I-II) continues to expand, albeit at a reduced rate, coverage for darker skin tones (FST V-VI) has flatlined at nearzero levels. This confirms that the field is predominantly including missing diseases for white populations, while the clinical spectrum for the global majority remains unmapped. By investigating novelty against prevalence in datasets (Fig. 4c), we localized this saturation to specific diagnostic categories. The current landscape is heavily weighted towards collecting benign neoplasms (D10-D36) and melanoma (C43-C44), which provide high sample volumes but low novelty scores. Conversely, high-novelty categories such as general symptoms and signs (R50-R69) remain poorly addressed in terms of both image volume and contributing datasets.
These findings suggest that without a strategic shift towards underrepresented phenotypes, i.e., specifically rare pathologies and diverse skin tones, scaling existing archives yields diminishing informational returns. Continued accumulation in highdensity clusters (i.e., FST II-III, common neoplasms) may lead to minor diagnostic performance gains in arguably important cases, but contributes little to the model’s ability to recognize rare or atypical presentations.
The current dermatology open data landscape comprises 29 nominally distinct datasets. To quantify how distinct these datasets are in practice, we measured pairwise distances in the SkinMap embedding space as a proxy for mutual diversity. The resulting similarity density (Fig. 4d) is skewed toward low distances, implying that most public datasets differ only modestly and do not constitute clearly separable clinical populations. Consistent with this, we identify several highoverlap pairs (Fig. 4e) with near-identical statistical structure, including established relationships (e.g., Fitzpatrick17k-SkinCAP and CAN2000-CAN5600) and substantial similarities between annual challenge datasets and their parent institutional archives (e.g., ISIC-challenge-2017-MSKCC, Derm1M-PubMed, and Derm1M-SkinCAP).
Although such overlap may be expected when data originate from shared institutions, it has direct implications for evaluation: Validation on a related dataset can masquerade as “external” testing while effectively reproducing internal validation, artificially inflating reported performance, and obscuring gaps in real-world generalization.
To guide future data selection, we propose a score for dataset uniqueness (Fig. 4f), computed as the average distance of a dataset to the global collection of dermatology.
General-purpose datasets such as Derm1M are close to the statistical center of the map, indicating that they represent typical patient profiles currently available to AI.
Undoubtedly useful for teaching models the basics, adding more such data yields limited gains in model robustness. In contrast, datasets such as PH2 and MED-NODE populate the outer regions of the map. PH2 and MED-NODE contribute distributional variance through a tightly controlled acquisition protocol and lesion characteristics that are comparatively uncommon in larger archives. These “outliers” are high-value assets: They contain the distinct, non-standard variations necessary to rigorously stress-test an AI’s ability to handle diverse real-world populations.
To assess the coverage of the global dermatological data collection, we analyze the density of different regions of the SkinMap embedding space. We identify regions of hypersaturation and sparsity, i.e., clusters with the highest and lowest 2.5% density quantiles (Supplementary Fig. 1), revealing that the atlas is polarized between massive redundancy and distinct structural voids. The high-density regions represent statistically overrepresented visual clinical presentations (Supplementary Fig. 1c). moles, confirming that continued accumulation in these regions yields diminishing returns. Conversely, low-density regions often highlight data-quality issues such as images unrelated to dermatology, reconstruction artifacts, and heavily occluded images (Supplementary Fig. 1d). Thus, embedding density can also serve as an automated quality-assurance mechanism, i.e., by pruning redundant clusters and filtering outliers.
Moreover, we applied spectral persistent homology 33 to detect topological holes, i.e., void regions with almost no cases (Fig. 5). Unlike simple low-density regions, these holes represent “unknown unknowns”: Valid clinical phenotypes that are structurally absent from the training data. Crucially, this analysis independently confirms our metadata findings (Supplementary Information C.1.1). We identify a topological hole specifically circumscribed by nail pathologies (Fig. 5a). While the boundary contains scattered examples of onychodystrophy and nail psoriasis, its existence indicates a systemic lack of variation in this anatomy. This confirms that the scarcity of nail conditions identified in our metadata audit is not merely a labelling issue, but a fundamental visual gap in the global atlas. By identifying these voids, SkinMap enables targeted data collection by specifying which phenotypes and demographic intersections are missing from current public archives. In the global dermatology data basis, high-priority gaps include nail disorders, pediatric dermatoses, especially in darker skin tones, and low-prevalence ICD blocks that appear only transiently in the public record.
To transform these findings from a static audit into an actionable resource, we developed a web-based digital atlas that enables the community to interact directly with the SkinMap embedding space. This interactive platform serves two primary research purposes: Exploratory comparative analysis of dermatological presentations and strategic steering of data collection initiatives. To support diagnostic workflows, the application allows practitioners to upload cases, which are projected in real time onto the shared latent manifold (Fig. 6a-b). By leveraging the unified collection of 1.1 million images, the system retrieves and displays the most semantically similar cases along with their ground-truth diagnoses, also allowing for dynamic filtering of attributes such as body region or FST. This capability effectively provides clinicians with a global reference standard, moving beyond the limitations of local institutional archives.
To validate the clinical utility of this digital atlas, we benchmarked retrieval performance using two hold-out datasets, DDI and PAD-UFES-20, measuring precision and recall across both same-dataset and cross-dataset (atlas-wide) settings (Fig. 6c-e).
Our results indicate that same-dataset retrieval remains a relatively effective baseline, even in the highly challenging, long-tailed disease distributions characteristic of the DDI dataset. However, the performance is fundamentally constrained by the limited sample volume of rare pathologies within single institutions. By expanding the search to the complete SkinMap atlas, we observe a substantial performance boost due to the system’s ability to find semantically similar “neighbors” across the exhaustive 1.1 million-image collection (Fig. 6e). For the DDI dataset, average precision (at k = 10) increases from 0.23 in the same-dataset setting to 0.94 using the full atlas. Consequently, these findings advocate for a paradigm shift from volume-centric accumulation to strategic, precision data acquisition. SkinMap offers the infrastructure to operationalize this shift, serving as a mechanism to assess the marginal utility of potential data collections before resources are committed to annotation. By projecting new cohorts into a shared space, the community can distinguish between redundant contributions and high-priority samples that fill in topological voids. This metricdriven approach ensures that future infrastructure partnerships prioritize addressing structural gaps in the data landscape, thereby aligning the digital representation of dermatology with the diversity of real-world clinical practice. We hope that SkinMap will be a catalyst for a collaborative effort to maintain a comprehensive collection of digital skin datasets, thus accelerating dermatology in both clinics and research institutions. In practical terms, the atlas suggests a number of actionable acquisition directions: Expand geographically through infrastructure partnerships in underrepresented regions, build pediatric datasets under strengthened consent and privacy protections, increase coverage of underrepresented anatomical sites such as nails, and prioritize sustained acquisition of rare and non-neoplasm diagnostic categories to prevent “orphan” conditions from disappearing from the public record. These directions operationalize dataset innovation as measurable expansion of clinical coverage rather than continued densification of already-saturated clusters.
We built a global atlas of public dermatology imaging by (i) aggregating and harmonizing 29 datasets into a single corpus, (ii) converting standardized structured metadata into consistent image-text pairs, (iii) constructing the SkinMap embedding space via an ensemble of multi-modal and self-supervised encoders, (iv) imputing missing demographic and anatomical attributes using linear probes on frozen embeddings, and (v)
auditing the resulting landscape with complementary metrics (i.e., temporal novelty, dataset similarity, density, and topology analyses).
We conducted a comprehensive review and aggregation of the global public derma-
To harmonize heterogeneous datasets into a single analyzable entity, we constructed the SkinMap embedding space using an ensemble learning approach that captures both high-level semantic concepts and low-level visual textures. All images were embedded using a standardized preprocessing pipeline, fixed input resolution, and normalization consistent with each encoder. The same pipeline was used for all analyses reported in this study. We first trained multiple multi-modal models from scratch on curated image-text pairs using different objectives, such as CLIP 38
Given the sparsity of metadata in public collections, we used an imputation framework to estimate missing demographic labels. We trained a suite of linear probes on the frozen SkinMap embedding space using the subset of samples with ground-truth annotations. Separate probes were trained to predict each type of metadata to be recovered, namely origin, FST, age, gender, and anatomical region. This could be extended to other partially available information. Each probe was implemented as a linear model trained on top of the frozen embedding using scikit-learn 44 . We used LogisticRegression for categorical targets and Ridge regression for continuous targets. We validated the performance of the imputation engine on both an evaluation set and two external, distinct datasets (DDI and PAD-UFES-20) that were purposely excluded during pretraining. Model performance was quantified using standard metrics for each attribute (e.g., macro-F1 for categorical labels and R 2 for continuous targets), and uncertainty was assessed via bootstrap confidence intervals. Detailed performance comparison, including the evaluation of each model in the ensemble, is given in the Supplementary Table 4 and 5.
To assess diminishing returns in data acquisition, we defined a yearly novelty metric based on latent-space density. For each sample released in a given year, we computed the mean cosine distance to its k-nearest neighbors in the historical pool (all samples released in prior years). To distinguish genuine informational gain from increasing dataset density, we constructed a null hypothesis using bootstrap resampling. For each year, we generated a baseline distribution by randomly resampling points from the historical pool, matching the size of the new release, and computing their novelty scores. Observed novelty scores that converged toward this random baseline provided signal for saturation, indicating that new data releases were structurally redundant with existing archives.
Let {z i } N i=1 ⊂ R d×N denote the samples’ embeddings and y i ∈ Z the associated release year. We first ℓ 2 -normalized every embedding ẑi = z i /∥z i ∥ 2 , so cosine similarity between any two embeddings matched their inner product. For a fixed calendar year t, we defined the index sets
corresponding to current-year samples I t and the historical pool P t , respectively. For each sample i ∈ I t , we computed cosine similarities to P t , took the k nearest neighbors, and converted them to distances,
where π i,ℓ indexes the ℓ-th neighbor of i found via a cosine-similarity search. Averaging the k distances gave a per-sample novelty score
and the raw yearly novelty was defined as the mean over all current-year samples,
To disentangle true informational novelty from statistical artifacts of increasing pool sizes, we constructed a null hypothesis via bootstrap resampling. For each year t, t . We then computed their k-nearest neighbor distances within P t (excluding self-matches), yielding a baseline novelty score
where dj is computed analogously to the observed case but with one additional neighbor to exclude the trivial self-match. The empirical distribution {ν
the expected novelty under the null hypothesis that new samples are merely redrawn from previous years. We summarize this via the mean
and construct confidence intervals using the α/2 and 1 -α/2 quantiles (here α = 0.05 for 95% CI). The ratio ν t /ν
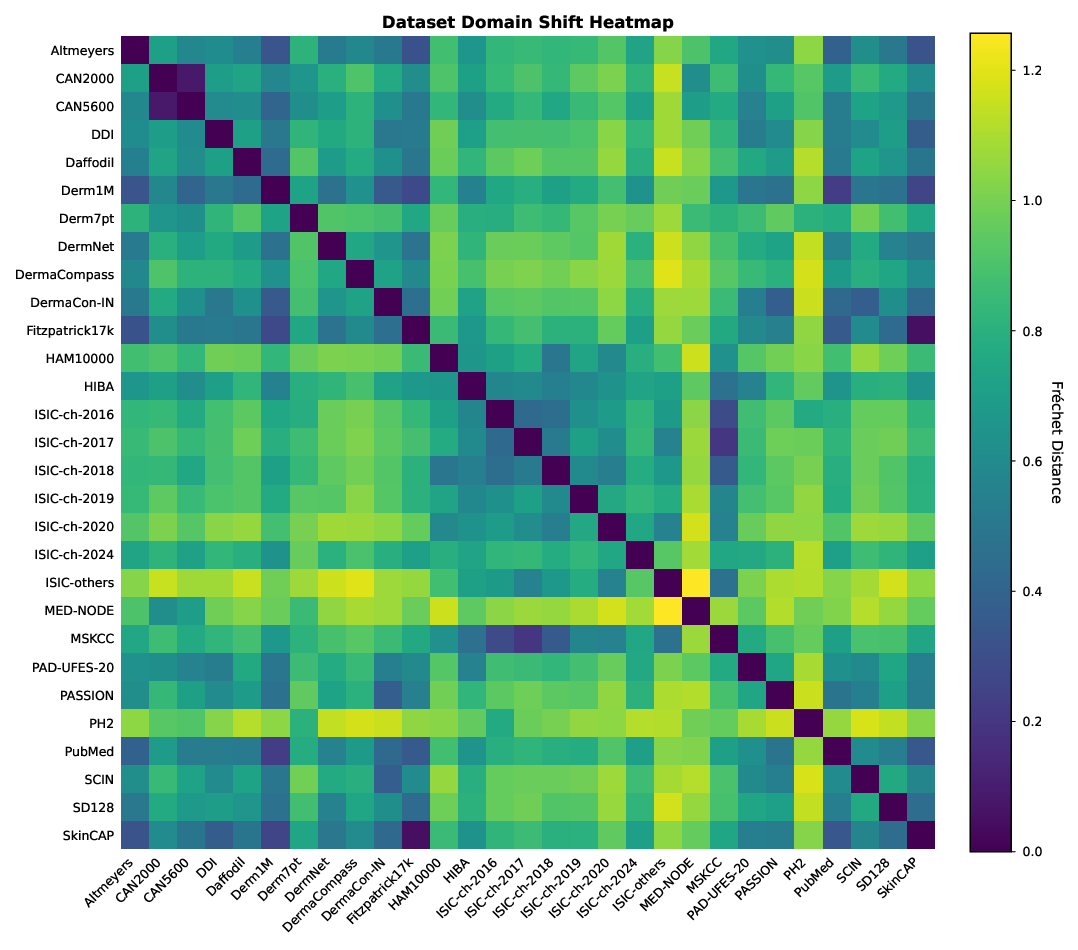
We quantified the similarity between distinct datasets using the Fréchet distance (FD) to assess shifts in means and covariances of their distributions. For each dataset, we modeled its distribution in the SkinMap latent space as a multivariate Gaussian distribution with empirical mean and covariance. Specifically, pairwise Fréchet distance (FD) was computed across all 29 collections. Pairs exhibiting low FD (approaching zero) were identified as homologous, indicating that they occupy nearly identical latent manifolds and likely represent subsets or re-releases of the same data lineage.
Conversely, we defined the uniqueness of a dataset as the average FD of a collection relative to all others. This metric was used to identify high-value outliers that contribute significant distributional variance to the global atlas.
For each dataset a, we considered the normalized embeddings belonging to that dataset, {ẑ i : i ∈ D a }. We approximated the distribution with its empirical first and second moments:
Given any two datasets a and b, we summarized their distributional discrepancy with the Fréchet distance between the corresponding Gaussians 45 ,
This scalar captures both location shift (difference in means) and shape shift (covariance mismatch) between datasets under the assumed Gaussian approximation.
To identify regions of redundancy and data quality failures within the landscape, we modeled the embedding space density using a Gaussian mixture model. We defined operational thresholds at the 97.5th and 2.5th percentiles of log-density to partition the landscape into regions of hypersaturation and sparsity. High-density regions were analyzed to identify overrepresented visual concepts, while low-density regions were inspected to detect outliers, artifacts, and underrepresented clinical phenotypes.
To identify underrepresented regions (or holes) in the embedding space, we employ a topological data analysis approach based on the spectral persistent homology method recently developed by Damrich et al. 33 . Traditional persistent homology methods fail in high-dimensional spaces with noise because ambient Euclidean distances become uninformative. Damrich et al. 33 demonstrated that this limitation can be overcome by computing persistent homology on a filtered simplicial complex constructed from effective resistance distances on the data manifold, which remain robust to highdimensional noise by capturing the intrinsic geometry of the data. We apply their method to the SkinMap embedding space to identify topological voids corresponding to underrepresented patient subgroups.
Effective resistance distance on k-nearest neighbor graphs. Let Z = {z i } N i=1 ⊂ R d denote the set of embedding vectors in the d-dimensional latent space.
We construct a k-nearest neighbor graph G = (V, E) where vertices V correspond to all data points and edges connect each point to its k nearest neighbors.
The graph is symmetrized by including edge (i, j) if j is among the k nearest neighbors of i or i is among the k nearest neighbors of j. Let A ∈ {0, 1} N ×N denote the resulting adjacency matrix. We define the degree matrix D = diag(d 1 , . . . , d N )
where d i = j A ij and construct the graph Laplacian:
The effective resistance distance 46 between vertices i and j is defined through the pseudoinverse of the Laplacian. Let L † denote the Moore-Penrose pseudoinverse of L, computed via eigendecomposition with regularization to handle the zero eigenvalue corresponding to the constant eigenvector. The effective resistance distance is given by:
As noted by Hein et al. 47 , this naive formulation exhibits undesirable scaling properties in large graphs, where distances converge to approximately 1/d i +1/d j independent of graph structure. Following Damrich et al. 33 , we apply the von Luxburg degree correction 47 , yielding the corrected effective resistance:
The corrected distance deff ij captures the intrinsic manifold geometry by measuring the “difficulty” of random walks between vertices, remaining stable in the presence of high-dimensional noise 33 . The resulting distance matrix D eff = [ deff ij ] serves as input to the persistent homology computation.
Persistent homology and hole detection. Given the distance matrix D eff , we construct a Vietoris-Rips filtration 48 . A k-simplex σ = {v i0 , . . . , v i k } is included in the complex at filtration parameter τ if and only if the maximum pairwise effective resistance distance among its vertices satisfies: max ℓ,m∈{0,…,k}
As τ increases from 0 to ∞, simplices are added to the complex, forming a nested sequence of simplicial complexes (the filtration). We compute the persistent homology of this filtration using the Ripser algorithm 49 , which efficiently extracts topological features across all scales.
A hole in the embedding space corresponds to a 1-dimensional homology class (denoted H 1 ) 48 . Each such class persists over a filtration interval [τ birth , τ death ], where τ birth is the scale at which a loop first appears and τ death is the scale at which it is filled. The persistence of the feature is defined as:
Features with high persistence represent topologically significant structures, while low-persistence features typically correspond to noise 48 . We rank all detected H 1 features by their persistence values and select the top k holes for further analysis, where k is determined based on the dataset characteristics and the desired granularity of the gap analysis.
Cocycle extraction and hole characterization. For each persistent H 1 feature, we extract its cocycle representation 49 : The set of edges (vertex pairs) that comprise the 1-cycle defining the hole.
cocycle for the k-th hole. The unique vertices involved in this cocycle are:
These vertices represent the data points forming the boundary of the hole. To enable clinical interpretation and prioritization of detected gaps, we characterize each hole by:
• Hole center. The mean position in latent space of all vertices in the cocycle:
• Hole size. The cardinality of the cocycle’s vertex set: s k = |V k |, representing the number of data points forming the hole.
• Hole volume. We estimate the volume occupied by the hole in latent space by computing the empirical covariance of the cocycle vertices and modeling it as a d-dimensional hypersphere. Let:
denote the characteristic radius. The hole volume is approximated as:
where Γ is the gamma function.
• Boundary points. To characterize the data surrounding each hole, we extract boundary samples by finding, for each vertex i ∈ V k , its k b nearest neighbors in the full dataset Z. We filter these neighbors by distance, retaining only those within:
where d i ′ ,k b is the distance to the k b -th nearest neighbor of vertex i ′ and α is a radius scale factor (here α = 1.5). The union of these boundary points provides representative samples near the hole for qualitative inspection.
• Materials availability: Resources associated with SkinMap (including derived artifacts such as the embedding space and metadata harmonization resources, where redistribution is permitted) will be released under an open-source license and made publicly available upon publication.
• Code availability: The source code for the SkinMap framework, including inference scripts, pretrained model weights, and the projection head parameters used to generate the embedding space, will be made available upon publication. The interactive digital atlas will be accessible upon publication.
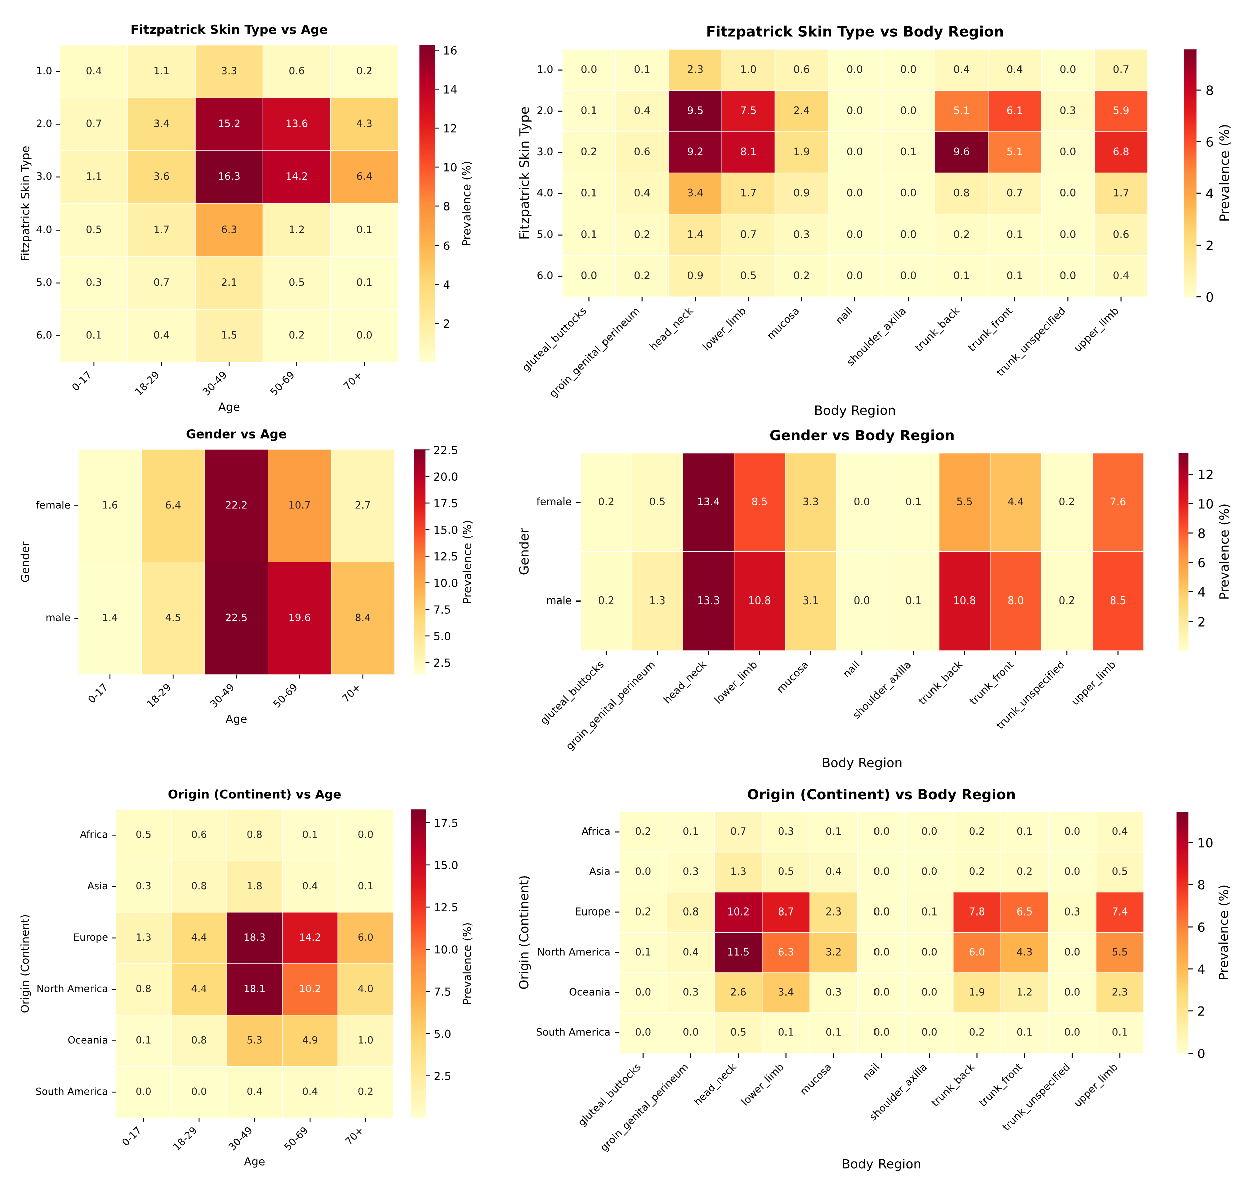
While the univariate analysis presented in the main text exposes severe imbalances, such as the restriction of FST V-VI to only 5.8% of the archive and pediatric patients to 3.0%, these aggregate statistics potentially mask even deeper intersectional voids.
To investigate the availability of data for specific patient subgroups, we analyzed the joint distributions of imputed metadata attributes (Supplementary Fig. 3). This intersectional audit reveals that the global archive is not merely skewed, but highly concentrated around a specific “standard” patient profile. As illustrated in the FST vs. age and gender vs. age heatmaps, the vast majority of the 1.1 million samples are clustered in a narrow demographic window: Patients aged 30-70 with FST II-III. This region of hypersaturation suggests that model performance reported in current literature is heavily weighted toward this specific demographic intersection. Conversely, the analysis highlights “dark corners” of the latent space where data support collapses entirely. Most critically, the intersection of age and skin tone reveals a compounded exclusion of pediatric populations with darker skin tones. While pediatric data is scarce overall, the bin representing pediatric patients (0-17 years) with FST V-VI is effectively empty. This implies that current foundation models possess virtually no ground-truth visual signals for common childhood dermatoses on darker skin, rendering them potentially unsafe for this vulnerable subgroup. Furthermore, the origin (continent) vs. age analysis underscores the geographical homogeneity of the data.
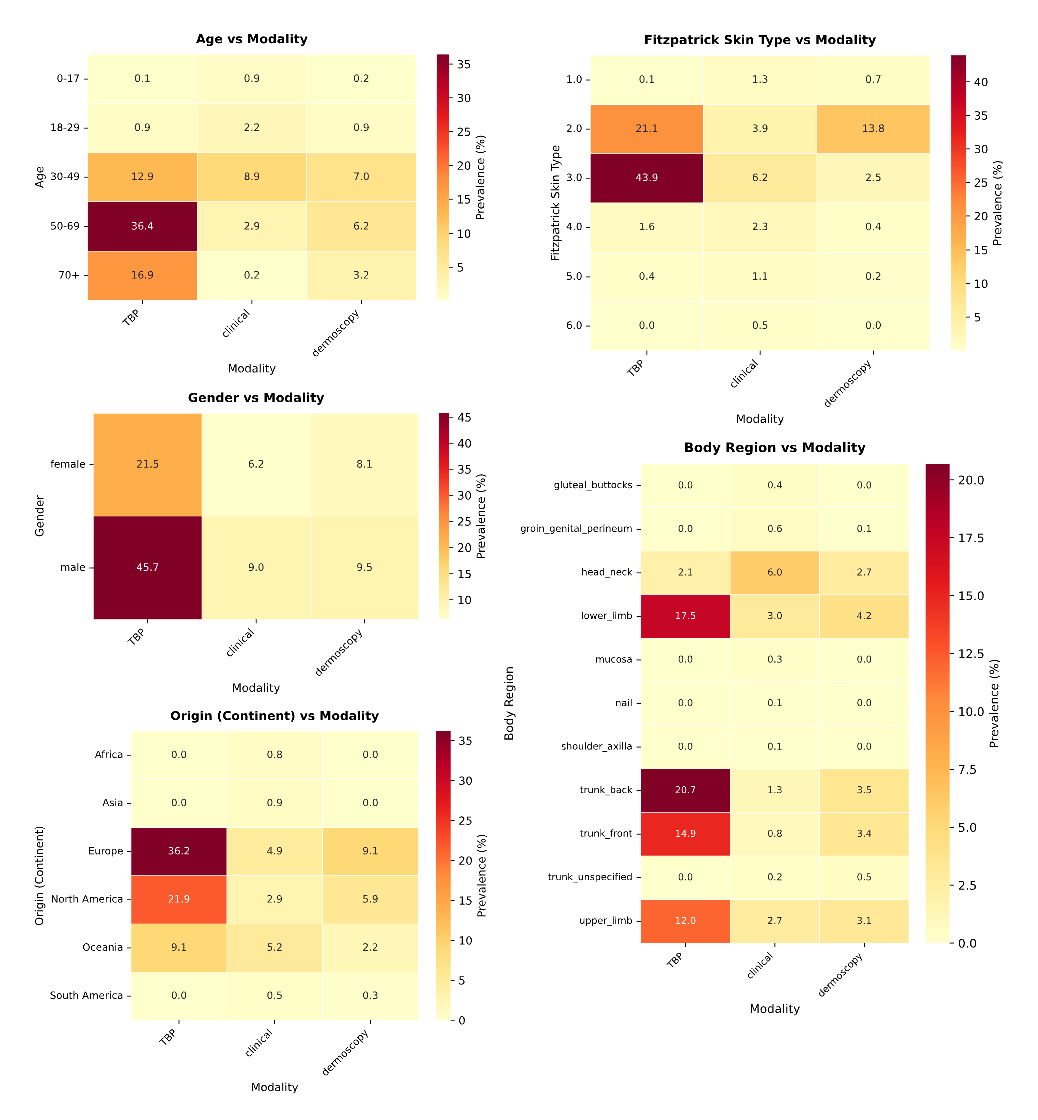
Even when diversity in age or body region is present, it is almost exclusively derived from datasets originating from the Global North (specifically Europe and North America). The distinct lack of samples from the Global South (Africa and South America) across all body regions suggests that environmental and genetic variations specific to these populations are absent from the training dataset. Ultimately, these intersectional voids define the strict operational limits of the current Digital Atlas. Outside the saturated center of Western, middle-aged, fair-skinned patients, the reliability of diagnostic sition further compounds these structural exclusions (Supplementary Fig. 4). While the recent expansion of the atlas has been driven by the introduction of TBP, the intersectional analysis reveals that this modality is almost exclusively restricted to adult, fair-skinned populations (FST II-III) within Europe and North America. Specifically, TBP shows negligible coverage of pediatric patients and individuals with darker skin tones (FST V-VI), whereas it is heavily concentrated on the trunk and lower limbs.
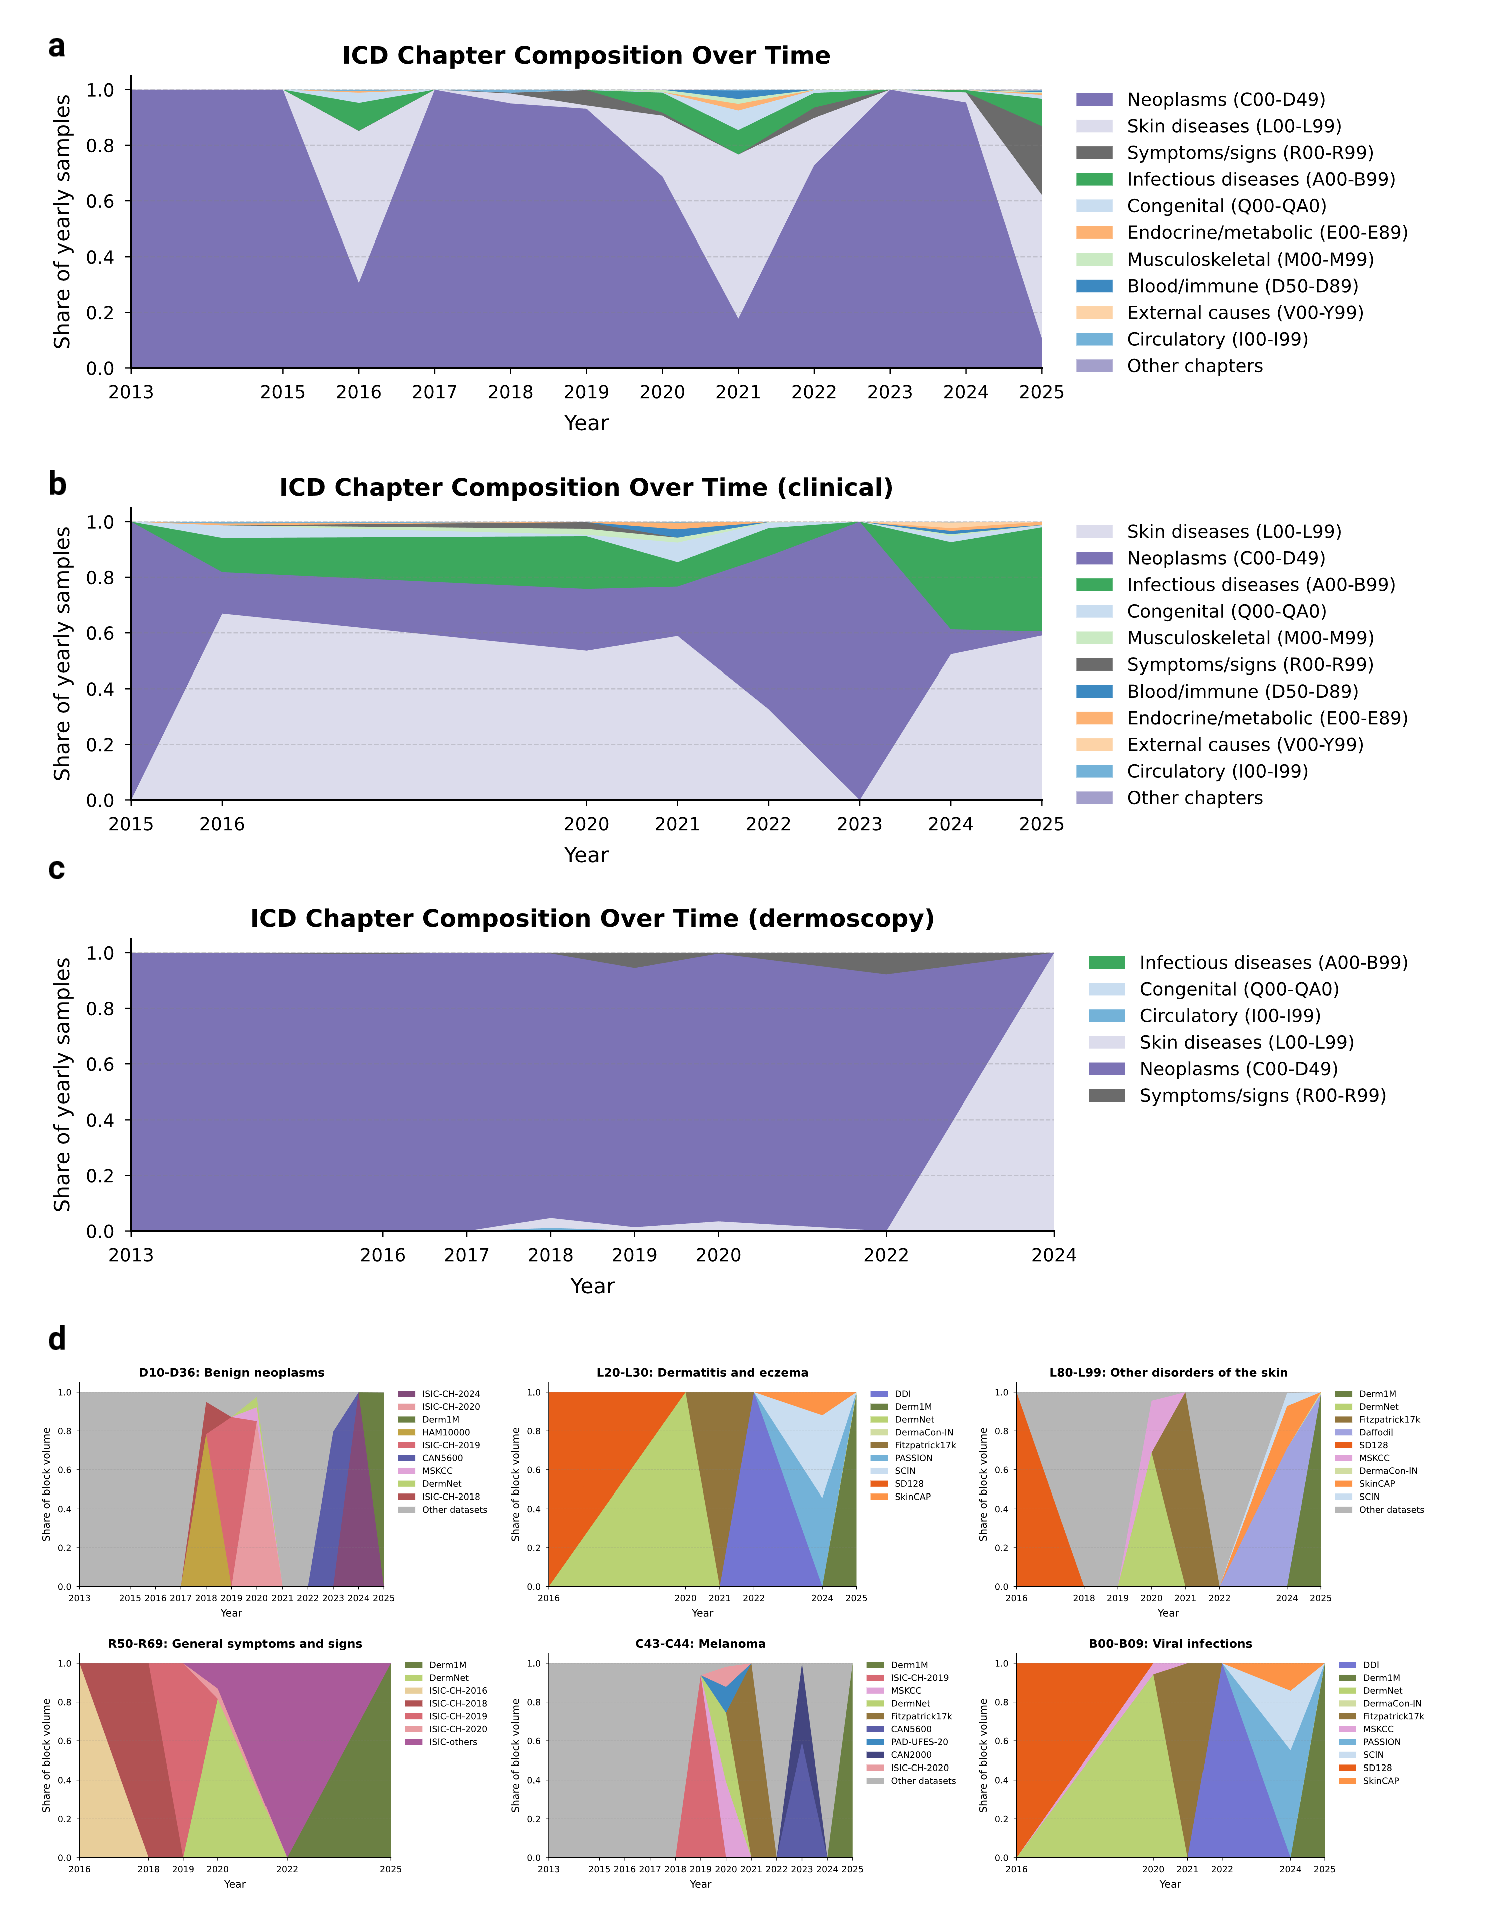
To investigate the drivers behind the diminishing novelty observed in recent years, we analyzed the temporal evolution of disease categories and their specific data sources. Supplementary Fig. 5a-c illustrates a heavy and persistent skew toward neoplasms (C00-D49), particularly in the most recent acquisition phase (2022-2025), where this category dominates the vast majority of yearly samples. While earlier years display transient spikes in diversity, likely driven by specific releases containing symptoms/signs (R00-R69) or skin diseases (L00-L99), the overall trend demonstrates a consolidation around well-represented pathologies. Supplementary Fig. 5d further granularizes this by mapping the provenance of specific diagnostic blocks, revealing that the availability of these categories is often contingent on isolated dataset release events rather than continuous collection. We observe that high-volume categories such as benign neoplasms (D10-D36) and melanoma (C43-C44) are heavily dictated by the sequential release of ISIC challenges and the Derm1M archive. This dependency highlights a fragility in the global data landscape, where the representation of entire disease categories rests on single sources rather than a robust, diverse network of data collectors.
Beyond the broad saturation of common neoplasms, our analysis uncovers a phenomenon of “orphan” diagnostic categories, i.e., pathologies that exhibit a transient presence in the global archive before vanishing from subsequent data collection efforts.
As detailed in Supplementary Table 7, this pattern effectively represents lost knowledge, where specific diseases appear during a single release event (often linked to a specific dataset such as PAD-UFES-20 or disparate ISIC challenges) but are not sustained in longitudinal acquisition. This discontinuity is most visible in infectious and inflammatory categories, which stand in stark contrast to the persistent accumulation of melanoma and nevi. For instance, unspecified viral infections (B09) and sexually transmitted diseases (A64) appeared as cohorts in 2020 (n = 1, 308 and n = 436, respectively) but have seen no replenishment in the years since. Similarly, niche inflammatory conditions such as allergic contact dermatitis due to plants (L23.7) were captured in a single 2020 interval. The existence of these orphans underscores the structural fragility of the current data landscape: In the absence of strategic, sustained surveillance pipelines, the field remains dependent on episodic, uncoordinated releases that fail to provide the continuous representation necessary for robust model generalization.
To ensure that the analysis based on skin tones is not confounded by overestimation of the types, we provide confusion matrices in Supplementary Fig. 6 for the FST prediction on hold-out datasets, i.e., DDI, PAD-UFES-20, and the hold-out test set for the full collection. Results show that, across datasets, mispredictions mostly occur when confusing boundary types, i.e., types that are similar to each other, such as FST V-VI, and less often when confusing higher types for lower ones. This provides evidence that, although there are mispredictions, they often occur near the ground truth, indicating that the estimates reflect the underlying distributions.
To provide a comprehensive map of the relationships among the 29 aggregated datasets, we computed the pairwise FD between all collection pairs and visualized the results as a heatmap in Supplementary Fig. 7. This quantitative analysis reveals significant distributional homologies that challenge the assumption of dataset independence. We observe a distinct ISIC cluster in which annual challenges (2016-2020) and institutional archives such as MSKCC exhibit minimal pairwise distances, reflecting their shared lineage and patient populations. Furthermore, the analysis statistically confirms suspected subset relationships. The vanishingly small FD between Fitzpatrick17k and SkinCAP confirms that the latter functions as a subset of the former, while similar homologies link CAN2000 and CAN5600. Conversely, datasets such as PH2 and MED-NODE emerge as distributional outliers, with high average distances to the rest of the field, thereby identifying them as unique sources of variance and critical benchmarks for evaluating model robustness to genuine domain shifts.
To generate concise captions suitable for multi-modal model training (maximum 77 tokens), we employed an open-source LLM to compress the template image descriptions while maintaining medical accuracy. We used the Qwen2.5-7B-Instruct model 37 with the following configuration: Temperature = 0.3, maximum new tokens = 100, top-p sampling = 0.9, running inference in float16 precision on CUDA-enabled hardware. The compression task was structured using a two-component prompt template.
The system prompt established the task requirements and quality criteria: • SD-128 15 (5,619 images): Clinical skin disease classification benchmark derived from the DermQuest online atlas, comprising 128 disease categories.
• SkinCAP 16 (4,000 images): Mixed-modality dataset combining clinical photography and close-range imaging.
• PAD-UFES-20 17 (2,298 images): Brazilian smartphone-captured lesion dataset from Federal University of Espírito Santo, representing real-world telemedicine imaging conditions.
expanding the data foundations upon which the next generation of medical AI will be built. To support these research efforts, we release the complete SkinMap framework, including digital atlas and the model ensemble, under an open-source license.
Similarly, PAD-UFES-20 retrieval precision improves from 0.68 to 0.83. This capability provides clinicians with a global reference standard, effectively bridging local data gaps by leveraging the collective informational density of the entire dermatological landscape. novelty of new data contributions, have remained unquantified. By unifying over 1.1 million fragmented images into a queryable semantic atlas, this study provides a quantitative audit of the open data foundations of modern dermatological AI systems. The findings expose a systemic divergence between the “digital population” used for model training and the global human population. Specifically, the representation of FST V and VI is restricted to 5.8% of the global dermatology collection, and pediatric data comprises only 3.0%. Rather than a simple lack of samples, these statistics indicate a structural exclusion where models are developed on a demographic distribution that is heavily skewed toward Western, middle-aged, and lightly pigmented populations.This geographic concentration, primarily in the Global North, suggests that without targeted intervention, algorithmic performance will likely not generalize to the populations bearing a significant portion of the global disease burden. Crucially, the temporal analysis challenges the prevailing assumption that dataset scale alone drives progress.
Similarly, PAD-UFES-20 retrieval precision improves from 0.68 to 0.83. This capability provides clinicians with a global reference standard, effectively bridging local data gaps by leveraging the collective informational density of the entire dermatological landscape. novelty of new data contributions, have remained unquantified. By unifying over 1.1 million fragmented images into a queryable semantic atlas, this study provides a quantitative audit of the open data foundations of modern dermatological AI systems. The findings expose a systemic divergence between the “digital population” used for model training and the global human population. Specifically, the representation of FST V and VI is restricted to 5.8% of the global dermatology collection, and pediatric data comprises only 3.0%. Rather than a simple lack of samples, these statistics indicate a structural exclusion where models are developed on a demographic distribution that is heavily skewed toward Western, middle-aged, and lightly pigmented populations.
This content is AI-processed based on open access ArXiv data.