Who Judges the Judge? LLM Jury-on-Demand: Building Trustworthy LLM Evaluation Systems
📝 Original Info
- Title: Who Judges the Judge? LLM Jury-on-Demand: Building Trustworthy LLM Evaluation Systems
- ArXiv ID: 2512.01786
- Date: 2025-12-01
- Authors: Xiaochuan Li, Ke Wang, Girija Gouda, Shubham Choudhary, Yaqun Wang, Linwei Hu, Joel Vaughan, Freddy Lecue
📝 Abstract
As Large Language Models (LLMs) become integrated into high-stakes domains, there is a growing need for evaluation methods that are both scalable for real-time deployment and reliable for critical decision-making. While human evaluation is reliable, it is slow and costly. Single LLM judges are biased, and static juries lack adaptability. To overcome these limitations, we propose LLM Jury-on-Demand -a dynamic, learningbased framework for scalable and context-aware evaluation. Our method trains a set of reliability predictors to assess when LLM judges will agree with human experts, leveraging token distributions, embeddings, and structural input features. This enables a fully adaptive evaluation where, for each data point, an optimal jury of the most reliable judges is dynamically selected and their scores are aggregated using their reliability as weights. Experiments on summarization and RAG benchmarks show that our dynamic jury system achieves significantly higher correlation with human judgment than both single-judge and static-jury baselines. These results highlight the promise of adaptive, learning-based juries for building scalable, more reliable and trustworthy evaluation systems for modern LLMs in high-stakes domains. 1📄 Full Content
To address this evaluation gap, researchers have increasingly adopted the LLM-as-a-Judge paradigm, which leverages powerful language models like GPT-4 to serve as scalable, automated evaluators (Zheng et al., 2023;Li et al., 2024b;Gu et al., 2024). While promising, this approach introduces a critical trade-off where the scalability of a single LLM judge comes at the cost of reliability. The papers Schroeder & Wood-Doughty (2024), Li et al. (2024a) and Baumann et al. (2025) contain substantial evidence showing that single judges can be prone to systematic biases and inconsistencies, limiting their trustworthiness. A logical evolution has been to employ a “jury” of multiple LLMs to improve robustness (Feng et al., 2025;Verga et al., 2024). However, these jury systems typically rely on static aggregation methods, such as simple averaging. This fails to address a more fundamental issue, as a judge’s expertise is context-dependent and its reliability can change dramatically based on the text being evaluated. This leaves a critical gap for a truly adaptive evaluation system.
In this paper, we introduce LLM Jury-on-Demand, a novel framework that bridges this gap by creating a dynamic, learning-based evaluation system. Our work moves beyond static juries by training a system to predict the reliability of each potential judge based on a rich set of features extracted from the text. This allows our framework to perform a fully adaptive evaluation where, for each data point, an optimal jury of the most reliable judges is dynamically selected, and their scores are aggregated using their reliability as weights. Our main contributions are threefold:
• A new framework for adaptive LLM evaluation that demonstrates superior correlation with human judgment compared to single-judge and static-jury baselines.
• A method to predict LLM judge reliability at the instance level using text-based features.
• Extensive experiments and analyses across multiple tasks and datasets to validate the effectiveness of the proposed approach.
The evaluation of large language models is a rapidly evolving field, as captured in recent surveys mapping the transition from static benchmarks to more dynamic and automated evaluation frameworks (Cao et al., 2025). Our work builds upon three key research areas: the LLM-as-a-Judge paradigm, the evolution from single judges to multi-model juries, and the broader concept of LLM performance prediction.
The LLM-as-a-Judge approach has become a scalable alternative to human annotation (Zheng et al., 2023), with surveys documenting its widespread application and promising correlation with human preferences (Li et al., 2024b;Gu et al., 2024). However, this paradigm has significant limitations. LLM judges exhibit biases, such as a preference for longer answers and sensitivity to the order in which responses are presented (Schroeder & Wood-Doughty, 2024), and their judgments can be skewed by their own intrinsic style or pre-training data, which compromises the fairness and reliability of the evaluation (Li et al., 2024a). These challenges motivate the need for more robust frameworks that can mitigate the inherent biases of a single judge.
To address these limitations, a growing body of work has explored using a “jury” of multiple LLMs, based on the insight that collaboration among diverse models can lead to more stable and reliable assessments (Feng et al., 2025). Initial work shows that simple ensembles, such as averaging the scores from a panel of smaller models, can outperform a single, larger model at a lower cost (Verga et al., 2024;Rahmani et al., 2024). More advanced methods have explored multi-agent frameworks where judges engage in peer-review or debatelike discussions to arrive at a consensus (Chu et al., 2024;Zhao et al., 2024). While a significant step forward, they typically rely on either static aggregation methods like simple voting or averaging or require complex and often unscalable conversational interactions. They do not account for the fact that a judge’s expertise varies across different contexts, leaving a critical gap for systems that can adapt the jury’s composition and weight to the specific context of the text being evaluated.
Our work is also grounded in LLM performance prediction. Studies have shown that it is possible to train a model to predict an LLM’s performance on a given task by using features derived from the model and the task itself (Ye et al., 2023). Some approaches have even trained “assessor” models to predict when another model is likely to answer a question correctly, a concept that parallels our goal of predicting reliability (Schellaert et al., 2025). While these works validate the fundamental premise that LLM performance has learnable patterns, they typically focus on predicting general, task-level success rather than the instance-level reliability of an LLM acting as an evaluator. Our framework innovates by applying this concept to jury-based evaluation, enabling the dynamic selection and weighting of judges on a per-instance basis.
In this section, we detail the architecture and components of LLM Jury-on-Demand framework. Our framework is designed to produce more reliable automated evaluations by shifting from a static to a dynamic, learning-based process. The central hypothesis of our work is that an LLM judge’s reliability is not fixed, but varies based on the specific characteristics of the text it evaluates. Our system models this variance by learning to predict when each judge is likely to agree with human experts.
The LLM Jury-on-Demand framework operates through a multi-stage pipeline, as shown in Fig. 1. The process begins with a set of input texts related to the evaluation task. Crucially, the set of texts we analyze depends on the task itself. For summarization tasks, the system analyzes both the original source text and the model-generated output summary. For Retrieval-Augmented Generation (RAG) tasks, it analyzes the source text, the retrieved context, and the final generated answer. This context-rich approach allows the system to capture a more complete picture of the evaluation challenge.
Figure 1: Overview of the LLM Jury-on-Demand inference pipeline. The system extracts features from input texts to predict judge reliability, dynamically assembles a jury of the top K most reliable judges for each instance, and calculates a final weighted score.
These texts are first processed by a feature extraction module, which extracts a wide range of textual and semantic signals. The resulting feature vector for each instance serves as input to a suite of pre-trained reliability prediction models. In the final stage, the system leverages these reliability predictions to perform a fully adaptive, per-instance evaluation. For each data point, a jury of a pre-tuned size K is dynamically assembled by selecting the judges with the highest predicted reliability for that specific instance. The final score is then computed as a weighted average of these selected judges’ raw scores, using their reliability predictions as the weights.
The foundation of our system is its ability to represent the evaluation context through a rich set of predictive features. We hypothesize that signals related to a text’s size, complexity, and semantic content can reveal the scenarios in which different LLM judges excel or struggle. The features are extracted from all available texts (source, context, and output, as applicable to the task) and concatenated into a single feature vector for each data point. Many of these features are computed using Natural Language Toolkit (NLTK) (Bird et al., 2009). A complete list of features is in the Appendix A. Key feature categories are:
Text Size Features: These include basic structural metrics such as word count, sentence count, paragraph count, and the compression ratio between the source and generated text.
Special Words Features: These count the occurrences of specific word types that can indicate the style or complexity of the text. Examples include counts of difficult words (words that have more than two syllables), named entities and modality verbs (e.g. “could”, “should”) etc.
Text Complexity Features: These quantify readability and ambiguity using established linguistic formulas. Examples include the Flesch reading ease index (Kincaid et al., 1975), lexical diversity (the variety of words used), and other measures of syntactic and semantic ambiguity.
Embedding-Related Features: Embeddings encode text into a dense vector representation (Mikolov et al., 2013;Pennington et al., 2014;Devlin et al., 2019). These capture the semantic meaning and topic of the text. Top 10 PCA components (Jolliffe, 2011) of text embeddings are used as features. Additionally, we compute cosine similarity between each text component’s embedding and a set of predefined topic embeddings (e.g. finance, technology), using these similarity scores as additional topical relevance features.
Our framework learns judge reliability by training a dedicated machine learning model for each specific evaluation context. That is, for each potential judge, for each task (e.g., summarization), and for each evaluation metric (e.g., completeness), we train a distinct model. The purpose of this model is not to predict the evaluation score itself, but rather to predict the probability that the corresponding judge will be reliable on that metric for a given data point.
We frame this as a binary classification task to predict whether a judge’s score will be “good” or “bad”. To generate the ground-truth labels for training, we compare each judge’s score against a gold-standard human expert score. First, we apply min-max normalization to all human and model scores to scale them to a [0, 1] range. A judge’s evaluation is then labeled as “good” (1) if its normalized score falls within a predefined tolerance hyperparameter, τ , of the normalized human score. Otherwise, it is labeled as “bad” (0).
For each classification model, we use XGBoost, a gradient-boosted tree algorithm known for its strong performance on tabular data (Chen & Guestrin, 2016). This approach is grounded in the broader research area of LLM performance prediction, which has shown that model performance can be learned from features (Ye et al., 2023;Schellaert et al., 2025). At inference time, our trained models output a probability score between 0 and 1, which we use as the predicted reliability.
The core of our framework is its ability to assemble an expert jury and use its members’ dynamically weighted opinions to compute a final score. This process, which is applied for each individual data point, involves two key mechanics: a reliability-based jury selection algorithm and an instance-level dynamic weighting scheme.
Jury Selection. For each data point, we first use the suite of pre-trained reliability models (described in Sec. 3.3) to generate a reliability score for each of the N judges in our pool. A jury of a pre-tuned size K is then formed by simply selecting the K judges with the highest predicted reliability scores for that specific instance. This approach allows the jury’s composition to be completely dynamic, adapting to the unique characteristics of each text.
Dynamic Score Aggregation. Once the instance-specific jury is selected, the final evaluation score is calculated as a weighted average of the raw scores from those K jury members. The weights are derived directly from the instancespecific reliability scores, [r 1 , r 2 . . . , r K ]. Specifically, the weight for judge i in the jury is calculated as w i = r i /( K j=1 r j ). This dynamic, per-instance selection and weighting process allows our system to prioritize the opinions of the most trustworthy judges for any given text, which stands in contrast to prior systems that rely on static juries and static aggregation methods like simple averaging (Verga et al., 2024).
These two mechanics are the building blocks for our system’s training and inference pipelines.
Our framework involves a one-time training and tuning phase to establish an optimal configuration, which is then used in a repeatable inference pipeline to evaluate new data points.
Training and Hyperparameter Tuning. The goal of the training phase is to find the optimal hyperparameters that will generalize best. This involves finding the single best jury size K and the optimal tolerance level τ for each individual judge’s reliability model. To do this, we first train a large pool of reliability predictor models on our training data, covering all possible combinations of judges and tolerance values. We then conduct a search over the hyperparameter space of possible jury sizes (K) and per-judge tolerance configurations. Each configuration is evaluated on a held-out validation set. For every data point in the validation set, we apply the Jury Selection and Dynamic Score Aggregation mechanics described in Sec. 3.4. The configuration that yields the highest Kendall’s Tau correlation with human scores across the validation set is selected as the optimal configuration for the final system.
Inference Pipeline. With the optimal configuration locked in (i.e., a fixed K and a set of optimal reliability models), the system is ready to evaluate a new, unseen data point. For a new instance, the system first uses the optimal reliability models to predict an instance-specific reliability score for every potential judge in the pool. It then applies the Jury Selection and Dynamic Score Aggregation mechanisms to select the top K judges and compute the final, weighted score.
To validate the effectiveness of our LLM Jury-on-Demand framework, we conducted a series of experiments designed to measure its performance against standard evaluation methods. This section details the datasets, evaluation protocol, and implementation specifics of our experiments.
Our evaluation spans two challenging natural language generation tasks: summarization and retrieval-augmented generation (RAG). For each task, we focus on evaluating three core metrics: groundedness, relevance, and completeness. These metrics are essential for assessing the quality and trustworthiness of generated text. Detailed definitions for each metric are provided in Appendix B.
To train our jury framework, we chose datasets with human annotations for these dimensions. We reviewed a diverse set of datasets for training, selecting 3-4 datasets per task by metric dimension to ensure coverage across various domains. To prevent any single dataset or any single metrics category from dominating a particular evaluation task, we applied stratified down-sampling where necessary. The details are provided in Appendix C.
Our experimental protocol is designed to ensure a fair and rigorous comparison between our proposed system and relevant baselines.
Evaluation Metric. The primary metric for our experiments is the Kendall’s Tau correlation coefficient (KENDALL, 1938). This non-parametric statistic measures the ordinal association between two sets of rankings. In our context, it quantifies how well a system’s evaluation scores align with the rankings provided by human experts. A Kendall’s Tau value close to 1 indicates strong agreement with human judgment.
Judge Prompting Protocol. To generate the raw scores for our experiment, each potential judge model was prompted with a carefully structured template. This template includes a system prompt to set the judge’s persona (“You are a helpful, respectful and honest assistant”) and a user prompt that defines the task, the specific metric (e.g., Completeness), and the required scoring format. The scoring scale was adapted to the task: for summarization, all judges were instructed to provide a single integer score from 1 (lowest quality) to 5 (highest quality); for RAG, a scale of 1 (lowest quality) to 3 (highest quality) was used. The full prompt structure is provided in the Appendix D. Additionally, we conducted an ablation study to analyse the effect on the system’s resilience to slight prompt variations as described in the Appendix H.4.
Baselines. To benchmark our system’s performance, we established a judge pool consisting of 10 diverse LLMs. This pool serves as the foundation for all evaluation methods compared in our study and includes the following models: Claude 3.7 SONNET (Cla), Gemini 2.5 Pro (Comanici et al., 2025), Gemini 2.5 Flash, Gemini 2.0 Flash, GPT-OSS-20B (Agarwal et al., 2025), GPT-OSS-120B, Gemma 3-27B-IT (Team et al., 2025), Phi-4-reasoning (Abdin et al., 2025), LLAMA-3.2-3B-Instruct (Grattafiori et al., 2024), andDeepSeek-R1 (Guo et al., 2025). From this pool, we formed two categories of baselines:
- Single-Judge Baselines: The performance of each of the 10 judges when used as a standalone evaluator.
We compare against four distinct static jury formulations to rigorously test the benefits of dynamic selection:
• Static Jury (Average-All): The performance of a non-adaptive, naive jury that uses all 10 judges in the pool. For each data point, the final score for this baseline is the simple average of the raw scores from all 10 judges.
• Static Jury (Average-Top-K): This baseline identifies the Top-K best-performing single judges based on their Kendall’s Tau on the validation set. The final score is the simple average of these Top-K judges. The value of K is tuned on the validation set.
• Static Jury (Weighted-Regression): A regression-based jury using all 10 judges. We train a linear regression model without intercept using human annotation scores as labels and single judge scores as features on the training set.
• Static Jury (Weighted-Tau): A performance-weighted average of all 10 judges. The weights are derived from each judge’s validation Kendall’s Tau, normalized using a softmax function.
This section provides the specific procedures used to configure and train our system for the experiments. First, we prepared the data for each task and metric by combining all relevant source datasets. For example, to evaluate the completeness metric for the summarization task, we aggregated the data from SummEval, TLDR, and UniSumEval into a single, combined dataset. We then performed a global 60-20-20 split on this combined data to create our final training, validation, and holdout test sets, ensuring data from all sources were represented in each split. As described in Sec. 3.3, all human and model scores were then normalized to a [0, 1] range to ensure consistency.
Next, we determined the system’s optimal configuration through a comprehensive hyperparameter tuning process on the combined validation set, as outlined in Sec. 3.5. We defined a search space for three key hyperparameter categories: the jury size K (ranging from 2 to 9), the per-judge tolerance values τ used for training the reliability predictors, and the internal parameters of the XGBoost models. We exclude K = 1 as it reduces the jury to a single judge selector, effectively duplicating the Single-Judge baseline paradigm. We also exclude K = 10 (the full pool), as this configuration represents a static ensemble identical to the Average-All baseline, negating the benefit of dynamic selection. The sets of tolerance values were chosen to reflect the varying scales of the original human annotation scores across the different source datasets. For each candidate configuration, we evaluated its performance by applying the full perinstance jury selection and weighting pipeline (Sec. 3.4) to every data point in the combined validation set. The final optimal configuration was chosen based on which set of hyperparameters yielded the highest Kendall’s Tau correlation on this combined validation set. This finalized configuration was then used for the final, unbiased evaluation on the locked-away test set.
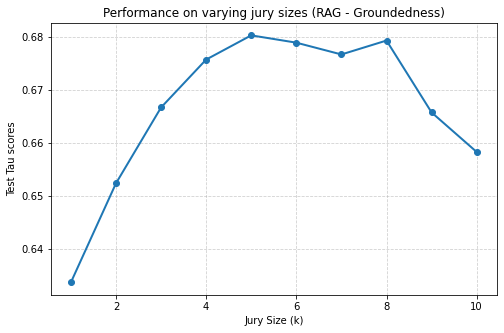
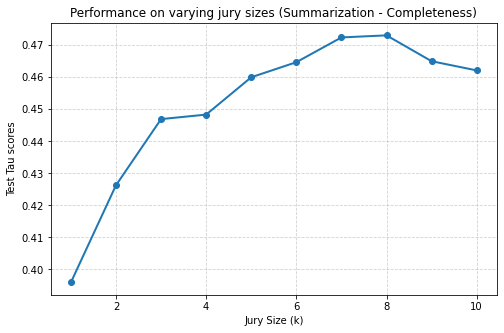
Additionally, to assess robustness beyond validation-based tuning, we conduct ablation studies on jury size (K) and tolerance (τ ), detailed in Appendix H.2 and H.3. Jury size is varied from 1 to 9 across two representative tasks, Summarization-Completeness and RAG-Groundedness, over 10 independent runs. As shown in Fig. 17, performance for both tasks follows a similar pattern: accuracy improves as jury size increases, reaches an optimal range (around K = 5-8), and then declines slightly at very large sizes, indicating diminishing returns beyond the peak.
This section evaluates our LLM Jury-on-Demand framework against the singlejudge and static-jury baselines. To ensure robustness, all experiments were repeated 10 times with different random seeds for data partitioning, and we report the mean and standard deviation of the results. Our analysis presents the main performance, both overall and at a granular dataset-level, followed by a diagnostic analysis of our system’s internal mechanics, including feature importance and judge selection frequency.
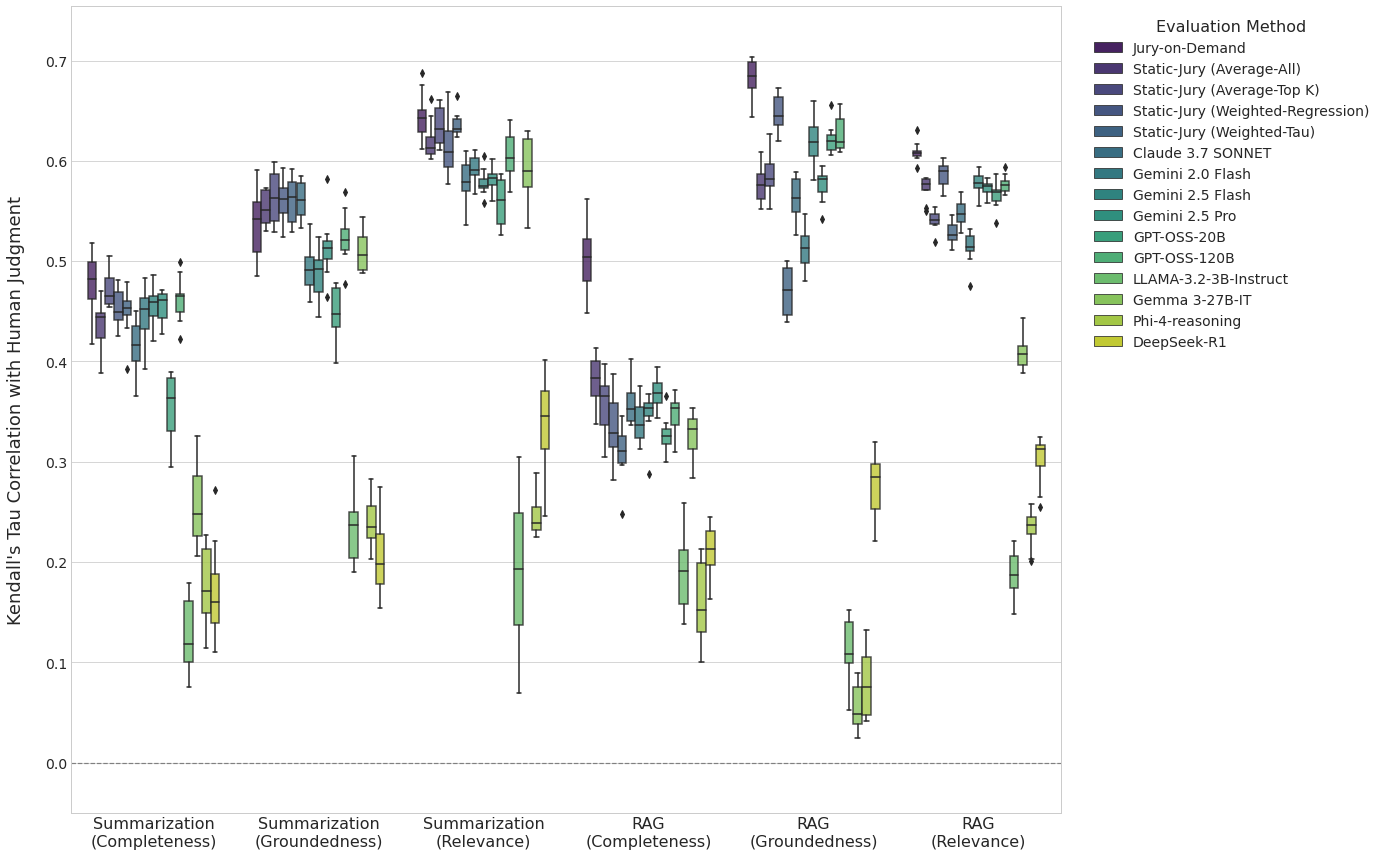
We assess performance by comparing the Kendall’s Tau correlation of each method with human judgment on the test sets for each task-metric combination. The distribution of results from our 10 independent runs is summarized in Fig. 2.
Figure 2: Overall performance comparison over 10 runs. Boxplot of Kendall’s Tau correlation between each evaluation method’s scores and human judgements, aggregated across all datasets for the 6 task-metric combinations. Our Jury-on-Demand system achieves the highest median correlation in nearly all categories and shows the most robust performance.
The results clearly demonstrate that our Jury-on-Demand framework consistently outperforms all baselines across every task and metric. In all six categories, our method achieves the highest mean correlation with human judgment, validating its effectiveness. For instance, in the challenging RAG-Groundedness task, our system achieves a mean Kendall’s Tau of 0.68 (± 0.02). This represents a significant improvement not only over the simple Static Jury (Average-All) (0.58 ± 0.02) but also over the stronger optimized baselines, such as Static Jury (Weighted-Regression) (0.65 ± 0.02) and the strongest single judge for that task, GPT-OSS-120B (0.63 ± 0.02).
To provide a more detailed view of performance, we now analyze the results for the RAG-Completeness task at the individual dataset level. The granular results in Table 1 confirm the findings from the overall analysis: our Jury-on-Demand system outperforms all four static jury baselines and the bestperforming single judge on every individual dataset for this task. The performance lift is particularly pronounced on the ASQA dataset, indicating that our system is robust and its advantages are not an artifact of data aggregation but hold true at a more granular level. The full breakdown of results for all tasks and datasets is available in Appendix E.1. We also report statistical significance and effect sizes. Specifically, we perform one-sided Wilcoxon signed-rank tests (Wilcoxon, 1945) and compute Cliff’s delta (Cliff, 1993), a non-parametric effect size metric that quantifies the difference between two groups. The results are presented in Appendix E.1.
Finally, the results also highlight the inherent unreliability of relying on a single LLM as an evaluator. As shown in Fig. 2, the performance of single judges is highly variable. The “best” single judge changes from one task to another; for example, Claude 3.7 SONNET is often the strongest single judge for Summarization-Groundedness, but it is one of the weakest for Summarization-Completeness. This instability proves that there is no single “best” LLM judge, making a static choice of evaluator a risky and unreliable strategy.
The comparison between our Jury-on-Demand and the various static jury baselines isolates the benefit of our core contribution. While baselines like Static Jury (Weighted-Regression) are competitive, our dynamic system is consistently superior. This demonstrates that the primary performance gain comes not just from using a jury, but from the ability to dynamically select and weight its members based on the context of the input. The stability of this outperformance, demonstrated across 10 runs, underscores the reliability of our dynamic approach.
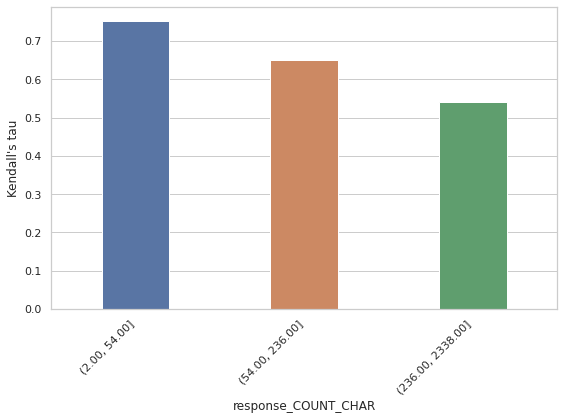
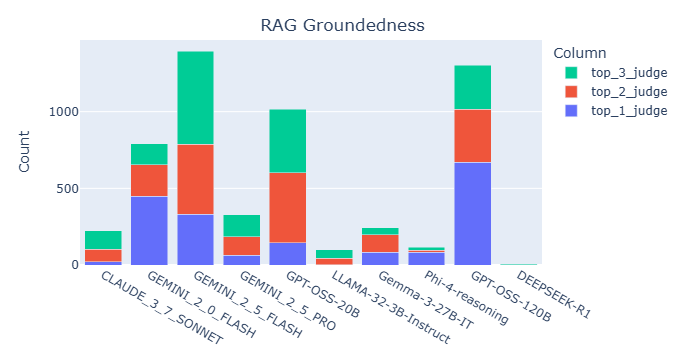
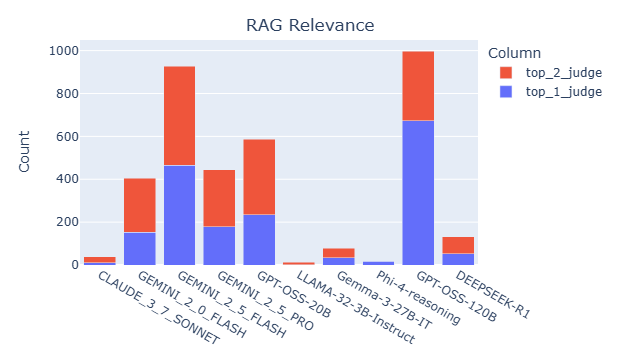
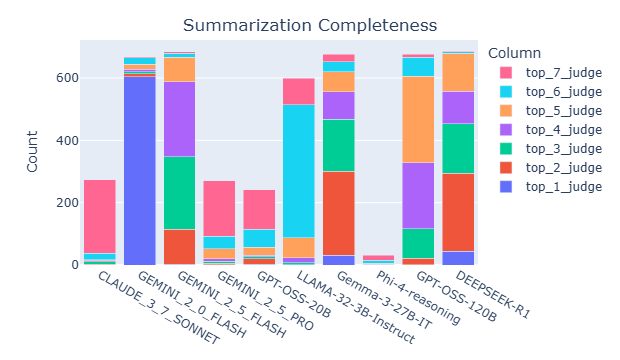
We begin by analyzing judge selection patterns within juries across different tasks and datasets. Fig. 3 summarizes the selection frequency of each judge for the RAG groundedness and RAG completeness tasks. The results reveal distinct preferences: Claude 3.7 Sonnet and DeepSeek R1 are frequently selected for completeness evaluation but are rarely chosen for groundedness. In contrast, Gemini 2.5 Flash is commonly selected for groundedness but appears less frequently in completeness evaluations. GPT OSS 20B and GPT OSS 120B are consistently selected across both metrics. A comprehensive comparison of judge selection across all tasks is in Appendix E.2. We now examine how data properties impact judge performance. For illustration, we focus on two tasks: RAG groundedness and summarization completeness. The analysis for summarization completeness is in Appendix E.2. We select properties that rank among the most important features in the XGBoost model. For the summarization task, the key property is the compression ratio (i.e., the length of the summary divided by the length of the article). For the RAG task, the selected property is the character count of each response.
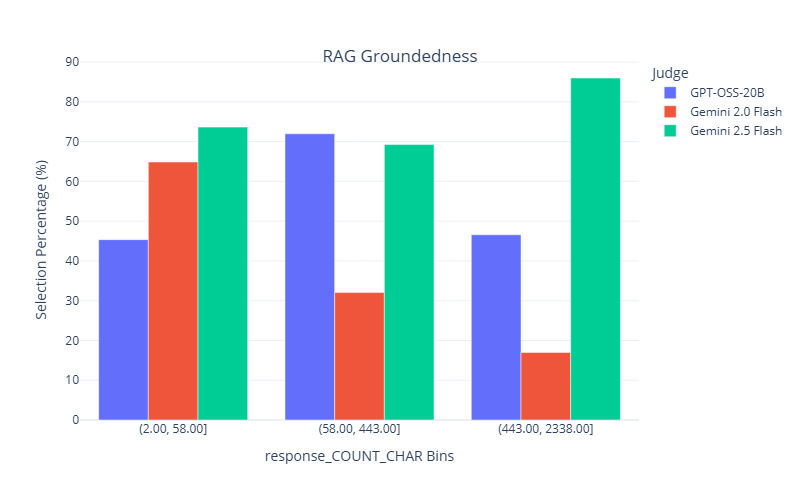
To better illustrate the findings, we focus on three judges for each task. We begin with the RAG groundedness task. Fig. 4 shows model performance across bins of low, medium, and high response character counts. Two main observations emerge:
-
All judges perform worse as the character count increases.
-
Gemini 2.0 Flash performs comparably to the others when the character count is low, but its performance drops significantly at higher character counts, especially compared to Gemini 2.5 Flash and GPT OSS 20B.
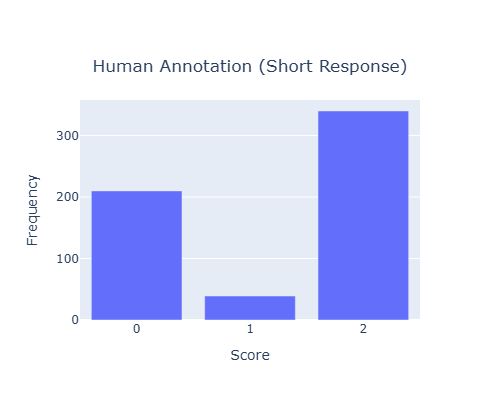
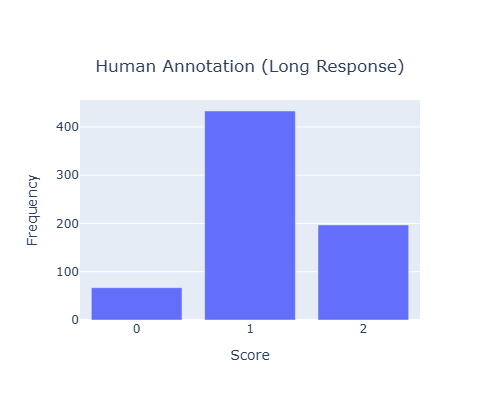
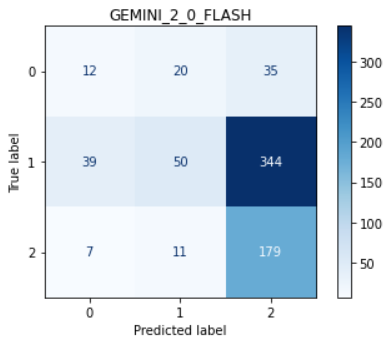
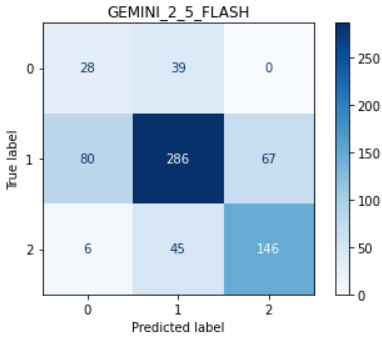
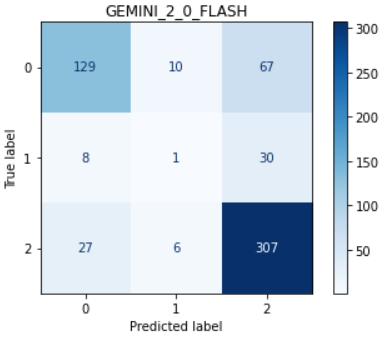
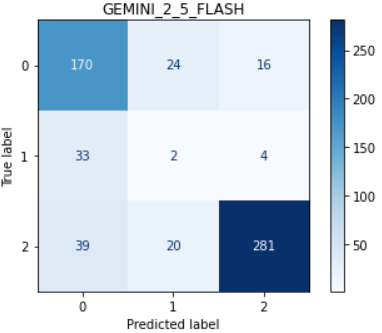
To explain these trends, we examine the distribution of annotation scores in the low and high character count regions (see Fig. 5). In the high character count region, many responses receive a score of 1 (moderately ungrounded), whereas in the low character count region, most scores are either 0 (severely ungrounded) or 2 (fully grounded). It is easier for judges to distinguish between scores 0 and 2, but more difficult to differentiate between 1 and 2. Weaker judges, such as Gemini 2.0 Flash, particularly struggle with identifying ungrounded content. Fig. 6 and Fig. 7 present the score confusion matrices for Gemini 2.0 Flash and Gemini 2.5 Flash for long and short responses. Compared to Gemini 2.5 Flash, Gemini 2.0 Flash assigns a disproportionately high number of score 2s, which explains its poor performance in the high character count region and relatively good performance in the low character count region. We also reviewed specific examples to understand why Gemini 2.0 Flash assigns score 2 even when the content is ungrounded. This analysis is provided in the Appendix E.3. Finally, the jury selection dynamically aligns with model performance, as shown in Fig. 4. This is most evident in the high character count bin, where the performance of Gemini 2.0 Flash drops significantly. Correspondingly, its selection percentage in our dynamic jury plummets to its lowest point, demonstrating that the reliability predictors correctly identify and avoid this weaker judge when it is unreliable. Conversely, Gemini 2.5 Flash maintains the highest performance in this high-count bin, and our system selects it for the jury in the vast majority of cases. GPT-OSS-20B also shows strong alignment in the medium character count bin, where it achieves its highest performance and is also the most selected judge.
The framework also demonstrates robustness beyond simply picking the single best-performing judge. For instance, in the low character count bin, GPT-OSS-20B has the highest kendall’s Tau. While it is selected frequently, Gemini 2.5 Flash, which also performs exceptionally well, is selected more often. This illustrates that the system does not rely on a single judge; rather, it identifies a pool of highly reliable judges for a given context and assembles an optimal jury from that pool.
These findings reinforce the importance of constructing dynamic juries that adapt to specific data characteristics and demonstrate the potential of our framework to predict judge reliability based on interpretable data properties. The selection percentage of these judges in the final dynamic jury for data points within each bin. The analysis shows that judge performance degrades with longer responses, particularly for Gemini 2.0 Flash. Our system’s jury selection adapts to this, heavily favoring the more reliable Gemini 2.5 Flash in the high-count bin.
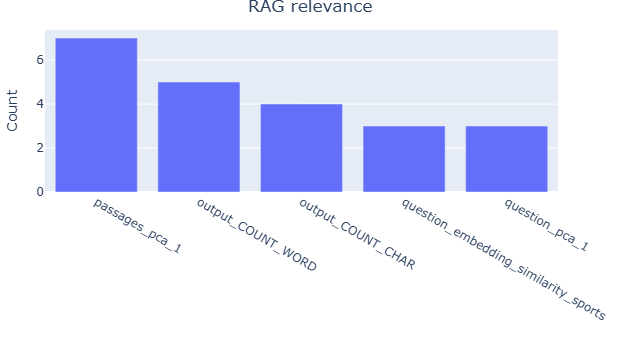
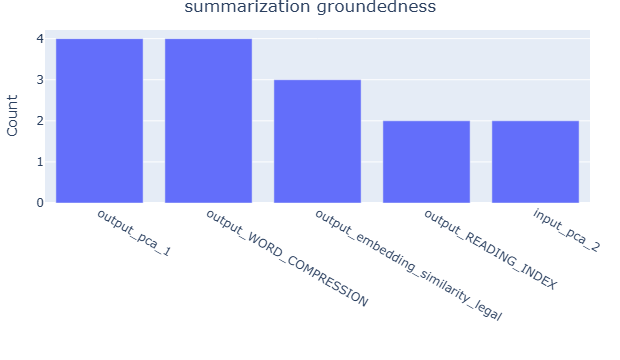
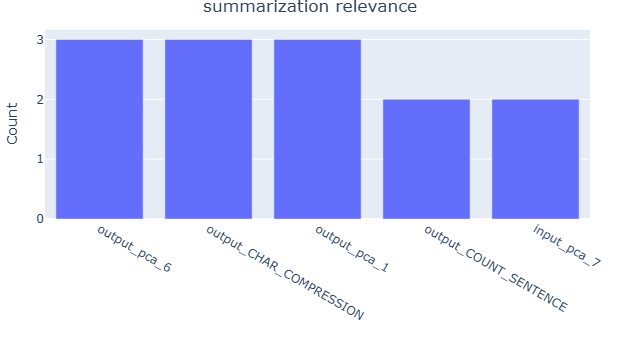
Table 2 presents the top five most important features for the judge reliability XGBoost model, as determined by permutation feature importance (Fisher et al., 2019), with the summarization groundedness task as an example. For illustration, we focus on Gemini 2.5 Pro and GPT-OSS-120B, while the complete results for all judges are in Appendix E.2. The analysis reveals the variation in feature importance across judges. For instance, embedding-related features are more influential for GPT-OSS-120B, suggesting that different judges rely on distinct data properties when assessing reliability. We further aggregate the top five features that frequently appear across tasks, with results provided in Appendix E.2. The analysis reveals clear task-specific trends: text size-related features, such as word count and compression ratio, along with token entropy, are more prominent in RAG tasks. In contrast, embedding-based features, including PCA components and embedding similarity, play a more significant role in summarization tasks. These findings align with the ablation analysis in Appendix H.1, which shows that removing embedding features leads to a greater performance drop in the summarization task compared to RAG. These observations imply that evaluation reliability is task-dependent and further demonstrate that our approach effectively links data characteristics to judge reliability, enabling more informed and adaptive jury construction across diverse evaluation scenarios.
In this section, we investigate the conditions under which the dynamic jury fails to accurately assess model outputs. Given that jury performance is inherently dependent on the individual scoring behaviors of its constituent judges, our analysis aims to identify common regions and conditions where judges exhibit unreliable evaluations.
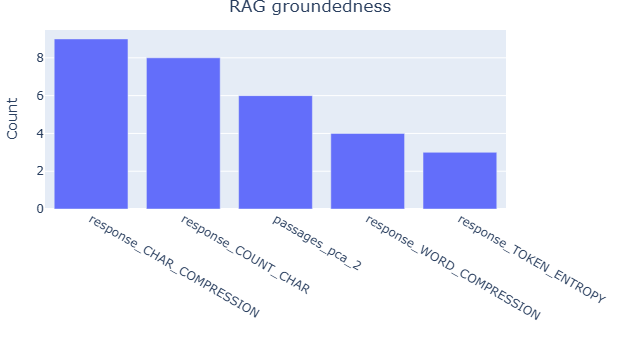
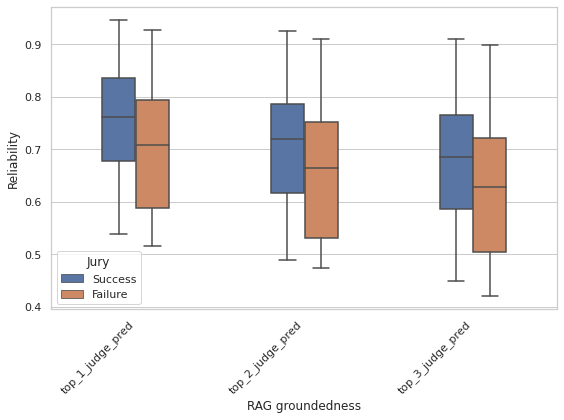
To uncover data attributes associated with jury failure, we train XGBoost models using a set of text attributes we measured as predictors and a binary response variable indicating jury success or failure. Feature importance is subsequently assessed via permutation-based methods to identify the most influential attributes affecting jury outcomes. For each of the top-ranked features, we conduct a binning analysis to evaluate jury performance across discrete intervals. Using the RAG groundedness task as a case study, we find that the most predictive features are related to the size and complexity of the generated text such as token entropy and character count. Figure 8 illustrates jury performance across bins of these two attributes, revealing a clear trend: as the length and entropy of generated text increase, the jury’s ability to reliably assess ground-edness diminishes. The complete results for top features identified in this task are presented in Appendix E.5. We further analyze the predicted reliability scores of the top-performing judges selected to form the jury, comparing cases of jury success versus failure. Using the RAG groundedness task as a representative example, we focus on the optimal jury configuration of three judges selected from a pool of ten for each evaluation instance. Figure 9 presents a box plot summarizing the predicted reliability scores of the top three judges across both successful and failed jury outcomes. The results exhibit a consistent pattern: judges involved in successful jury decisions tend to have higher predicted reliability scores than those in failure cases. This trend is corroborated by similar findings in the summarization completeness task, detailed in Figure 9 as well. In that task, the optimal jury size is seven, we highlight the top three judges for clarity.
These observations validate the effectiveness of our jury construction strategy, which prioritizes the selection of judges based on their predicted reliability. Moreover, the results suggest that the XGBoost models used to estimate individual judge reliability accurately capture behavioral patterns. When the models predict high reliability, the corresponding judges typically perform well, contributing to successful jury outcomes. Conversely, when even the top-ranked judges struggle, the overall jury performance deteriorates.
In this work, we addressed the critical challenge of creating scalable and reliable evaluation systems for Large Language Models. We introduced LLM Jury-on-Demand, a novel framework that moves beyond the static aggregation methods of prior jury-based systems by learning to predict judge reliability and dynamically assembling an expert jury for each data point. Our experimental results demonstrated that this adaptive approach consistently outperforms both single- judge and static-jury baselines in aligning with human expert judgement. This confirms our central hypothesis that for automated evaluation to be trustworthy, it must be context-aware and adaptive, rather than static.
While our results are promising, this work has several limitations that open clear paths for future research. Our current framework relies on a humanannotated dataset to train the reliability predictors; future work could explore semi-supervised or self-supervised techniques to reduce this dependency and enhance scalability. Furthermore, we conduct experiments to assess the framework’s ability to generalize beyond its training domains by training on a subset of domains and applying it to held-out domains. The results indicate partial generalization: certain learned patterns transfer effectively to new domains, while others do not (see Appendix J for details). These findings suggest that the framework’s generalizability is contingent on both the diversity of the training data and the characteristics of the unseen domains. As additional annotated data becomes available and incorporated into training, we anticipate that the framework’s capacity to generalize will improve, enabling broader applicability across diverse areas.
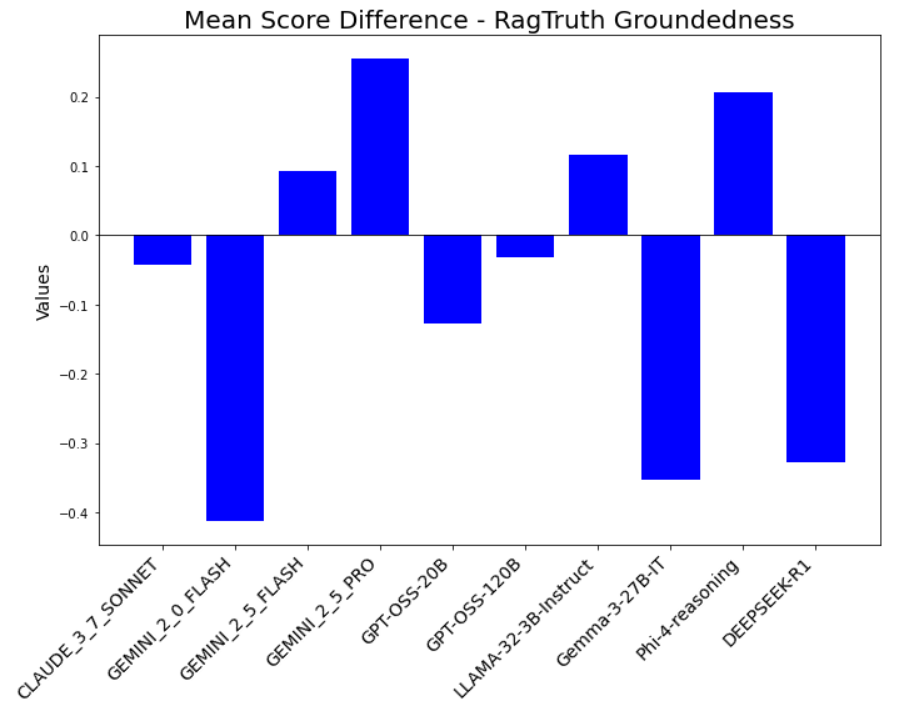
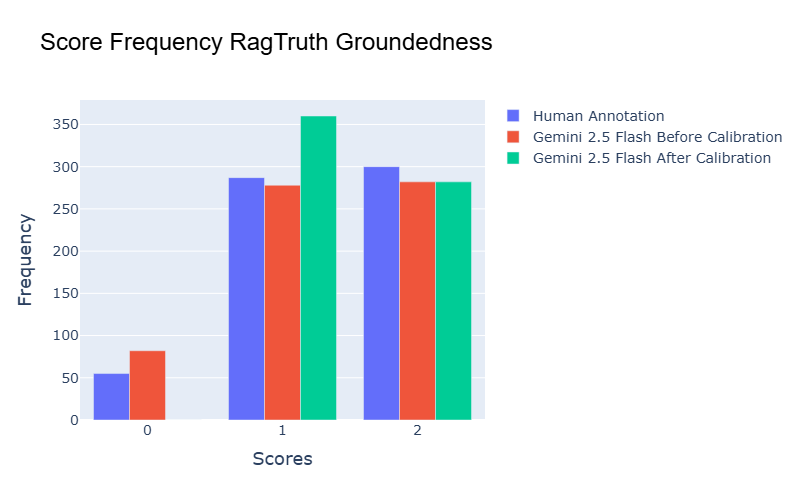
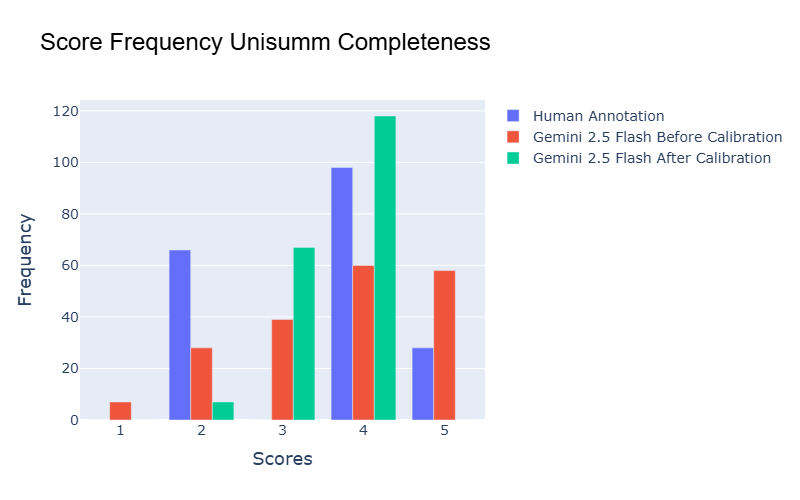
Another promising direction for future work is mitigating bias in judge scores. For example, certain judges may consistently assign higher or lower scores compared to human annotations. We explore score calibration in Appendix K. Our experiments show that calibration can sometimes improve alignment between judge scores and human annotations, but in other cases, it may amplify the bias.
For each task, we focus on evaluating three core metrics: groundedness, relevance, and completeness. Groundedness: Assesses how well the output is supported by the context of the input. A grounded output accurately reflects the source information without introducing unsupported or fabricated content. This dimension is closely related to the concept of hallucination in language models.
Relevance: Measures the degree to which the output includes only essential and contextually appropriate information, avoiding extraneous or off-topic content. However, for RAG, annotated data which assesses output (answer) relevance is not readily available, so instead we check retrieval relevance. Specifically, how closely and thoroughly the retrieved context addresses the posed question. A context is considered relevant if it is clearly focused on the question and provides sufficient information to support a complete and accurate answer. Similarly, we can assess how relevant the context is with respect to the reference answer.
Completeness: Captures whether the output includes all critical information from the input context, ensuring comprehensive coverage.
The datasets used for different evaluation metrics are listed in Table 4 (summarization) and Table 5 (RAG). We prioritized datasets with annotated scores for completeness, groundedness, or relevance. However, annotated data for the completeness metric is relatively scarce. To address this, we simulate incomplete outputs by removing sentences from multi-sentence references and assigning scores accordingly. This approach is applied to the SummEval dataset for summarization and to all three datasets used in the RAG task.
We use the same prompt template across tasks. Below we list the prompt for summarization (Table 6) and RAG (Table 7), with dimension groundedness. User prompt: You will be given an input context followed by a corresponding summary. Your task is to evaluate the quality of the summary with respect to groundedness.
Definition of Groundedness: Groundedness refers to how well the summary is supported by the content of the input context. A grounded summary should accurately reflect the information presented in the input context without introducing unsupported claims.
Provide a score for this summary on a scale from 1 (worst) to 5 (best). Valid scores are: 1, 2, 3, 4, or 5.
[score number](on its own line, only one number here, no brackets or letters or ‘score:’)
[explanation](starting on the next line)
Conversation: source Summary: output
We first show the jury performance, then analyze the interactions between judges, tasks and data properties.
Tables 8 -11 present the complete Kendall’s Tau correlation results of our experiments. Due to the table size limit, we split the results for clarity. Tables 8 and10 compare our Jury-on-Demand system against the four Static Jury baselines (Average-All, Average-TopK, Weighted-Regression, and Weighted-Tau). Tables 9 and11 compare Jury-on-Demand against the 10 Single-Judge baselines. Each row corresponds to a specific evaluation set, either an “Overall” aggregation or an individual source dataset. All values represent the mean Kendall’s Tau rank correlation coefficient (± standard deviation) calculated across 10 independent runs. Higher values indicate better performance and stronger alignment with human judgment.
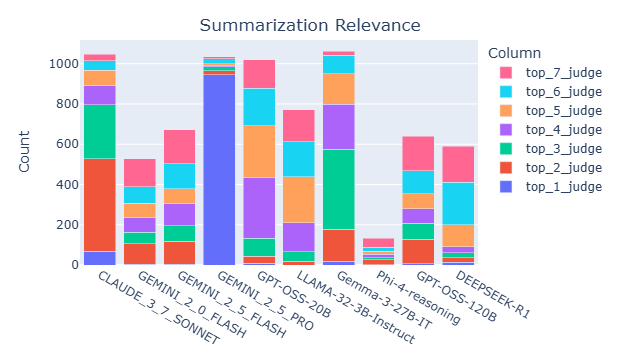
We also report statistical significance and effect sizes. Specifically, we perform one-sided Wilcoxon signed-rank tests (Wilcoxon, 1945) to compare the Tau differences between Jury-on-Demand and either static juries or single judges. The corresponding p-values are presented in Table 12 through Table 15. Among these p-values, 77% are statistically significant (p < 0.05). Values in parentheses represent Cliff’s delta (Cliff, 1993), a non-parametric effect size metric that quantifies the difference between two groups, with Jury-on-Demand serving as the baseline. According to conventional thresholds, an effect size is considered large if it exceeds 0.47 and medium if it falls between 0.33 and 0.47. Across all Cliff’s delta values, 80% are classified as either large (70%) or medium (10%). This high proportion of significant p-values and substantial effect sizes indicates that, in most cases, Jury-on-Demand outperforms static baselines and single judges. Fig. 10 summarizes the selection frequency of each judge, revealing that summarization juries tend to include a broader set of judges compared to those used in RAG tasks. Within RAG, Claude 3.7 Sonnet and DeepSeek R1 are frequently selected for completeness evaluation but are rarely chosen for groundedness. In contrast, Gemini 2.5 Flash is commonly selected for groundedness but appears less frequently in completeness evaluations. GPT OSS 20B and GPT OSS 120B are consistently selected across both metrics.
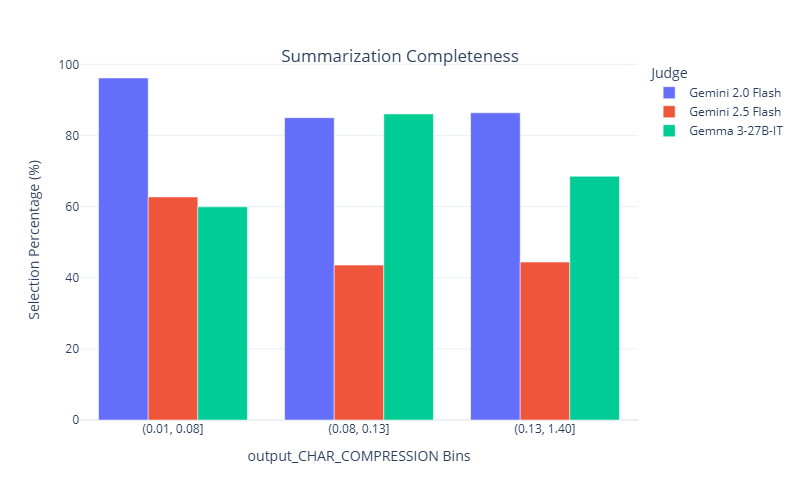
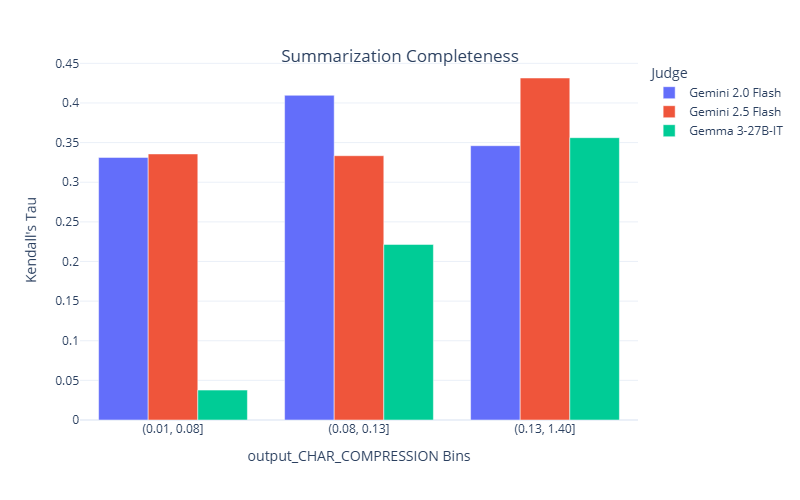
To further explore how data properties influence model performance and judge selection, we examine Kendall’s tau and selection patterns across different bins of key attributes. Following Section 5.2. We focus on summarization completeness task and property compression ratio. Fig. 11 compares judge performance across low, medium, and high compression ratio bins. Performance improves as the compression ratio increases, likely because judges find it more difficult to identify incomplete summaries, which tend to have lower compression ratios. Fig. 11 shows that Gemma performs particularly poorly when the compression ratio is low. Upon reviewing the data, Gemma’s scores, and its explanations, we found that it sometimes struggles to distinguish between the source context and the summary. As a result, it incorrectly assigns a score of 2, interpreting the context as part of the summary. Examples illustrating this issue are provided in the Section E.3. Stronger models-such as the Gemini series, GPT models, and Claude 3.7 Sonnet-do not exhibit this issue and are able to correctly identify missing content in the summaries.
Jury selection, shown in the right plot, is generally consistent with judge performance across the bins. In the low compression bin where Gemma fails, it is selected least often. In contrast, Gemini 2.0 Flash has the highest performance in this bin and is selected in nearly all juries, showing strong alignment. However, the selection mechanism again proves more sophisticated than just selecting the top-ranked judge. In the high compression ratio bin, Gemini 2.5 Flash (red) achieves the highest Kendall’s Tau. Yet, Gemini 2.0 Flash (blue), which also performs well, is selected more frequently. This demonstrates that the reliability model identifies multiple judges as reliable in this context and dynamically constructs juries based on this broader reliability assessment rather than overfitting to a single “best” judge for the bin.
These findings reinforce the importance of constructing dynamic juries that adapt to specific data characteristics, and demonstrate the potential of predicting judge reliability based on interpretable data properties.
Figure 10: Selection frequency of the judge in the jury. Top k judge means that the judge has the k-th highest reliability score in the jury. Summarization juries tend to incorporate a more diverse set of judges compared to those used in RAG tasks. For RAG Claude 3.7 Sonnet and DeepSeek R1 are frequently selected for completeness evaluation but are rarely chosen for groundedness. In contrast, Gemini 2.5 Flash is commonly selected for groundedness but appears less frequently in completeness evaluations. GPT OSS 20B and GPT OSS 120B are consistently selected across both metrics. Tables 16-17 present the top five most important features for each judge’s XGBoost model, as determined by permutation feature importance (Fisher et al., 2019), using the summarization groundedness task as an illustrative example. The results show substantial variation in the top-ranked features across different judges, suggesting that each judge’s reliability is influenced by distinct data properties.
Fig. 12 aggregates the top five features that frequently appear across tasks, revealing clear task-specific patterns. For instance, character count is more prominent in RAG tasks, while compression ratio and embedding-related features such as PCA components and embedding similarity are more influential in summarization tasks. These findings align with the ablation analysis in Appendix H.1, which shows that removing embedding features leads to a greater performance drop in the summarization task compared to RAG. For RAG, removing text size-related features results in a larger decline than removing embedding features.
These observations imply that evaluation reliability is task-dependent, and further demonstrate that our approach effectively links data characteristics to judge reliability, enabling more informed and adaptive jury construction across diverse evaluation scenarios.
In this section, we present examples where specific judges fail to evaluate correctly. For illustration, we select one example and one judge from each of the two tasks: RAG groundedness and summarization completeness. Fig. 13 shows how Gemini 2.0 Flash evaluates groundedness in the RAG task. It fails to identify ungrounded content in the response-for instance, Okavango Delta, which is not mentioned in the cited context. Fig. 14 illustrates how Gemma 3 27B IT Character count is more prominent in RAG tasks, while compression ratio and embedding-related features such as PCA components and embedding similarity are more influential in summarization tasks.
fails to assess the completeness of a summary. The summary merely repeats the first sentence of the post and omits key details, yet Gemma incorrectly considers it complete and explains that it covers all key events.
Figure 13: Gemini 2.0 Flash fails to identify ungrounded content in the response-for instance, Okavango Delta, which is not mentioned in the cited context.
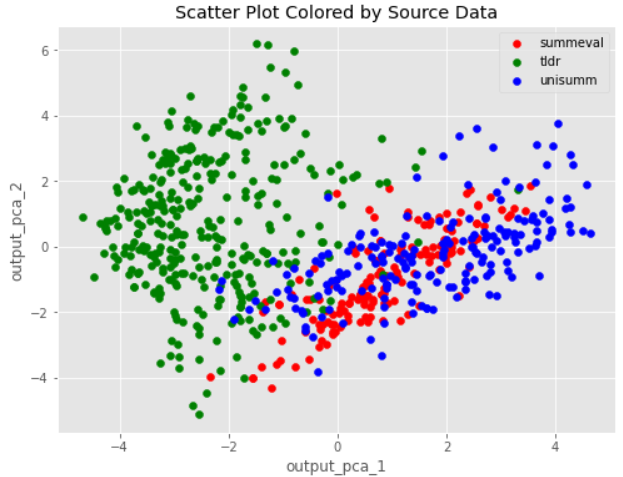
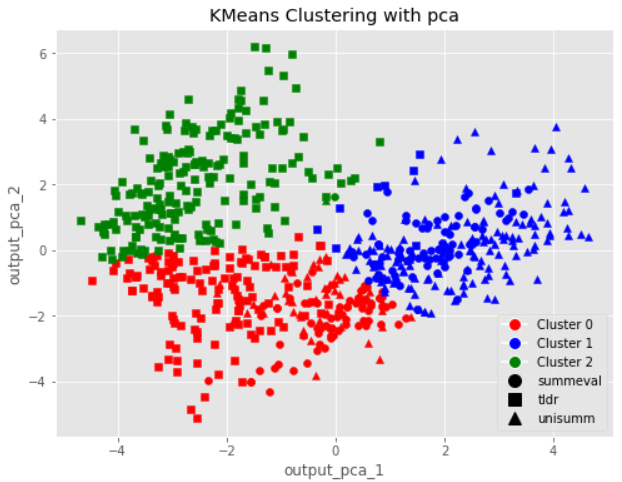
In this section, we provide insights into the embedding PCA-related features.
For illustration, we use the summarization completeness task as an example. tent Dirichlet Allocation (LDA) (Blei et al., 2003). Below, we summarize the top words and inferred topics for each dataset:
• SummEval: Top words include club, hull, liverpool, time, and claim, suggesting topics related to sports and crime.
• UniSumm: Top words include text, rate, city, and officer, indicating topics such as technical instructions and city-related events.
• TLDR: Top words include want, boyfriend, girlfriend, love, and problem, reflecting themes of romantic desires and relationship issues.
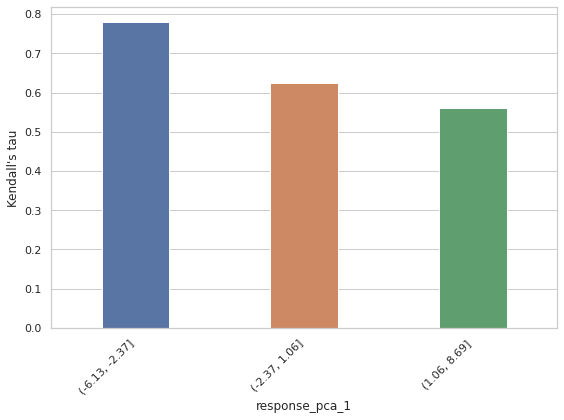
Figure 16 presents the complete results of binning analyses of top features for the RAG groundedness task. The results reveal a clear trend: as the length or complexity of generated text increase, the jury’s ability to reliably assess groundedness decreases. It is hard to interpret the meaning of PCA features of generated text but a clear pattern is also shown.
Figure 16: Jury performance across segments of top features indentifed in the RAG goundedness task. Jury has better outcomes when the generated text is shorter or less complex.
We examine the consistency of human evaluations and compare them with the performance of our jury model. Both the SummEval and DialSumm datasets include three human annotators per evaluation dimension. Tables 18 to 21 report Kendall’s tau correlations between each individual annotation and the average of the three scores, which serves as the reference in our analysis.
To investigate the influence of data property features on jury performance, we conduct ablation studies by selectively removing feature sets during model construction.
As illustrative examples, we focus on two tasks: summarization completeness and RAG groundedness. The full categorization of features is provided in Appendix A. Specifically, we remove three groups of features in separate ex-periments: (1) text size-related features and special word count features (jointly removed due to their high correlation), (2) text complexity features, and (3) embedding-based features. The results are presented in Tables 23 and24 for summarization completeness and RAG groundedness, respectively. We observe that the jury model achieves its best performance when all feature sets are included, underscoring the importance of comprehensive feature representation.
Although the performance differences are modest, this can be attributed to the internal correlations within each feature category. Additionally, different tasks exhibit varying sensitivity to feature sets. For instance, removing embedding features leads to a greater performance drop in the summarization completeness task than in RAG groundedness, where text size-related features have a more pronounced impact.
We conduct experiments to test the effectiveness of varying jury size compared to keeping a fixed value. We focus on the tasks Summarization-Completeness and RAG-Groundedness for this study. The tolerance level for all trained XGBoost models is set to 0 which means only the exactly matching scores are considered as correct. Performance is measured across 10 runs and average is taken for each jury size. Fig. 17 shows that the performance varies with jury size. In the Summarization-Completeness task, performance steadily improves as jury size increases, reaching its peak around a jury size of 7-8 before slightly declining. This indicates that adding more judges generally strengthens the overall decision by reducing individual biases, but very large juries introduce diminishing returns and slight degradation. Similarly, in the RAG-Groundedness task, performance starts low at smaller jury sizes and improves significantly with larger juries, peaking at 5 and 8 and then tapering off. In both cases, increasing jury size enhances robustness against noisy predictions, but there is an optimal range beyond which gains flatten or reverse. This shows that tuning jury size per task still provides significant improvements compared to fixing it, though the optimal size tends to be moderately large for both tasks.
Figure 17: Test performance with varying jury size.
We consider two tolerance levels for summarization tasks (0 and 1) and a single tolerance level (0) for RAG tasks. For RAG tasks valid scores are 0-2. Thus, a tolerance level of 1 or more would mean that a score of 1 is always considered as correct. For the same reason, we do not experiment with a tolerance level of 2 or more for summarization tasks where the valid scores are 1-5.
For this study, we focus on Summarization-Completeness. We experiment with two tolerance levels: 0 and 1 in the original scale (1-5). After min-max normalization to [0, 1], these correspond to 0 and 0.25. The performance of the jury is observed with all the XGBoost models trained either on tolerance of 0 or 0.25. Table 25 summarizes the means and standard deviations of the Kendall’s Tau across the 10 runs and shows the comparison with tuned tolerance models.
We observe that allowing different tolerance levels across different XGBoost models gives slightly better performance than a fixed tolerance level across all models.
Additionally, Table 25 further illustrates the importance of tolerance tuning. While Jury-on-Demand with variable tolerance achieves the best overall performance, the optimal fixed tolerance differs across datasets: TL;DR performs better with a tolerance of 0, whereas UniSumEval favors 0.25. This variability underscores that no single fixed tolerance can fit all datasets. In practical scenarios, especially for unseen datasets without human annotations, it is impossible to know the ideal tolerance beforehand. Therefore, adaptive approaches that allow tolerance to vary across models or instances are crucial for robust generalization.
Finally, the results with fixed tolerance levels are better than the static jury as we have chosen the best jury size (K = 7) overall across the runs.
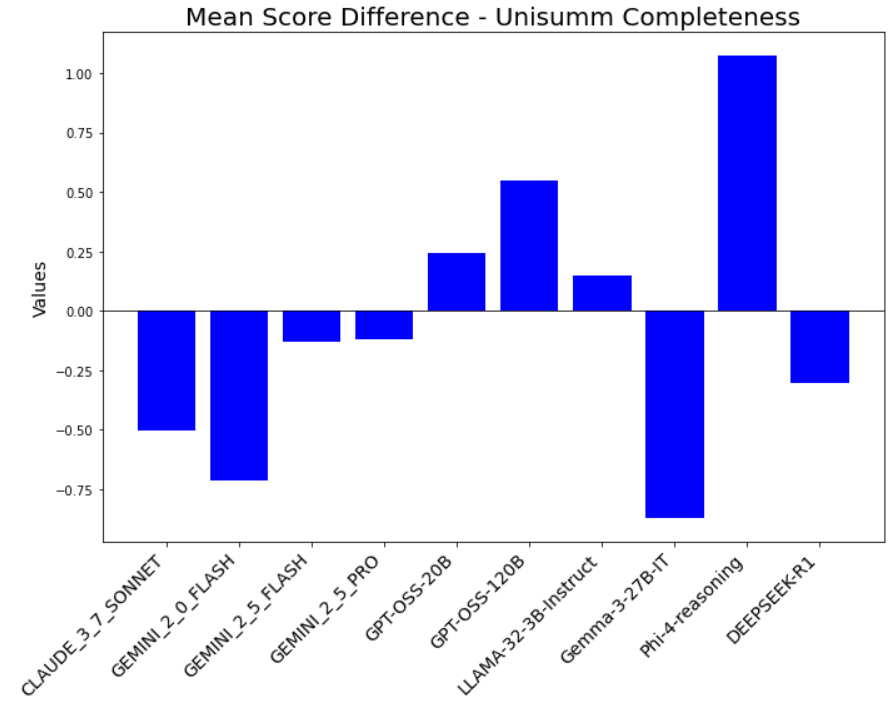
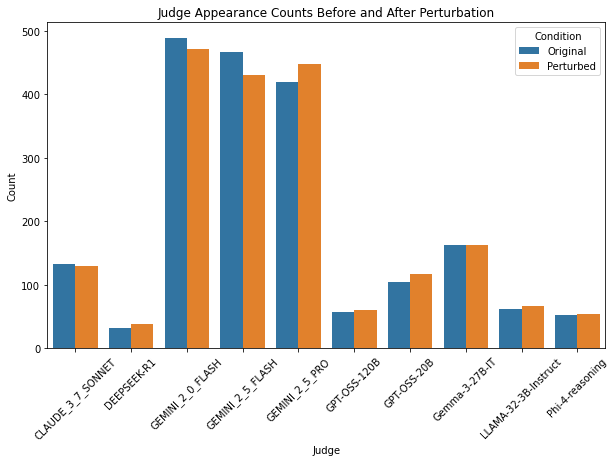
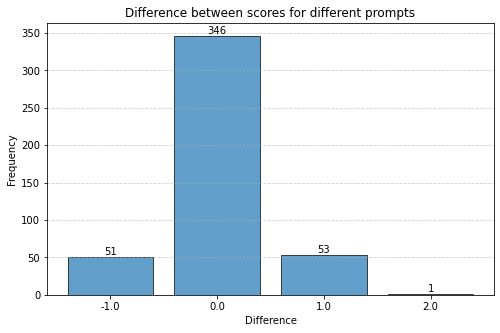
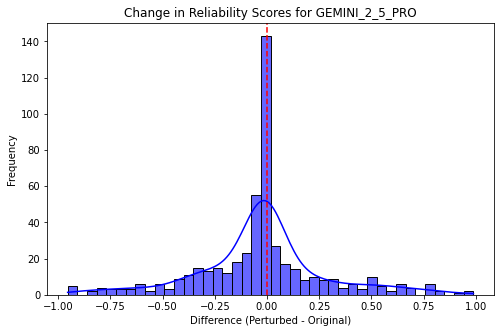
We analyze the effect of using different prompts with the judges on the overall jury performance. We focus on the task Summarization-Completeness for our analysis. The performance with the prompt as described in Table 6 is compared against the performance with a slightly different prompt which omits the list of valid scores. We observe that changing the prompt while maintaining its meaningfulness (the prompt should clearly explain the input and the expected output), changes the evaluation scores for roughly 30% of the data points by 1 score point (on average across datasets, judges and metrics). Fig. 18 shows the distribution of score differences for judging the Completeness of summaries using GEMINI 2.5 PRO as the judge. The XGBoost judge reliability models are then trained using the scores from the second prompt. We observe changes in the reliability scores across judges with the perturbed prompt. The distribution of the reliability score differences is shown in Fig. 19. It is seen that on average roughly 50% of the datapoints have less than 0.1 difference in the reliability scores of the judges. Table 27 shows that the jury compositions do not change much when using slightly different prompts.
The perturbation analysis demonstrates that the evaluation framework is highly robust to prompt variations. While minor prompt changes introduce some variability (about 30% of data points shift by one score point), the overall agreement with human evaluations remains largely stable. For instance, in the Gemini 2.5 PRO case, over 88% of instances (439/495) either consistently match or consistently diverge from human scores across prompt variations.
Reliability score changes exhibit minimal changes, with 50% of data points showing less than 0.1 difference, indicating that prompt-induced randomness is minimal and does not significantly affect judge reliability. Furthermore, jury composition stability is striking. On average, 3.5 out of 4 jury members remain unchanged, and the aggregated jury scores show negligible deviation. This suggests that the methodology maintains integrity even under prompt perturbations.
The system’s resilience to prompt changes implies that the evaluation pipeline is not overly sensitive to linguistic nuances, making it suitable for real-world deployment where prompt variability is inevitable. This robustness ensures consistent decision-making and fairness in model evaluation, reinforcing confidence in the methodology for broader applications.
To identify conditions where the jury model underperforms, we analyzed feature distributions between instances with high and low prediction discrepancies -excluding embedding features for interpretability. We focus on the RAG groundedness task for illustration. The dataset was split into two groups:
-
High Difference: Instances with large prediction errors.
-
Low/No Difference: Instances with minimal errors.
For each feature, we computed mean and median values across both groups and ranked features by their median absolute differences in Table 28. This revealed two failure modes:
-
Systematic Bias: Features like factual density and named entities show consistent shifts in both mean and median, suggesting bias toward certain content structures.
-
Distributional Fragility: Features such as syntactic anomaly and subjectivity show high median shifts but low mean differences, indicating sensitivity to rare or irregular linguistic patterns.
Here we provide some notes the runtime for judges scoring select data. For this work, each judge was implemented in one of three distinct environments: Google Cloud API, Nvidia H200 with 140 GB RAM, or Nvidia TESLA V100 with 32 GB RAM. These choices were made based on the nature of the models (closed vs. open) and resource needs of the the open-weight models.
• GCP was selected for the closed models such as Claude 3.7 Sonnet and Gemini 2.5.
• The Nvidia H200 was used for larger open-weight models like Phi-4 Reasoning, Llama 3.2-3B, and Gemma 3 27B-IT, leveraging its high memory capacity for large-scale inference.
• V100 served as a baseline GPU environment for evaluating performance under constrained resources.
The runtime for each dataset varied depending on several factors including the size of the dataset, the computational environment used, and the specific model being executed. Table 29 summarizes the runtimes observed for select datasets during our experiments. Note that this is not intended as to represent a rigorus comparitive study of the models but to provide a general sense of the time necessary for executing judge scoring.
To assess the framework’s generalizability to unseen domains, we employ a leaveone-out procedure. Specifically, for each experiment, one data source is excluded from the training of XGBoost reliability models and jury construction, and the trained framework is then evaluated on the held-out source. This approach tests • JOD consistently outperforms static juries: Performance varies with jury size K, but JOD consistently outperforms both static baselines across all K values, except for a few cases in Summarization-Completeness. The performance margin of JOD over static juries is larger for RAG-Groundedness than for Summarization-Completeness.
• Effect of jury size differs by task: For Summarization-Completeness, there is no clear pattern on performance do not for different juries. JOD’s performance do not vary too much as K changes, Simple Average jury show performance decrease as K increases. For RAG-Groundedness, performance generally improves with larger K, except that Simple Average shows a drop at K = 10. These observations can be exaplained by the larger score bias in weaker judges. Large biases degrade performance when these judges are included, especially for Simple Average, which assigns equal weight regardless of bias.
• Weighted Regression struggles with small K: Weighted Regression performs worse than other jury methods when K is small, particularly for RAG-Groundedness. One contributing factor is that the regression coefficients for RAG-Groundedness are very small, which results in weighted regression scores that fall below human annotation scores. To ensure realistic outputs, we round up any weighted regression score that is lower than the minimum human annotation score. However, because the coefficients are small, this adjustment often causes many weighted regression scores to equal the lowest human annotation score, further degrading performance. Another potential reason for poor performance at small K is the high correlation among strong judges (e.g., Gemini models, GPT-OSS models, Claude 3.7 Sonnet), with correlation values around 0.7-0.8. Using such highly correlated features in regression can negatively impact model performance.
In summary, how performance changes with jury size K depends on multiple factors, including task characteristics, score distributions, and correlations among judge scores. Although JOD requires more training data and a more complex training process compared to static juries, its dynamic jury selection and adaptive weight assignment enable it to choose the best judges for each instance and achieve superior overall performance.
Ruochen Zhao, Wenxuan Zhang, Yew Ken Chia, Weiwen Xu, Deli Zhao, and Lidong Bing. Auto-arena: Automating llm evaluations with agent peer battles and committee discussions. arXiv preprint arXiv:2405.20267, 2024. Lianmin Zheng, Wei-Lin Chiang, Ying Sheng, Siyuan Zhuang, Zhanghao Wu, Yonghao Zhuang, Zi Lin, Zhuohan Li, Dacheng Li, Eric Xing, et al. Judging llm-as-a-judge with mt-bench and chatbot arena. Advances in neural information processing systems, 36:46595–46623, 2023.
System prompt: You are a helpful, respectful and honest assistant. Follow instructions attentively. Do not add any extraneous information.
RAG Results: Jury-on-Demand vs Static Jury baselines. Numbers in parentheses are standard deviation. Bold indicates the highest mean and its std in the row, underline indicates the second highest mean and its std.
📸 Image Gallery