When Do Domain-Specific Foundation Models Justify Their Cost? A Systematic Evaluation Across Retinal Imaging Tasks
📝 Original Info
- Title: When Do Domain-Specific Foundation Models Justify Their Cost? A Systematic Evaluation Across Retinal Imaging Tasks
- ArXiv ID: 2511.22001
- Date: 2025-11-27
- Authors: David Isztl, Tahm Spitznagel, Gabor Mark Somfai, Rui Santos
📝 Abstract
Large vision foundation models have been widely adopted for retinal disease classification without systematic evidence justifying their parameter requirements. In the present work we address two critical questions: First, are large domain-specific foundation models essential, or do compact general-purpose architectures suffice? Second, does specialized retinal pretraining justify its computational cost? To answer this, we benchmark initialization strategies across four retinal imaging classification tasks spanning Optical Coherence Tomography (OCT) and Color Fundus Photography (CFP) modalities: 8class OCT classification, 3-class diabetic macular edema (DME), 5-class diabetic retinopathy (DR), and 3-class glaucoma (GL) detection. We evaluate 12-13 model configurations per task, including vision transformers (22.8M-86.6M parameters), Swin Transformers (27.6M-28.3M), ConvNeXt (28.6M), and the domain-specific RETFound models (303M), under identical training conditions. Our results challenge prevailing assumptions: First, we demonstrate that pretraining provides universal benefits (5.18-18.41% improvement), scaling with task difficulty. Second, compact architectures (27-29M) dominate Pareto frontiers; SwinV2-tiny achieves top-1 performance on three datasets. Third, RETFound (303M) justifies its computational cost only for challenging DR grading (accuracy of 71.15%), while ImageNet pretraining proves to be sufficient with all other tasks (DME accuracy: 99.24%, OCT accuracy: 97.96%). CFP tasks show larger pretraining accuracy gains (9.13-18.41%) than OCT (5.18%). Thus, the evidence suggests that compact general-purpose models deliver nearoptimal performance for most retinal classification tasks; specialized foundation models warranted only for fine-grained discrimination under extreme class imbalance.📄 Full Content
Deep learning models have achieved expert-level performance on numerous retinal imaging tasks, with convolutional neural networks [6] and vision transformers demonstrating remarkable accuracy across classification of diverse pathologies. The recent surge in vision foundation models has established a prevailing narrative: domain-specific pretraining on large-scale medical imaging datasets is essential, and larger models consistently outperform smaller architectures.
Further research efforts have focused on developing specialized retinal foundation models such as RETFound with 303M parameters [7,8], under the assumption that visual features learned from generic natural images cannot transfer effectively to specialized medical imaging domains, necessitating domain-specific pretraining on large-scale retinal 1 arXiv:2511.22001v1 [eess.IV] 27 Nov 2025 datasets for clinical-grade performance. This has driven substantial computational investments in self-supervised pretraining on either public or proprietary retinal imaging datasets. However, systematic evidence supporting these assumptions is very limited [9,10,11]. Prior studies have evaluated single architectures on single datasets, making it impossible to disentangle task-specific findings from generalizable insights about model scaling and specialization. Thus, critical questions have been left unanswered: Do compact architectures (27-29M parameters) suffice for most retinal imaging tasks, or are large foundation models essential? When does domain-specific retinal pretraining justify its computational cost compared to general-purpose ImageNet [12,13] initialization?
How do these trade-offs vary across imaging modalities (Optical Coherence Tomography
[OCT] vs. Color Fundus Photography [CFP]) and task difficulties, namely balanced multi-class vs. severely imbalanced ordinal grading?
We hypothesize that: compact general-purpose architectures (27-29M parameters) will achieve performance comparable to large domain-specific foundation models (300M+) across most retinal imaging tasks, challenging the prevailing “bigger is better” paradigm.
This study provides the first comprehensive evaluation of backbone initialization strategies and architectures spanning two modalities (OCT and CFP) across distinct retinal imaging tasks, of which, DR, DME, and Glaucoma for CFP. While AMD, CNV, CSR, DME, DR, DRUSEN and MH for OCT. Featuring varying complexity levels (balanced multi-class, few-class, ordinal with severe imbalance, and 3-class).
We systematically evaluate 12-13 model configurations per dataset, including supervised and self-supervised vision transformers (22.8M-86.6M parameters), hierarchical Swin Transformers (27.6-28.3M), modern convolutional architectures (ConvNeXt, 28.6M), and domain-specific foundation models (RETFound, 303M). All models were trained under identical conditions using a unified training platform, isolating the effects of architecture and initialization from confounding training procedure variations.
Our key contributions are:
• Challenging scaling assumptions: Pareto frontier analysis demonstrating that compact models (22.8-29M parameters) dominate accuracy-size trade-offs across all tasks, contradicting the prevailing “bigger is better” paradigm in foundation model development for ophthalmology.
• Quantifying domain-specific pretraining value: Large-scale retinal foundation models such as RETFound (303M), provide advantages only for the most challenging ordinal grading task (DR). • Multi-task generalization analysis: Systematic comparison of pretraining benefits across multiple eye diseases (AMD, CNV, CSR, DME, DR, DRUSEN, MH, GL) spanning two imaging modalities and four difficulty levels, revealing when specialized models are warranted versus when compact general-purpose architectures suffice.
• Architecture-modality interactions: Evidence that ImageNet features transfer more effectively to color fundus photography (9.13-18.41% pretraining benefit) than OCT imaging (5.18%), thus informing resource allocation strategies across imaging modalities.
Our findings challenge current academic assumptions for retinal imaging AI model development. Compact hierarchical architectures such as SwinV2-tiny (27.6M) achieve top-2 performance on all four tasks, while domain-specific foundation models justify their computational investment only for fine-grained severity grading under extreme class imbalance. These results suggest that the drive towards ever-larger specialized foundation models may be premature, perhaps even unnecessary, with compact general-purpose architectures delivering near-optimal performance for most ophthalmological applications.
We evaluated models on four retinal imaging datasets:
AMD, CNV, CSR, DME, DR, DRUSEN, MH (Retinal OCT C8, 24,000 images, 8 balanced disease categories), DR (EAM unified dataset, 143,669 images, 5-class ordinal ICDR scale with significant imbalance), DME (IDRiD + Messidor-2, 2,264 images, 3-class severity grading), and GL (AIROGS + PAPILA, 114,381 images, 3-class glaucoma detection). See Appendix A.1.1 for complete dataset descriptions, and Table 12 for dataset characteristics.
We conducted a systematic comparison of backbone initialization strategies and architectures to evaluate their impact on retinal disease classification performance across all four datasets.
Six backbone architectures were evaluated, spanning different design paradigms (Table 1). The selection includes supervised and self-supervised Vision Transformers, hierarchical Swin Transformers, modern convolutional architectures (ConvNeXt), and domain-specific models pretrained on retinal imaging data (RETFound).
All pretrained models were obtained from the HuggingFace model hub; exact repository identifiers for reproducibility are provided in Table 14 (Appendix).
Two initialization approaches were compared: (1) Pretrained, where backbones were initialized with ImageNet-1k pretrained weights (or domain-specific retinal pretraining for RETFound models), with all layers fine-tuned end-to-end; (2) From scratch, where backbones were trained from random initialization. Four architectures (ViT-base, Swin-tiny, SwinV2-tiny, ConvNeXtV2-tiny) were evaluated with both strategies, while DINOv2 variants and RETFound models used pretrained weights only. This yielded 13 configurations for OCT and 12 for each CFP task (DME, DR, GL).
All models were trained using a unified platform ensuring direct comparison.
We employed
AdamW optimization [21]
We assessed model performance using five complementary metrics: (1) Accuracy, the top-1 classification accuracy; (2) AUROC (macro), the macro-averaged Area Under the ROC Curve [22,23], a threshold-independent discrimination measure; (3) F1-score (macro), the macro-averaged harmonic mean of precision and recall [24]; (4) Cohen’s Kappa, an agreement measure adjusted for chance [25], accounting for class imbalance; (5) Mean Average Precision (mAP), which summarizes precision-recall curves. See Appendix A.1.3 for complete metric definitions.
Pretrained vs. scratch differences were assessed using independent Mann-Whitney U tests (α = 0.05) [26]. Models were ranked on accuracy, AUROC, and F1-score, with average rank across metrics providing an overall performance indicator. Parameter efficiency was defined as accuracy per 100M parameters. Pareto frontier analysis [27] identified models that are optimal in the accuracy-size trade-off space (no other model achieves higher accuracy without more parameters). To quantify linear relationships between model size and performance, Pearson correlation coefficients [28] were computed for parameter count versus each performance metric (accuracy, AUROC, F1-score).
Pearson correlation measures the strength and direction of linear association between two variables, ranging from -1 (perfect negative linear relationship) through 0 (no linear correlation) to +1 (perfect positive linear relationship).
Table 1: Backbone architectures evaluated in this study. All models evaluated with both pretrained and from-scratch initialization, except RETFound and DINOv2 variants which were evaluated with pretrained weights only due to the computational demands of their self-supervised pretraining procedures.
Vision Transformer [14] ViT-base 86.6M
Self-supervised ViT [15,16] DinoV2-small 22.8M DinoV2-small-reg 86.6M
Swin Transformer [17,18] Swin-tiny 28.3M SwinV2-tiny 27.6M
ConvNeXt [19] ConvNeXtV2-tiny 28.6M Domain-specific (RETFound)
RETFound-MAE-OCT [20,7,8] 303M RETFound-DinoV2-CFP [7,8] 303M RETFound-MAE-CFP [20,7,8] 303M
Statistical significance was assessed at α = 0.05. See Appendix A.1.4 for detailed statistical methodology.
We present comprehensive results across four distinct eye disease classification tasks: Optical Coherence Tomography (OCT) imaging, and three Color Fundus Photography (CFP) tasks targeting Diabetic Macular Edema (DME), Diabetic Retinopathy (DR), and Glaucoma (GL). For each task, we evaluate the impact of backbone architecture, pretraining strategy, and model size on classification performance.
We evaluated 13 model configurations on OCT classification, with model sizes ranging from 22.8M to 303M parameters. The highest accuracy was achieved by the pretrained ConvNeXtV2-tiny (28.6M parameters) at 97.96% validation accuracy, 99.88% AUROC, and 97.97% F1-score.
Table 2 summarizes the top-performing models. Figure 2 provides a comprehensive comparison of validation metrics across all 13 models.
Pretrained models significantly outperformed those trained from scratch across all metrics (Table 3). Pretrained models achieved mean best validation accuracy of 0.9694 ± 0.0088 (n=9) compared to 0.9176 ± 0.0337 (n=4) for scratch-trained models, representing an absolute improvement of 5.18 percentage points. This difference was statistically significant (independent Mann-Whitney U test, p < 0.05).
Table 2: Top-5 performing models on OCT classification. All top models use pretrained initialization. Acc: Top-1 validation accuracy. AUROC: Area Under the Receiver Operating Characteristic curve, macro-averaged across classes (threshold-independent performance measure). F1: F1-score, macroaveraged across classes (harmonic mean of precision and recall). Avg. Rank: Average rank across the three metrics (lower is better); models ranked separately on each metric, then averaged. Similar patterns were observed for AUROC (pretrained: 0.9987 ± 0.0004 vs. scratch: 0.9924 ± 0.0039) and F1-score (pretrained: 0.9694 ± 0.0088 vs. scratch: 0.9176 ± 0.0338), demonstrating the consistent value of transfer learning for OCT classification.
Figure 1 illustrates these differences across all metrics.
Models were ranked by performance across three key metrics (accuracy, AUROC, F1-score), as shown in Figure 6. The Swin-tiny (pretrained) achieved the best average rank (1.67), followed closely by ConvNeXtV2-tiny (pretrained, rank 2.33). Notably, all top-5 ranked models were pretrained, with pretrained models occupying ranks 1-9 before any scratch-trained model appeared (rank 10).
Parameter efficiency analysis revealed that smaller pretrained models delivered competitive performance relative to their size (Figure 5). The DinoV2-small (22.8M parameters) achieved the highest efficiency metric of 4.20 accuracy points per 100M parameters, with 95.86% validation accuracy. Despite having 13× fewer parameters than the largest models (303M), it achieved 97.9% of the best model’s performance. Among models in the 27-29M parameter range, ConvNeXtV2-tiny and Swin-tiny demonstrated the best balance of size and accuracy, as illustrated in Figure 4.
Pearson correlation analysis revealed no significant linear relationship between model size and performance metrics (accuracy: p = 0.65; AUROC: p = 0.47; F1-score: p = 0.65), demonstrating that larger models do not systematically outperform compact architectures on this OCT classification task.
Pareto frontier analysis identified three objectively optimal models for the accuracy-size trade-off (Figure 3):
Pretrained models dramatically outperformed scratch-trained models on DME (Table 5, Figure 7). Pretrained models achieved mean best validation accuracy of 0.9813 ± 0.0209 (n=8) versus 0.8743 ± 0.0772 (n=4) for scratch models, representing an absolute improvement of 10.70 percentage points (p < 0.05). This advantage substantially exceeds the 5.18% gap observed for OCT, suggesting pretraining provides even greater benefit for CFP-based tasks, likely due to smaller dataset size and more effective ImageNet feature transfer to RGB imaging. Similar large gaps appeared in AUROC (pretrained: 0.9949 ± 0.0128 vs. scratch: 0.9267 ± 0.0588) and F1-score (pretrained: 0.9813 ± 0.0209 vs. scratch: 0.8735 ± 0.0782).
All pretrained models (ranks 1-8) outperformed all scratch-trained models (ranks 9-12), demonstrating consistent pretraining advantage (Figure 12). The DinoV2-small achieved the highest parameter efficiency (4.08 per 100M), delivering 93.01% accuracy with only 22.8M parameters (Figure 11). Pareto frontier analysis identified two optimal models: dinov2-small (22.8M, 93.01% accuracy) and SwinV2-tiny (27.6M, 99.24% accuracy), as illustrated in Figure 9. Figure 10 shows the performance-size trade-offs across all models. Pearson correlation analysis revealed no significant linear relationship between model size and performance (accuracy: p = 0.24; AUROC: p = 0.29; F1-score: p = 0.24), confirming that increased parameter count does not predict higher accuracy for this DME classification task.
Hierarchical architectures (Swin Transformers, ConvNeXt) achieved the highest absolute performance when pretrained. Domain-specific RETFound models reached 99.06% accuracy but were outperformed by the smaller Swin Transformers, suggesting ImageNet pretraining transfers effectively.
The pretraining benefit varied dramatically by architecture: SwinV2-tiny improved by 20. 25 This represents a 26 percentage point decrease compared to OCT performance, reflecting the difficulty of fine-grained 5-class ordinal grading on the highly imbalanced EAM dataset. Table 6 summarizes the top-performing models. Figure 14 provides a comprehensive comparison of validation metrics across all 12 models.
Pretraining remained critically important for DR despite the overall lower performance (Table 7, Figure 13). Pretrained models achieved mean best validation accuracy of 0.6713 ± 0.0289 (n=8) versus 0.4872 ± 0.0807 (n=4) for scratch models, representing an absolute improvement of 18.41 percentage points (p < 0.05). This pretraining advantage (18.41%) substantially exceeds that observed for OCT (5.18%) and DME (10.70%), indicating pretraining is especially valuable for fine-grained ordinal classification tasks with class imbalance.
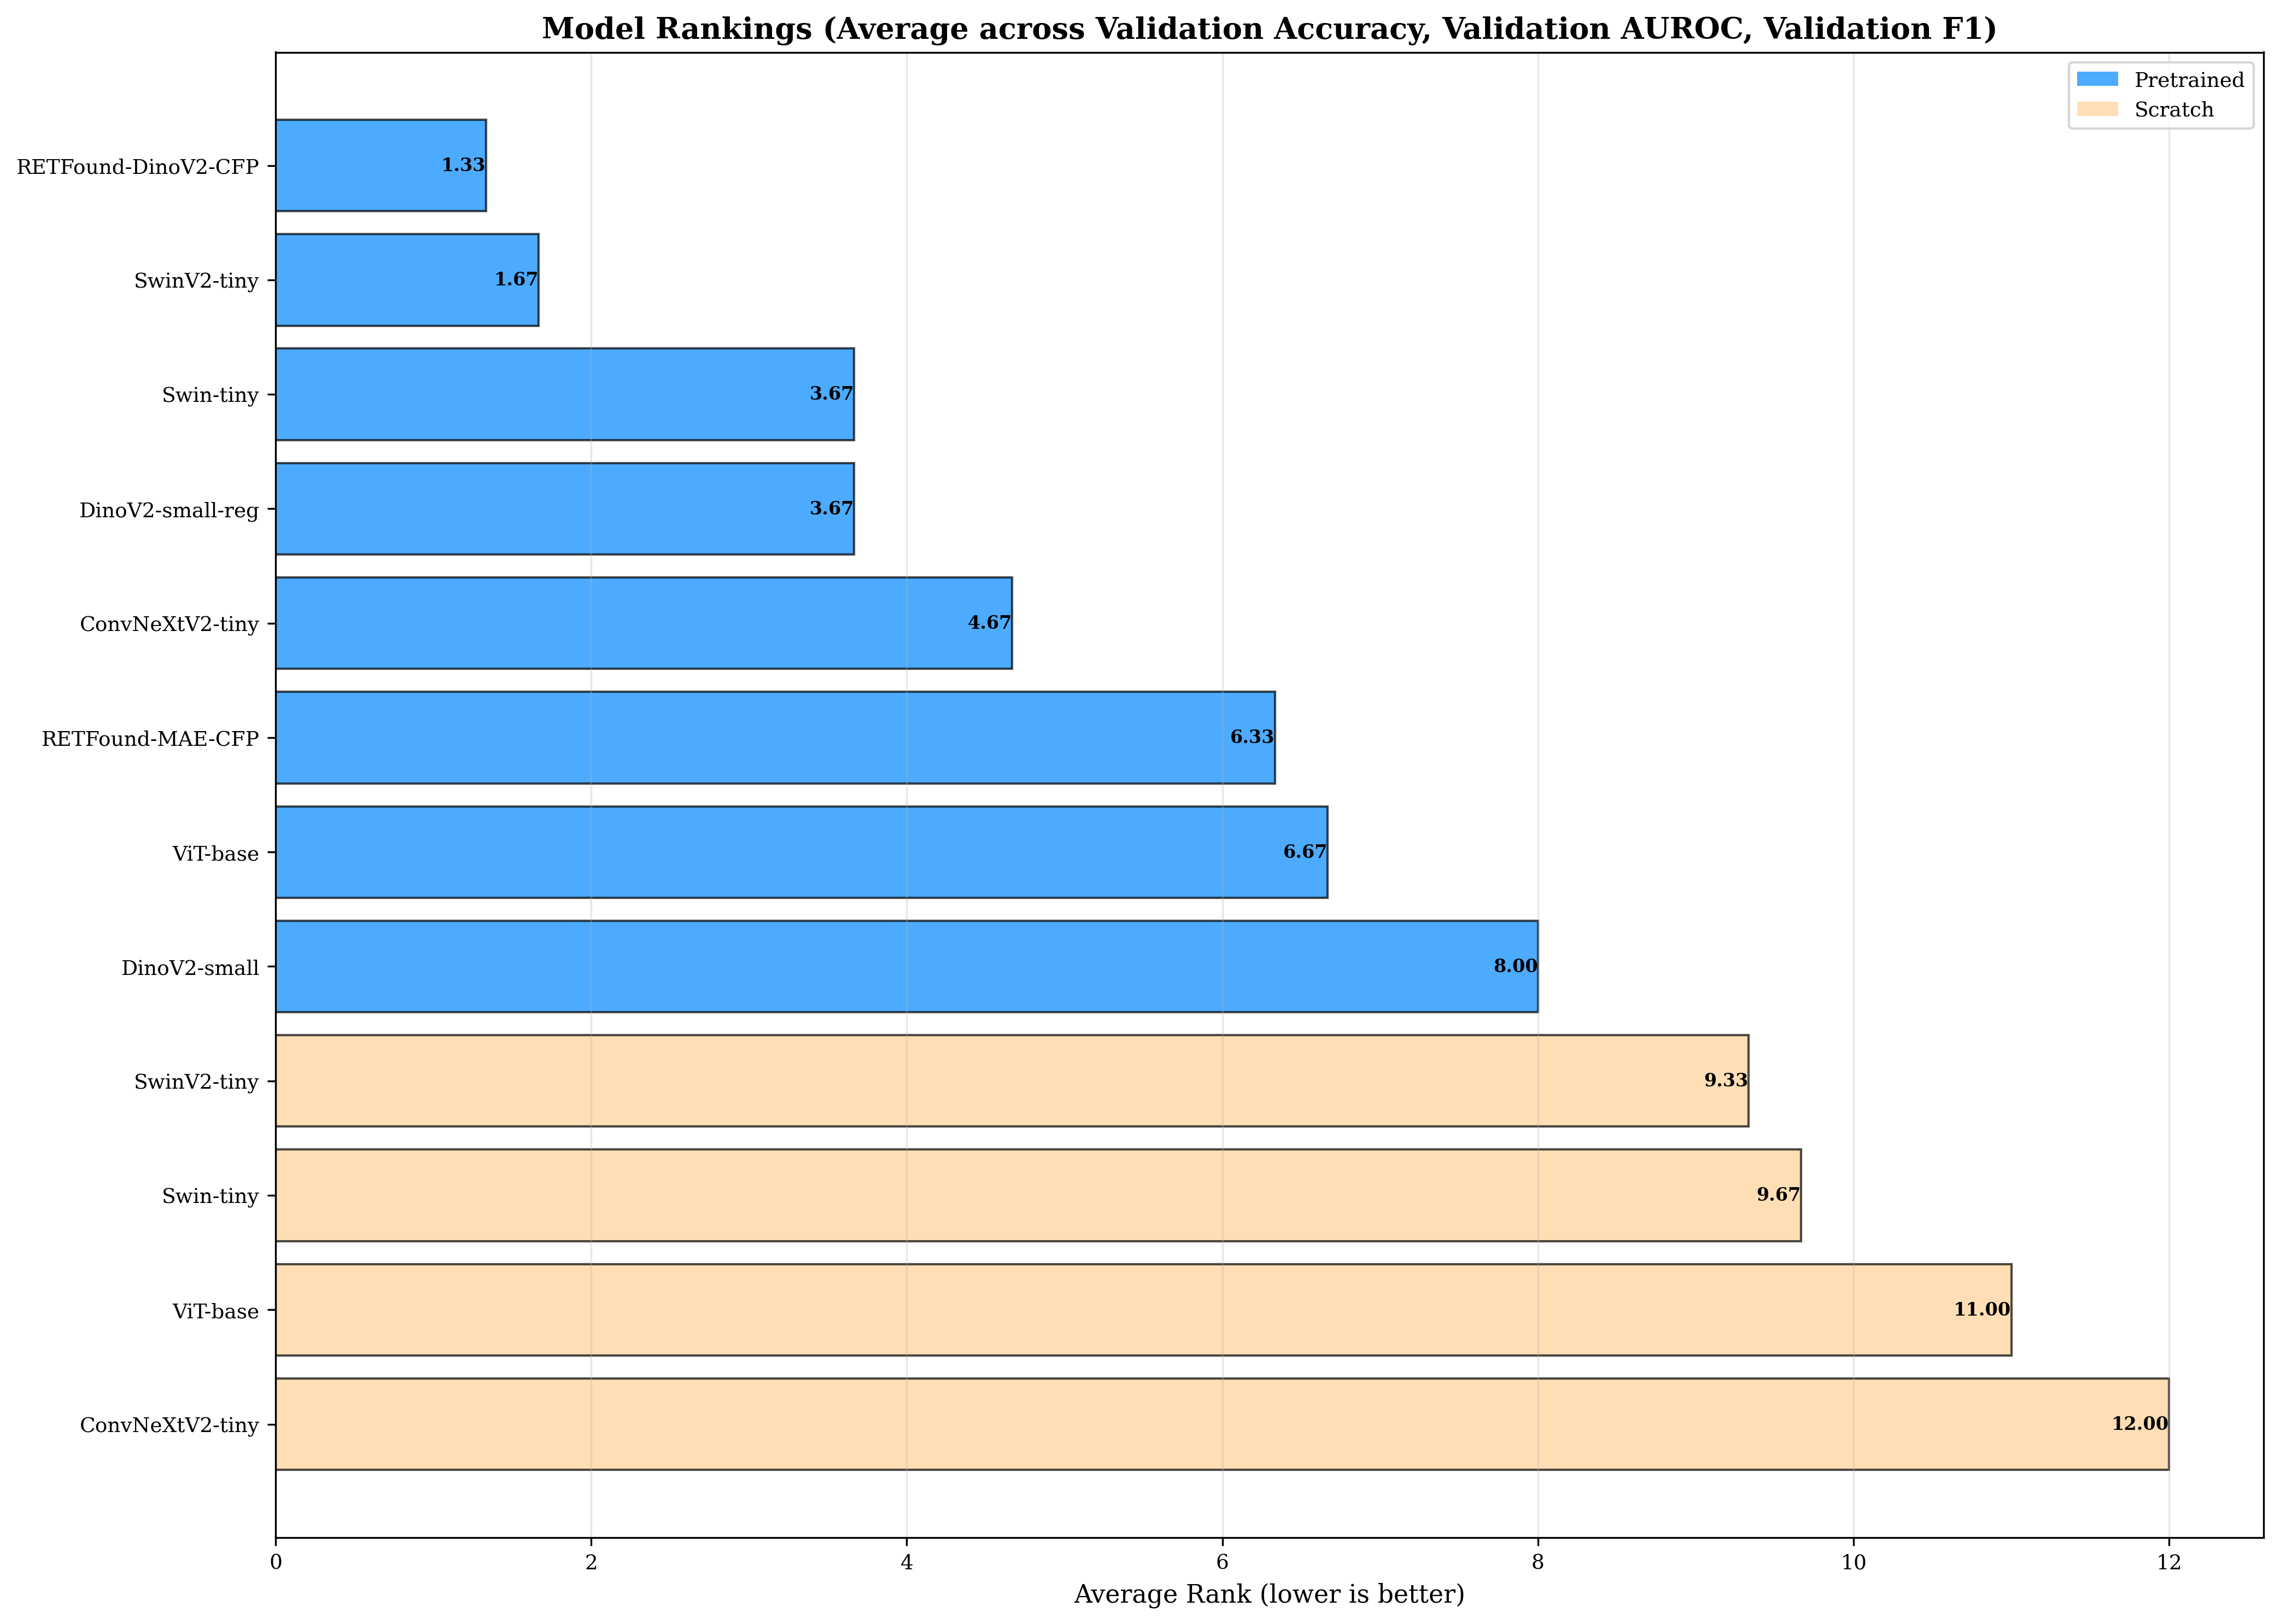
Unlike OCT and DME, domain-specific RETFound-DinoV2-CFP achieved the highest accuracy (71.15%) on DR, outperforming ImageNet-pretrained models. This marks the only task where retina-specific pretraining provided clear advantages over general-purpose ImageNet initialization. All pretrained models (ranks 1-8) again outperformed scratch-trained models (ranks 9-12), as shown in Figure 18. Parameter efficiency analysis identified DinoV2-small (61.81%, 22.8M, efficiency 2.71) as optimal for resource-constrained deployments (Figure 17).
Pareto frontier included three models spanning 22.8M to 303M parameters (Figure 15), with performance-size trade-offs illustrated in Figure 16. Pearson correlation analysis revealed no significant linear relationship between model size and performance (accuracy: p = 0.33; AUROC: p = 0.40; F1-score: p = 0.33), indicating that even for this challenging task, model scale alone does not determine performance.
Hierarchical Swin Transformers maintained strong performance (Swin-tiny: 67.19%, SwinV2-tiny: 69.61%), with SwinV2-tiny ranking second overall despite 11× fewer parameters than RETFound. The pretraining benefit was substantial but varied by architecture: SwinV2 improved by 14.03 percentage points (69.61% vs 55.58% scratch), while ViT-base showed an even larger 23.99 percentage points improvement (65.76% vs 41.77% scratch). The consistently lower absolute performance across all models (compared to OCT/DME) reflects the inherent difficulty of distinguishing subtle ordinal differences in DR severity levels with extreme class imbalance (Class 3: 8.22%). See Appendix A.5 for additional visualizations.
We evaluated 12 model configurations on glaucoma detection across the combined AIROGS and PAPILA datasets (22.8M-303M parameters). The highest accuracy was achieved by Swin-tiny (pretrained, 27.6M parameters) at
Pretrained models substantially outperformed scratch-trained models on glaucoma detection (Table 9, Figure 19). Pretrained models achieved mean best validation accuracy of 0.9066 ± 0.0217 (n=8) versus 0.8154 ± 0.0593 (n=4) for scratch models, representing an absolute improvement of 9.13 percentage points (p < 0.05). This pretraining advantage (9.13%) falls between OCT (5.18%) and the more challenging DME (10.70%) and DR (18.41%) tasks, suggesting that pretraining provides greater value for CFP-based tasks compared to OCT imaging modality, with the benefit scaling with task difficulty. Similar patterns were observed for AUROC (pretrained: 0.9732 ± 0.0099 vs. scratch: 0.9044 ± 0.0143) and F1-score (pretrained: 0.8268 ± 0.0336 vs. scratch: 0.7156 ± 0.0617).
RETFound-DinoV2-CFP and SwinV2-tiny achieved nearly identical top performance (92.57% vs. 93.19%), with SwinV2 delivering slightly higher accuracy despite 11× fewer parameters. All pretrained models (ranks 1-8) outperformed scratch-trained models (ranks 9-12), maintaining the consistent pattern observed across all tasks (Figure 24). Parameter efficiency analysis identified DinoV2-small (87.43%, 22.8M, efficiency 3.83) as optimal for deployment (Figure 23). Pareto frontier analysis highlighted two models: dinov2-small (22.8M) and SwinV2-tiny (27.6M, 93.19%), as shown in Figure 21.
Figure 22 demonstrates the performance-size trade-offs across all models. Pearson correlation analysis revealed no significant linear relationship between model size and performance (accuracy: p = 0.47; AUROC: p = 0.31; F1-score: p = 0.28), further confirming that larger models do not provide systematic advantages for glaucoma detection.
Hierarchical Swin Transformers achieved the highest absolute performance, with SwinV2-tiny ranking first in accuracy (93.19%) and Swin-tiny placing third (92.34%).
Unlike DR, domain-specific RETFound models did not provide clear advantages over ImageNet-pretrained architectures for glaucoma detection, suggesting the optic disc-centered AIROGS/PAPILA imaging may not require specialized retinal pretraining. The pretraining benefit varied substantially: SwinV2 improved by 19.9 percentage points from scratch, while ConvNeXt showed 7.54 percentage points improvement, suggesting hierarchical attention mechanisms benefit more from ImageNet initialization. See Appendix A.6 for additional
To understand how backbone initialization strategies and architectures generalize across different retinal imaging tasks, we compare results across all four datasets: OCT (8-class balanced), DME (3-class CFP), DR (5-class ordinal CFP with severe imbalance), and GL (3-class CFP). This analysis reveals task-dependent patterns in pretraining benefits, architecture robustness, and optimal model selection strategies.
The advantage of pretrained initialization varied substantially across tasks, correlating strongly with task difficulty and imaging modality (Table 10). Pretraining benefits ranged from 5.18 percentage points (OCT) to 18.41 percentage points (DR), with the improvement magnitude inversely related to absolute task performance.
Three key patterns emerged: (1) Imaging modality effects: CFP-based tasks (DME, DR, GL) showed larger pretraining benefits (9.13-18.41%) compared to OCT (5.18%), suggesting that natural image features from ImageNet transfer more effectively to color fundus photography than to grayscale cross-sectional OCT imaging.
(2) Task difficulty scaling: The pretraining advantage increased with task complexity. DR (5-class ordinal with 8.22% severe class) showed the largest benefit (18.41%), while the balanced 8-class OCT task showed the smallest (5.18%).
(3) Variance reduction: Beyond accuracy improvements, pretraining substantially reduced performance variance across models, with scratch-trained models showing 2-4× higher standard deviations.
We assessed architecture robustness by evaluating performance consistency across all four tasks (Table 11).
Microsoft’s Swin Transformer variants demonstrated the most consistent high performance, appearing in the top-3 models for all four datasets. Specifically, Swin-tiny achieved top-2 rankings on three tasks (OCT: rank 1, DME: rank 1, GL: rank 2) and strong performance on DR (rank 2).
ConvNeXt variants showed strong but less consistent performance (mean rank 4.00), excelling on OCT (rank 2) but showing moderate performance on CFP tasks. Domain-specific RETFound models exhibited task-dependent behavior: they achieved top rankings on the most challenging tasks (DR: rank 1, GL: rank 1, DME: rank 2) but underperformed on the easier, balanced OCT classification (rank 6), suggesting that retina-specific pretraining likely provides advantages primarily when fine-grained disease discrimination is required.
Notably, the compact DinoV2-small (22.8M parameters) maintained competitive performance across all tasks despite being 3-13× smaller than
To our knowledge, this study provides the first systematic evaluation of backbone initialization strategies and architectures for retinal disease classification across four distinct imaging tasks, and two imaging modalities. Our comprehensive benchmarking reveals task-dependent patterns in the value of pretraining, architecture selection strategies, and the role of domain-specific initialization, challenging prevailing assumptions in foundation model development.
Findings and Their Implications This contradicts the research assumption that domain-specific foundation models provide universal advantages for medical imaging. The substantial computational investment required for large-scale self-supervised retinal pretraining justifies itself potentially only for the most challenging task (DR severity grading), while general-purpose ImageNet pretraining delivers equivalent performance on three of four tasks.
Our findings highlight cases where specialized, large-scale foundation models are necessary from those where compact, general-purpose models are sufficient:
- Compact models challenge scaling assumptions: Hierarchical transformers (27-29M parameters) like SwinV2-tiny achieve top-2 performance on three of four tasks, questioning whether the computational investment in 300M+ parameter foundation models yields proportional benefits for most retinal imaging applications.
Specialized retinal foundation models (RETFound, 303M) outperform general-purpose ImageNet initialization only for the most challenging ordinal grading task (DR). For three of four tasks, ImageNet pretraining delivers equivalent or superior performance at 10× smaller model size, suggesting the drive toward domain-specific foundation models may be overestimated.
The extreme class imbalance and fine-grained discrimination required for DR severity grading represents the boundary case where specialized pretraining may justify its cost. More tractable clinical tasks achieve near-optimal performance with compact general-purpose models.
CFP-based applications benefit more from pretraining investments (9.13-18.41% gains) than OCT applications (5.18%), suggesting resource allocation strategies should account for imaging modality characteristics rather than assuming uniform foundation model requirements.
This study provides the first comprehensive benchmarking of backbone initialization strategies and architectures across multiple retinal imaging modalities and disease classification tasks.
Through systematic evaluation of 13 model configurations on four distinct datasets (OCT, DME, DR, GL), we challenge prevailing research assumptions about foundation model development for medical imaging.
Our key findings demonstrate that pretrained initialization provides universal benefits, with accuracy improvements ranging from 5.18% to 18.41% depending on task difficulty and imaging modality. Critically, the pretraining advantage scales with task complexity. Challenging ordinal classification with class imbalance (DR) benefits most from pretrained features, while balanced multi-class tasks (OCT) show smaller but still significant improvements.
Color fundus photography tasks showed consistently larger pretraining benefits than OCT imaging, indicating that ImageNet’s natural image statistics transfer more effectively to RGB fundus photographs.
Our hypothesis was confirmed: contrary to prevailing trends toward ever-larger models, we found that compact hierarchical architectures (27-29M parameters) dominated Pareto frontiers across all tasks.
Microsoft’s SwinV2-tiny achieved top-2 performance on all four datasets, while the 22.8M-parameter DINOv2-small delivered 93-97% of best-model accuracy at 3-13× smaller size.
This fundamentally challenges the research assumption that larger foundation models provide proportional performance gains, demonstrating that compact architectures achieve near-optimal results without massive computational infrastructure investments. Domain-specific retinal pretraining showed task-selective value, achieving top performance only on the most challenging task (DR severity grading) while providing no advantages over ImageNet pretraining for more tractable problems. This suggests that the substantial computational investment required for large-scale self-supervised retinal pretraining is justified primarily when fine-grained pathology discrimination is critical, not as a universal strategy.
Our findings contradict three prevailing research assumptions:
( The task-dependent patterns we identify (when compact models suffice, when domain-specific pretraining justifies its cost, and which architectural inductive biases transfer effectively) provide an evidence base for resource allocation decisions in medical imaging AI. As the field advances toward multi-task learning and hybrid architectures, systematic benchmarking across task characteristics will be essential for distinguishing genuine architectural advances from incremental scaling of computational resources.
This section provides comprehensive experimental details expanding on the compact Methods section in the body of the paper.
The Retinal OCT Image Classification -C8 dataset provides 24,000 images across 8 disease categories with perfect class balance (2,300 training, 350 validation, 350 test images per class). We used the provided splits without modification [29].
We used the EAM unified diabetic retinopathy dataset, which combines EyePACS, APTOS, APTOS (Gaussian Filtered), and Messidor datasets with manual data augmentation (increasing dataset size by approximately 55%) and standardized resizing to 600x600 pixels.
The dataset applies the International Clinical Diabetic Retinopathy (ICDR) severity scale for 5-class grading (0: No DR, 1: Mild NPDR, 2: Moderate NPDR, 3: Severe NPDR, 4: Proliferative DR). The dataset exhibits significant class imbalance with Class 3 (Severe) representing 8.22% of images. We used the provided stratified 80/10/10 split preserving ordinal severity relationships [30].
We combined IDRiD (516 images) and Messidor-2 (1,748 images) with compatible 3-class severity labels (Grade 0: No DME, Grade 1: Mild DME with distant hard exudates, Grade 2: Severe DME with hard exudates near macula). Stratified 70/15/15 splitting ensured balanced representation across clinical sources [31,32].
We combined AIROGS (113,893 population screening images) and PAPILA (488 bilateral diagnostic images) into a unified 3-class dataset. AIROGS binary labels (0: non-referable, 1: referable glaucoma) and PAPILA 3-class labels (0: non-glaucomatous, 1: glaucomatous, 2: suspect) were mapped to a shared label space {0, 1, 2}. Stratified 70/15/15 splitting maintained representation from both screening and diagnostic contexts [33,34].
To ensure reproducibility and fair comparison across all models and datasets, we developed a unified training platform implementing consistent training procedures, optimization configurations, and evaluation protocols.
All models were trained using the AdamW optimizer [21] with cosine learning rate schedules [35] including warmup phases.
Learning rates were tuned per-model and initialization strategy based on preliminary experiments (Table 13).
Weight decay was set to 0.05 for all configurations, with proper handling to exclude bias and LayerNorm parameters from regularization, which is critical for transformer model stability [36].
To maintain computational fairness across models with different memory requirements, we employed gradient accumulation to achieve a consistent effective batch size of 256 across all experiments. Physical batch sizes were set to 64 for most models, with 48 for models using 256×256 input resolution (SwinV2-tiny). Gradient accumulation steps were computed as ⌈256/batch_size⌉, ensuring identical optimization dynamics regardless of GPU memory constraints.
Stability Measures: Three mechanisms ensured stable training:
(1) Mixed-precision training [39] with bfloat16 autocasting reduced memory usage while maintaining numerical stability compared to float16.
(2) Gradient clipping [40] with maximum norm 1.0 prevented exploding gradients, especially critical for scratch-trained transformers. (3) Learning rate warmup over 10% of total training steps enabled smooth optimization initialization, preventing early training instability observed in preliminary experiments without warmup [41,42,43].
Training Duration and Checkpointing: All models trained for up to 100 epochs. We monitored validation accuracy and saved checkpoints for: (1) [37,38], pretrained models use lower learning rates to preserve learned representations, while from-scratch models tolerate higher rates. All rates within standard ranges for AdamW optimization of vision transformers.
ViT Loss Function: Cross-entropy loss [44] was used across all experiments without class weighting or focal loss modifications. This provides a consistent optimization objective, with performance differences attributable solely to architecture and initialization rather than task-specific loss engineering.
Computational Setup: All experiments were conducted on NVIDIA GPUs with CUDA support.
Batch processing leveraged asynchronous data loading with 8 workers, prefetch factor of 4, and persistent workers to maximize GPU utilization. cuDNN benchmark mode was enabled to auto-select optimal convolution algorithms per model.
Training times ranged from 2-8 hours per 100-epoch run depending on model size and dataset.
Accuracy (Acc): Top-1 classification accuracy, computed as the proportion of correctly classified samples. Range: [0, 1], higher is better.
Operating Characteristic curve [22,23], macro-averaged across classes. This Notably, the compact DinoV2-small ranks 8th among pretrained models (vs 5th-6th on other tasks), indicating that small architectures struggle more. This ranking pattern reveals the boundary case where specialized foundation models justify their computational cost: only for fine-grained severity discrimination under extreme class imbalance do 300M+ parameter retina-specific models provide demonstrable advantages over compact general-purpose alternatives. for GL screening with limited resources, compact DinoV2-small offers excellent value; for maximum accuracy clinical settings, SwinV2-tiny provides near-optimal performance without 300M+ parameter computational burden.
Figure 24: GL: Aggregate model rankings for glaucoma detection. RETFound-DinoV2-CFP and SwinV2-tiny achieve nearly identical top average ranks (1.67 vs 2.00), but SwinV2-tiny achieves higher absolute accuracy (93.19% vs 92.57%) at 11× smaller size. The ranking stratification remains absolute: all eight pretrained models occupy ranks 1-8, while all four scratch-trained models occupy ranks 9-12, maintaining the consistent pattern observed. Unlike DR where RETFound ranked first, the GL rankings show that compact general-purpose models match specialized domain-specific models, indicating that retina-specific pretraining provides no systematic advantage for this 3-class glaucoma detection task. The compact DinoV2-small ranks 6th among pretrained models (similar to DME and OCT), demonstrating adequate but not optimal performance for moderate-difficulty CFP tasks.
93.19% validation accuracy, 98.06% AUROC, and 84.75% F1-score. Performance fell between DME (very high) and DR (challenging), reflecting moderate task difficulty in this 3-class glaucoma detection task. Table8summarizes the top-performing models. Figure20provides a comprehensive comparison of validation metrics across all 12 models.
93.19% validation accuracy, 98.06% AUROC, and 84.75% F1-score. Performance fell between DME (very high) and DR (challenging), reflecting moderate task difficulty in this 3-class glaucoma detection task. Table8summarizes the top-performing models. Figure20
93.19% validation accuracy, 98.06% AUROC, and 84.75% F1-score. Performance fell between DME (very high) and DR (challenging), reflecting moderate task difficulty in this 3-class glaucoma detection task. Table8summarizes the top-performing models. Figure
93.19% validation accuracy, 98.06% AUROC, and 84.75% F1-score. Performance fell between DME (very high) and DR (challenging), reflecting moderate task difficulty in this 3-class glaucoma detection task. Table8
93.19% validation accuracy, 98.06% AUROC, and 84.75% F1-score. Performance fell between DME (very high) and DR (challenging), reflecting moderate task difficulty in this 3-class glaucoma detection task. Table
top models. It achieved parameter efficiency values of 4.20 (OCT), 4.08 (DME), 2.71 (DR), and 3.83 (GL) accuracy per 100M parameters, demonstrating that smaller models can deliver strong performance relative to their size.
RETFound-MAE-CFP iszt/RETFound_mae_mehRetinal images (MAE)
📸 Image Gallery