Tubular trees, such as blood vessels and lung airways, are essential for material transport within the human body. Accurately detecting their centerlines with correct tree topology is critical for clinical tasks such as diagnosis, treatment planning, and surgical navigation. In these applications, maintaining high recall is crucial, as missing small branches can result in fatal mistakes caused by incomplete assessments or undetected abnormalities. We present RefTr, a 3D image-to-graph model for centerline generation of vascular trees via recurrent refinement of confluent trajectories. RefTr uses a Producer-Refiner architecture based on a Transformer decoder, where the Producer proposes a set of initial confluent trajectories that are recurrently refined by the Refiner to produce final trajectories, which forms the centerline graph. The confluent trajectory representation enables refinement of complete trajectories while explicitly enforcing a valid tree topology. The recurrent refinement scheme improves precision and reuses the same Refiner block across multiple steps, yielding a 2.4× reduction in decoder parameters compared to previous SOTA. We also introduce an efficient non-maximum suppression algorithm for spatial tree graphs to merge duplicate branches and boost precision. Across multiple public centerline datasets, RefTr achieves superior recall and comparable precision to previous SOTA, while offering faster inference and substantially fewer parameters, demonstrating its potential as a new state-of-the-art framework for vascular tree analysis in 3D medical imaging. The code is available at https://github.com/RomStriker/RefTr.
Vascular trees, including blood vessels, airways, and lymphatic structures, are critical for transporting essential substances throughout the body, and abnormalities in these networks are linked to many diseases. Accurate and topologically correct centerlines are important for applications such as diagnosis and treatment planning [6,11], hemodynamic modeling [10], interventional planning [4], vascular morphometry [5], and disease assessment [3]. Centerline graphs provide a compact and interpretable representation of these trees, are easier to annotate than dense masks, and more effective enforcement of valid tree topology.
Existing methods for centerline extraction fall into three groups: (1) segmentation followed by skeletonization [2,19], (2) point detection followed by edge prediction [15,17], and (3) sequential breadth-first tracking [13,14]. Segmentation methods require dense segmentation masks and often produce disconnected components or cycles. Pointand-edge detection methods similarly do not guarantee valid tree topology. Sequential tracking methods, on the other hand, suffer from low recall due to their reliance on highly imbalanced classification of bifurcation nodes.
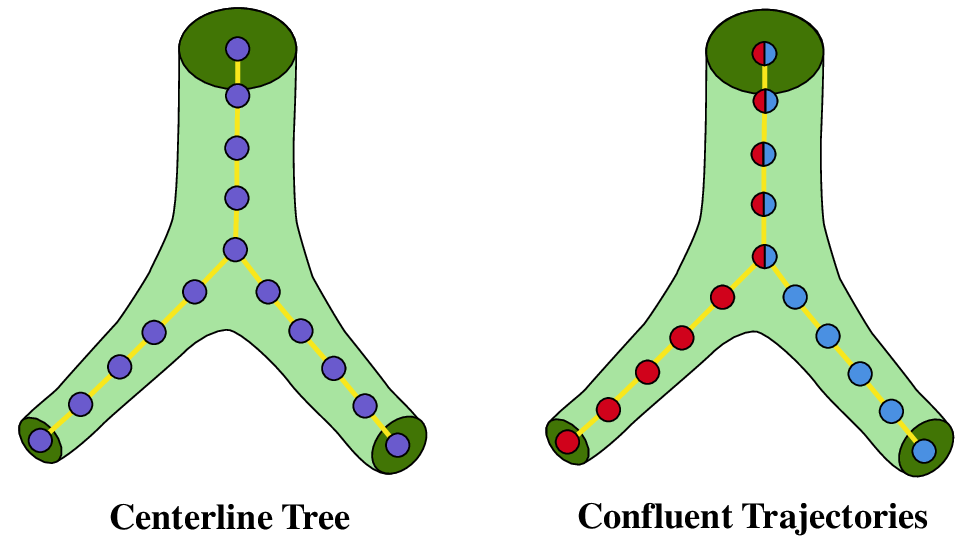
To address these limitations, we propose RefTr, a Transformer [20] decoder based model with a Producer-Refiner architecture. Given a 3D patch, the Producer uses learned token sets to propose multiple fixed-length trajectories rooted at the patch center. The number of proposals is set to be larger than the number of true branches and a Manyto-One matching strategy assigns several proposals to each ground-truth branch. The Refiner then recurrently aligns these proposals to the target branches. Each pair of trajec-tories remains confluent (flows together) until a divergence point, after which they separate as shown in Figure 1). The model predicts a divergence position for each pair of trajectory and an end position for each trajectory, and together the represent the final centerline tree graph.
Sequential methods classify each centerline node as intermediate, bifurcation, or end node at every step. This classification problem is highly imbalanced and even a single error can lead to missed or premature branches. RefTr avoids this issue by predicting bifurcations and terminations at the trajectory level, which produces more stable outputs. Reusing the same Refiner block across multiple refinement steps also reduces decoder parameters by 2.4× compared to Trexplorer Super [14], a major advantage when working with large 3D volumes. Many-to-One matching further provides an implicit ensembling effect by allowing multiple trajectories to contribute to each target branch.
To suppress duplicates and improve precision, we introduce Tree Non-Maximum Suppression (TNMS), an efficient NMS algorithm for spatial tree graphs. Together with divergence prediction head, TNMS preserves topological consistency while removing redundant branches.
Finally, we extend Trexplorer Super’s evaluation framework by introducing radius-aware thresholds that scale with the ground-truth vessel radius. We report performance averaged across multiple thresholds, which accounts for anatomical variability and produces more reliable comparisons than fixed thresholds.
Our main contributions are: • A parameter-efficient 3D image-to-graph model, RefTr, that uses recurrent refinement and trajectory-level predictions to achieve higher recall while maintaining state-ofthe-art precision. • Tree Non-Maximum Suppression (TNMS), an efficient algorithm for merging duplicate branches while preserving correct tree topology. • Radius-aware evaluation thresholds for point-and branch-level metrics, enabling fair comparisons across anatomically diverse datasets.
Traditional model-based approaches extract hand-crafted features and apply explicit rules for tree generation [26,27]. These methods are sensitive to parameter choices, and generalize poorly.
Segmentation-based methods [2,19] first predict dense vessel masks and then skeletonize them. This requires costly voxel-level annotations and still does not guarantee correct topology, often producing fragmented or disconnected cen-terlines. Skeletonization itself is non-trivial and typically involves complex post-processing. In contrast, image-tograph models, including ours and prior baselines, require only centerline graphs for training and evaluation, which are far easier to annotate. The reliance on dense segmentation masks is the main reason these methods are not included in our comparison.
Vesselformer [15] and Relationformer [17] detect centerline points and then infer edges using DETR-style transformers [1]. Although simpler than segmentation pipelines, these methods often produce disconnected graphs or cycles, and their quadratic edge prediction cost limits scalability for dense vascular trees.
Sequential generation methods generate centerlines iteratively in a breadth-first manner. Reinforcement learning approaches [7,24,25] are difficult to train and limited by discretization of the 3D space. Trexplorer [13] and Trexplorer Super [14] introduce transformer-based sequential tracking with object queries. However, they suffer from low recall due to high imbalanced node-level classification of bifurcation and end nodes which represent less than 1% of training examples. The strictly sequential design also prevents correction of earlier errors. In contrast, our proposed RefTr completely avoids nodelevel classification, directly predicts confluent trajectories, and refines them recurrently. By allocating multiple trajectories to each target, it creates an ensembling effect and predicts both divergence (bifurcation) and end positions at the trajectory level, resulting in higher performance, a simpler and more efficient architecture, and more reliable outputs.
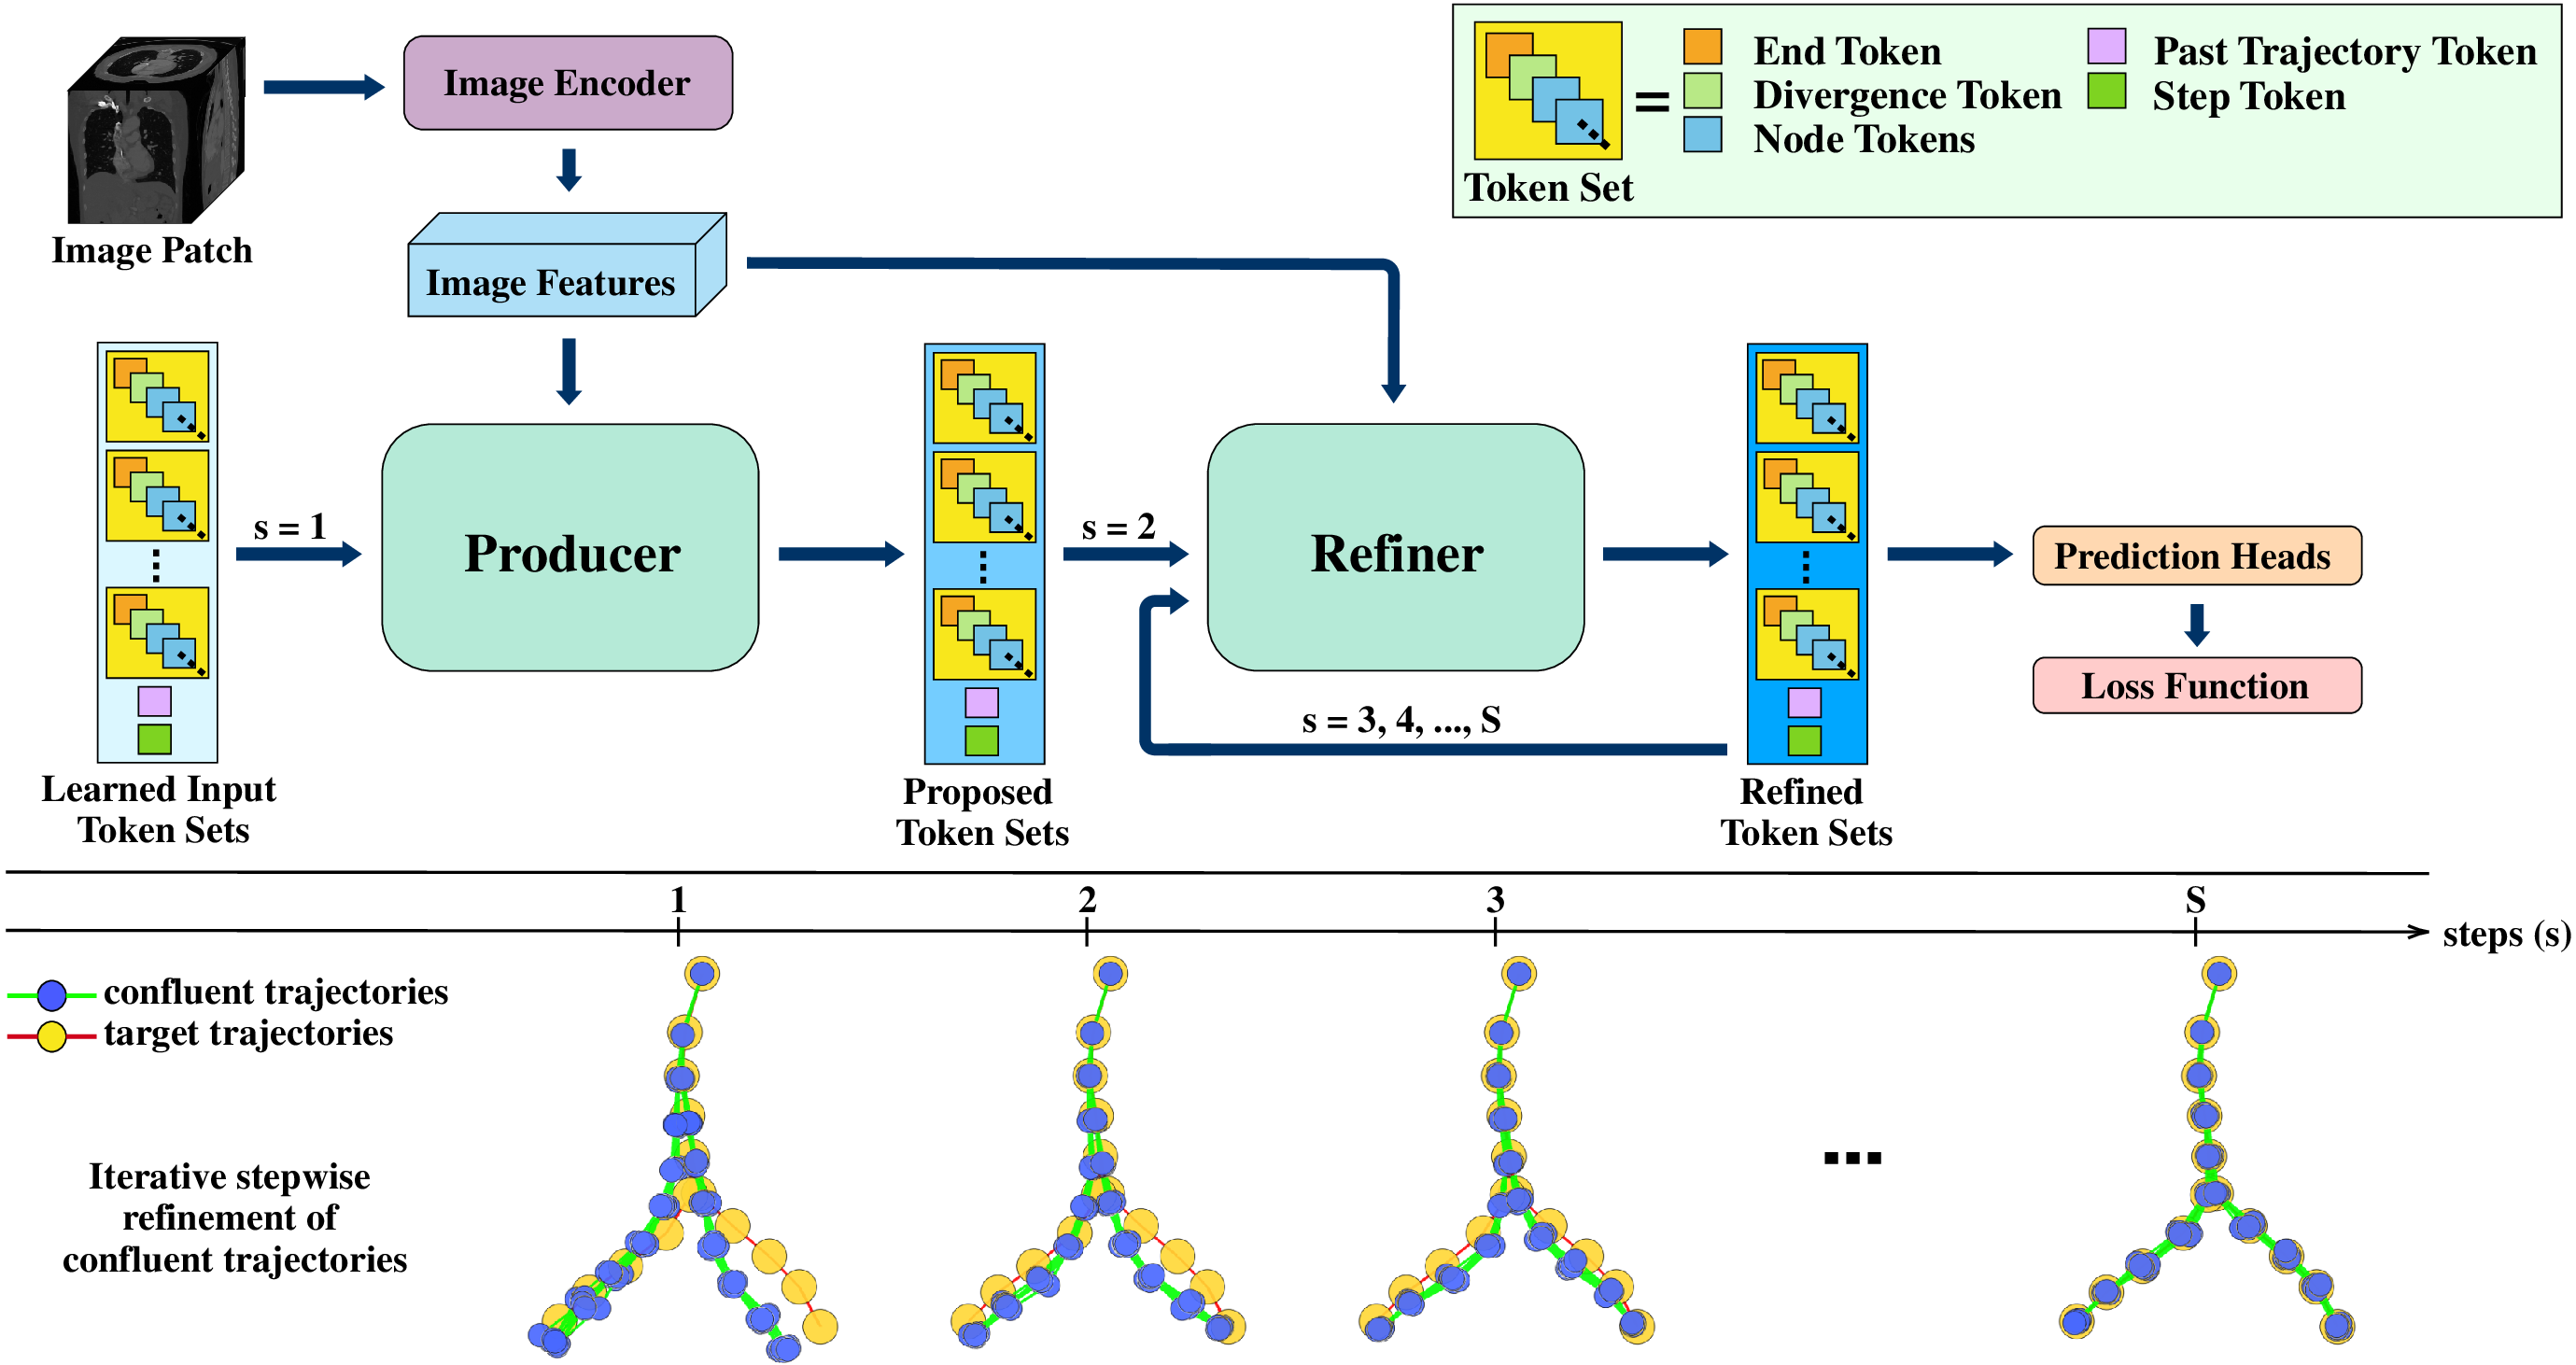
RefTr is a Transformer decoder-based model for generating centerline graphs of vascular trees from 3D medical images. It represents the centerline graph using a set of confluent trajectories, along with pairwise divergence positions and individual end positions, as illustrated in Figure 1. The model architecture consists of an image encoder, two customized Transformer decoder blocks, the Producer and the Refiner, and prediction heads that transform token set embeddings into output trajectories. The overall architecture is shown in Figure 2. In the following sections, we detail the formulation, architecture, and training procedure of our model.
The objective is to infer a centerline tree graph G = (V, E), representing a vascular tree in a 3D medical image such as a CT scan. Each node v ∈ V is defined by a spatial location Given an input patch, RefTr predicts an intermediate representation of G as a set of confluent trajectories T = {T 1 , . . . , T N } as shown in Figure 1. Each trajectory T i is a sequence of L ordered nodes, T i = {v This confluent trajectory representation compactly encodes both geometry and topology of the vascular tree structure. A post-processing step converts it into the tree graph G = (V, E) representation.
RefTr consists of four key components: an image encoder, Producer, Refiner, and prediction heads.
For a fair comparison with the previous SOTA model Trexplorer Super [14], we use the same modified Swin-UNETR [18] as our encoder. SwinUNETR is a hierarchical transformer-based UNet designed for 3D medical volumes. It uses shifted window attention to maintain computational efficiency while enabling long-range context propagation. It encodes input patches of size 64 × 64 × 64 into a feature map of size 16 × 16 × 16 × 512.
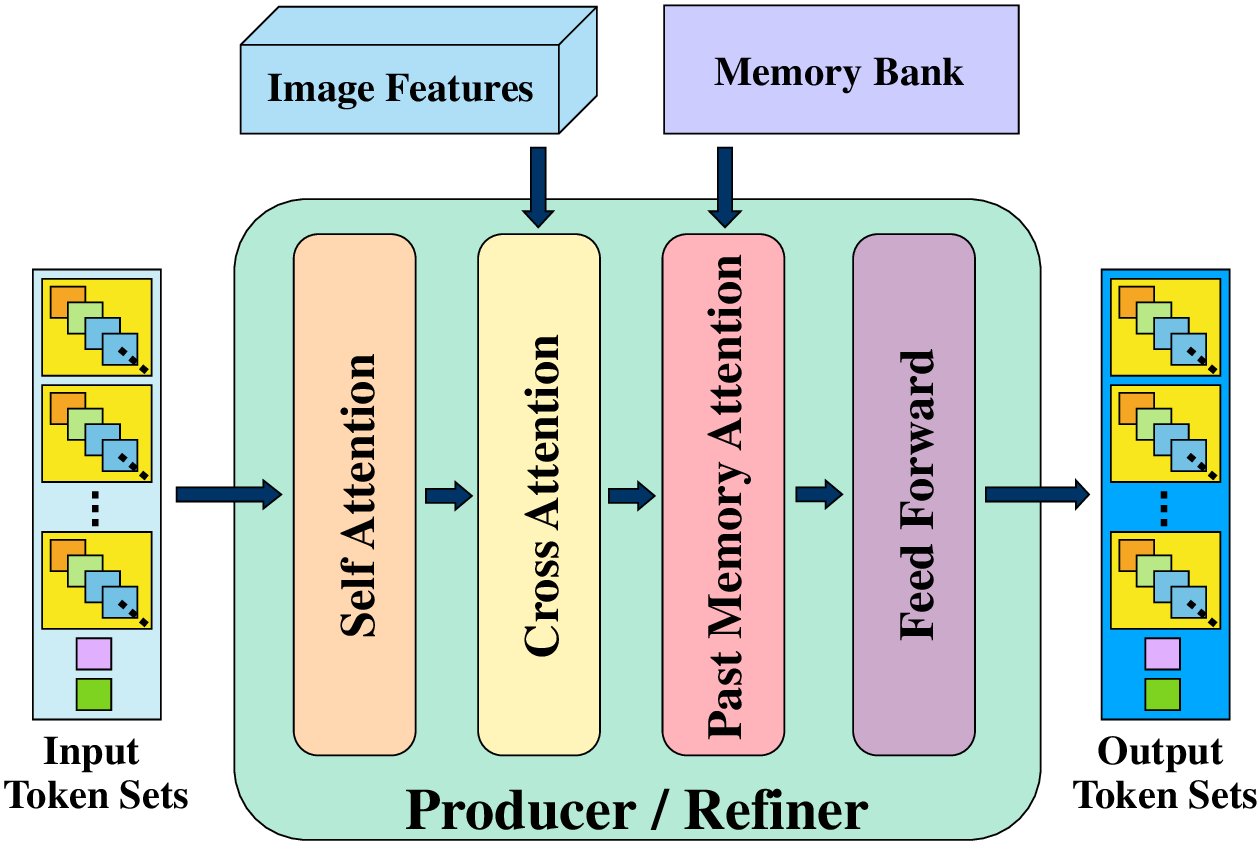
The Producer and Refiner use a customized Transformer decoder architecture. Each decoder block consists of a self-attention layer, a cross-attention layer, a past-memory attention layer, and a feed-forward layer, as shown in Figure 3. The decoder input consists of learned tokens organized into n trajectory token sets, each containing L node tokens, one end token, and one divergence token. Node tokens predict position and radius, the end token predicts the end position, and paired divergence tokens predict the divergence positions.
The self-attention layer enables both intra-and intertoken set attention, allowing the model to effectively associate n proposed trajectories with m target branches. Crossattention aggregates information from the 3D image features, while an additional past memory attention layer attends to token sets of the ancestor trajectories from the last five processed patches stored in the memory bank, improving long-range trajectory reasoning.
The Producer uses learned token sets, image features, and past memory to propose initial trajectories. The Refiner then recurrently refines these trajectories over S -1 steps to align them with target branches. Reusing the same Refiner block across all steps reduces the decoder parameter count by 2.4× compared to the previous SOTA Trexplorer Super, which uses six independent decoder blocks.
At each decoding step, the model predicts structural attributes of the centerline trajectories as follows:
• Node positions
x(l,s) We compute the divergence and end positions only after the last refinement step.
At inference time, the model takes as input a 3D patch centered at the root and predicts a set of confluent trajectories T . For each trajectory, it identifies the end position and predicts divergence position relative to other trajectories. These outputs are then converted into a centerline tree G by creating bifurcations at the divergence positions and leaf nodes at the end positions.
If any branch does not terminate within trajectory length L, a new patch is extracted centered at the last predicted node of that branch. This process is repeated recursively until all branches have been explored and the complete vascular tree structure is generated.
Tree Non-Max Suppression (TNMS) is an efficient algorithm that merges overlapping branches in predicted trees to ensure topological consistency. While the model’s divergence head resolves many duplicates, TNMS handles any remaining overlaps.
Given a directed tree G = (V, E) with 3D positions and radii at each node, TNMS performs a top-down (pre-order) traversal from the root. It maintains a list of visited nodes and uses a KD-tree for fast spatial queries. The spatial threshold for matching is adaptive, scaled by each node’s radius using a factor τ pos = 0.3, with a minimum threshold τ min = 2.0. Nodes within this threshold of visited nodes are flagged as duplicates. Hyperparameters were selected via simple grid search, and the radius-aware threshold allows TNMS to handle vascular trees of varying sizes.
Branches with a significant fraction of flagged nodes (above a threshold ρ = 0.2) are marked for merging. Duplicate nodes are grouped and replaced by a single node, and cycles are removed by keeping only the edge closest to the root. The procedure is summarized in Algorithm 1.
TNMS is fast and scalable. It requires a single traversal, uses sublinear KD-tree lookups, and compares each node only to earlier nodes, yielding O(N log N ) complexity for N nodes. Merging and cycle resolution are lightweight, allowing TNMS to process graphs with thousands of nodes in under a second on CPU.
Given n predicted trajectories T = { Ti } n i=1 and m target paths T = {T j } m j=1 , we compute a matching from predictions to targets based on a cost matrix C ∈ R n×m . Each entry C i,j reflects the cost of matching predicted trajectory Ti to target trajectory T j , and is defined as a weighted sum of position and radius cost:
where:
and λ • are the weight coefficients to balance the contributions of each cost component.
To ensure consistent supervision, the matching is computed only once using the predictions from the first decoding step. This fixed assignment is reused for all remaining S -1 steps during loss computation. Keep only the edge from the parent closest to the root 19: end for 20: return G
We choose n > m, and enable many-to-one matching by replicating the target set to form a square cost matrix C ∈ R n×n . This allows us to use the Hungarian algorithm to perform bipartite matching between the n predicted and n (replicated) target trajectories:
where S n denotes the set of all permutations over n elements, and σ * is the permutation that minimizes the total cost. Since the target trajectories are replicated, we recover the index of the original (non-replicated) target trajectory via modulo indexing:
where ĵi denotes the assigned target trajectory index for the i-th predicted trajectory.
Let ĵi denote the target trajectory assigned to predicted trajectory i. For each decoder step s = 1, . . . , S, we define the position and radius losses as:
The end loss and divergence loss are computed only at the final decoding step s = S, where the predicted trajectories are most refined. The end loss is defined as
To compute the divergence loss, we reorder the target divergence matrix to align with the assigned targets:
The divergence loss is then:
The overall loss aggregates the position and radius losses across all steps, and adds the end and divergence losses from the final step:
where α • are scalar weights used to balance the contributions of each loss component.
We adopt the training strategy proposed in Trexplorer Super [14] to efficiently train on long trajectory sequences and enhance contextual reasoning from past information. Each training sample consists of a long trajectory with 55 nodes, which is divided into a sequence of six overlapping trajectories of 10 nodes each (using a sliding window of size 10 and stride 9). Each trajectory is paired with a 3D volume patch centered at its starting node. The model is trained sequentially over these trajectories. For each trajectory, it receives:
• the corresponding 3D image patch,
• a memory bank containing up to five token sets, each representing an ancestor trajectory that encodes the direct parent trajectory of the current starting point within previous image patches,
• a past trajectory token, a linear projection of up to S previous node positions and radii, and • a step token, indicating the current refinement step. Using these inputs, the model predicts the confluent trajectories over S refinement steps, along with divergence and endpoint positions for the final step. The total training loss is accumulated as defined in Equation 11.
For the first trajectory of the sequence, the memory bank is empty, and past context is provided by the past trajectory token. As training progresses, the model updates the memory bank with embeddings from previously predicted ancestor trajectories. To reduce memory consumption, gradient flow is stopped between consecutive trajectories. This sequential training process is repeated for all six trajectories in each sample.
We evaluate our method using the benchmark centerline graph datasets introduced in Trexplorer Super [14]. These include centerline graph annotations for: (1) a synthetic dataset, (2) the Airway Tree Modelling Challenge 2022 (ATM ‘22) dataset [16,[21][22][23]28], and (3) the Pulmonary Artery Segmentation Challenge 2022 (Parse 2022) dataset [9]. These datasets provide a diverse evaluation setting across synthetic, airway, and vascular anatomies. All datasets are publicly available on Zenodo [12].
For consistency with past work [14], we report both nodelevel and branch-level metrics. However, accurate centerline evaluation requires metrics that account for anatomical variability and localization uncertainty. The fixed 1.5-voxel threshold used by Trexplorer Super to match predicted and ground-truth points can disproportionately penalize predictions near large vessels and may encourage overfitting. To address this, we propose radius-aware thresholds τ rad scaled by the ground-truth vessel radius (r), resulting in final threshold of max(1.5, τ rad • r). A predicted node is a true positive if it falls within this threshold of an unmatched target node. The fixed lower bound of 1.5 voxels is chosen to match the minimum vessel radius of 1 with a small buffer of 0.5, to avoid false positives on thin vessels.
We evaluate node-level metrics, precision, recall and F1, using τ rad ∈ [0.25, 0.75] with 0.05 increments and report their average indicated by radius-aware Average Precision (rAP), Average Recall (rAR), and Average F1-score (rF1) @ τ rad = [0.25:0.05:0.75]. This strategy, inspired by object detection metrics like mean Average Precision [8], reduces sensitivity to threshold choice, improves robustness across vessel sizes, and provides a fairer and clinically meaningful performance comparison. For branch-level metrics, we fix τ rad = 0.5 to reduce computational cost. According to Trexplorer Super, a predicted branch is considered a true positive if it overlaps with at least 80% of an unmatched target branch’s nodes within the matching threshold. However, this criterion penalizes cases where multiple predictions collectively cover a single target branch, overcounting false positives and underestimating performance. To address this, we redefine the criterion: a predicted branch is counted as a true positive if it overlaps with at least τ match fraction of nodes from any unmatched target centerline segment within the threshold. This relaxation allows partial matches to be recognized while maintaining meaningful correspondence. Because a fixed τ match = 0.8 does not reflect performance across varying match levels, we evaluate over a range of thresholds τ match ∈ [0.5, 0.9] with increments of 0.05, and report the averaged branch-level metrics: rBAP, rBAR, and rBF1@ τ match = [0.5:0.05:0.9].
We omit graph-level metrics because RefTr, like Trexplorer and Trexplorer Super, always produces a valid tree structure, meaning a single connected component without cycles. In contrast, Vesselformer does not guarantee a tree topology, as noted in the Trexplorer Super evaluation.
All experiments were conducted on a single compute node equipped with four NVIDIA A100 GPUs, utilizing mixedprecision training to improve efficiency. The key hyperparameters used for training are provided in Table 1.
For fair comparison with Trexplorer and Trexplorer Super [13,14], we computed the updated evaluation metrics on the test results provided by the authors. For Vesselformer [15], the best result was obtained for hyperparameters published by the authors with 80 object tokens and 12 million training iterations.
Table 2 presents point-and branch-level metrics for Vesselformer, Trexplorer, Trexplorer Super, and our method RefTr on three benchmark datasets: Synthetic, ATM'22, 3 lists parameters and per-patch runtimes.
RefTr achieves the highest recall across all datasets while maintaining comparable precision, resulting in the best
RefTr shows lower branch-level scores than Trexplorer Super, due to its recall bias. The model tends to bifurcate earlier than the annotated centerlines, which often branch later, to not miss any new branches. While this leads to structural differences, both topologies are anatomically valid, especially in thicker vessels where bifurcation locations are ambiguous. However, this results in lower branch-level metrics at higher thresholds. Supplementary material provides qualitative examples of this behavior.
We perform an ablation study to assess the contribution of three key components of our model: Recurrent Refinement (RR), Many-to-One Matching (MOM), and Tree Non-Max Suppression (TNMS). Table 4 reports the mean and standard deviation over three runs for each configuration.
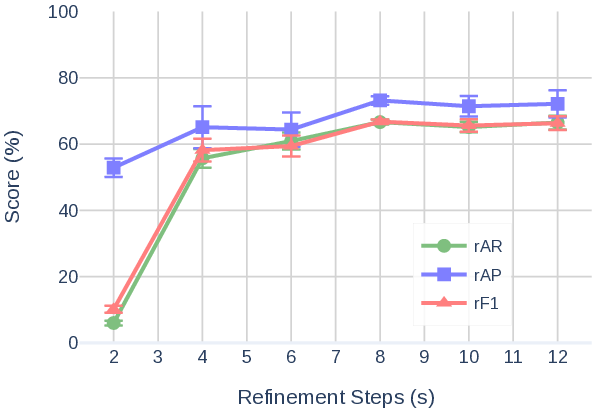
Removing RR results in a substantial drop in recall. The Refiner plays a critical role in aligning predicted trajectories to newly emerging branches that the Producer may miss, thereby improving recall and overall performance. Figure 5 shows performance with increasing refinement steps.
To evaluate the role of MOM, we build an alternative model that replaces MOM with standard one-to-one bipartite matching. This variant classifies each token set as either vessel or background and trains only vessel-labeled sets. Although it performs reasonably well, it exhibits lower recall and precision than the full model. The benefit of MOM arises from an implicit ensembling effect: multiple token sets are assigned to a single ground-truth branch, allowing several predictions to contribute to the final representation, which are later merged using divergence positions.
Finally, TNMS is essential for merging duplicate predictions, yielding a clear improvement in precision. This merging can introduce a slight reduction in recall because the fused branch may deviate more from the ground truth than the individual unmerged predictions. This effect is more pronounced in larger vessels where the centerline location is inherently ambiguous.
We introduce RefTr, a method for robust and efficient generation of topologically correct vascular centerline graphs from 3D medical images. RefTr utilizes a Producer-Refiner architecture that proposes and recurrently refines confluent trajectories to match the target vascular tree. A many-toone matching strategy enables implicit ensembling, while a novel and efficient Tree-NMS algorithm merges duplicate branches to improve precision. We also propose radius-aware evaluation thresholds that account for anatomical variability and produce more reliable metric comparisons. Experiments across multiple datasets show that RefTr achieves state-of-the performance on all datasets. Performance on the Parse 2022 dataset may improve further with a stronger pretrained image encoder, given the high anatomical complexity of pulmonary arteries and the limited number of training samples.
Centerline Graphs Supplementary Material
In this section, we present qualitative examples from the PARSE 2022 dataset for various cases. While these observations also apply to the ATM'22 dataset to some extent, we focus on PARSE 2022 because the patterns are clearer and easier to analyze in detail.
We present qualitative examples of branches missing from the ground truth annotations. As shown in examples in Figure 6, a bifurcation occurs along the selected vessel in the CT slice sequence and a new branch emerges, but the ground truth does not follow this branch, whereas RefTr does. Because these correctly tracked vessels are counted as false positives in both point-level metrics (rAP, rF1) and branch-level metrics (rBAP, rBF1), they reduce the reported precision and overall F1 score.
Figure 7 shows examples of early termination in the ground truth annotations. In each case, the vessel is initially tracked by both the ground truth and RefTr, but the ground truth annotation stops after a few slices, even though the CT data clearly shows the vessel continuing. RefTr correctly continues to follow the vessel. However, these valid RefTr predictions beyond the prematurely terminated ground truth path are also treated as false positives in both point-level and branch-level metrics, further lowering the reported precision and F1 score.
These instances of missing ground truth annotations have been confirmed by an expert radiologist. The authors of PARSE 2022 do not specify any criteria for excluding certain vessels from annotation. The selection may be based on criteria of clinical importance defined by the expert annotating clinicians. While many datasets omit vessels below a certain diameter, this does not appear to be the case for PARSE 2022, since the authors emphasize that thinner pulmonary arteries are both more challenging to detect and more clinically important. Depending on the task, the predicted centerline graphs can be readily post-processed to filter branches using length or radius thresholds.
In Figure 8, we show several examples of vessel bifurcations in CT image patches. RefTr often bifurcates earlier than the ground truth annotation, likely to avoid missing a branch that could be overlooked if divergence is predicted too late. Both the predicted and ground truth centerlines remain spatially and topologically valid, since there is in-herent ambiguity in the exact positions of centerline nodes and bifurcations. This ambiguity increases as vessel size increases.
The presence of this ambiguity can reduce branch-level metrics, as correctly predicted branches may be counted as false positives and ground truth branches as false negatives, lowering both precision and recall and resulting in a lower overall F1 score, especially for higher branch matching thresholds (τ match > 0.8). We report branch-level metrics for τ match = [0.5 : 0.05 : 0.9]. By reducing the upper threshold, the metrics can be adjusted to avoid penalizing such cases. The choice of threshold may vary for different datasets, depending on whether strict adherence to the ground truth centerlines is required.
In Figure 9, we show cases where another vessel in the CT image comes very close to the currently tracked vessel, either touching or nearly touching, before diverging. At the divergence point, RefTr interprets the nearby vessel as a new branch originating from the tracked vessel, predicts a bifurcation, and begins tracking it. This newly predicted branch is counted as a false positive, reducing both pointlevel and branch-level precision.
Figure 10 shows additional failure cases where RefTr fails to predict a bifurcation and misses a new branch. In these examples, the bifurcation is often ambiguous. In the first and second examples, the bifurcating vessels remain partially connected across several slices before fully separating. In such cases, RefTr treats the diverging vessel as an anomaly and does not predict it as a new branch, likely due to limited examples of such cases in the training dataset. In the third example, RefTr misses a relatively thin new branch compared to the original tracked vessel. This is uncommon, as vessels typically bifurcate into child branches with radii that are more similar and smaller than the parent branch. These cases result in lower point-level and branch-level recall.
These types of failures could be mitigated by increasing the diversity and amount of training data, applying hardmining strategies for difficult vessels, or using data augmentation techniques. Exploring these approaches could improve performance in future work.
Figure 11 illustrates another failure mode, where RefTr prematurely terminates a currently tracked branch. In some cases, RefTr is uncertain whether a branch continues past an ambiguous region or represents a different structure, as in the first example. In others, RefTr appears to stop based on an internal estimate of where the ground-truth branch should end. In the second example, the ground-truth lowerleg branch ends at a later bifurcation, but RefTr terminates at an earlier bifurcation. These cases also result in lower recall. Failures of the first type could be addressed using the techniques mentioned for previous failure cases, while the second type may benefit from explicitly enforcing specific branch exclusion criteria.
RefTr predicts a set of confluent trajectories, along with an end position for each trajectory and a divergence position for each pair of trajectories. The predicted positions are continuous values between 0 and 1. These values are first unnormalized to match the length of the trajectories and then discretized by rounding to the nearest integer, which gives the ID of the trajectory node where the end or divergence occurs.
To build a tree from the confluent trajectories, we follow these steps: 1. Cluster trajectories into groups based on their divergence positions, so that trajectories that do not diverge (i.e., divergence occurs at the end of the trajectory) are grouped together. 2. Merge the trajectories within each cluster into a representative trajectory by averaging positions, radii, and end positions. 3. Compute pairwise divergence positions between the representative trajectories using the average divergence positions. 4. Starting from the shared root of the confluent trajectories, construct the tree level by level using a breadth-first approach. 5. At each level, cluster the nodes of all representative branches at that level based on divergence positions. If multiple clusters are present, new branches are created for each cluster. Clusters may further subdivide at subsequent levels, creating additional branches. 6. At each level, terminate branches that have reached their end positions. Building the tree in this way ensures a single connected component with no cycles, preserving topological correctness.
We provide additional model hyperparameters in Table 5.
Vesselformer 21.93 ± 2.06 18.21 ± 1.00 19.54 ± 2.69 1.11 ± 0.027 3.45 ± 0.18 3.09 ± 0.32 3.12 ± 0.21 Trexplorer 11.37 ± 3.73 13.42 ± 7.80 11.36 ± 5.17 1.22 ± 0.304 8.96 ± 3.17 32.26 ± 5.24 13.54 ± 4.47
This content is AI-processed based on open access ArXiv data.