- Title: Towards Automated Infographic Design Deep Learning-based Auto-Extraction of Extensible Timeline
- ArXiv ID: 1907.13550
- Date: 2023-10-10
- Authors: Chen Zhu-Tian, Yun Wang, Qianwen Wang, Yong Wang, and Huamin Qu
📝 Abstract
Designers need to consider not only perceptual effectiveness but also visual styles when creating an infographic. This process can be difficult and time consuming for professional designers, not to mention non-expert users, leading to the demand for automated infographics design. As a first step, we focus on timeline infographics, which have been widely used for centuries. We contribute an end-to-end approach that automatically extracts an extensible timeline template from a bitmap image. Our approach adopts a deconstruction and reconstruction paradigm. At the deconstruction stage, we propose a multi-task deep neural network that simultaneously parses two kinds of information from a bitmap timeline: 1) the global information, i.e., the representation, scale, layout, and orientation of the timeline, and 2) the local information, i.e., the location, category, and pixels of each visual element on the timeline. At the reconstruction stage, we propose a pipeline with three techniques, i.e., Non-Maximum Merging, Redundancy Recover, and DL GrabCut, to extract an extensible template from the infographic, by utilizing the deconstruction results. To evaluate the effectiveness of our approach, we synthesize a timeline dataset (4296 images) and collect a real-world timeline dataset (393 images) from the Internet. We first report quantitative evaluation results of our approach over the two datasets. Then, we present examples of automatically extracted templates and timelines automatically generated based on these templates to qualitatively demonstrate the performance. The results confirm that our approach can effectively extract extensible templates from real-world timeline infographics.
💡 Summary & Analysis
This paper focuses on the creation of an automated system for extracting and reconstructing timeline infographics from digital bitmap images. The authors propose a method that uses deep learning to parse structural information from these images, including global characteristics like orientation and layout, as well as local details such as position and category of visual elements.
The problem addressed is the complexity involved in designing effective and visually pleasing timelines by hand, which can be time-consuming even for professional designers. To solve this, the researchers developed a two-step process: deconstruction and reconstruction. The deconstruction phase employs deep neural networks to analyze bitmap images and extract essential data about the timeline’s structure. In the reconstruction stage, they use specific techniques like Non-Maximum Merging and DL GrabCut to create reusable templates that can be adapted with new data.
The study validates its approach using both synthetic and real-world datasets, demonstrating the system’s ability to accurately generate extensible template designs from existing bitmap images. This research is significant as it advances the field of automated infographic design, making sophisticated visual storytelling more accessible to a wider audience including non-experts.
📄 Full Paper Content (ArXiv Source)
# Problem Statement
This section introduces the background of timeline infographics and the
problem, overview of the proposed approach, and the datasets.
Background
Given a bitmap timeline infographic, we seek to extract its
extensible template automatically.
Timeline infographics have been recently investigated by Brehmer et
al. . We briefly describe the as follows:
Timeline Data. A timeline presents interval event data
(i.e., a sequence of events), which is different from continuous
quantitative time-series data. A timeline infographic for storytelling
usually has a small underlying dataset because the storyteller is
assumed to have already distilled the narrative points from the raw
dataset.
Timeline Design. A timeline can be described No more than
five options are available for each dimension
(1). These dimensions indicate
how the events are organized in a timeline. For example, events are
placed along a straight line in a linear representation, which is
the most common way to represent a timeline. Typically, an event is
visually encoded by a graphical mark, such as the rectangles in
1. The position of this mark is used
to encode the occurred time of the event. Extra annotations (e.g.,
text or icons) are added, commonly adjacent to the event mark, to
depicts the details of an event.
The design dimensions to depict a timeline from
Design
Options
Representation
Linear, Radial, Grid, Spiral,
Arbitrary
Scale
Chronological, Relative, Logarithmic,
Sequential, Sequential + Interim
Duration
Layout
Unified, Faceted, Segmented,
Faceted + Segmented
In practice, infographic timelines are widely spread in the form of
bitmap images. However, they are not easy to reproduce. Given a bitmap
timeline, we aim to extract its extensible template
(1) automatically. To this end, two
requirements should be fulfilled:
Parse the content. The machine should first parse the content of
the image. A computational understanding of an image can be
represented as a structural information, which is necessary for an
automation process. However, the infographic image can only be
accessed in pixels, which is a byte array with the shape of
$`width \times height \times RGB`$. A process is required to take the
bitmap image as input and output its structural information.
Construct the template. With the structural information of the
image as a basis, the machine should be able to construct an
extensible template out of it automatically. The template should
contain detail information (e.g., position, color, font, and shape)
of the elements to be reused and the elements to be updated. Given the
image and its structural information, another process should be
involved to extract such types of detail information.
Approach Overview
To fulfill the two requirements above, we design a two-step approach,
starting from defining the input and output of each step.
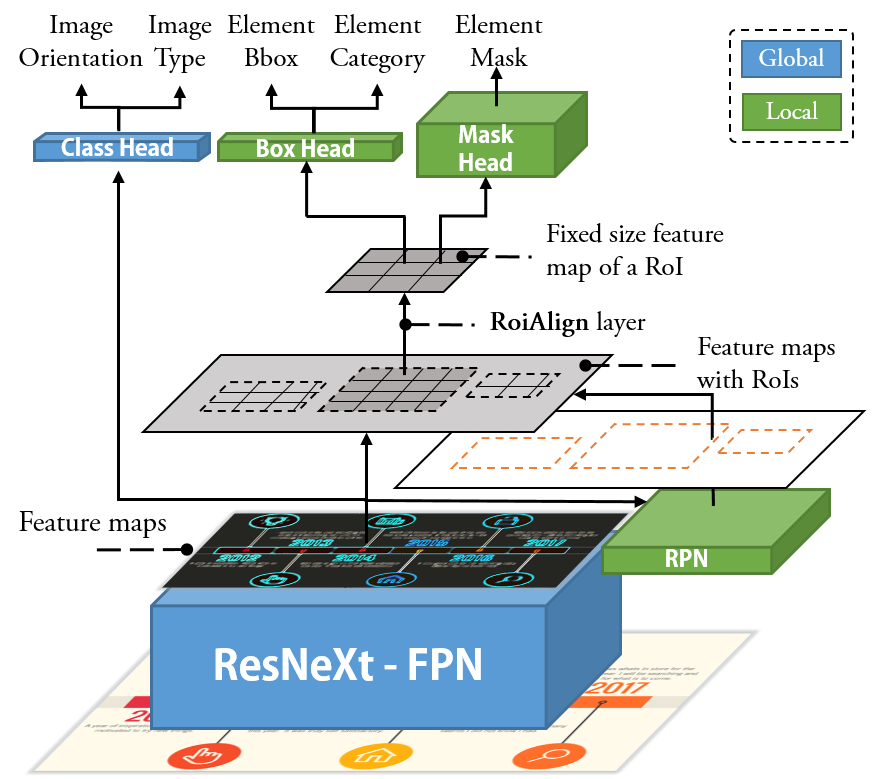
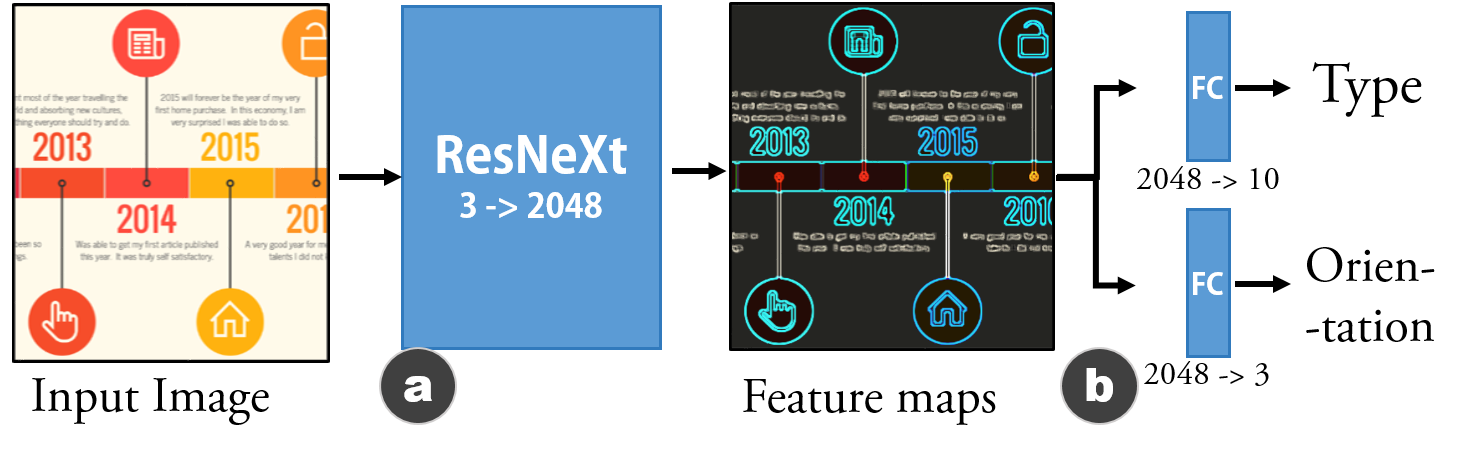
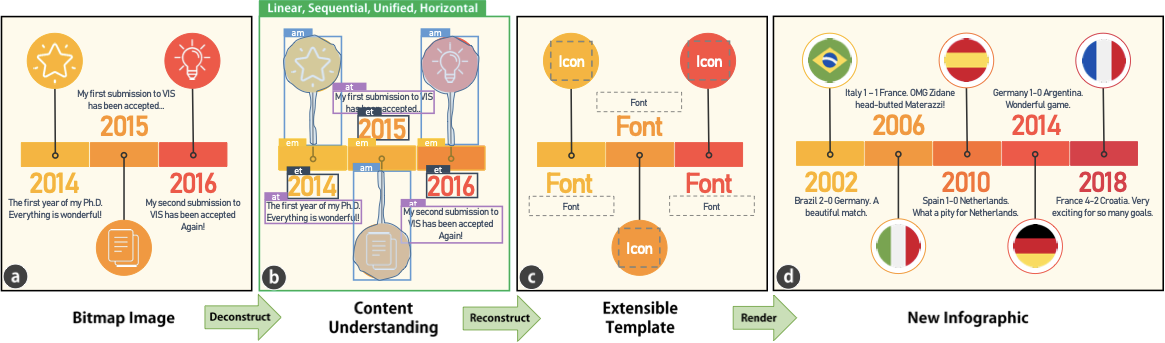
Deconstruction. The goal of the first step
([fig:teaser]a and
[fig:teaser]b) is to parse structural
information from the input, a bitmap timeline infographic $`I`$. For the
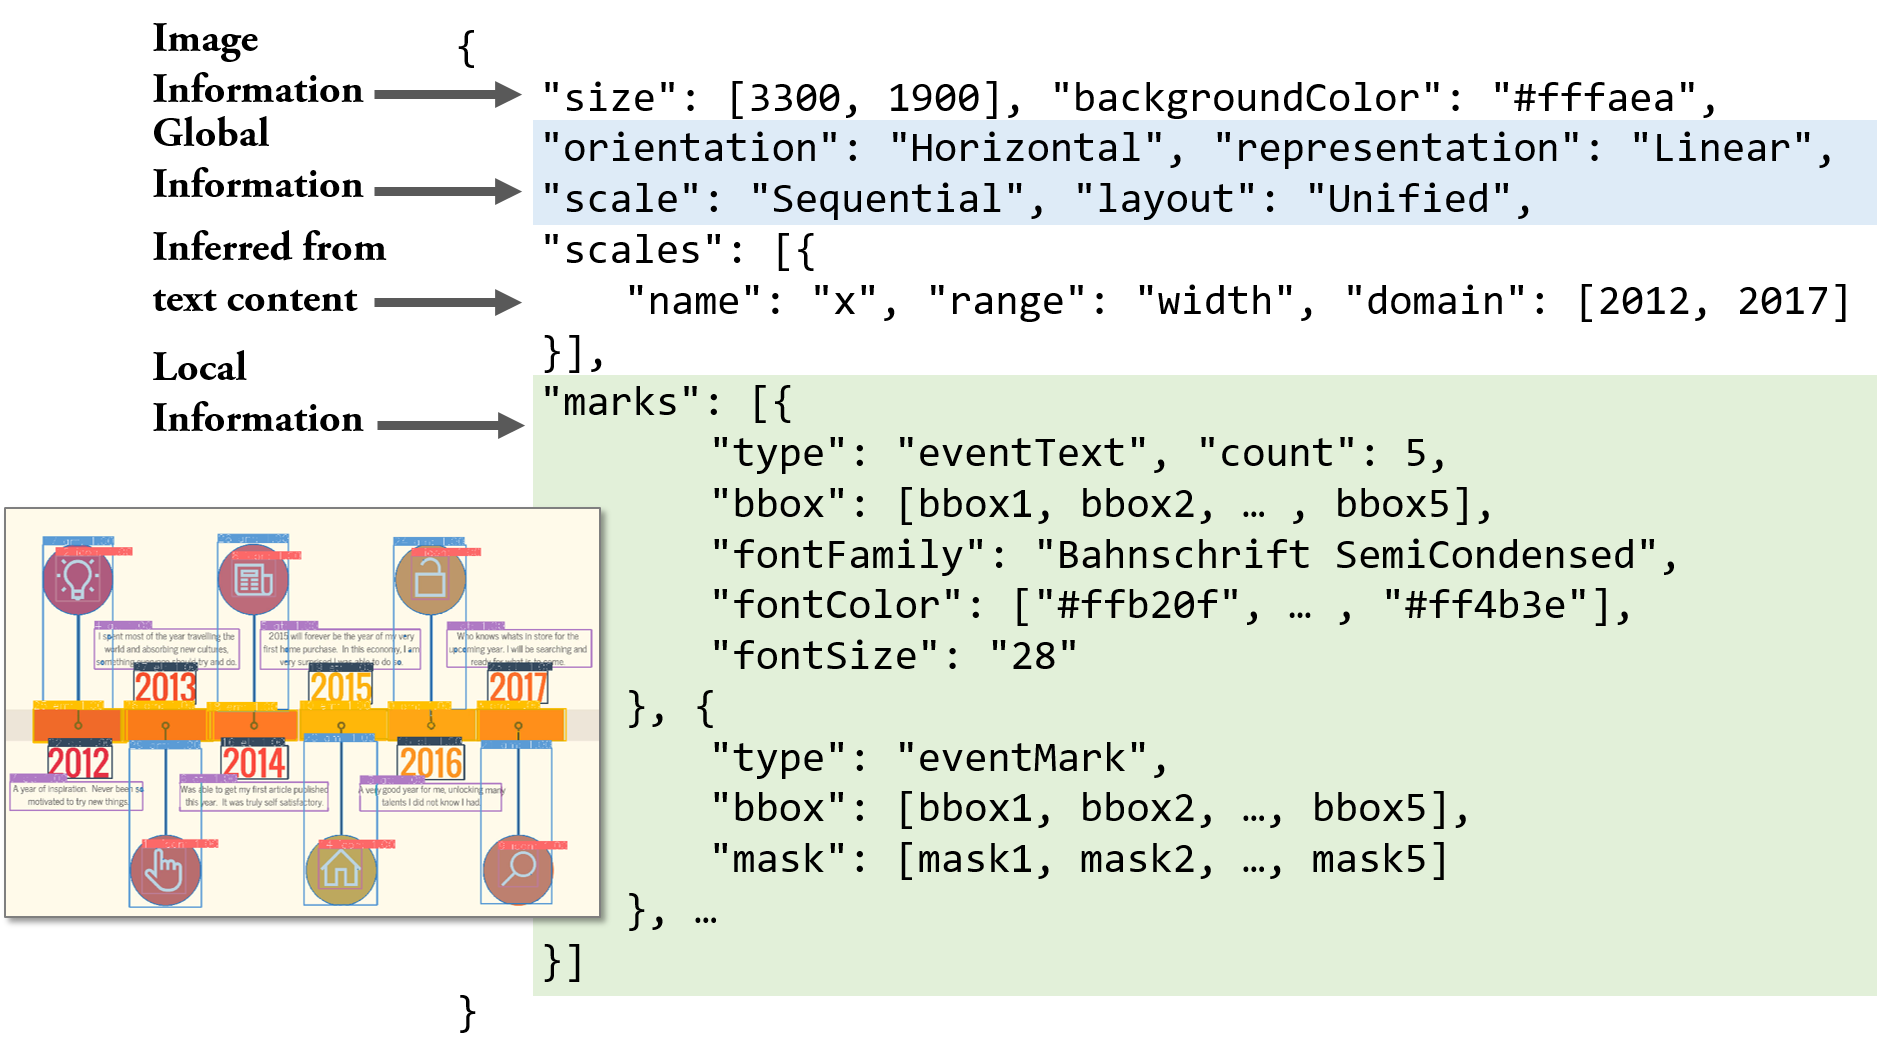
output, we define two kinds of information, namely, the global one $`G`$
and the local one $`L`$. The global information is about the entire
timeline, including its orientation. The local information is about
each individual element, including its category (what), location
(where), and the pixel-wise mask (which pixels). Therefore, the
ideal process of the first step can be formulated as a mapping function
$`f`$:
MATH
\begin{equation}
    f: I \rightarrow (G, L)
\end{equation}
Click to expand and view more
We propose to approximate $`f`$ using a DNN model $`h \approx f`$ with a
set of parameters $`\Theta`$. This set of parameters $`\Theta`$ can be
learned from a corpus $`\mathbb{C} = \{(I_i: (G_i, L_i))\}_{i=1}^n`$,
where each entry $`(I_i: (G_i, L_i))`$ is a bitmap image associated with
its global and local information. Hence, we can obtain the output via
$`(G, L) = h(I | \Theta)`$.
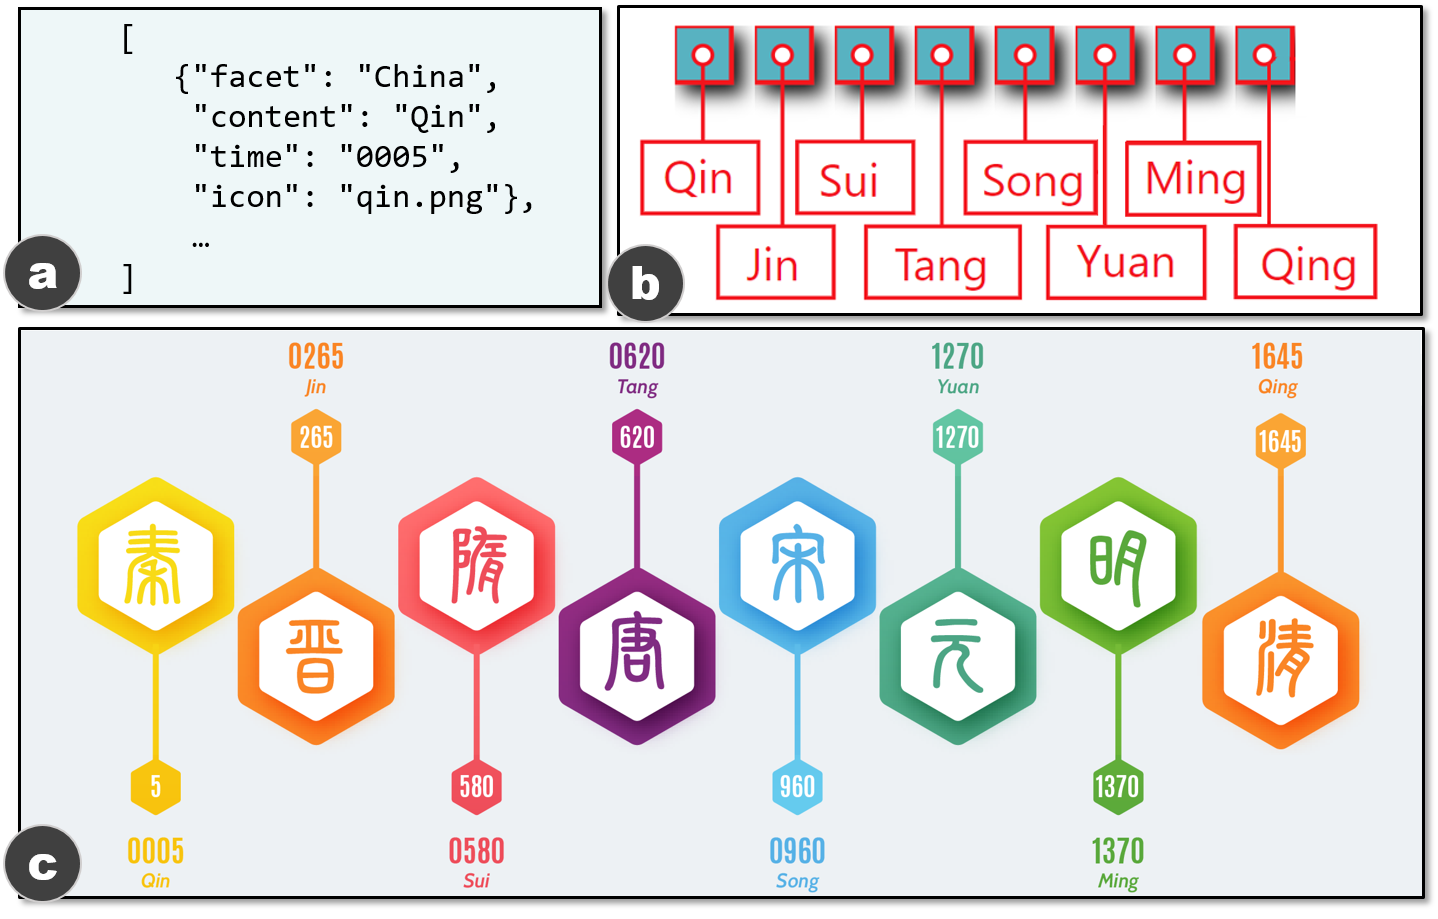
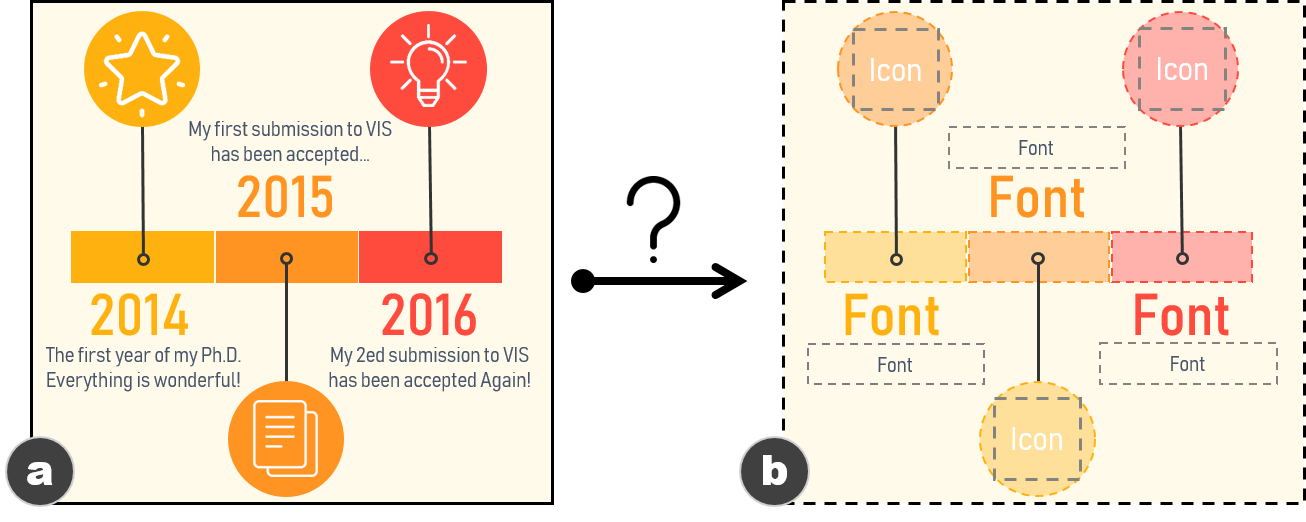
Reconstruction. To reconstruct the extensible template, a function
$`g`$ should take the bitmap infographics $`I`$ and its global and local
information $`G`$, $`L`$ as the input, and return the detail information
about elements to be reused $`E_r`$ (e.g., the rectangle and circle
marks in 1a) and elements to be updated $`E_u`$
(e.g., the text and icons in
1a), i.e.,
$`E`$ is a set of elements, each of which is represented as a set of
attributes, i.e.,
$`E = \{ \textbf{$e$}^i := (a^1, a^2, ..., a^m)\}_{i=1}^n`$. According
to $`G`$ and $`L`$, we can infer attributes of elements in $`E_r`$ and
$`E_u`$, such as size, shape, color, position, and offset to
others. We highlight the necessary attributes for enabling extensible
templates. For $`E_r`$, the essential attribute is the graphical marks
to be reused (e.g., the rectangle marks in
1a). Hence, we need to segment the
pixels of $`E_r`$ from the original image. As for $`E_u`$, the
attributes related to the font (e.g., font family, size,
color, etc.) must be identified to maintain the styles of the
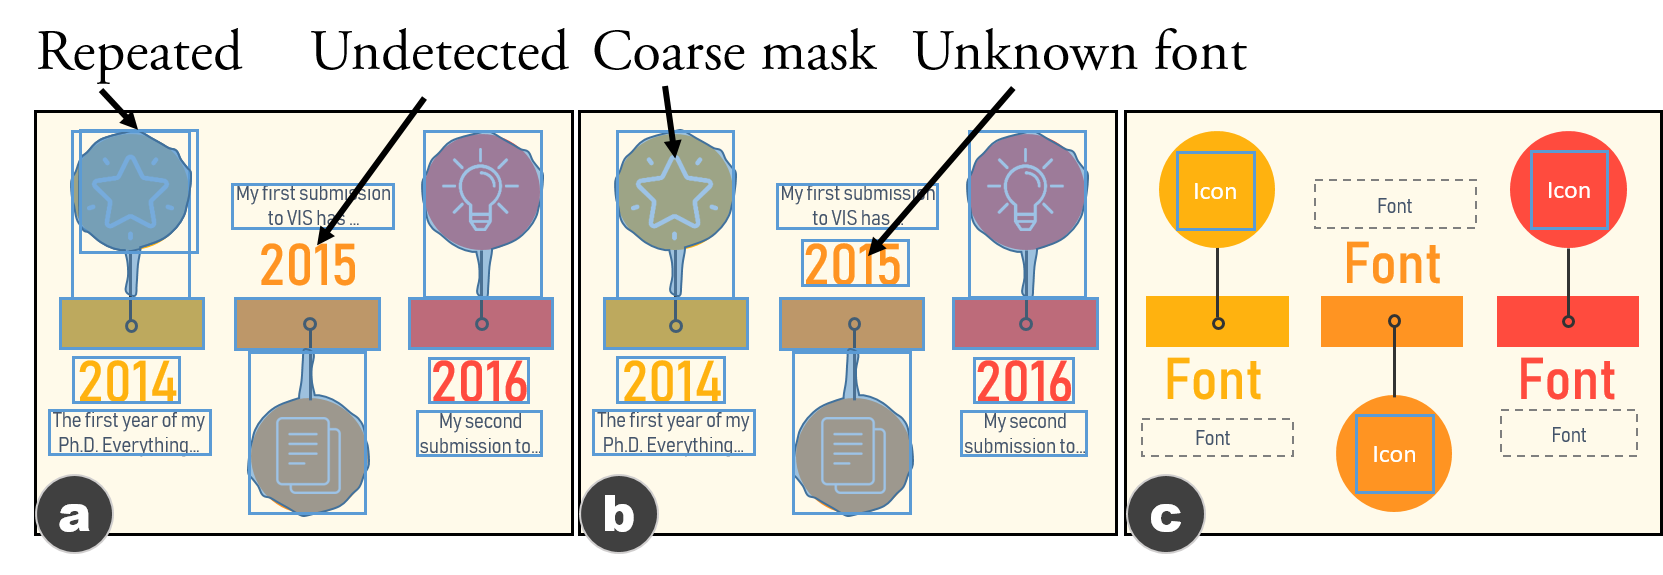
updated content. In addition, we note that the outputs from $`h`$ may
not be perfect, reducing the quality of the outputs of $`g`$. Thus,
$`g`$ should be smart enough to correct errors in $`G`$ and $`L`$ as
much as possible.
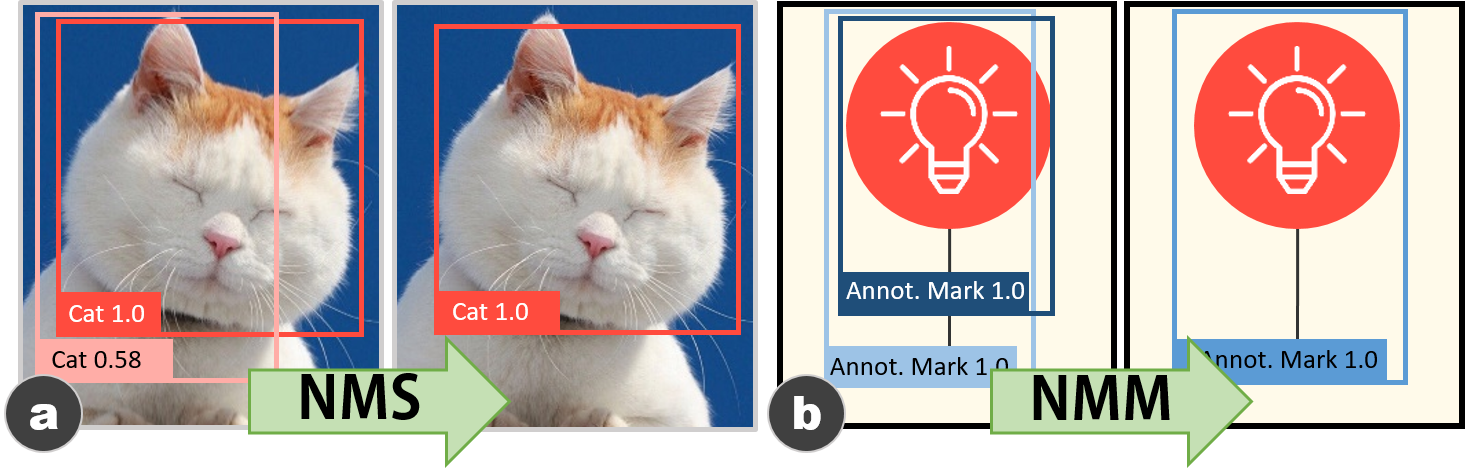
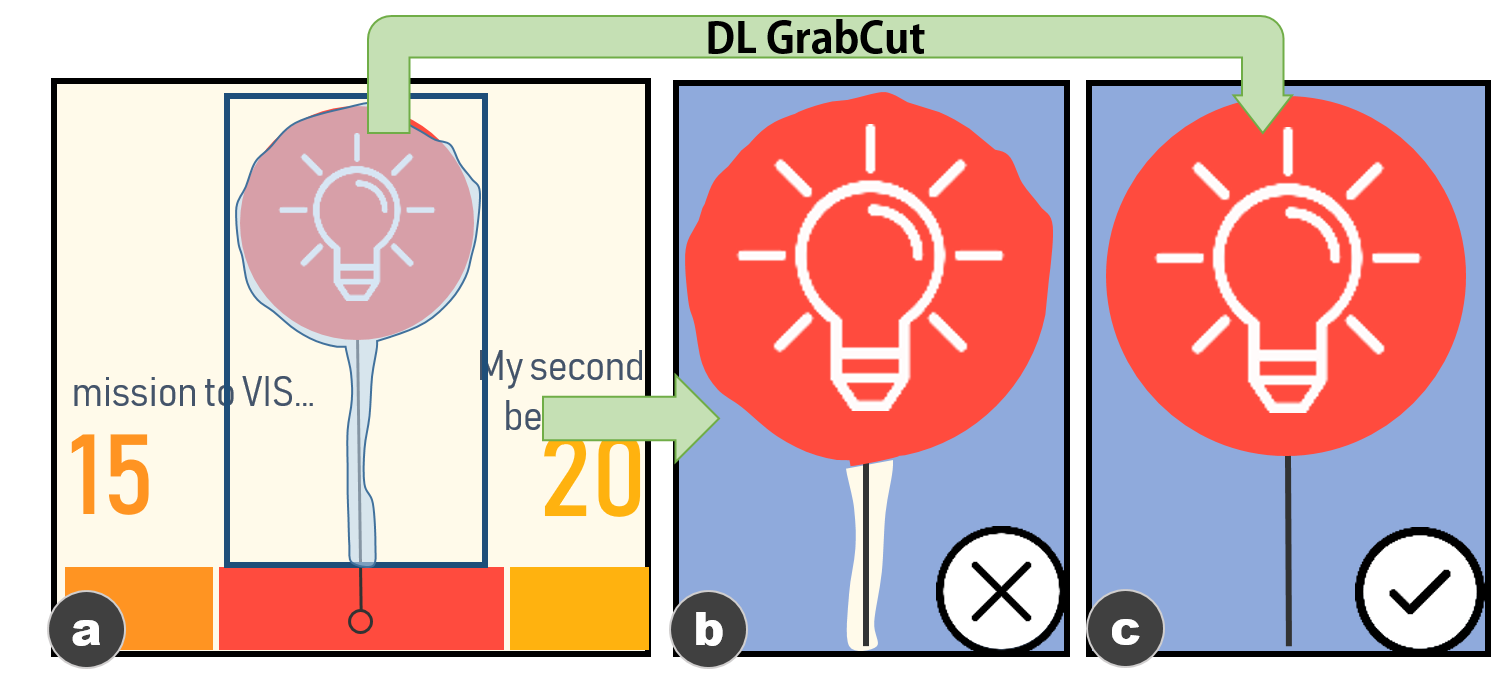
Considering these issues, we design a heuristic-based pipeline, with
three novel techniques, as $`g`$ to automatically output $`E_r`$ and
$`E_u`$.
Datasets
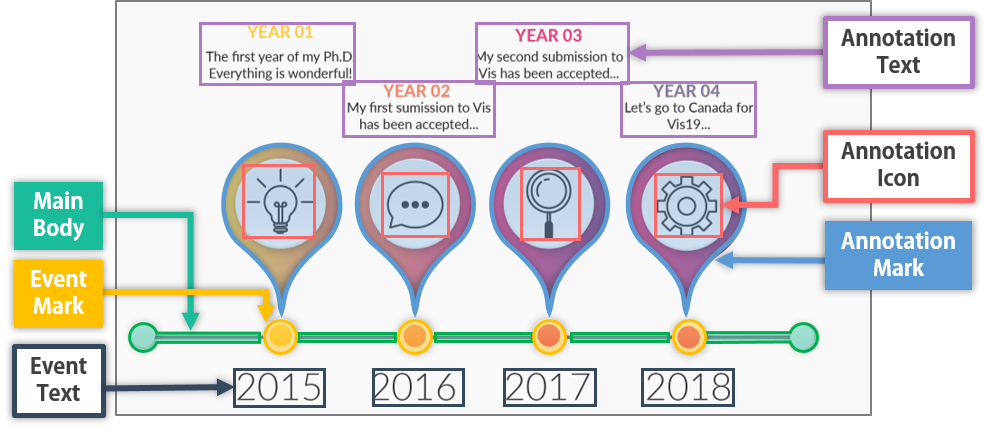
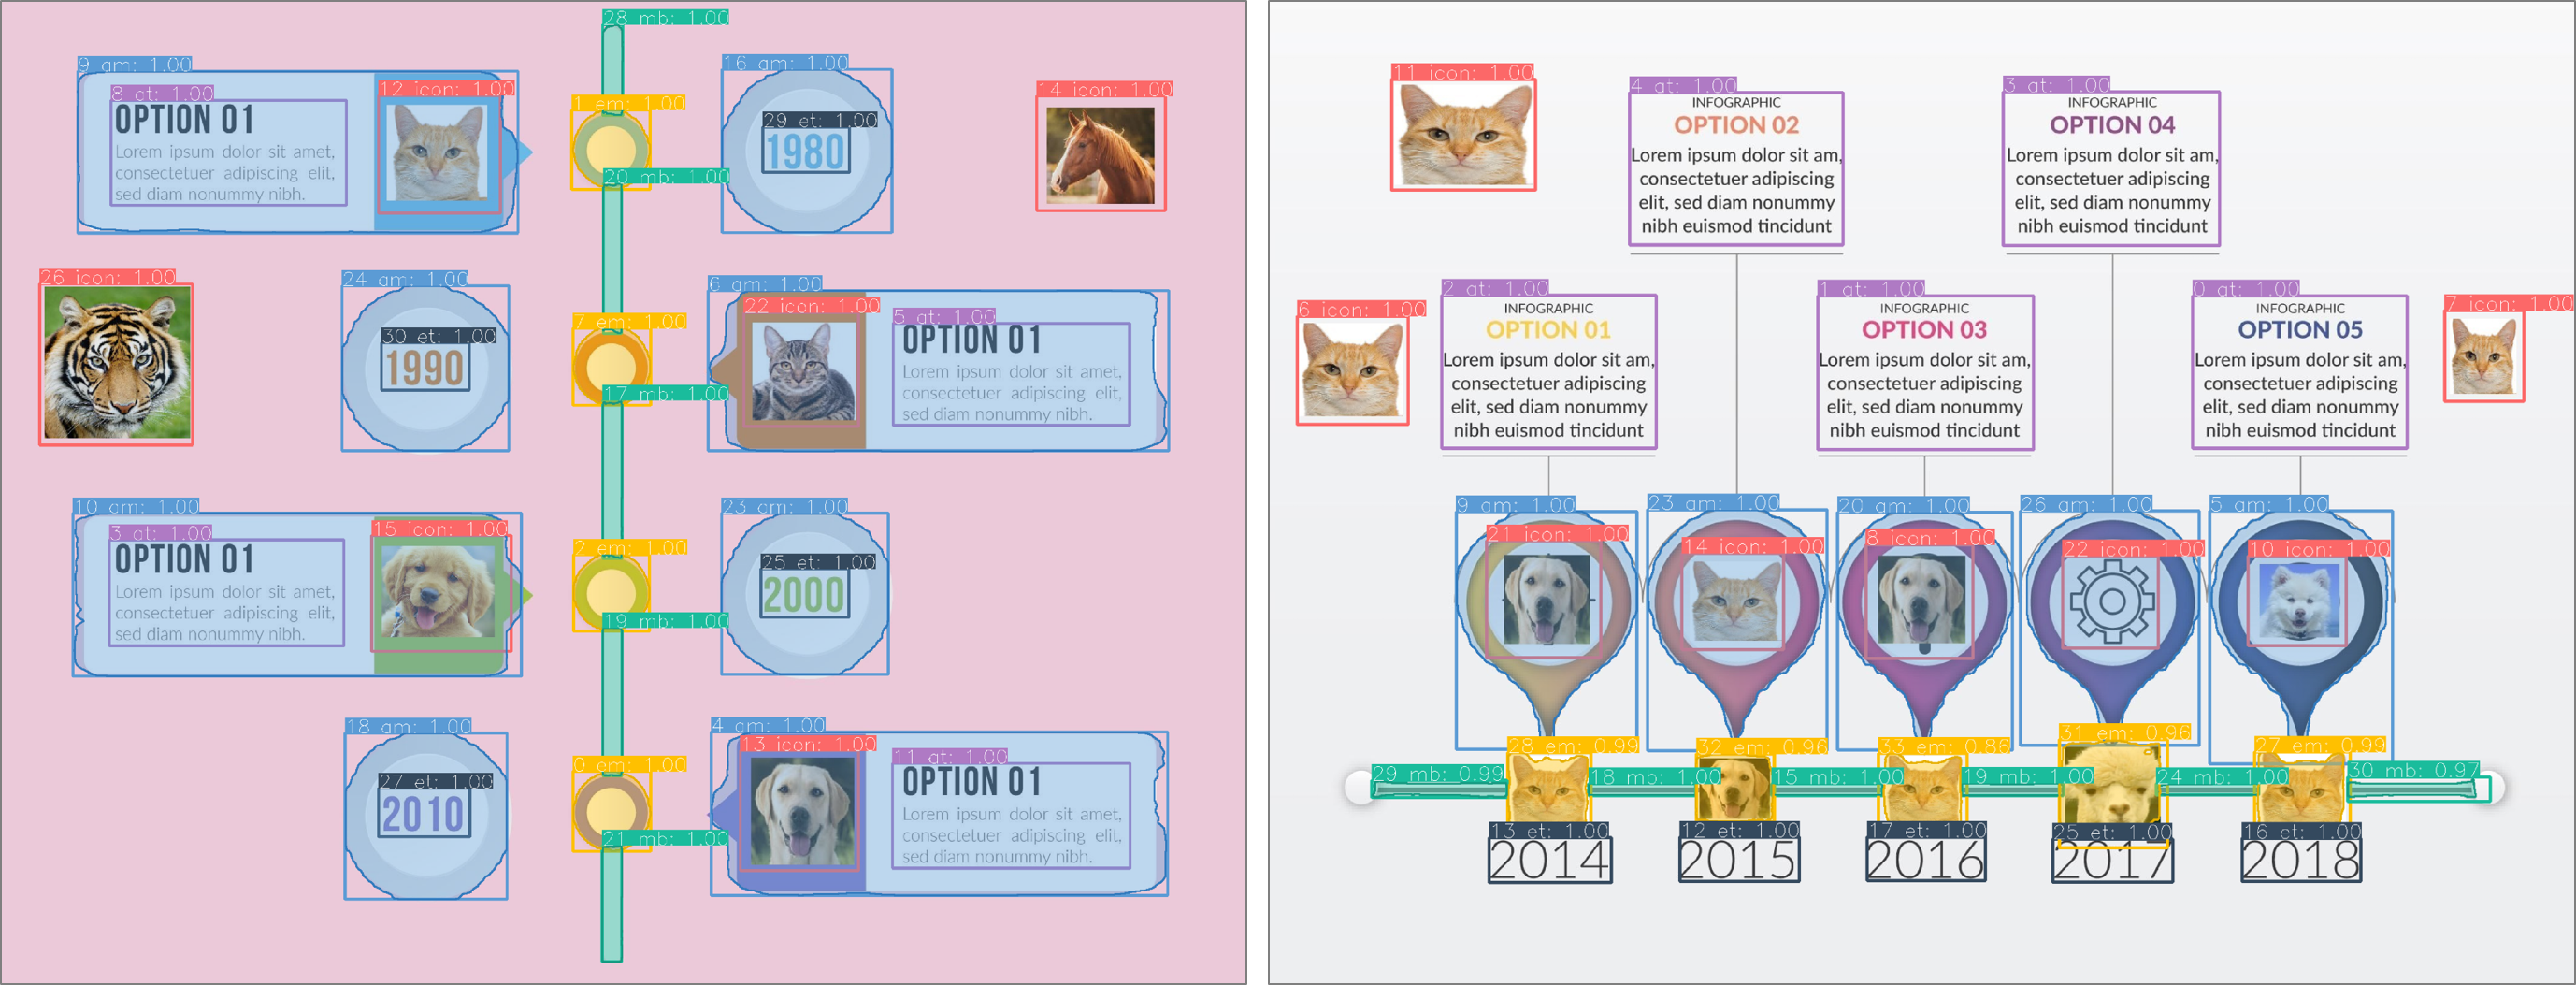
Categories of elements in a timeline infographic. The
event mark, annotation mark, and main body
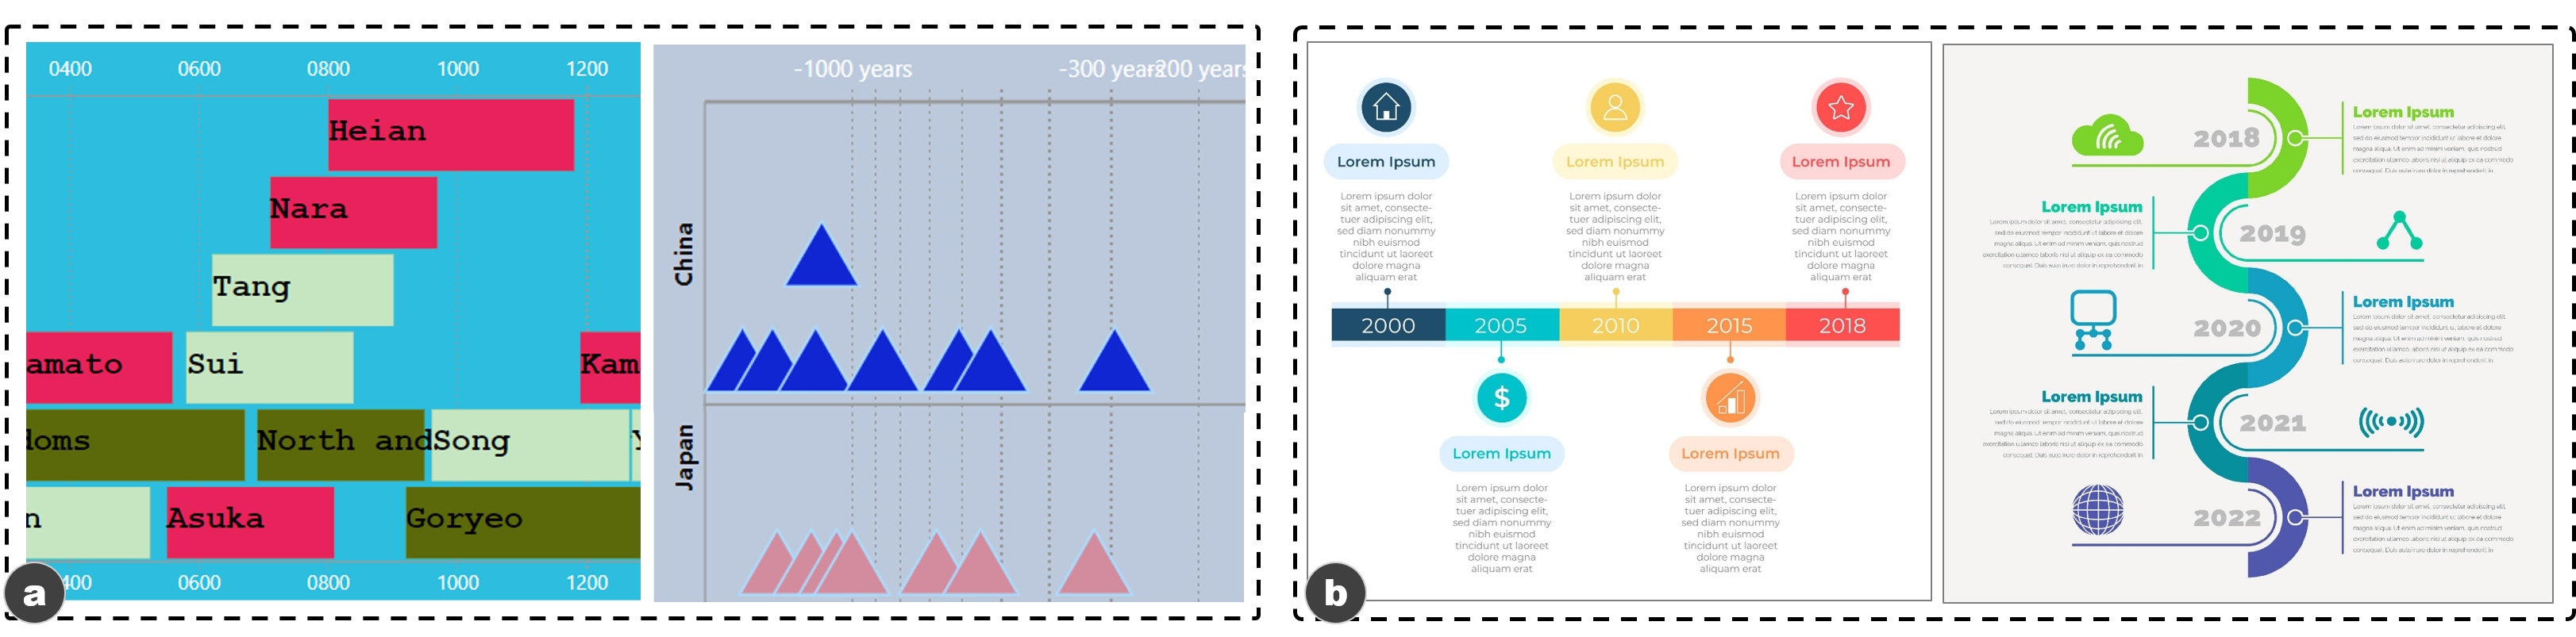
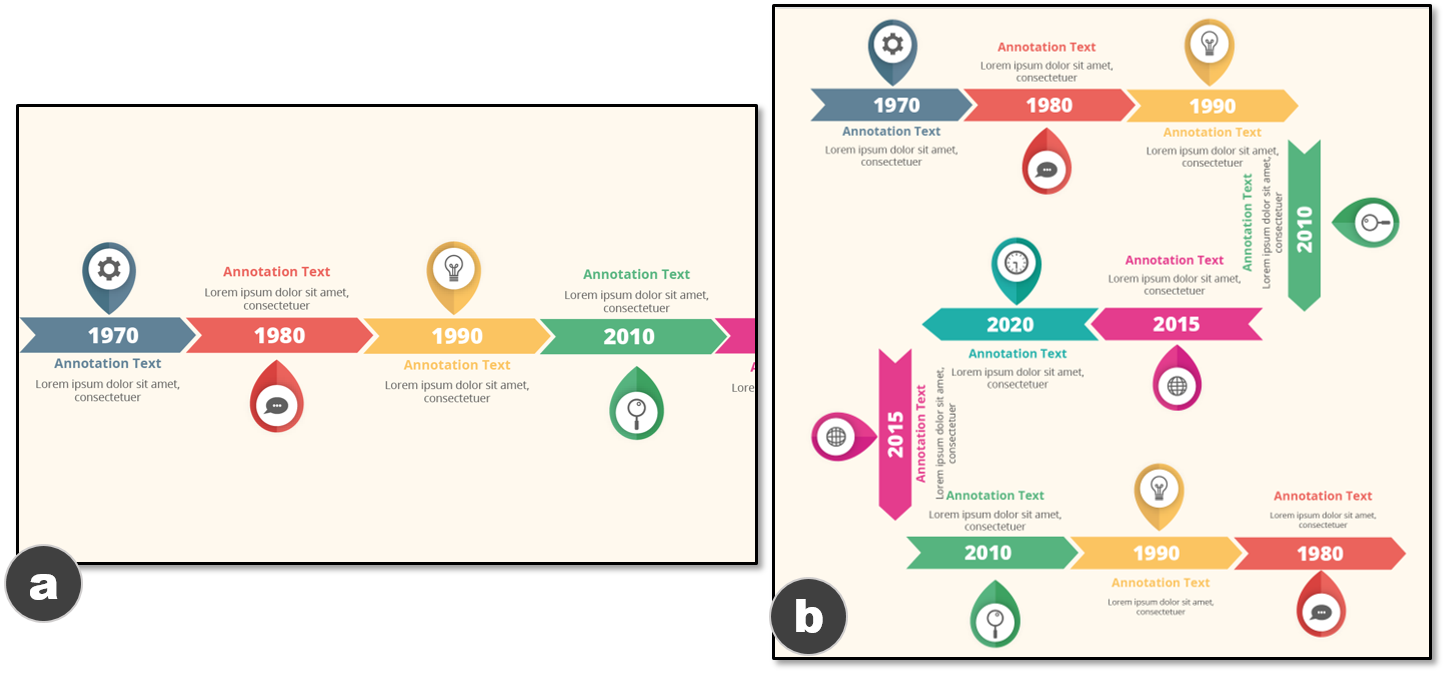
can be reused, while others need to be updated.Example timelines from: a) a synthetic dataset D1, which shows two
different scales, and b) a real-world dataset D2, which shows two
different orientations.
We use two datasets to train the model $`h`$ and evaluate our approach.
The first one (referred to as $`D_1`$) is a synthetic dataset. We
extended TimelineStoryteller (TS) , a timeline authoring tool, to
generate $`D_1`$, covering all types of timelines. The second dataset
(referred to as $`D_2`$) consists of real-world timelines, collected
from Google Image , Pinterest , and FreePicker by using the search
keywords timeline infographic and infographic timeline. $`D_2`$ has
more diverse styles, especially for marks, and it covers the most common
types of timelines. The resolutions of images are in the range of
$`[512, 3880] \times [512, 4330]`$. To scope this work, we focus on
timelines that have less than 20 events and whose events have the same
number and types of annotations (e.g., text and icon). We also exclude
the titles, footnotes, and legends.
The number of annotations per category of each
dataset.
Dataset
#Event
#Event
#Annot.
#Annot.
#Annot.
#Main
Mark
Text
Mark
Text
Icon
Body
D1
83498
61324
4030
60036
-
-
D2
2318
2305
2227
2937
1497
1340
Collection. For $`D_1`$, TS allows us to generate timeline images
with various visual encodings and styles. We generated timeline images
using nine embedded datasets of TS to cover the design space of
timelines. To increase diversity, we randomly modified the timeline
orientation, the style of graphical marks (including color, size, and
shape), texts (font, size, color, offset to others), and the background
(color) in a curated range that guarantee the viability of the timeline.
We created 9592 timelines in this process.
For $`D_2`$, we implemented crawlers to download the search results. The
crawling process was manually monitored and stopped when 10 consecutive
return results are not timelines. We collected 1138 timelines in this
process. Following, four of the coauthors separately reviewed all the
timelines to remove the repeated and problematic instances, such as
images with heavy watermarks or with low resolutions (i.e., smaller
than $`512 \times 512`$), . They 412 timelines. The scale of $`D_2`$ is
consistent with manually collected visualization datasets in similar
research . Among the five representations
in 1, radial, grid, or
spiral representations appear only 19/412 (4.6%) timelines, whereas
the rest 393 timelines are with linear or arbitrary representations.
This ratio is consistent with (23/263, 8.7%). Considering the scarce
number of the radial, grid, or spiral representations, we excluded
them in $`D_1`$ and $`D_2`$ and focused on the more common linear and
arbitrary representations.
Labeling. To identify the categories of elements in a timeline, four
of the coauthors independently reviewed all the timelines in $`D_1`$ and
$`D_2`$. Each of them iteratively summarized a set of mutually exclusive
categories that can be used to depict elements in a timeline
infographic. Gathering the reviews resulted in six categories
(2). We explain the details of these
categories in the supplemental material.
Each timeline in $`D_1`$ was then converted from SVG to bitmap format
and annotated with its representation, scale, layout, and orientation.
We also analyzed the SVG and the bitmap to generate the annotations for
each element in a timeline, including its category (from the label sets
in 2), bounding box (referred to as
bbox), and pixel-wise mask (referred to as mask). For each timeline
in $`D_2`$, we manually annotated its representation, scale, layout, and
orientation, as well as the category, bbox, and mask of each element, by
using our annotation tool that is built on Microsoft PowerPoint.
Finally, $`D_1`$ contains 4296 timelines, whereas $`D_2`$ contains 393.
Figure 3 and
2 present samples and statistics of
these timelines, respectively.
The copyright of this content belongs to the respective researchers. We deeply appreciate their hard work and contribution to the advancement of human civilization.