- Title: Neural Turtle Graphics for Modeling City Road Layouts
- ArXiv ID: 1910.02055
- Date: 2019-10-07
- Authors: Hang Chu, Daiqing Li, David Acuna, Amlan Kar, Maria Shugrina, Xinkai Wei, Ming-Yu Liu, Antonio Torralba, Sanja Fidler
📝 Abstract
We propose Neural Turtle Graphics (NTG), a novel generative model for spatial graphs, and demonstrate its applications in modeling city road layouts. Specifically, we represent the road layout using a graph where nodes in the graph represent control points and edges in the graph represent road segments. NTG is a sequential generative model parameterized by a neural network. It iteratively generates a new node and an edge connecting to an existing node conditioned on the current graph. We train NTG on Open Street Map data and show that it outperforms existing approaches using a set of diverse performance metrics. Moreover, our method allows users to control styles of generated road layouts mimicking existing cities as well as to sketch parts of the city road layout to be synthesized. In addition to synthesis, the proposed NTG finds uses in an analytical task of aerial road parsing. Experimental results show that it achieves state-of-the-art performance on the SpaceNet dataset.
💡 Summary & Analysis
This paper introduces Neural Turtle Graphics (NTG), a novel generative model for spatial graphs used to model city road layouts. The key idea is to represent the road layout as a graph where nodes are control points and edges are road segments. NTG, parameterized by a neural network, iteratively generates new nodes and edges connected to existing ones based on the current state of the graph. Starting with an initial root node and its connections, it extends this structure by adding new nodes and edges in each step.
The problem addressed here is the generation of plausible city road layouts for applications such as urban planning simulations, video game environments, and autonomous vehicle testing scenarios. Traditional methods relied heavily on procedural modeling techniques that required manual tuning of attributes to achieve desired results, which was inflexible and labor-intensive.
NTG solves this by learning from existing map data using a graph-based approach. The encoder-decoder architecture allows it to capture local statistics and generate new road segments iteratively. This method can be conditioned on specific attributes or partial sketches provided by users, offering flexibility in the generation process.
The results show that NTG outperforms other methods across various performance metrics. It not only generates plausible city layouts but also supports interactive synthesis where users can control styles and sketch parts of the layout. Additionally, it performs well in aerial road parsing tasks, demonstrating its versatility as both a generative model and an analytical tool.
The significance lies in NTG’s ability to provide a flexible solution for generating realistic city road structures without extensive manual intervention. This has potential applications in urban planning simulations, game development, and autonomous vehicle testing environments. Moreover, it serves as an effective prior for aerial map parsing tasks, enhancing the accuracy of road detection from satellite imagery.
📄 Full Paper Content (ArXiv Source)
# Neural Turtle Graphics
We formulate the city road layout generation problem as a planar graph
generation problem. We first introduce the notation in
Sec. 8.1 and then describe our NTG model in
Sec. 8.2. Aerial parsing, implementation
details, training and inference are given in
Sec. 8.3-Sec. 8.5, respectively.
(a)
(b)
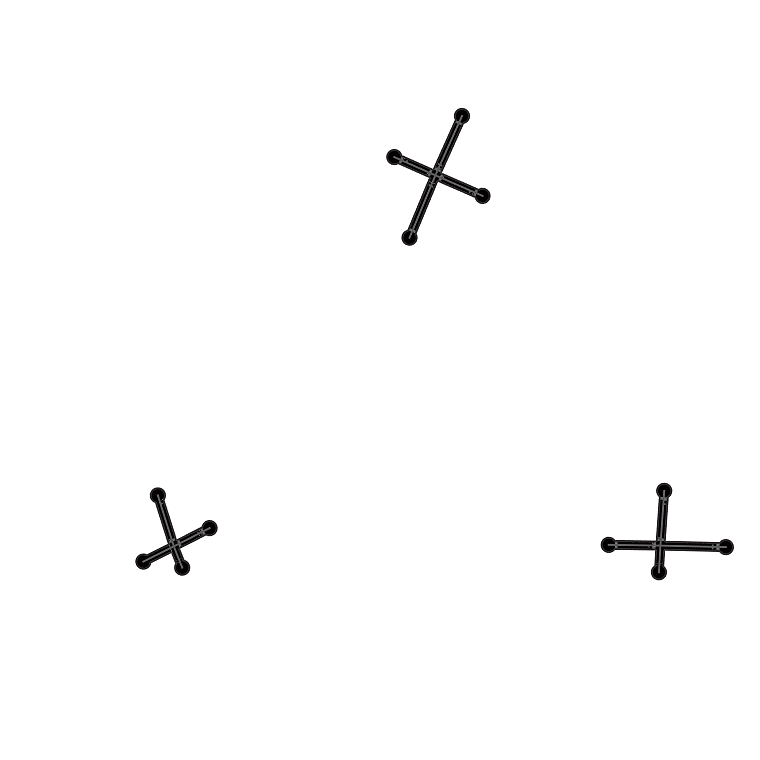
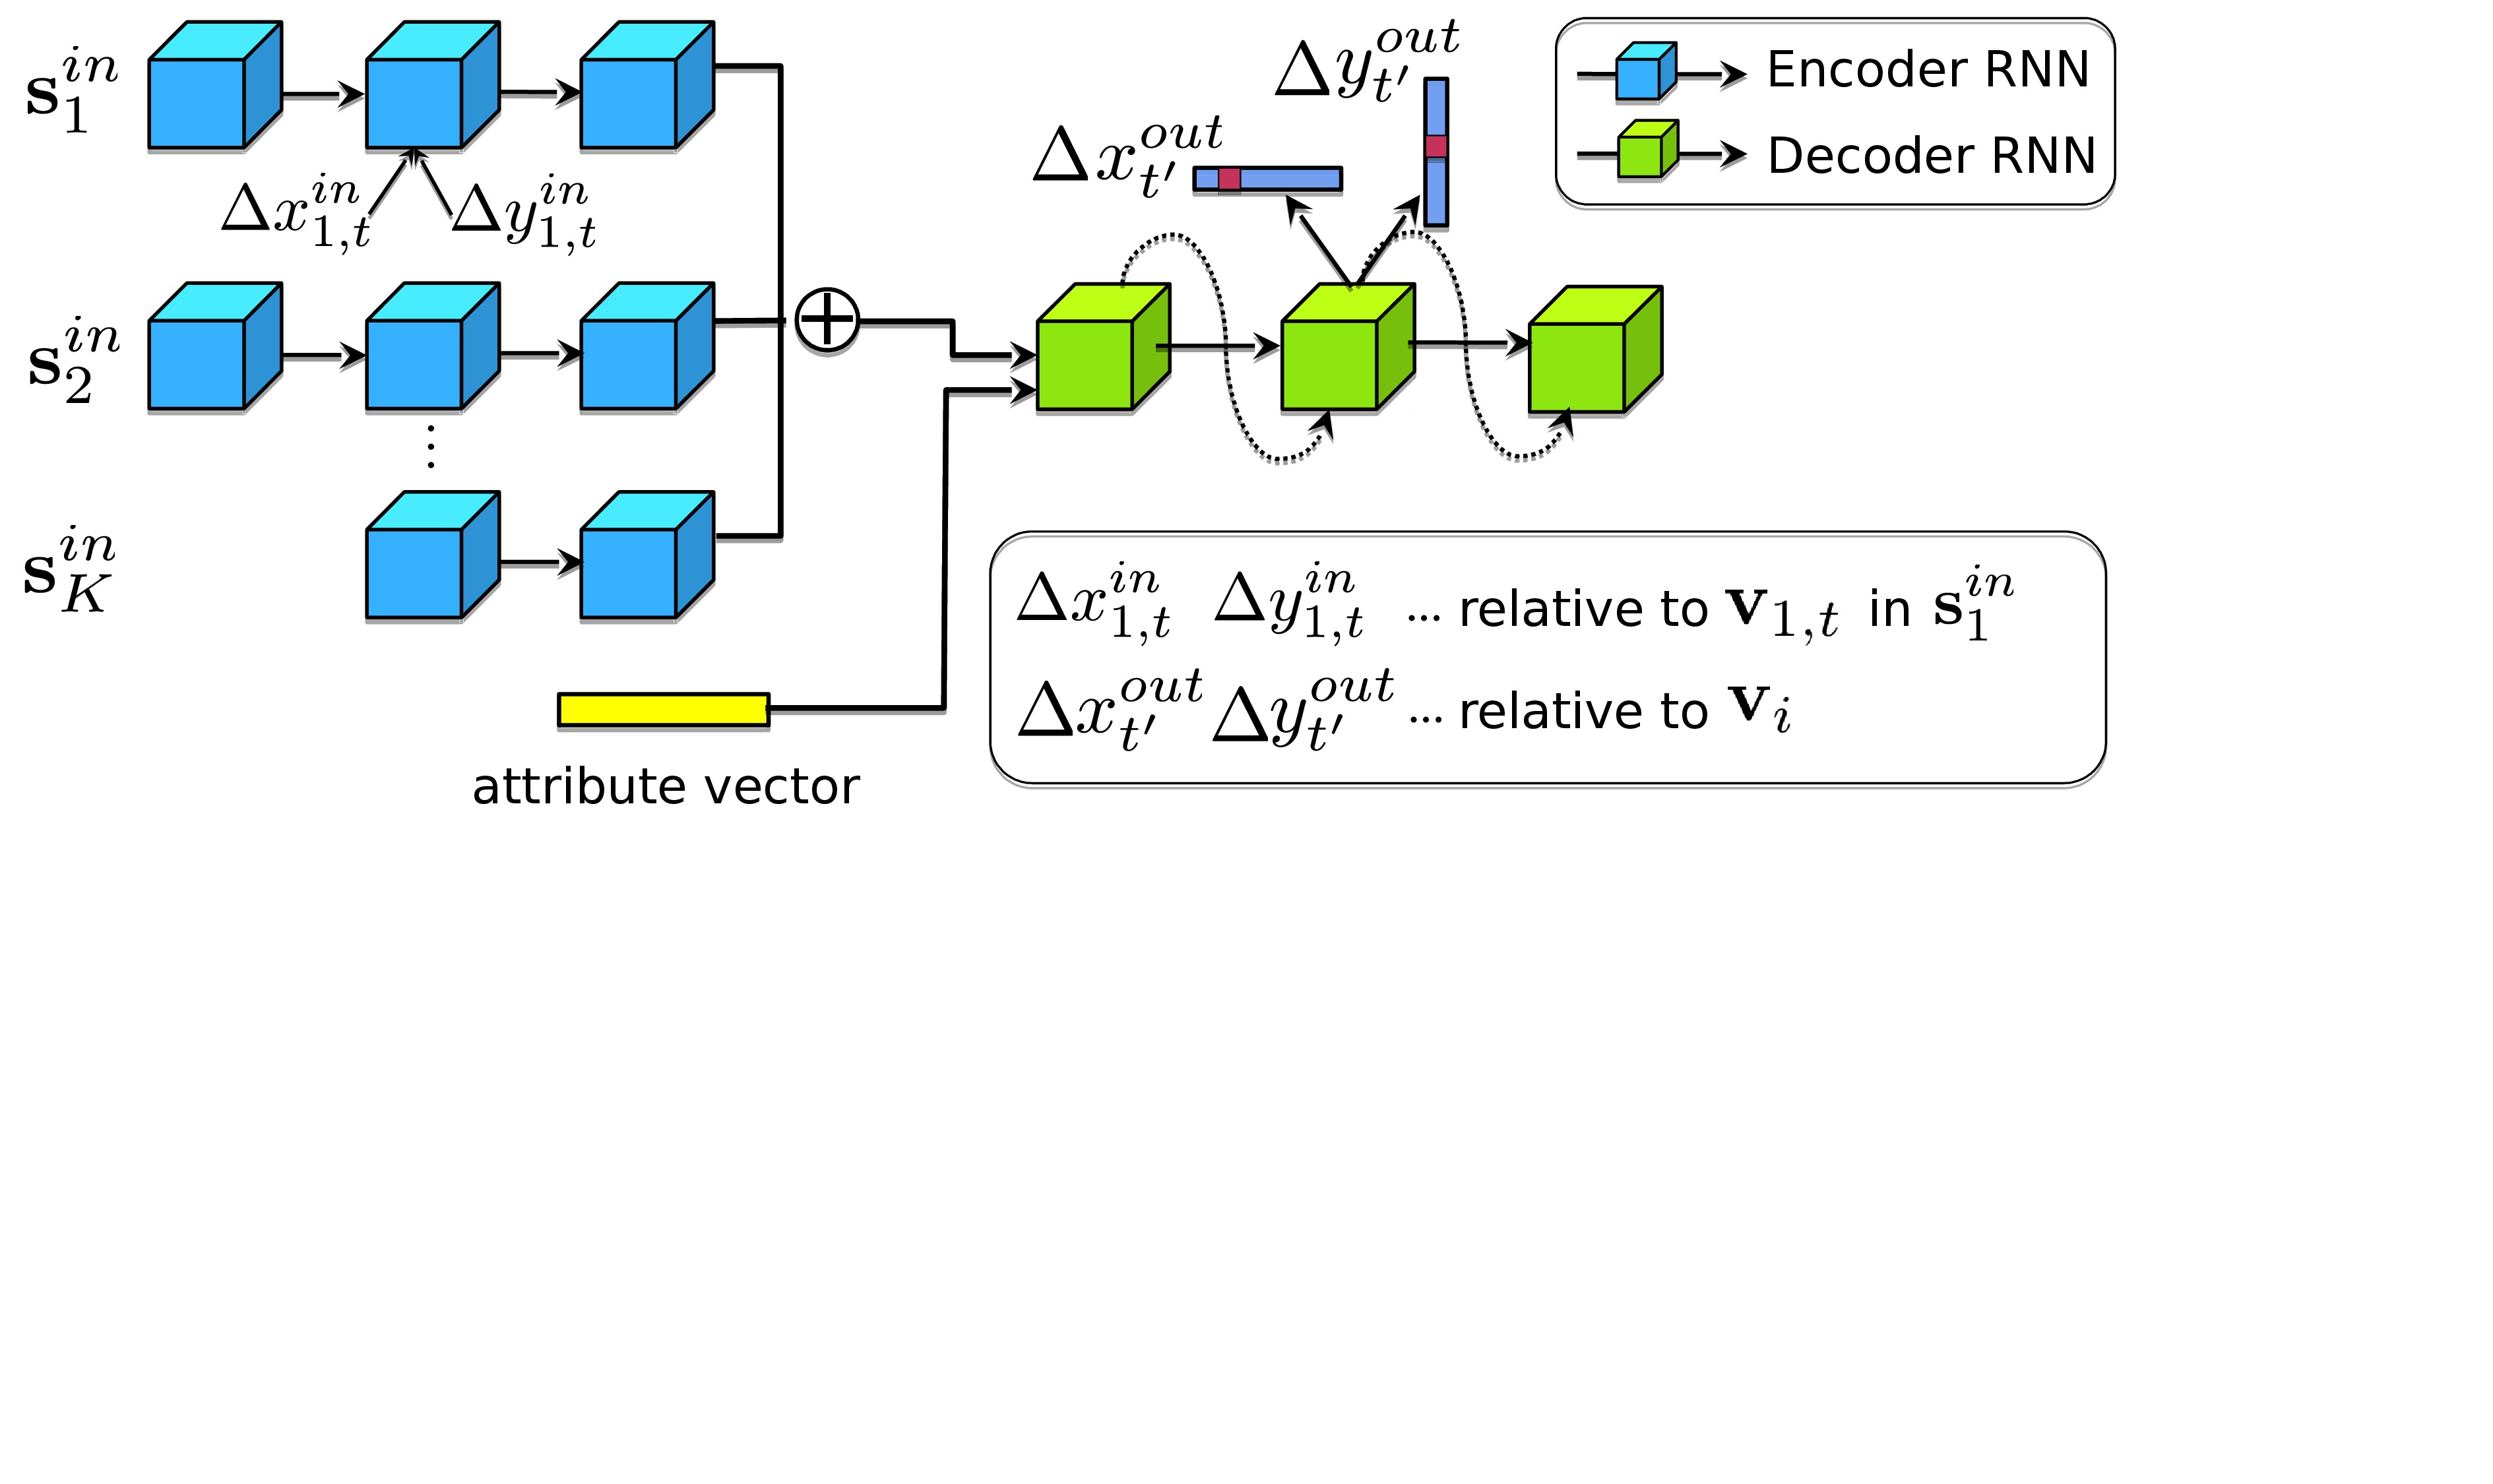
Illustration of the Neural Turtle Graphics (NTG) model. (a)
depicts acyclic incoming paths {$\mb{s}^{in}$} of an active
node$\mb{v}_i$, each of which
is encoded using an RNN encoder. NTG decoder then predicts a set of
outgoing nodes {$\mb{v}^{out}$}. (b) shows the NTG’s neural
network architecture. First, the encoder GRU consumes the motion
trajectory $\Delta\mb{x}^{in}$ of each
incoming path. We produce an order-invariant representation by summing
up the last-state hidden vectors across all paths. Next, the decoder
produces “commands” to advance the turtle and produces new nodes. An
optional attribute vector can be further added to the decoder depending
on the task.
Notation
Road Layout. We represent a city road layout using an undirected
graph $`{G}=\{{V},{E}\}`$, with nodes $`V`$ and edges $`{E}`$. A node
$`\mb{v}_i\in {V}`$ encodes its spatial location $`[x_i,y_i]^T`$, while
an edge $`e_{\mb{v}_{i},\mb{v}_{j}}\in\{0,1\}`$ denotes whether a road
segment connecting nodes $`\mb{v}_i`$ and $`\mb{v}_j`$ exists. City road
graphs are planar since all intersections are present in $`V`$. We
assume it is connected, there is a path in $`G`$ between any two nodes
in $`V`$. The coordinates $`x_i`$ and $`y_i`$ are measured in meters,
relative to the city’s world location.
Incoming Paths. For a node $`\mb{v}_i`$, we define an Acyclic
Incoming Path as an ordered sequence of unique, connected nodes which
terminates at $`\mb{v}_i`$: $`\mb{s}^{in}`$=
{$`\mb{v}_{i,1},\mb{v}_{i,2},...,\mb{v}_{i,L}, \mb{v}_{i}`$} where
$`e_{\mb{v}_{i,t},\mb{v}_{i,t+1}}=1`$ for each $`1\leq t < L`$, and
$`e_{\mb{v}_{i,L},\mb{v}_{i}}=1`$, with $`L`$ representing the length of
the path. Since multiple different acyclic paths can terminate at
$`\mb{v}_i`$, the set of these paths is denoted as
$`S_i^{in}:= \{\mb{s}_k^{in}\}`$.
Outgoing Nodes. We define
$`{V}^{out}_{i} := \{\mb{v}_j: \mb{v}_j \in V \wedge e_{\mb{v}_{i},\mb{v}_{j}}=1\}`$,
as the set of nodes with an edge to $`\mb{v}_i`$.
Graph Generation
We learn to generate graphs in an iterative manner. The graph is
initialized with a root node and a few nodes connected to it, which are
used to initialize a queue $`Q`$ of unvisited nodes. In every iteration,
an unvisited node from $`Q`$ is picked to be expanded (called active
node). Based on its current local topology, an encoder model
generates a latent representation, which is used to generate a set of
neighboring nodes using a decoder model. These generated nodes are
pushed to $`Q`$. The node to be expanded next is picked by popping from
$`Q`$, until it is empty.
By construction, an active node $`\mb{v}_i`$ has at least one neighbor
node in the graph. NTG extracts a representation of its local topology
by encoding incoming paths $`S_{i}^{in}`$ (of maximum length L) and
uses the representation to generate a set of outgoing nodes
$`V_{i}^{out}`$ (if any) with edges to $`\mb{v}_i`$. These paths are
encoded in an order-invariant manner and the resulting latent
representation is used to generate a set of outgoing nodes
$`V_i^{out}`$. NTG performs the encoding and decoding to generate the
graph as described above with an encoder-decoder neural network.
Fig. 1(a) visualizes the process, while
Fig. 1(b) illustrates the encoder-decoder
neural architecture, which is described in detail in the following
sections.
NTG Encoder. We encode a single incoming path $`\mb{s}^{in}`$ into
node $`\mb{v}_i`$ with a zero-initialized, bidirectional GRU . The input
to the GRU while processing the $`t^{th}`$ node in the path is the
motion vector between the nodes $`\mb{v}_{i,t}^{in}\in\mb{s}^{in}`$ and
$`\mb{v}_{i,t+1}^{in}\in\mb{s}^{in}`$ in the path; ,
$`[\Delta x_{i,t}^{in},\Delta y_{i,t}^{in}]^T=[x_{i,t+1}^{in},y_{i,t+1}^{in}]^T-[x_{i,t}^{in},y_{i,t}^{in}]^T`$.
This offset could be encoded as a discrete or continuous value, as
discussed in Sec. 8.4. The final latent representation
$`\mb{h}_\mathrm{enc}`$ for all paths is computed by summing the last
hidden states of each path. Optionally, we append an attribute vector
$`\mb{h}_\mathrm{attr}`$ to the latent representation. For example, the
attribute could be an embedding of a one-hot vector, encoding the city
identity. This enables NTG to learn an embedding of city, enabling
conditional generation. The final encoding is their concatenation
$`[\mb{h}_\mathrm{enc}, \mb{h}_\mathrm{attr}]`$.
Sampling Incoming Paths. During training, for an active node
$`\mb{v}_i`$ we use a subset of $`{S}_{i}^{in}`$ by sampling $`K`$
random walks (without repetition) starting from $`\mb{v}_i`$, such that
each random walk visits at most $`L`$ different nodes. We find this
random sampling to lead to a more robust model as it learns to generate
from incomplete and diverse input representations. Optionally, we can
also feed disconnected adjacent nodes as additional input. We found this
to perform similarly in the task of road modeling due to high
connectivity in data.
Decoder. We decode the outgoing nodes $`{V}^{out}_i`$ with a decoder
GRU. The recurrent structure of the decoder enables capturing local
dependencies between roads such as orthogonality at road intersections.
We independently predict $`\Delta x_{t'}^{out}`$ and
$`\Delta y_{t'}^{out}`$ for an outgoing node $`\mb{v}_{t'}^{out}`$,
indicating a new node’s relative location w.r.t. $`\mb{v}_i`$.
Additionally, we predict a binary variable which indicates whether
another node should be generated. At generation time we check overlap
between the new node and existing graph with a 5$`m`$ threshold to
produce loops. Optionally, we predict the edge type between
$`(\mb{v}_i, \mb{v}_{t'}^{out})`$, minor or major road, using a
categorical variable. The hidden state $`\mb{h}_{t'}`$ of the decoder is
updated as:
Parsing with Map Prior. The dominant approaches to parse roads from
aerial imagery have trained CNNs to produce a probability (likelihood)
map, followed by thresholding and thinning. This approach typically
results in maps with holes or false positive road segments, and
heuristics are applied to postprocess the topology. We view a NTG model
trained to generate city graphs (not trained for road parsing) as a
prior, and use it to postprocess the likelihood coming from the CNN.
Starting from the most confident intersection node as the root node, we
push all its neighbors into the queue of unvisited nodes, and then use
NTG to expand the graph. At each decoding step, we multiply the
likelihood from CNN with the prior produced by NTG, and sample output
nodes from this joint distribution. The end of sequence is simply
determined by checking whether the maximum probability of a new node
falls below a threshold (0.05 in our paper).
Image-based NTG. We also explore explicitly training NTG for
aerial parsing. We condition on image features by including predictions
from a CNN trained to parse aerial images in the attribute vector
$`\mb{h}_{attr}`$. In practice, we initialize the graph obtained by
thresholding and thinning the ouputs of the CNN, and use the trained
image-based NTG on top.
Implementation Details
We exploit the same NTG model in both tasks of city generation and road
detection. Depending on the task, we empirically find that the best
parameterization strategy varies. For city generation, we use discrete
$`\Delta x`$, $`\Delta y`$ with resolution of 1m for both encoder and
decoder, where $`x`$ points to east and $`y`$ points to north. Here,
$`\Delta x`$ and $`\Delta y`$ are limited to $`[-100:100]`$, indicating
that the largest offset in either direction is 100m. The discrete
$`\Delta x`$ and $`\Delta y`$ values are given associated embeddings
(resembling words in language models), which are concatenated to
generate the input to the encoder at every step. For road detection, we
use continuous polar coordinates in the encoder, where the axis is
rotated to align with the edge from the previous to the current node.
This forms rotation invariant motion trajectories that help detecting
roads with arbitrary orientation. The decoder always uses a discrete
representation. We encode and decode the coordinates $`x`$ and $`y`$
independently. We find that this yields similar results compared to
joint prediction, while significantly saving training memory and model
capacity. 500 hidden units are used in encoder and decoder GRUs.
Learning & Inference
Inference. At each inference step, we pop a node from the queue
$`Q`$, encode its existing incoming paths, and generate a set of new
nodes. For each new node, we check if it is in the close proximity of an
existing node in the graph. If the distance to an existing node is below
a threshold $`\epsilon`$ (5m in our paper), we do not add the new node
to the queue. Instead, an edge is included to connect the current node
to the existing node. This enables the generation of cycles in the
graph. We also find the maximum node degree, maximum node density, and
minimum angle between two edges in the training set, and ensure our
generation does not exceed these limits. We refer to supplemental
material for their effects.
Learning. At training time, $`K`$ incoming paths for each
$`\mb{v}_i`$ are sampled, and we learn to predict all of its
neighboring nodes. We enforce an order in decoding the nodes, where we
sort nodes counter-clockwise to form a sequence. The ordering saves
having to solve an assignment problem to compute the loss function. Our
model is trained using ground truth map data with teacher-forcing ,
using a cross entropy loss for each of the output nodes. The networks
are optimized using Adam with a learning rate of 1e-3, weight decay of
1e-4, and gradient clipping of 1.0.
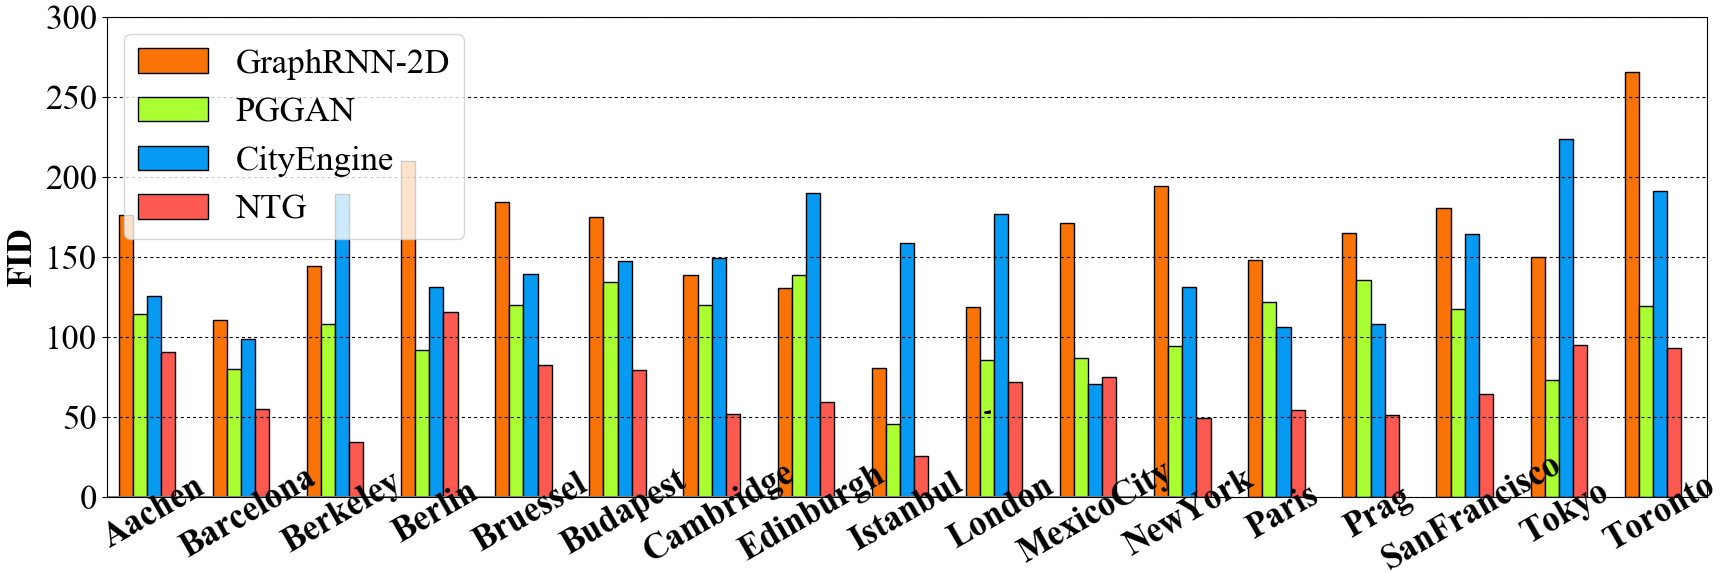
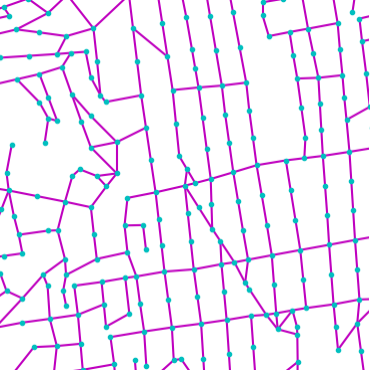
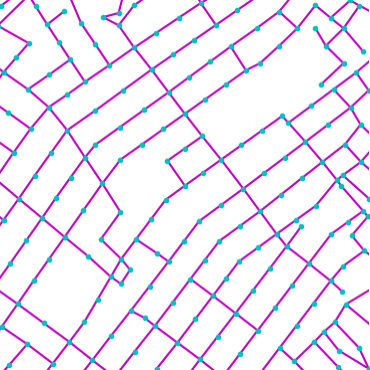
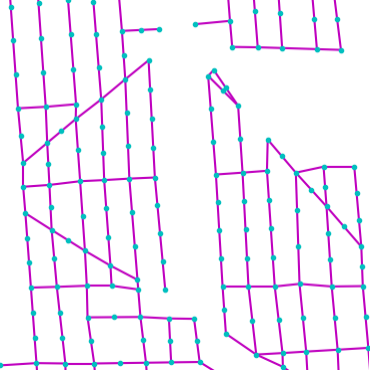
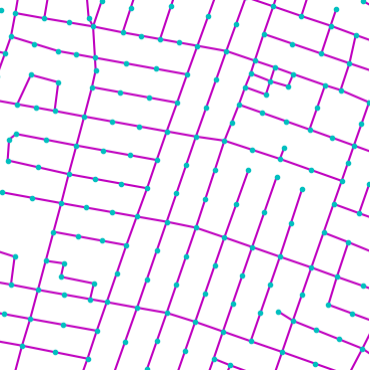
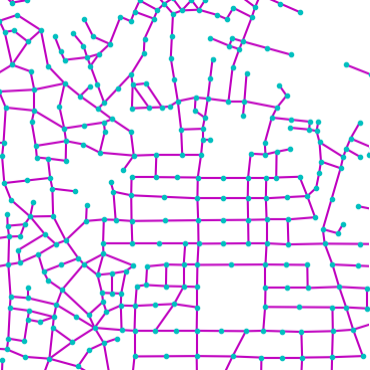
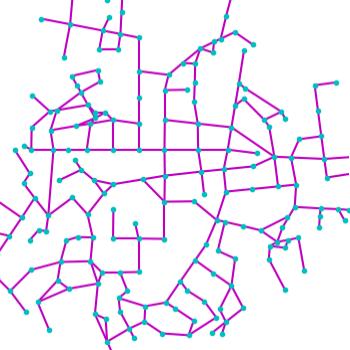
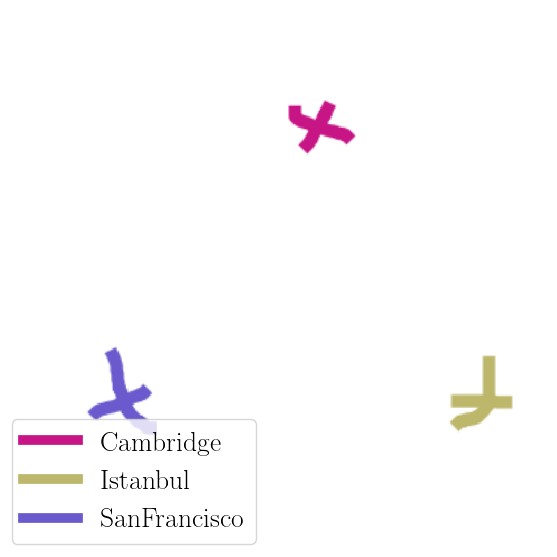
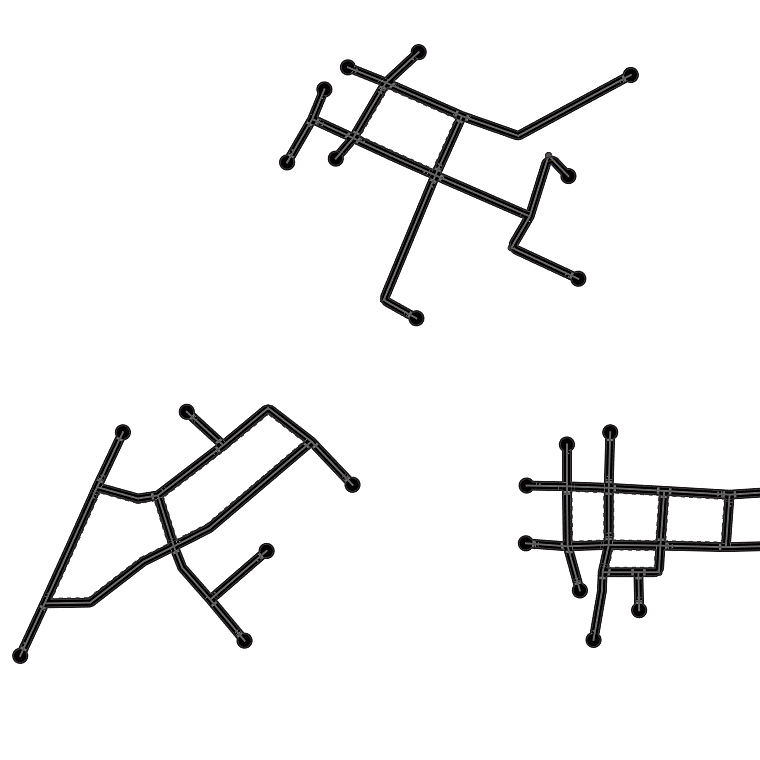
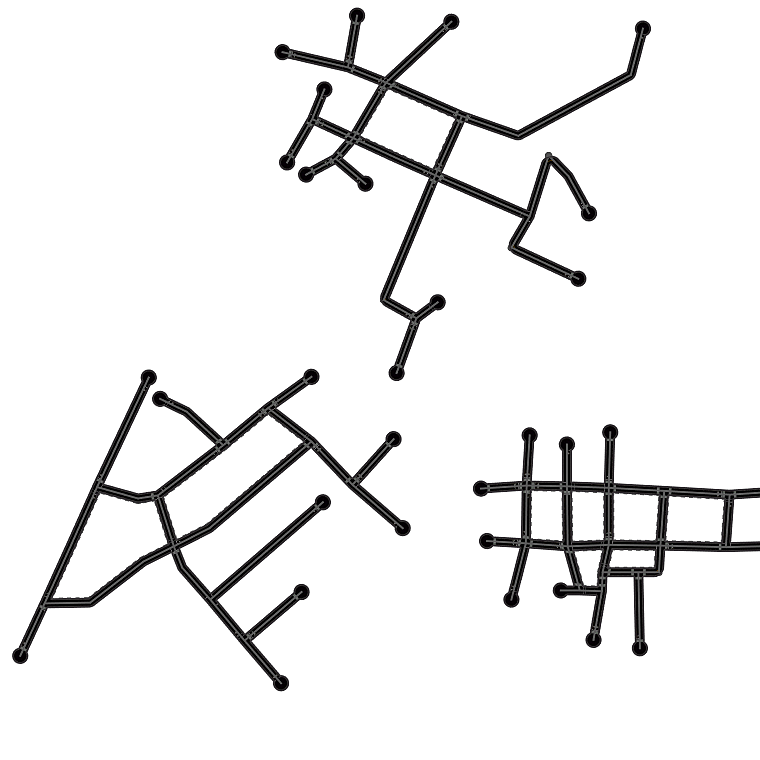
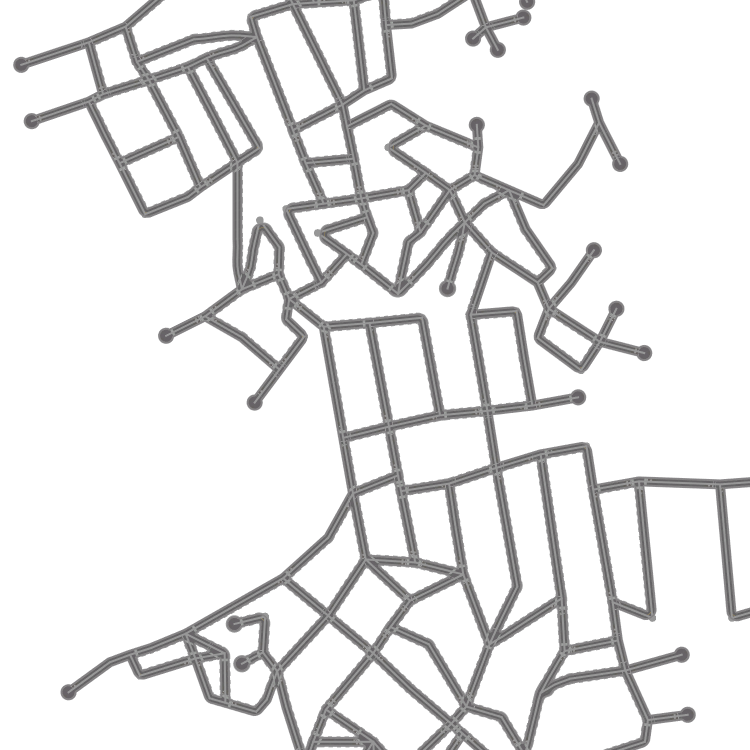
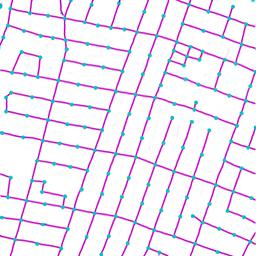
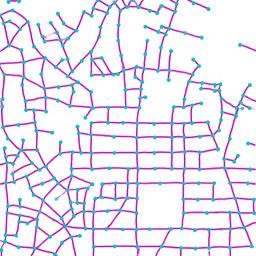
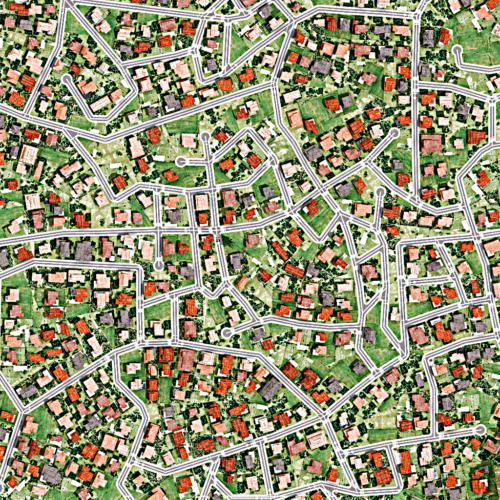
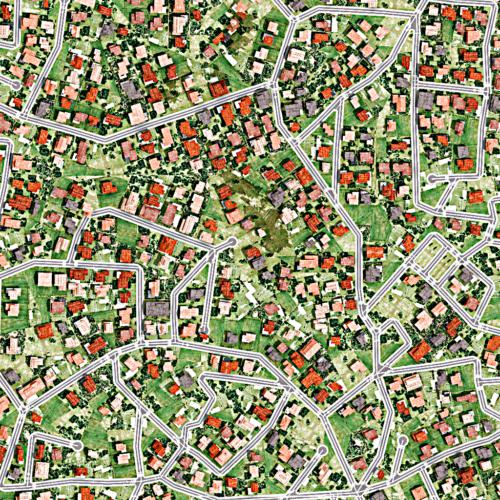
Qualitative examples of city road layout generation.
GraphRNN-2D generates unnatural structures and fails to capture city
style. PGGAN is unable to create new cities by either severely
overfitting, or producing artifacts. CityEngine produces less style
richness due to its fixed rule-based synthesis algorithm. NTG is able to
both capture the city style and creating new cities.
We demonstrate NTG on three tasks: city road layout generation,
satellite road parsing, and environment simulation.
City Road Layout Generation
RoadNet Dataset. We collected a real-world road dataset from
OpenStreetMap (OSM) to facilitate this task. In particular, we selected
17 unique cities across continents and gathered all road markers. OSM,
being crowd-sourced, often has incomplete markers in underpopulated
areas. To alleviate this, we manually select the most densely annotated
10km$`^2`$ region within each city. These constitute our final RoadNet
dataset. Table 1 shows the statistics.
Metrics
The goals of road layout generation are to create road networks that
are: a) Perceptually plausible and preserve a meaningful city style,
and b) Diverse. We use three broad categories of automatic metrics
to evaluate city generation:
Perceptual: For every node, we render the graph in a 300m
neighborhood centered around it on a canvas. With their perceptual
features extracted from an InceptionV3 network , we compute the Fréchet
Inception Distance (FID) between the synthesized roads and ground truth
maps for each city. To ensure a meaningful FID, we adapt InceptionV3,
which has originally been trained on natural images, to road drawings,
by finetuning it to predict city ids on our dataset. This yields a
90.27% accuracy, indicating effective capture of style across cities in
the network.
Urban Planning : We measure four common urban planning features
reflecting city style: 1. Node density within a neighborhood of
100m, 200m, and 300m. 2.Connectivity as reflected by the
degrees of nodes. 3.Reach as the total length of accessible roads
within a distance of 100m, 200m, and 300m. 4.) Transportation
convenience as the ratio of the euclidean distance over the Dijkstra
shortest path for node pairs that are more than 500m away. We also
compute the Fréchet distance between normal distributions computed from
the concatenation of the Urban Planning features of real and generated
maps.
Diversity metric: We measure the ability to create novel cities by
computing the overlap between a real and generated city as the
percentage of road in one graph falling outside the 10m vicinity of
the road in the other graph, and vice versa. We compare this
Chamfer-like distance against all ground truth maps and report the
average lowest value.
Results
We compare the following methods:
$`\bullet`$ **GraphRNN-2D **: We enhance the GraphRNN model by
introducing extra branches to encode/decode node coordinates and city
id. We add a CNN that takes into account local rendering of existing
graph as in and add checks to avoid invalid edge crossing during
inference.
$`\bullet`$ **PGGAN **: We train to generate images of road layouts at a
resolution of 256$`\times`$256. We use our trained InceptionV3
network to classify samples into cities to compute city-wise metrics.
For computing the graph-related metrics we convert images to graphs by
thresholding and thinning.
$`\bullet`$ **CityEngine **: CityEngine is a state-of-the-art software
for synthesizing cities based on an optimized, complex rule-based
L-system . By default, it only offers limited templates and is incapable
of generating new cities. To enhance CityEngine, we use its provided
control interface and exhaustively search over its attribute space by
enumerating combinations of important control parameters such as angles,
bending specifications, and crossing ratios. We then predict city
probabilities using the InceptionV3 network, and select the highest
ranking 10km$`^{2}`$ as the result for each city.
City-wise FID (fc) of different methods.
$`\bullet`$ NTG: NTG begins with a root node with its edges. We
evaluate NTG with a random root (NTG-vanilla), as well as with a
pre-stored high connectivity root (NTG-enhance).
Tab. [tab:cityresult] and
Fig. 2 show quantitative and qualitative
results, respectively. Quantitatively, NTG outperforms baselines across
all metrics. GraphRNN-2D fails to capture various city styles and
frequently produces unnatural structures. This is due to its sequential
generative nature that depends on Breadth First Search. The RNN that
encodes the full history fails to capture coherent structures since
consecutive nodes may not be spatially close due to BFS. PGGAN produces
sharp images with occasional artifacts that are difficult to convert
into meaningful graphs. Samples from PGGAN are severely overfit as
reflected by the Diversity metric, indicating its inability to create
new cities. Moreover, PGGAN also suffers from mode-collapse and
memorizes a portion of data. This imbalance of style distribution leads
to worse perceptual FIDs. With our enhancement (exhaustive search),
CityEngine is able to capture certain cities’ style elements:
especially the node density. However, it has less topological variance
and style richness due to its fixed set of rules. Expanding its search
from 5000km$`^{2}`$ (CityEngine-5k) to 10000km$`^{2}`$
(CityEngine-10k) of generated maps does not lead to significant
improvements, while requiring double the amount of computation. NTG is
able to create new cities, while better capturing style in most cities
as shown in Fig. 3.
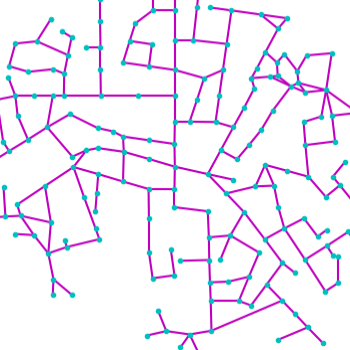
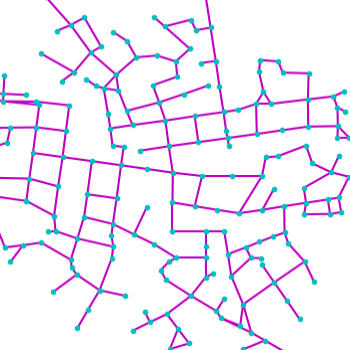
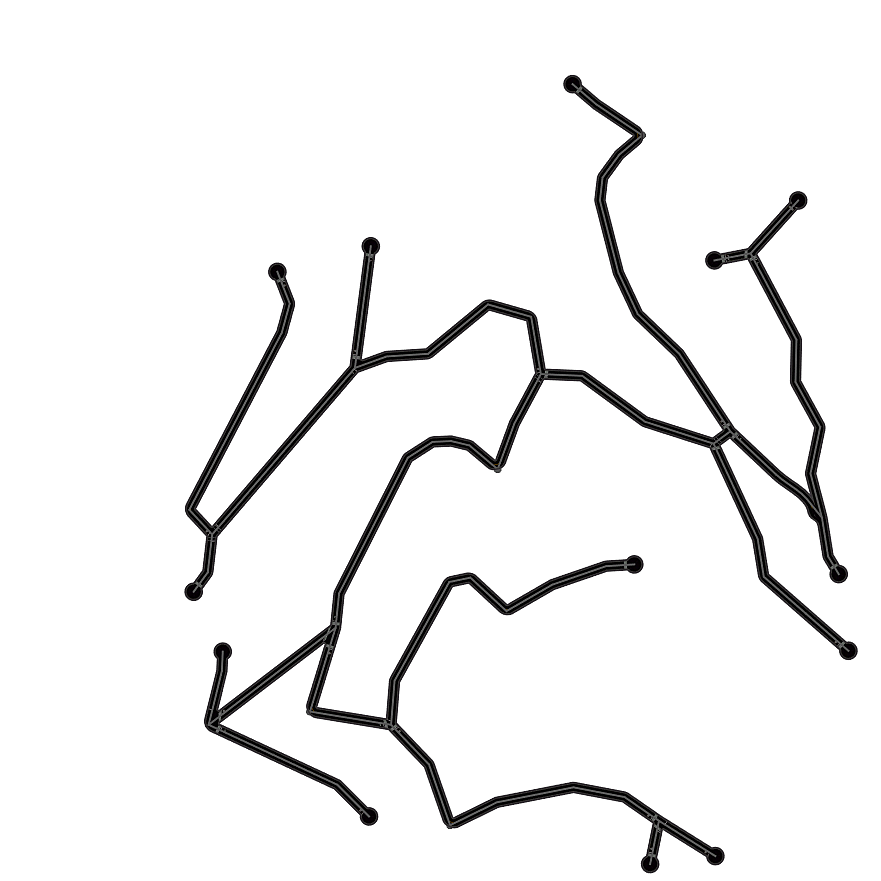
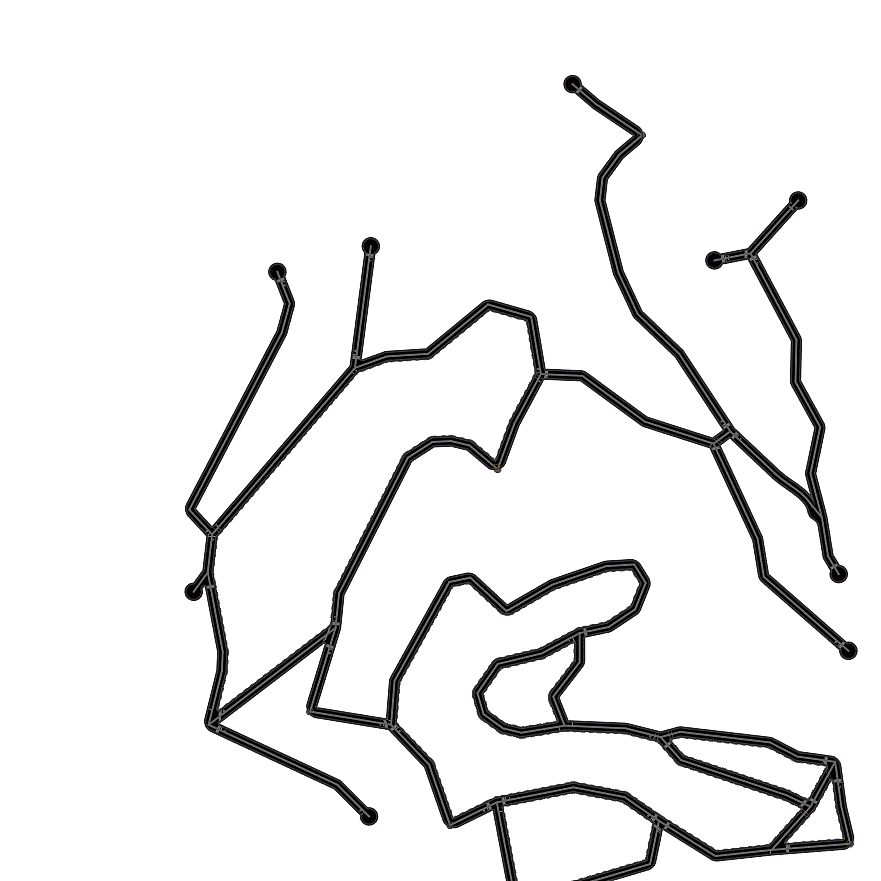
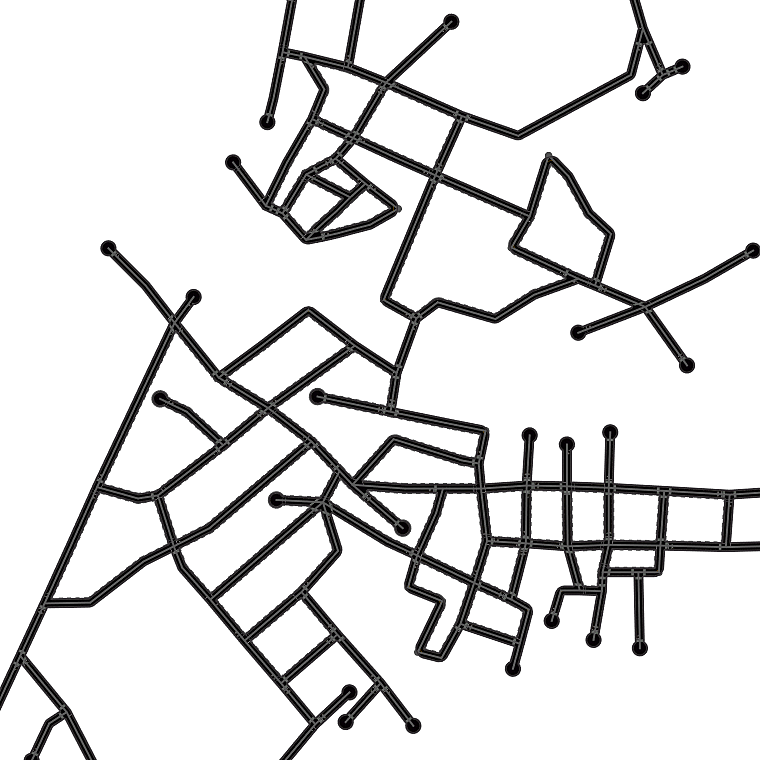
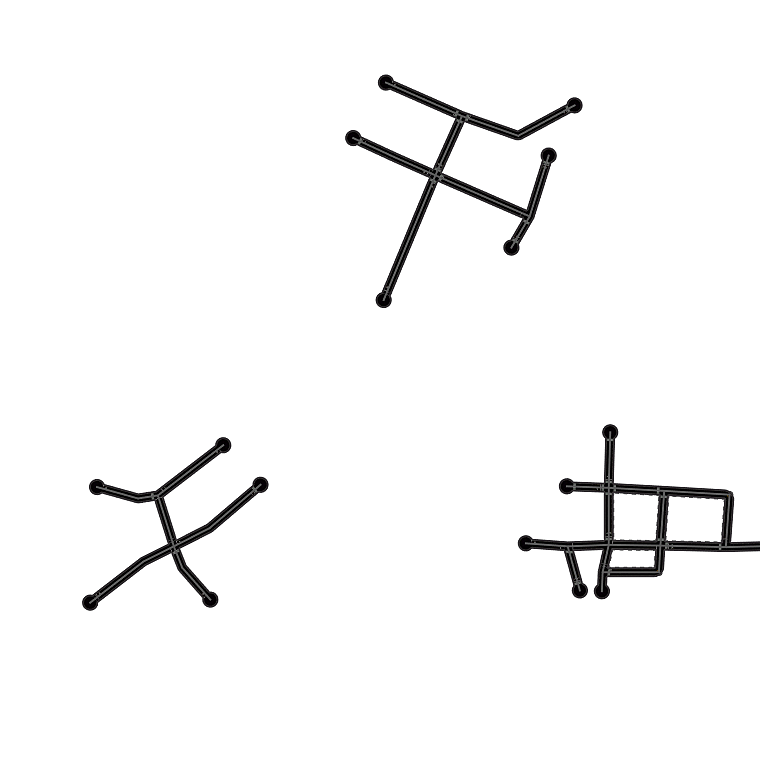
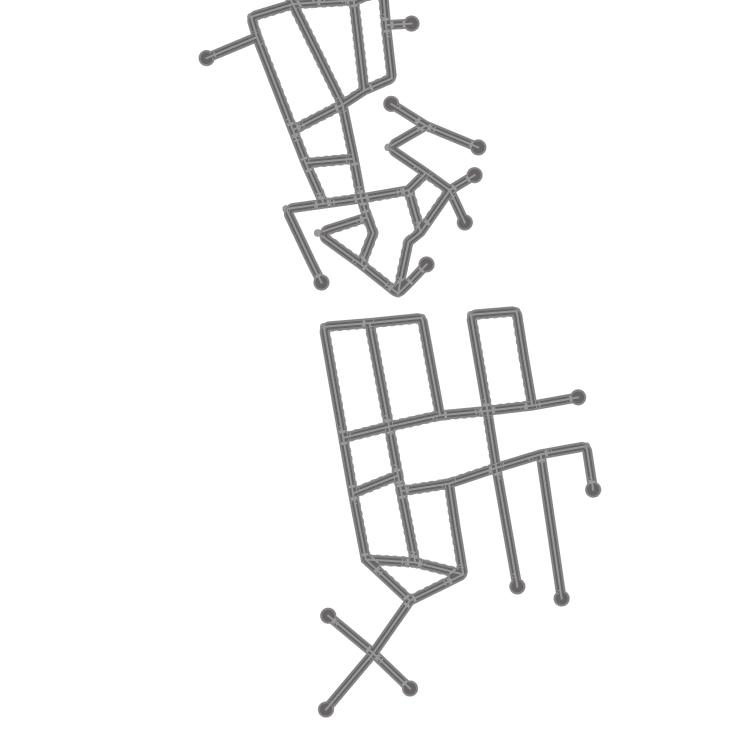
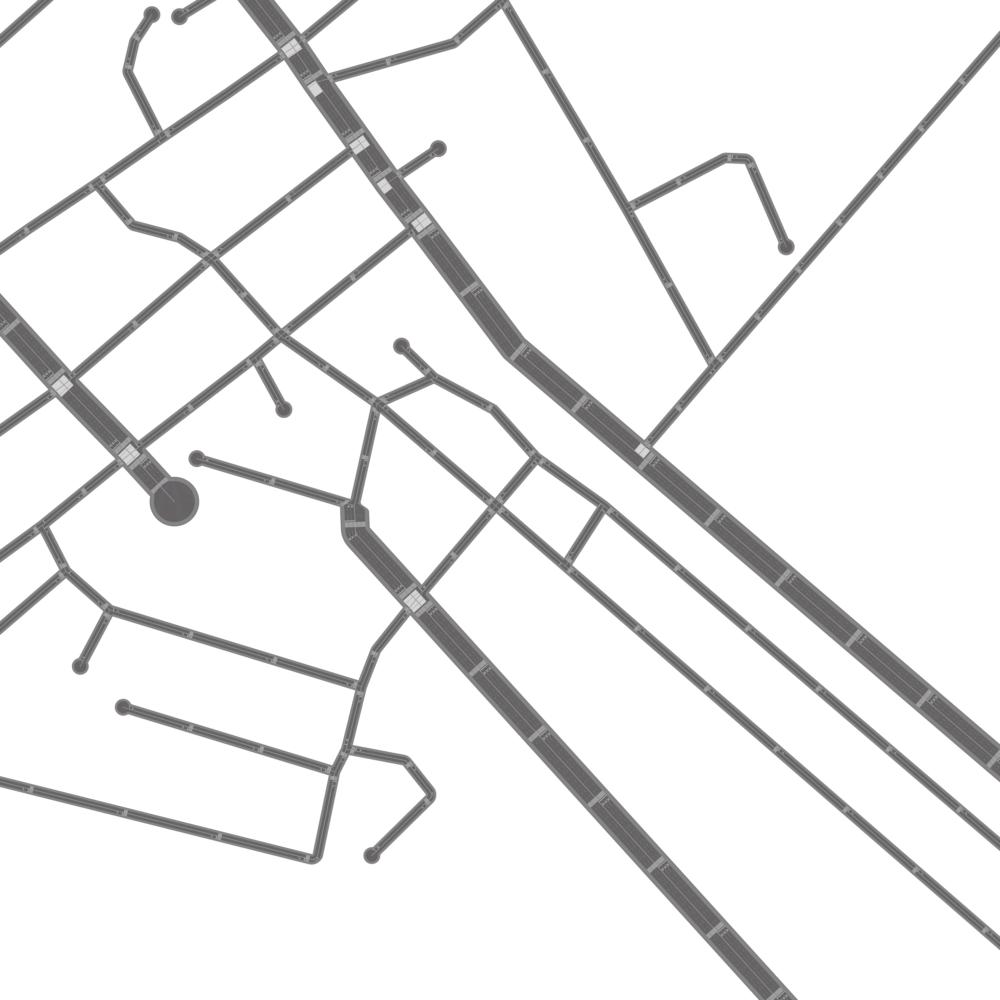
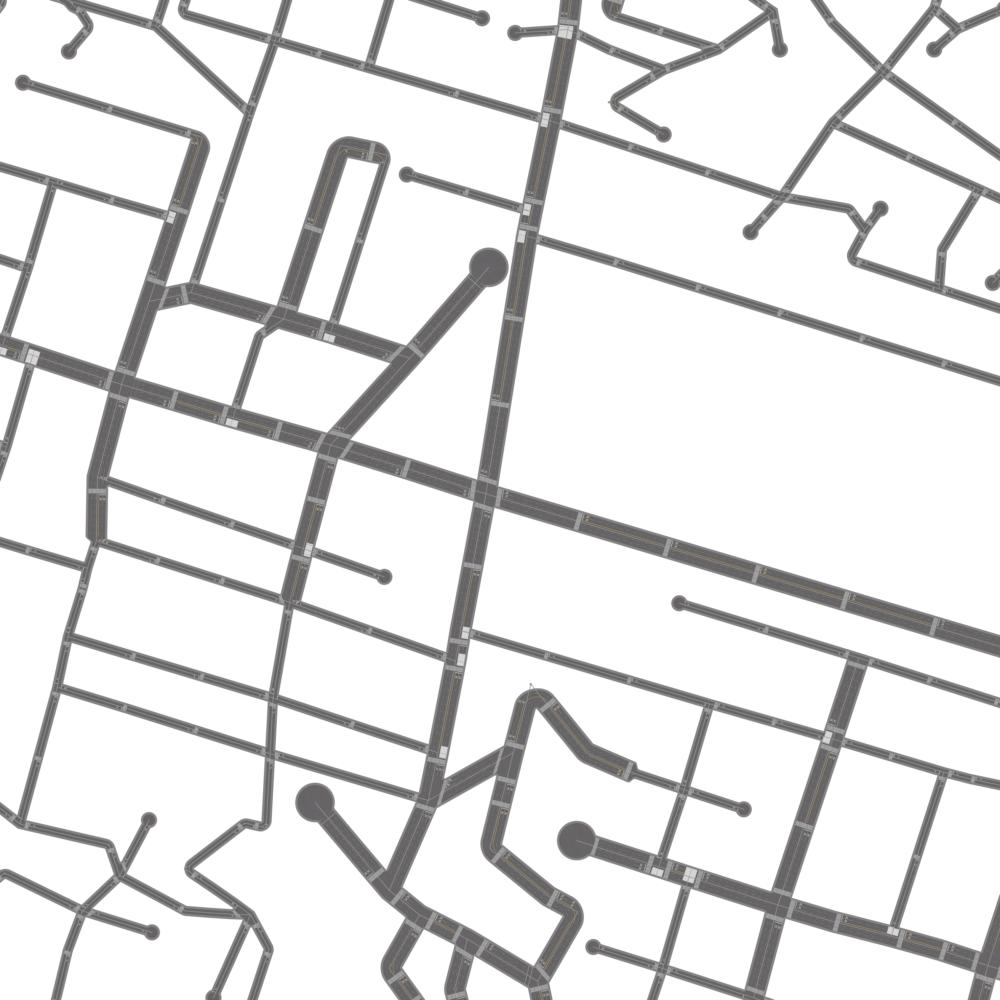
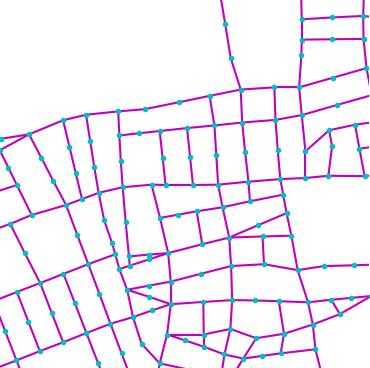
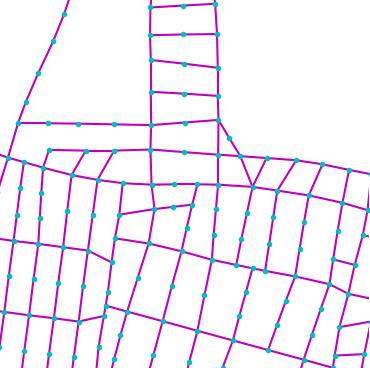
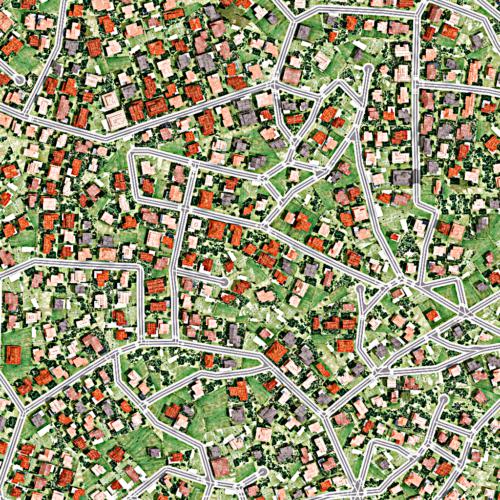
Fig. 4 digs into NTG’s generated maps,
showing that NTG learns to remember local road patterns. As the graph
grows, different local topologies are organically intertwined to produce
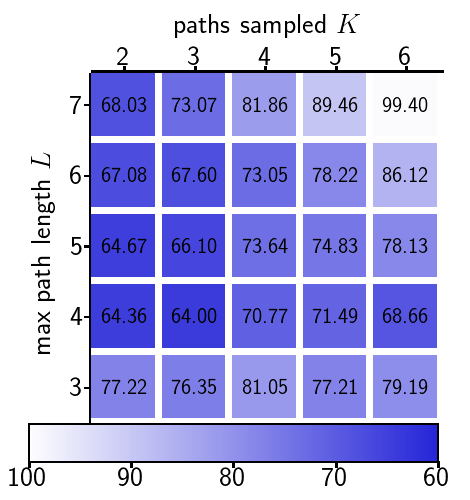
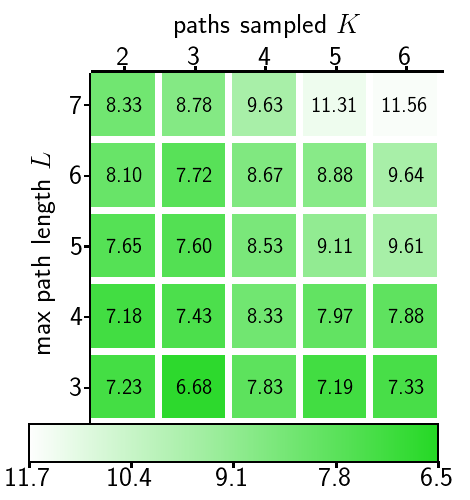
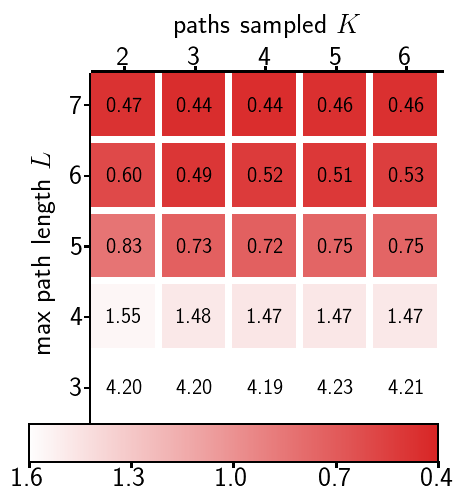
new cities. Fig. 5 shows the effect of two important
hyper-parameters: maximum number of paths $`K`$ and maximum incoming
path length $`L`$. Results show that reconstruction quality is
determined by $`L`$, while $`K`$ and $`L`$ both affect inference time.
Training with longer and more paths does not necessarily improve
perceptual quality, since generation starts from a single root node
without long paths.
We further demonstrate our approach by having NTG predict two types of
roads, major and minor roads. Results are shown in
Fig. 7, showing that NTG easily generalizes
to a more complex modeling problem.
GT
NTG
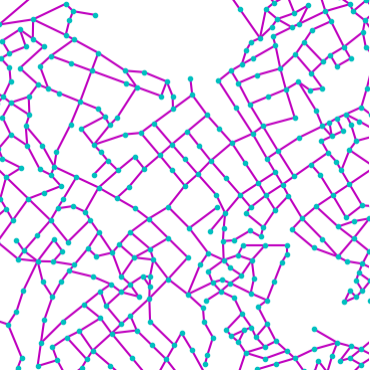
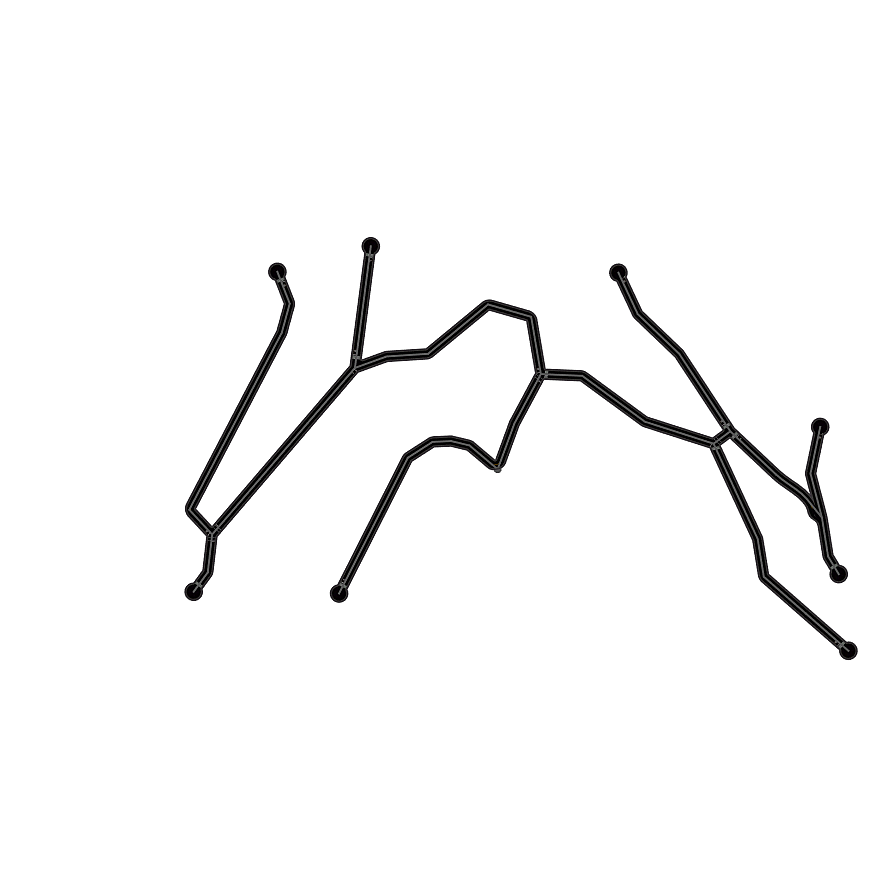
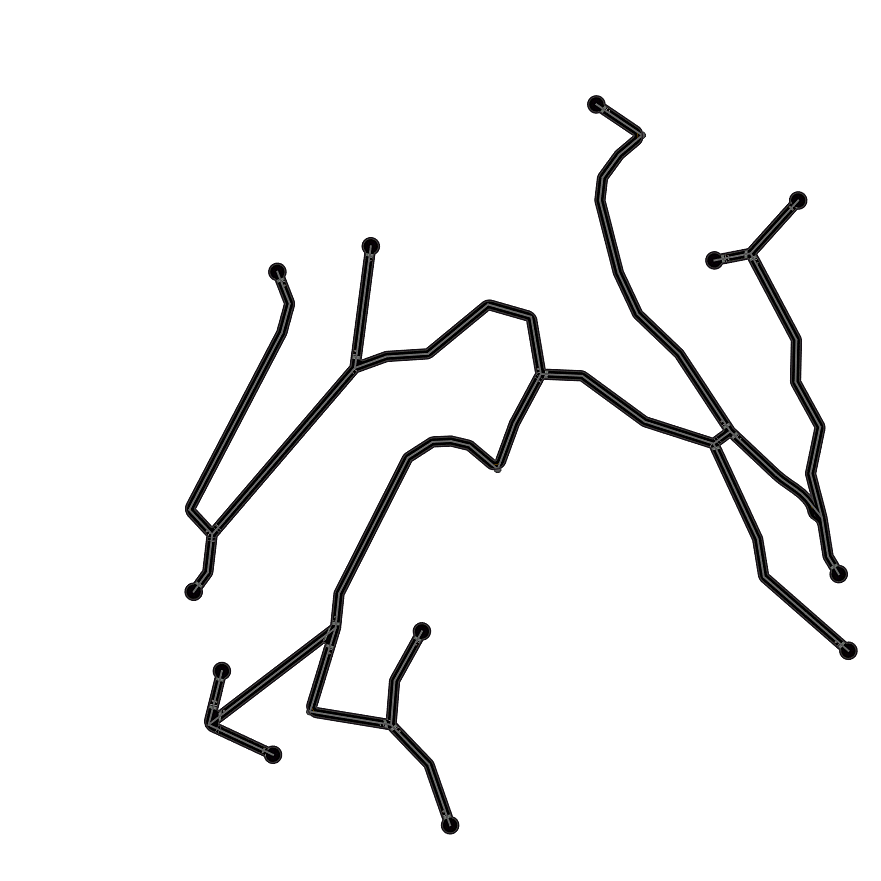
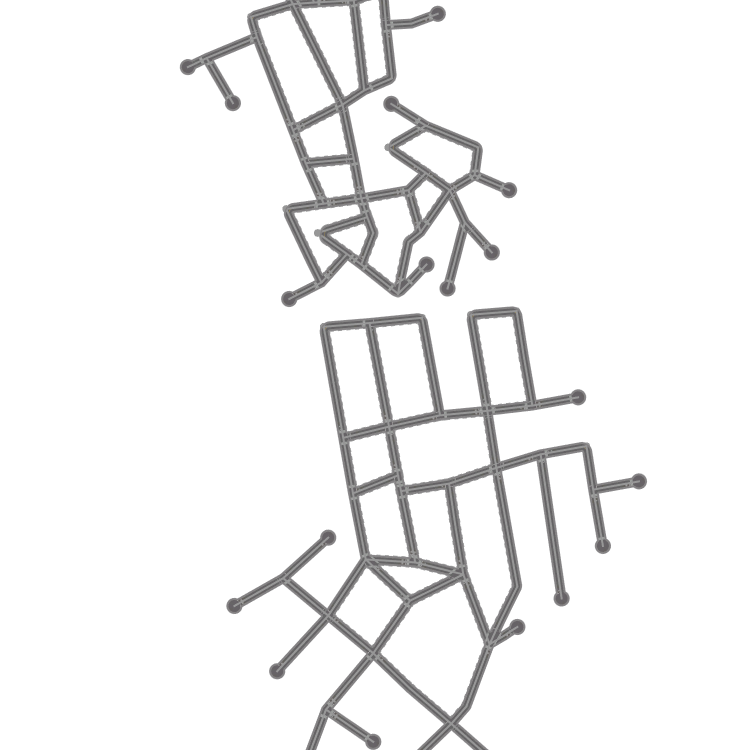
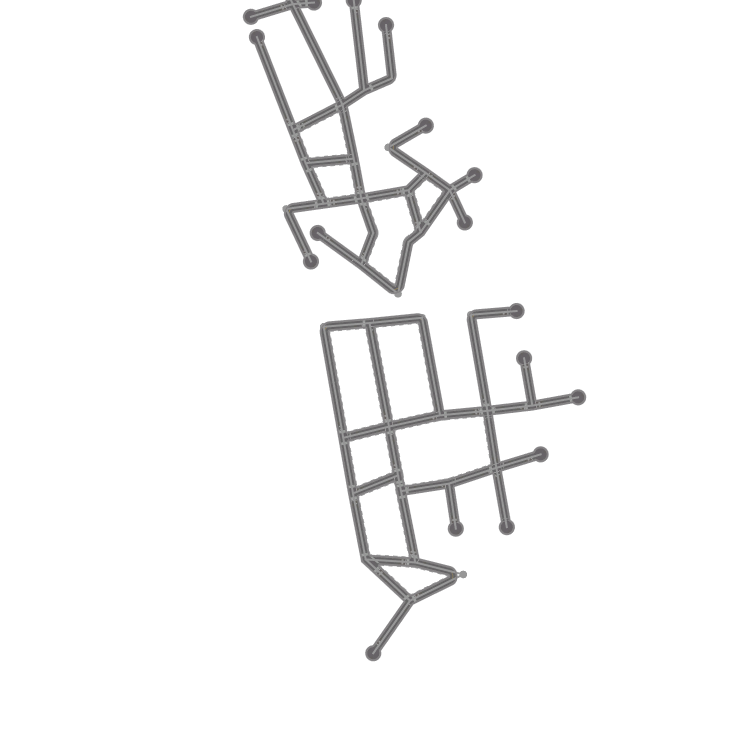
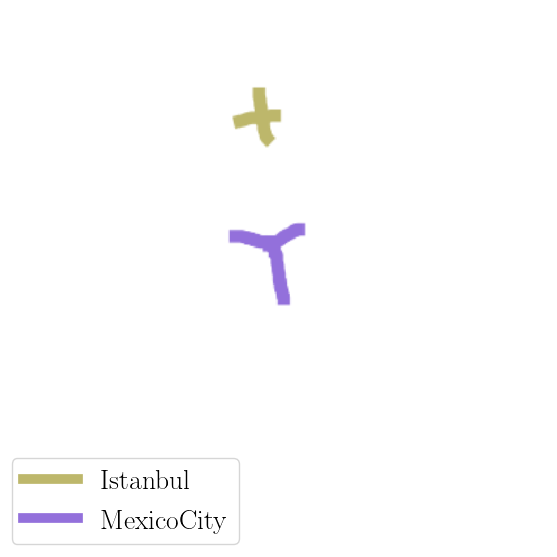
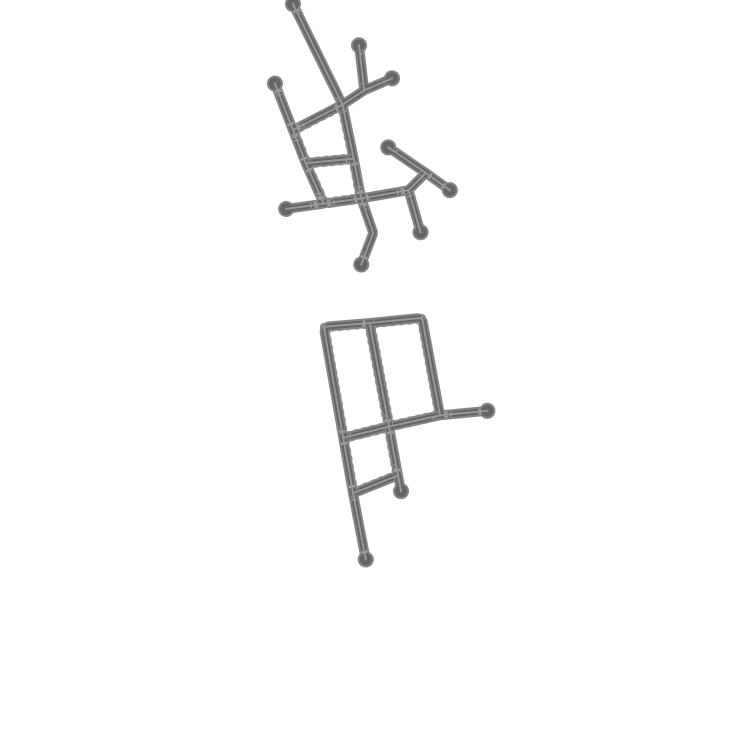
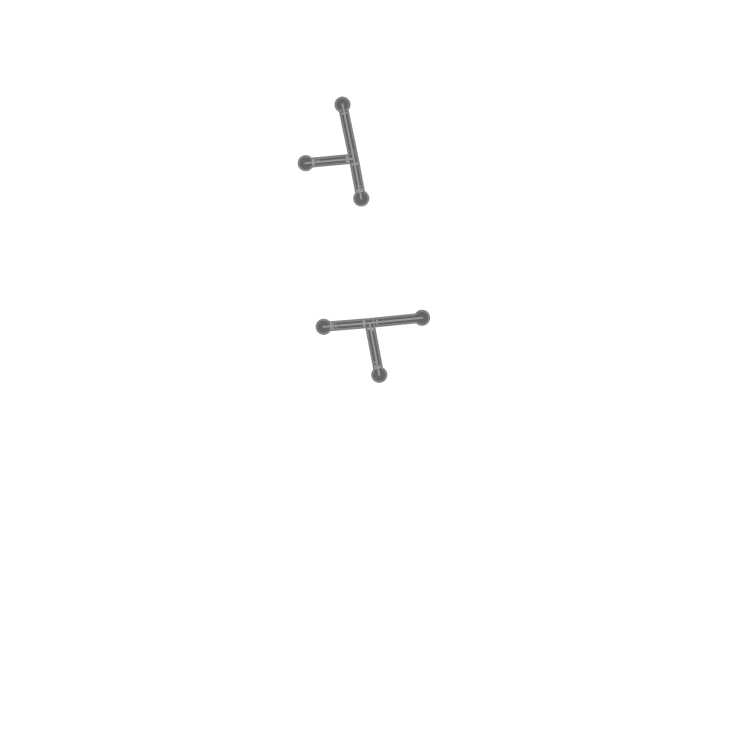
NTG creates new city road layouts in a combinatorial manner.
Local patterns as shown by orange boxes are remembered, and then
intertwined to create novel structures.
Effect of sampled paths K and maximum path length L on reconstruction quality in
meters (red), inference time in seconds per km2 (green), and FID-fc
(blue).
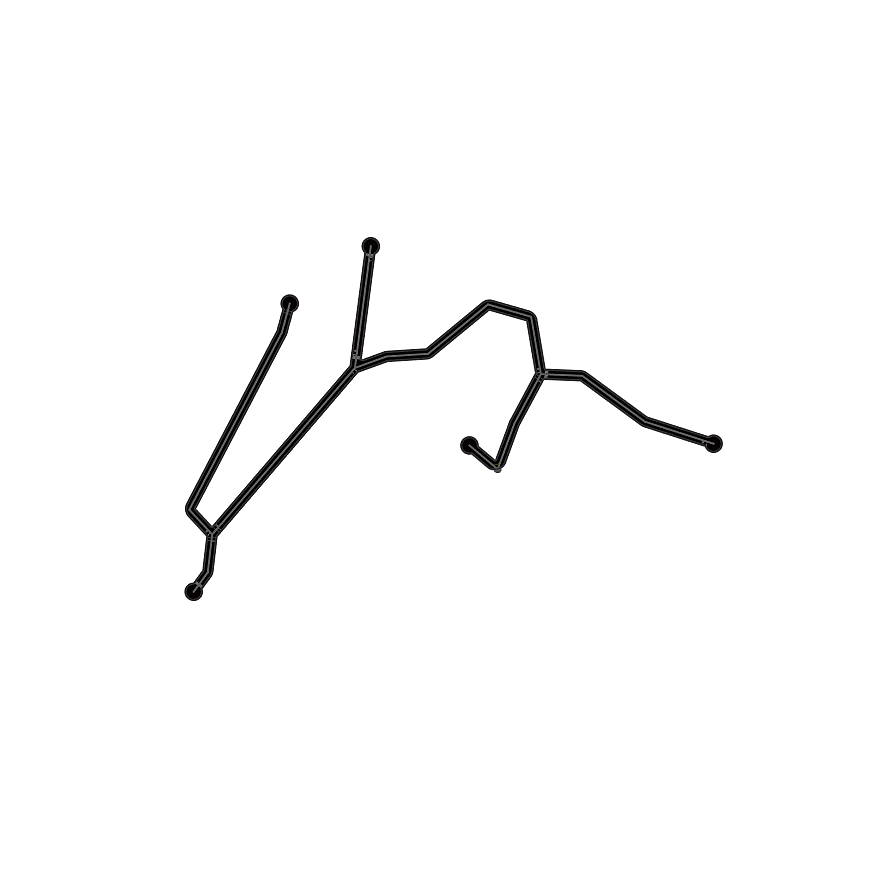
Interactive Synthesis. We showcase an application for interactive
road layout generation where a user chooses from a palette of cities and
provides local topology priors by sketching. We match the user’s input
with pre-stored node templates to form the root node. To allow
generating multiple components on the same canvas, we simply modify the
NTG inference procedure to iterate through multiple queues in parallel.
Fig. 6 shows examples of the generation
process. Beyond Road Layouts. In Appendix, we show results on using
NTG’s multipath paradigm for learning effective representation of
complex shapes, such as multi-stroke hand drawings. This shows potential
as a general purpose spatial graph generative model beyond the city road
modeling.
user input
step 0
step 20
step 40
step 60
step 80
final
Examples of interactive city road layout generation via user
sketching and local style selection.
Brussels
Toronto
NTG can be easily extended to generate road
type.
Introduction
City road layout modeling is an important problem with applications in
various fields. In urban planning, extensive simulation of city layouts
are required for ensuring that the final construction leads to effective
traffic flow and connectivity. Further demand comes from the gaming
industry where on-the-fly generation of new environments enhances user
interest and engagement. Road layout generation also plays an important
role for self-driving cars, where diverse virtual city blocks are
created for testing autonomous agents.
Although the data-driven end-to-end learning paradigm has revolutionized
various computer vision fields, the leading approaches (e.g., the
foundation piece in the commercially available CityEngine software) for
city layout generation are still largely based on procedural modeling
with hand-designed features. While these methods guarantee valid road
topologies with user specified attribute inputs, the attributes are all
hand-engineered and inflexible to use. For example, if one wishes to
generate a synthetic city that resembles e.g. London, tedious manual
tuning of the attributes is required in order to get plausible results.
Moreover, these methods cannot trivially be used in aerial road parsing.
In this paper, we propose a novel generative model for city road layouts
that learns from available map data. Our model, referred to as Neural
Turtle Graphics (NTG) is inspired by the classical turtle graphics
methodology 1 that progressively grows road graphs based on local
statistics. We model the city road layout using a graph. A node in the
graph represents a spatial control point of the road layout, while the
edge represents a road segment. The proposed NTG is realized as an
encoder-decoder architecture where the encoder is an RNN that encodes
local incoming paths into a node and the decoder is another RNN that
generates outgoing nodes and edges connecting an existing node to the
newly generated nodes. Generation is done iteratively, by pushing newly
predicted nodes onto a queue, and finished once all nodes are visited.
Our NTG can generate road layouts by additionally conditioning on a set
of attributes, thus giving control to the user in generating the
content. It can also take a user specified partial sketch of the roads
as input for generating a complete city road layout. Experiments with a
comparison to strong baselines show that our method achieves better road
layout generation performance in a diverse set of performance metrics.
We further show that the proposed NTG can be used as an effective prior
for aerial map parsing, particularly in cases when the imagery varies in
appearance from that used in training. Fine-tuning the model jointly
with CNN image feature extraction further improves results,
outperforming all existing work on the Spacenet benchmark.
Related Work
Classical Work. A large body of literature exists on procedural
modeling of streets. The seminal early work of proposed an L-system
which iteratively generates the map while adjusting parameters to
conform to user guidance. This method became the foundation of the
commercially available state-of-the-art CityEngine software. Several
approaches followed this line of work, exploiting user-created tensor
fields , domain splitting , constraints stemming from the terrain , and
blending of retrieved examplars . Methods that evolve a road network
using constraints driven by crowd behaviour simulation have also been
extensively studied .
Generative Models of Graphs. Graph generation with neural networks
has only recently gained attention . uses an RNN to generate a graph as
a sequence of nodes sorted by breadth-first order, and predict edges to
previous nodes as the new node is added. uses a variational autoencoder
to predict the adjacency and attribute matrices of small graphs. trains
recurrent neural network that passes messages between nodes of a graph,
and generates new nodes and edges using the propagated node
representation. Most of these approaches only predict graph topology,
while in our work we address generation of spatial graphs. Producing
valid geometry and topology makes our problem particularly challenging.
Our encoder shares similarities with node2vec which learns node
embeddings by encoding local connectivities using random walks. Our work
focuses on spatial graph generation and particularly on road layouts,
thus different in scope and application.
Graph-based Aerial Parsing. Several work formulated road parsing as
a graph prediction problem. The typical approach relies on CNN road
segmentation followed by thinning . To deal with errors in parsing,
proposes to reason about plausible topologies on an augmented graph as a
shortest path problem. In , the authors treat local city patches as a
simply connected maze which allows them to define the road as a closed
polygon. Road detection then follows Polygon-RNN which uses an RNN to
predict vertices of a polygon. performs lane detection by predicting
polylines in a top-down LIDAR view using a hierarchical RNN. Here, one
RNN decides on adding new lanes, while the second RNN predicts the
vertices along the lane. In our work, we predict the graph directly.
Since our approach is local, it is able to grow large graphs which is
typically harder to handle with a single RNN. Related to our work,
annotate building footprints with a graph generating neural network.
However, these works are only able to handle single cycle polygons.
Most related to our work is RoadTracer , which iteratively grows a graph
based on image evidence and local geometry of the already predicted
graph. At each step, RoadTracer predicts a neighboring node to the
current active node. Local graph topology is encoded using a CNN that
takes as input a rendering of the existing graph to avoid falling back.
Our method differs in the encoder which in our case operates directly on
the graph, and the decoder which outputs several outgoing nodes using an
RNN which may better capture more complex road intersection topologies.
Furthermore, while relied on carefully designed dynamic label creation
during training to mimic their test time graph prediction, our training
regime is simple and robust to test time inference.
We also note that with some effort many of these work could be turned
into generative models, however, ours is the first that showcases
generative and interactive modeling of roads. Importantly, we show that
NTG trained only on map data serves as an efficient prior for aerial
road parsing. This cannot easily be done with existing work which all
train a joint image and geometry representation.
Conclusion
In this paper, we proposed Neural Turtle Graphics for generating large
spatial graphs. NTG takes the form of an encoder-decoder neural network
which operates on graphs locally. We showcased NTG on generating
plausible new versions of cities, interactive generation of city road
layouts, as well as aerial road parsing. Furthermore, we combined the
two tasks of aerial parsing and generation, and highlighted NTG to
automatically simulate new cities for which it has not seen any part of
the map during training time. In future work, we aim to tackle
generation of other city elements such as buildings and vegetation.
Satellite Road Parsing
SpaceNet Dataset. While several datasets have been presented for
road detection , we use SpaceNet for its large scale, image quality,
and open license. To facilitate consistent future benchmarking, we
reformat the raw data into an easy-to-use version with consistent tile
size in metric space. Tab. 1 shows its statistics. We split tiles of
each city into train-validation-test with a 4-1-1 ratio.
DRM
RoadExtractor
RoadTracer
FCN
DLA+STEAL
NTG
GT
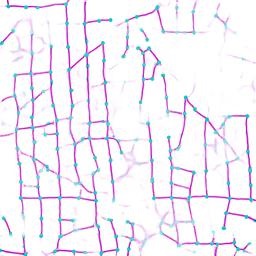
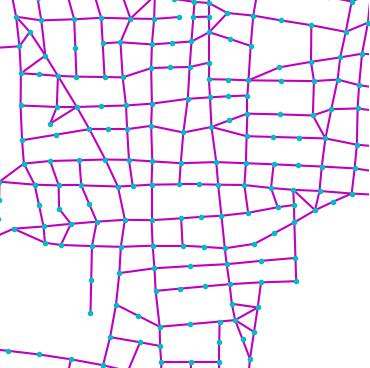
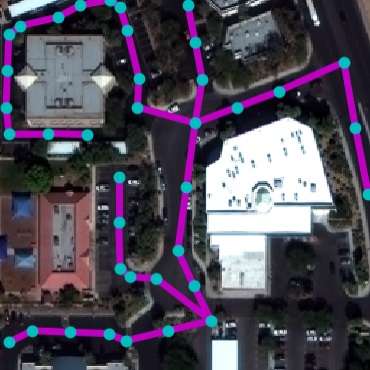
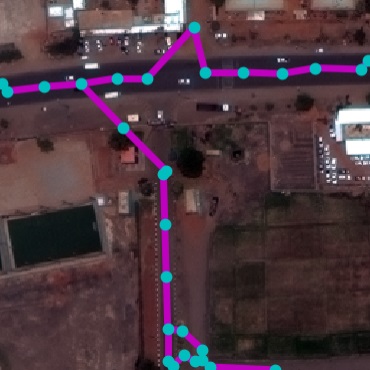
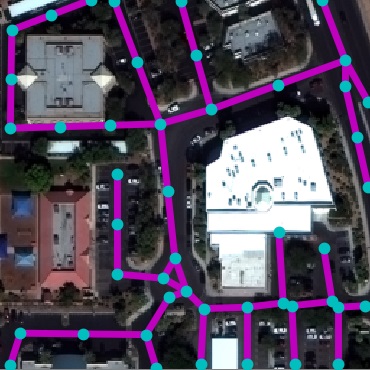
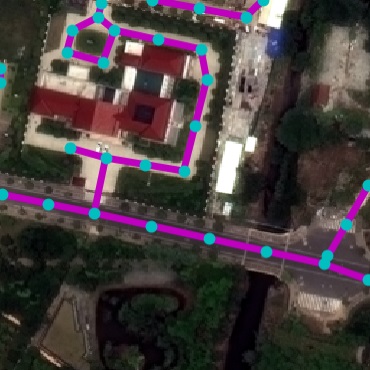
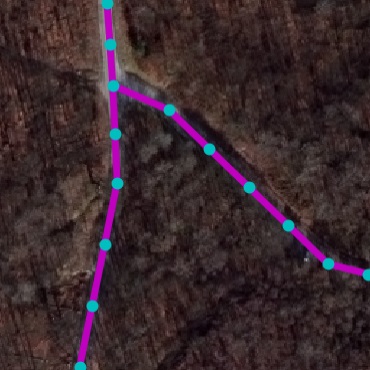
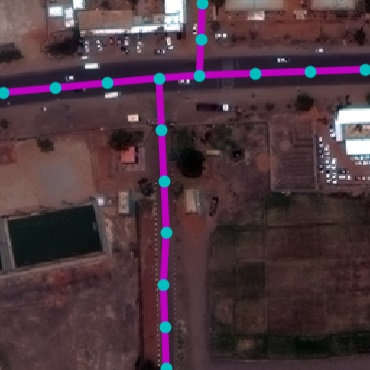
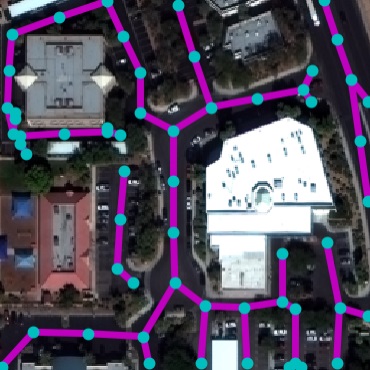
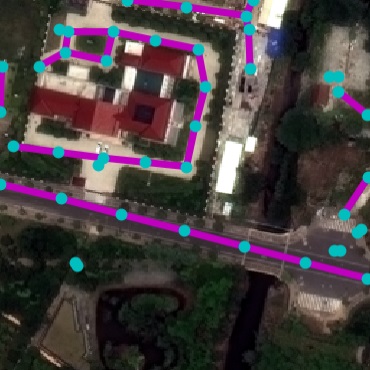
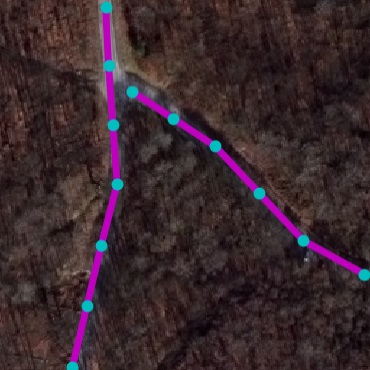
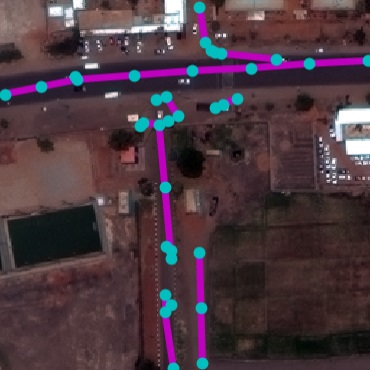
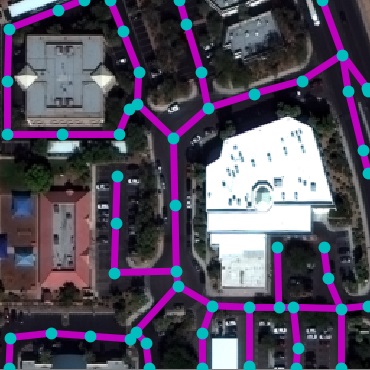
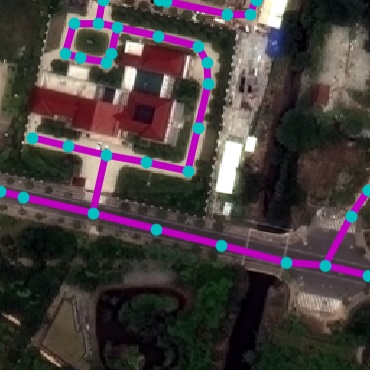
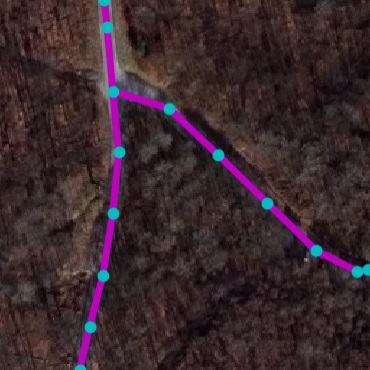
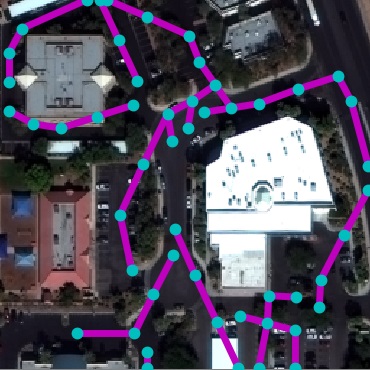
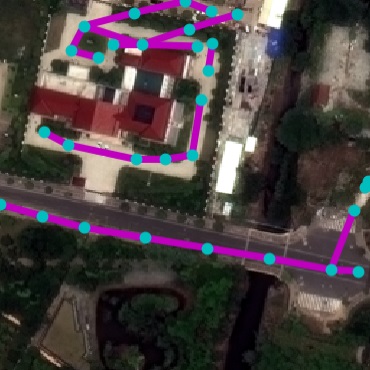
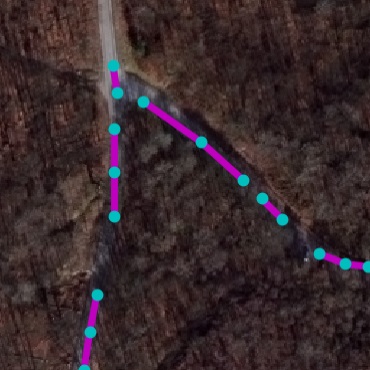
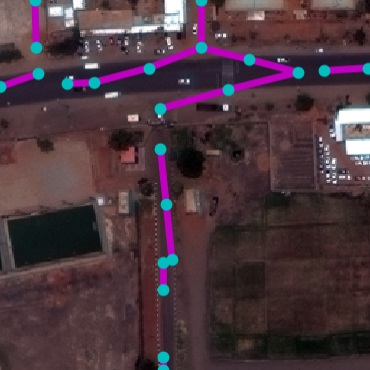
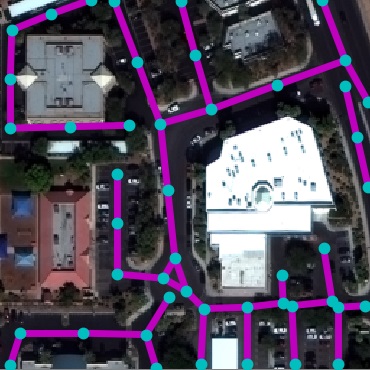
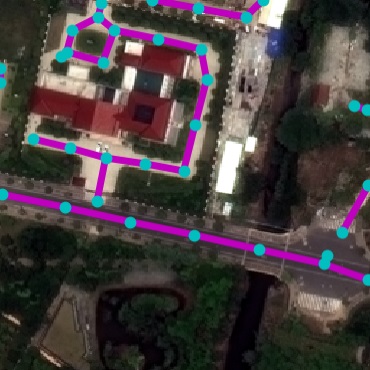
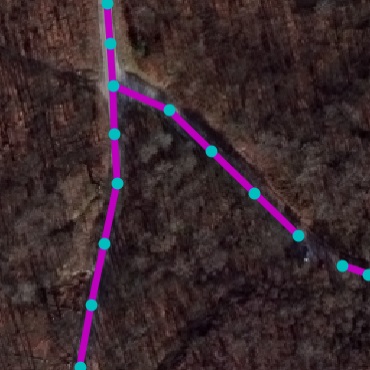
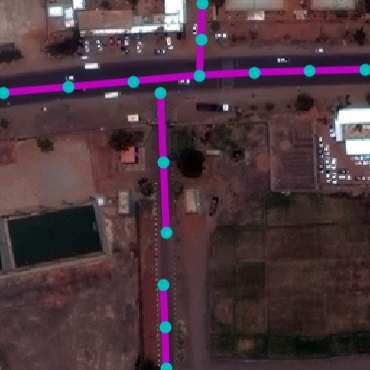
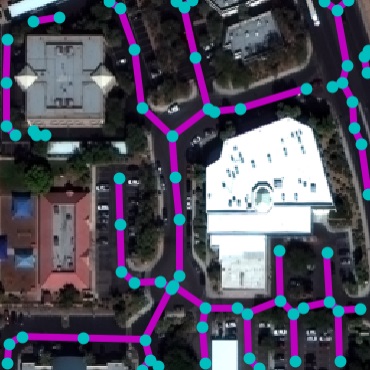
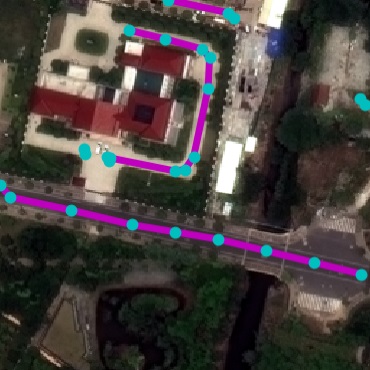
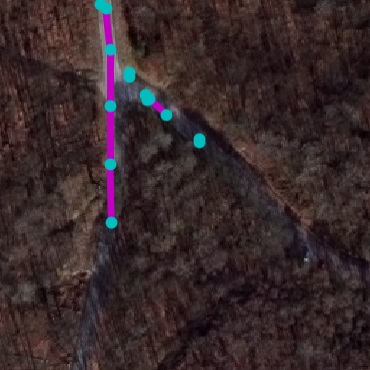
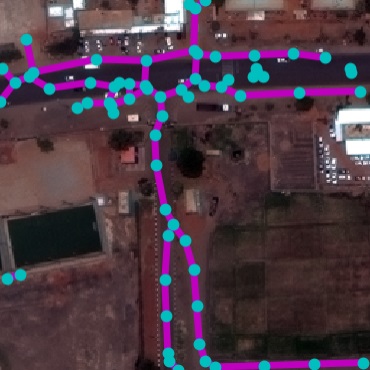
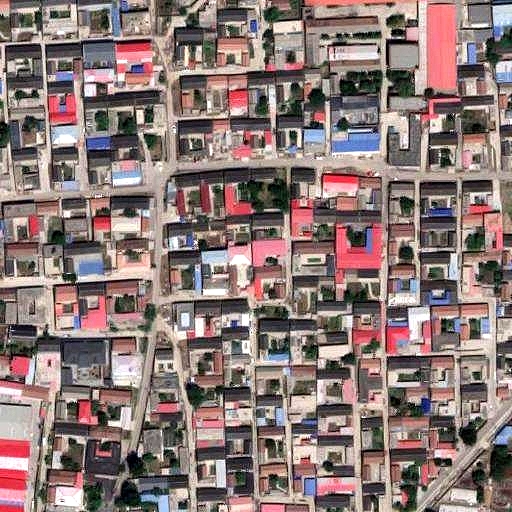
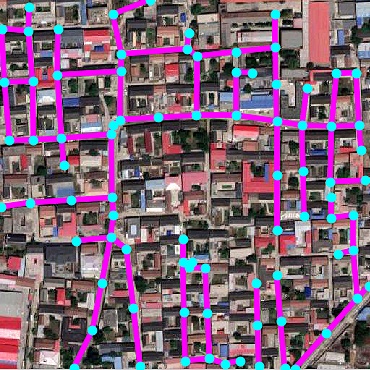
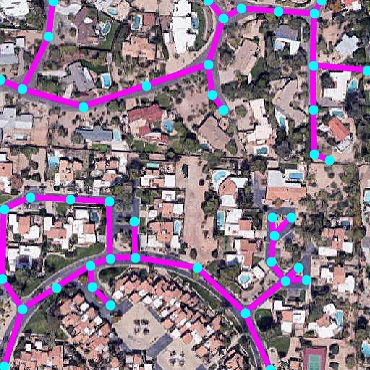
Qualitative examples of SpaceNet road parsing.
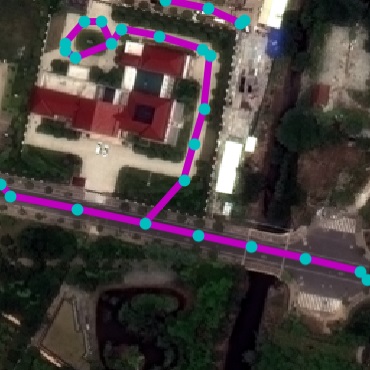
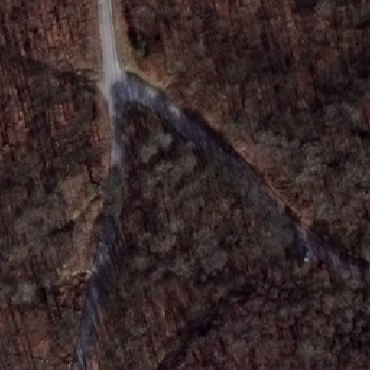
satellite
detection
simulation 1
simulation 2
simulation 3
simulation 4
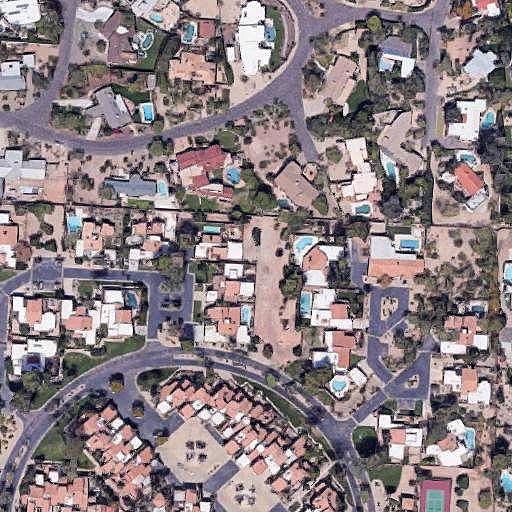
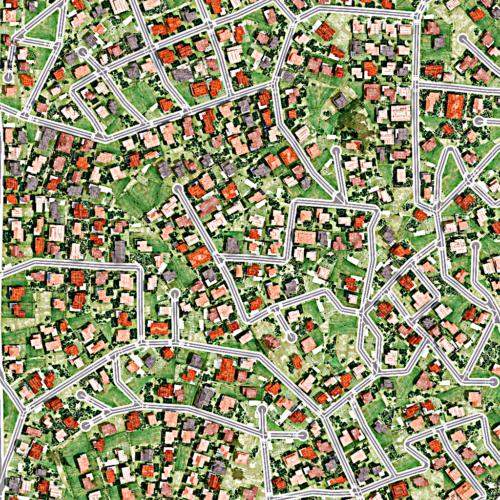
Sat2Sim: converting satellite image into a series of
simulated environments. Buildings and vegetation added via .
Metrics
Average Path Length Similarity (APLS) has been shown to be the best
metric to reflect routing properties . Between two graphs, APLS is
defined as
where $`\mb{v}`$ denotes a source graph node, $`\mb{v}^{\prime}`$ as its
closest on-road point in the target graph if such a point exists within
a buffer range (5m), $`N_p`$ number of paths. Here,
$`p_{\mb{v}_1\mb{v}_2}`$ denotes the Dijkstra shortest path length
between two nodes, and has infinite value if no path exists. We also
exchange source and target graphs to establish metric symmetry. To
ensure even node distribution, graphs are RDP-simplified and uniformly
subdivided with 30m maximum edge length. While we use APLS as our main
metric, we also report conventional pixel-wise IOU and F1 score as
references, even though they are less desirable as revealed in .
Results
We compare three categories of methods:
$`\bullet`$ Prior art: We evaluate DeepRoadMapper , RoadExtractor ,
and RoadTracer . RoadTracer requires additional starting points as
input. We use the most likely pixel predicted by their CNN, as well as
30 points randomly selected from ground truth (RoadTracer-30).
$`\bullet`$ Stronger CNNs: We explore more powerful CNN
architectures. We train an FCN with a ResNet backbone , as well as a CNN
using DLA with STEAL . To obtain the graph we use standard thinning and
geodesic sorting.
$`\bullet`$ NTG: We evaluate both the parsing NTG (NTG-P) that is
only trained on RoadNet and acts as a topological prior and image-based
NTG (NTG-I) that is trained on SpaceNet.
IOU
F1
APLS
DeepRoadMapper
45.02
62.08
51.49
RoadExtractor
52.91
69.20
57.38
RoadTracer
10.23
18.56
48.55
RoadTracer-30
48.29
65.13
42.94
FCN
51.09
67.63
56.56
DLA+STEAL
58.96
74.18
71.04
NTG-P (’s CNN)
50.58
67.18
55.87
NTG-P (’s CNN)
51.62
68.09
58.79
NTG-P (DLA+STEAL)
59.29
74.44
70.99
NTG-I (DLA+STEAL)
63.15
77.42
74.97
SpaceNet evaluation on unseen city by holding one city out in training.
Without finetuning, the RoadNet pretrained NTG-P is able to improve over
DLA+STEAL.
IOU
F1
APLS
RoadExtractor
20.51
34.03
43.06
DLA+STEAL
33.94
50.68
56.15
NTG-P (DLA+STEAL)
35.16
52.02
57.89
SpaceNet evaluation on unseen city by holding one city out in training.
Without finetuning, the RoadNet pretrained NTG-P is able to improve over
DLA+STEAL.
Table [tab:spaceresult1] and
Figure 8 present SpaceNet results. It can
be seen that our method outperforms baselines in all metrics. The
DLA+STEAL CNN produces cleaner predictions that focus on road. NTG-P
trained only with RoadNet is able to successfully parse graph structure.
Using NTG-I that further takes CNN output as input achieves the best
result. We also experiment the RoadNet trained NTG-P with CNNs from
prior art . It can be seen that the city topology knowledge of NTG makes
it a better graph extractor compared to hand-crafted postprocessings in
, especially in terms of APLS. For NTG-P with DLA+STEAL we notice it has
similar performance as standard graph extraction. This is because
DLA+STEAL prediction has high confidence as it is trained and tested
with same cities that have similar visual appearance. We therefore
further experiment with one city held-out to simulate road parsing in
unseen cities. Results are presented in
Table 3. It can be seen that NTG-P is
able to further improve the result, demonstrating the effectiveness of
generative road layout knowledge learnt from RoadNet. We conduct 4-fold
evaluation holding out each city per fold, and report the average
result.
Environment Simulation
We further showcase a novel application that combines our two tasks in
Figure 9. We propose to directly convert a
satellite image into simulation-ready environments, which may be
important for testing autonomous vehicles in the future. First, we
detect roads in the satellite image with NTG, giving us an initial
graph. Then, we exploit our generative model to propose plausible
variations. This is done by pushing all single-connection nodes in the
parsed graph into our generative queue, and running the NTG generative
process to expand the graph. We directly make use of the NTG model
trained for city generation and choose a random city id for each run.
This has two main advantages. First, it is fully automatic and only
requires a low-cost satellite image as input. Second, it provides a set
of plausible variations of the environment (city) instead of a static
one, which could eventually enable training more robust agents. For
visualization, we additionally add buildings and tree via , showing
plausible and diverse simulation-ready cities.
The copyright of this content belongs to the respective researchers. We deeply appreciate their hard work and contribution to the advancement of human civilization.
Turtle graphics is a technique for vector drawing, where a
relative cursor (turtle) receives motion commands and leave traces
on the canvas. ↩︎