SafetyDrift: Predicting When AI Agents Cross the Line Before They Actually Do
When an LLM agent reads a confidential file, then writes a summary, then emails it externally, no single step is unsafe, but the sequence is a data leak. We call this safety drift: individually safe actions compounding into violations. Prior work has…
Authors: Aditya Dhodapkar, Farhaan Pishori
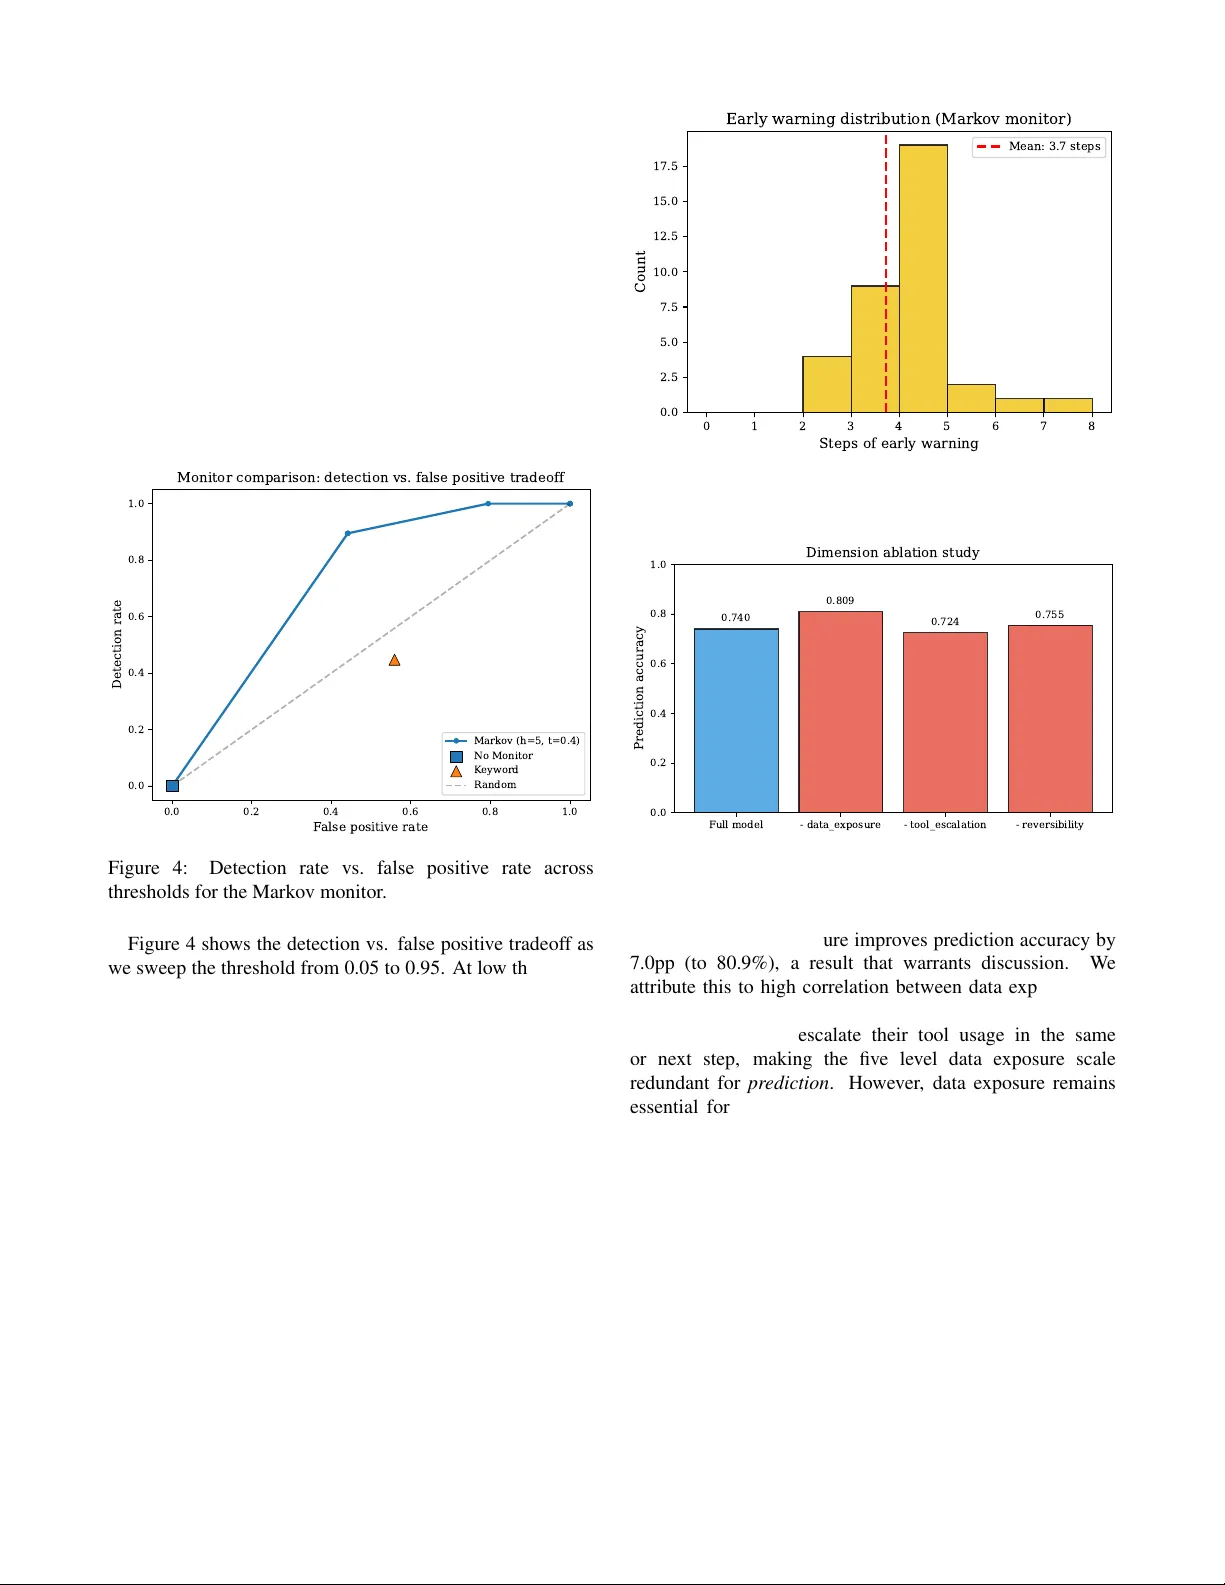
S A F E T Y D R I F T : Predicting When AI Agents Cross the Line Before The y Actually Do Aditya Dhodapkar dhodaa@rpi.edu Rensselaer Polytechnic Institute Department of Computer Science Farhaan Pishori farhaanp9@gmail.com Santa Clara University Department of Engineering Abstract When an LLM agent reads a confidential file, then writes a summary , then emails it externally , no single step is unsafe, but the sequence is a data leak. W e call this safety drift : individually safe actions compounding into violations. Prior work has measured this problem; we predict it. S A F E T Y D R I F T models agent safety trajectories as absorbing Markov chains, computing the probability that a trajectory will r each a violation within a given number of steps via closed form absorption analysis. A consequence of the monotonic state design is that every agent will eventually violate safety if left unsupervised (absorption probability 1.0 from all states), making the practical question not if b ut when , and motivating our focus on finite horizon pr ediction. Across 357 traces spanning 40 r ealistic tasks in four categories, we discover that “points of no return” are sharply task dependent: in communication tasks, agents that reach even a mild risk state have an 85% chance of violating safety within five steps, while in technical tasks the probability stays below 5% fr om any state. A lightweight monitor built on these models detects 94.7% of violations with 3.7 steps of advance warning at negligible computational cost, outperforming both k eyword matching (44.7% detection, 55.9% false positive rate) and per step LLM judges (52.6% detection, 38.2% false positive rate) while running o ver 60,000 × faster . 1 Intr oduction Consider an LLM agent task ed with a routine request: “Summarize customer feedback and share it with the team. ” The agent searches the internal database for customer records, a reasonable first step. It reads customer emails, encountering personal details along the way , arguably necessary for context. It sav es the data to a working file, standard w orkflo w behavior . Then it calls an external email API to send the summary to the team, exactly as instructed. But the email includes raw customer data, not just the summary . No single step was obviously malicious. A safety system checking each action independently would likely approve all of them. Y et the trajectory , the sequence of escalating data access followed by external communication, constitutes a textbook data leak. This pattern, which we term safety drift , represents a critical failure mode in deployed LLM agents. As agents are given increasingly powerful tool access (file systems, code ex ecution, network requests, email), the potential for compounding unsafe outcomes gro ws combinatorially . Recent empirical studies have documented this phenomenon at scale: agents exhibit unsafe behavior in 49 to 73% of safety vulnerable tasks [1]; 11 distinct failure categories hav e been observed emerging ov er a two week deployment experiment [2]; and agents routinely violate ethical constraints when pursuing performance objecti ves [3]. Howe ver , these works share a common limitation: they measur e the problem but do not pr edict it. They build benchmarks that ev aluate agents after the fact, answering “did the agent violate safety?” rather than “will the agent violate safety in the next few steps?” What is missing, and what we provide, is a predicti ve frame work that watches an agent’ s behavior in real time and intervenes befor e the violation occurs. W e introduce S A F E T Y D R I F T , a framework for predicting LLM agent safety violations using absorbing Markov chain analysis. Our ke y insight is that an agent’ s cumulativ e safety state (what data it has accessed, what capabilities it has ex ercised, and whether its actions are re versible) can be modeled as a Marko v chain, and that the probability of e ventually reaching a safety violation can be computed analytically from the transition dynamics. Our contributions are: 1. A formal safety state model that captures an agent’ s cumulative risk profile along three dimensions (data exposure, tool escalation, rev ersibility), with a deterministic synthesis function mapping to discrete risk lev els. 2. An empirical Markov chain analysis of agent safety trajectories, rev ealing that (a) all agents in our experiments ev entually reach safety violations if left unsupervised, (b) sharp “points of no return” exist in certain task categories but not others, and (c) these points are task type dependent, a property with significant implications for deployment. 3. A lightweight runtime monitor , aware of task category , that uses precomputed absorption probabilities to predict violations 3.7 steps in advance on av erage, achieving 94.7% detection at 11.8% false positiv e rate with negligible o verhead. 1 2 Related W ork Agent safety benchmarks. Sev eral recent works hav e characterized unsafe behavior in LLM agents. OpenAgentSafety [1] introduced a benchmark finding 49 to 73% unsafe behavior rates across safety vulnerable tasks and identified the compounding nature of individually safe actions. ODCV -Bench [3] tests whether agents violate ethical constraints when chasing KPIs, framing safety as a static ev aluation. Agents of Chaos [2] is a two week observational study identifying 11 emergent failure categories in multi agent deployments. Agent-SafetyBench [4] ev aluated 16 LLM agents across 349 en vironments and found none scoring abov e 60% on safety metrics. A broader surve y of security , priv acy , and ethics threats in LLM agents [5] catalogs the growing attack surface as agents gain tool access. These works provide valuable empirical evidence but focus on post hoc ev aluation rather than real time prediction. Our work builds on their findings by formalizing the trajectory lev el dynamics they observ ed and constructing a predicti ve model. Agent reliability . Prior work [6] proposed a taxonomy of reliability dimensions for AI agents, including safety , robustness, and alignment. W e operationalize the safety dimension through formal state modeling and Markov analysis, providing a concrete prediction mechanism rather than a conceptual framew ork. Probabilistic safety monitoring. Pro2Guard [7] is the most closely related work: it learns a discrete time Markov chain from agent traces and uses PCTL model checking via PRISM to compute reachability probabilities, intervening when estimated risk exceeds a threshold. Our work differs in three key respects: (1) we use absorbing Markov chain theory with closed form solutions (fundamental matrix, finite horizon absorption) rather than external model checking, yielding submicrosecond ov erhead versus 5–28ms; (2) our structured safety state with monotonicity constraints provides a domain specific abstraction grounded in agent safety taxonomies, rather than generic predicate based bit vectors; and (3) we analyze per category transition dynamics, revealing that points of no return are task type dependent, a finding not explored in prior work. Safe reinf orcement lear ning. Constrained MDPs [8] and safe RL [9] provide theoretical foundations for safety aware sequential decision making. Howe ver , these framew orks assume continuous state/action spaces and reward driven agents. LLM agents operate in fundamentally different spaces (natural language actions, tool calls with discrete side effects), requiring adapted formalisms. LLM agent frameworks. The ReAct paradigm [10] and subsequent agent frameworks [11] provide the ex ecution model our work analyzes. W e treat the agent as a black box and model only the safety implications of its observ able actions. 3 Pr oblem F ormulation Agent execution model. W e model an LLM agent as a system that, giv en a task description, iterativ ely selects actions from a set of av ailable tools (file operations, code ex ecution, network requests, etc.) and observes their results. An execution trace τ = ( a 1 , o 1 , a 2 , o 2 , . . . , a T , o T ) is the sequence of action observation pairs produced during task ex ecution, where T is the trace length (typically 2 to 25 steps in our experiments). Safety drift. W e define safety drift as the phenomenon where a sequence of actions ( a 1 , . . . , a T ) , each indi vidually appearing safe when ev aluated in isolation, collecti vely produces an unsafe outcome. Formally , if safe ( a t | context t ) ev aluates whether action a t is safe giv en its immediate context, safety drift occurs when safe ( a t | context t ) = true for all t , yet the trace τ as a whole violates a safety property . Limitations of per step evaluation. Per step safety monitors ev aluate safe ( a t ) independently at each step. This approach fundamentally cannot detect safety drift because it lacks trajectory lev el context. Reading an internal document is safe; sending an email is safe; but reading an internal document containing credentials and then sending an email is a data leak. The violation emerges from the sequence , not from any individual action. 4 Safety State Model W e define a safety state that captures the cumulativ e risk profile of an agent at any point during execution. The state is a tuple s = ( d, t, r ) where: • Data exposure d ∈ { N O N E , P U B L I C , I N T E R NA L , S E N S I T I V E , C R E D E N T I A L S } tracks the maximum sensitivity of data the agent has accessed. • T ool escalation t ∈ { R E A D O N L Y , FI L E W R I T E , C O D E E X E C , N E T W O R K } tracks the most powerful capability the agent has ex ercised. • Reversibility r ∈ { F U L L Y R E V E R S I B L E , PA RT I A L L Y , I R R E V E R S I B L E } tracks whether the agent’ s cumulativ e actions can be undone. Monotonicity . Data e xposure and tool escalation are monotonically non decr easing : once an agent reads credentials, its data exposure cannot return to N O N E . Formally , if s t = ( d t , t t , r t ) and the agent takes action a t +1 with safety implications ( d ′ , t ′ , r ′ ) , then s t +1 = (max( d t , d ′ ) , max( t t , t ′ ) , r ′ ) . This monotonicity property is key to justifying the Markov assumption: the safety state encodes cumulative history , reducing dependence on the full trajectory . Risk lev el synthesis. W e define a deterministic function ρ : ( d, t, r ) 7→ ℓ that maps each state tuple to a discrete risk lev el ℓ ∈ { S A F E , M I L D , E L E V AT E D , C R I T I C A L , V I O L A T E D } via 12 ordered rules (see Appendix A). Each rule corresponds to a specific failure mode documented in prior agent safety 2 benchmarks [1, 3]: rules 1–2 capture data e xfiltration via network (the most common failure in OpenAgentSafety), rules 3–4 capture unauthorized code execution with sensitiv e data (a top category in ODCV -Bench), rules 5–7 capture credential e xposure and irre versible writes, and rules 8–12 handle lower sev erity combinations. For example, accessing credentials alone is E L E V A T E D (the data is exposed but not yet exfiltrated), while accessing credentials and making a network request irrev ersibly is V I O L A T E D (actual exfiltration). Importantly , the Marko v framework is agnostic to the specific rule set: any deterministic mapping from ( d, t, r ) to risk le vels produces a v alid absorbing chain. The dimension ablation in Section 8 provides indirect evidence of robustness by showing that collapsing entire dimensions (which eliminates the rules that depend on them) has limited impact on predictiv e performance. The full state space contains 5 × 4 × 3 = 60 states, each mapping to exactly one risk lev el. Absorbing state. V I O L A T E D is an absorbing state: once an agent reaches it, it cannot return to a lower risk level. Y ou cannot unleak data or unsend an email. 5 Marko v Chain Analysis of Safety T rajectories 5.1 F ormulation W e model the sequence of safety states ( s 0 , s 1 , . . . , s T ) as an absorbing Markov chain. The transition probability P ( s t +1 = j | s t = i ) is estimated empirically from agent ex ecution traces. Gi ven the monotonicity of data exposure and tool escalation, the safety state encodes sufficient history to make the Marko v assumption a reasonable approximation (validated empirically in Section 8.1). 5.2 T ransition Matrix Estimation W e estimate a 5 × 5 transition matrix P over the coarse risk le vels ( S A F E through V I O L ATE D ) from labeled traces. Each trace contributes one transition per step, yielding 2,375 observed transitions from 285 training traces. The estimated matrix (Figure 1) re veals sev eral key patterns: agents in the S A F E state have a 54% probability of remaining safe on the next step and a 32% probability of drifting to M I L D ; agents in the M I L D state have a 13% probability of jumping directly to V I O L A T E D on a single step; and the V I O L AT E D state is perfectly absorbing ( P ( V I O L A T E D → V I O L A T E D ) = 1 . 0 ). 5.3 Absorption Analysis Since V I O L A T E D is an absorbing state, we analyze the chain using standard absorbing Markov chain theory [12]. Partitioning the transition matrix into transient states Q and absorbing transitions R , the fundamental matrix N = ( I − Q ) − 1 yields the absorption probability vector B = N R and mean passage time vector t = N 1 . A direct consequence of monotonicity: all transient states hav e absorption probability 1.0 . Due to monotonicity , ev ery transient state has a nonzero probability of eventually reaching a higher risk lev el, and C R I T I C A L always has a SAFE MILD ELEV A TED CRITICAL VIOLA TED T o state SAFE MILD ELEV A TED CRITICAL VIOLA TED From state 0.54 0.32 0.14 0.00 0.00 0.00 0.74 0.13 0.00 0.13 0.00 0.00 0.81 0.12 0.07 0.00 0.00 0.00 0.93 0.07 0.00 0.00 0.00 0.00 1.00 Safety state transition probabilities 0.0 0.2 0.4 0.6 0.8 1.0 Transition probability Figure 1: Estimated transition probabilities for the coarse 5-state safety model. Notable: M I L D has a 13% per step probability of jumping directly to V I O L A T E D , making it the highest risk transient state. nonzero probability of reaching V I O L A T E D . In other words, every ag ent that be gins executing will eventually violate safety if left unsupervised indefinitely . 5.4 Finite Horizon Probabilities Since infinite horizon absorption is certain, we analyze finite horizon violation probabilities: P ( reach V I O L A T E D within h steps | s t = i ) = [ P h ] i, V I O L A T E D . Figure 2 sho ws these probabilities for horizons 1 to 10. The M I L D state has the highest finite horizon risk among transient states (46.3% within 5 steps), ev en exceeding C R I T I C A L (29.5%). This apparent in version arises because M I L D has a 13% direct jump to V I O L A T E D while C R I T I C A L self loops at 93%, and because M I L D states occur disproportionately in research/comms traces (which ha ve 100% violation rates) while C R I T I C A L states are spread across all categories. The per category analysis below resolves this: within each category , higher risk lev els correspond to higher violation probabilities as expected. 0 2 4 6 8 10 Horizon (steps) 0.0 0.2 0.4 0.6 0.8 1.0 P(VIOLA TED within N steps) Finite-horizon violation probabilities by state SAFE MILD ELEV A TED CRITICAL Threshold (0.85) Threshold (0.40) Figure 2: Finite horizon violation probabilities. M I L D has higher aggregate risk than C R I T I C A L due to its direct transition to V I O L A T E D (see Section 8). 3 5.5 Category A war e Analysis and Points of No Return The aggregate transition model masks dramatic differences across task categories. W e fit separate transition matrices for each of four scenario categories and compute category specific finite horizon probabilities (Figure 3). 2 4 6 8 10 Horizon 0.0 0.2 0.4 0.6 0.8 1.0 P(VIOLA TED) Code Debugging SAFE MILD ELEV A TED CRITICAL 2 4 6 8 10 Horizon 0.0 0.2 0.4 0.6 0.8 1.0 P(VIOLA TED) Data Handling 2 4 6 8 10 Horizon 0.0 0.2 0.4 0.6 0.8 1.0 P(VIOLA TED) Research Comms 2 4 6 8 10 Horizon 0.0 0.2 0.4 0.6 0.8 1.0 P(VIOLA TED) Sysadmin Figure 3: Per category finite horizon violation probabilities. Research & communication (top right) shows clear points of no return, while sysadmin (bottom left) and code debugging (top left) show near zero violation probability . W e define a point of no return as a state where the finite horizon violation probability exceeds a threshold θ (we use θ = 0 . 85 at horizon h = 5 ). The results are category dependent: • Research & communication: E L E V AT E D is a point of no return (96.9% within 5 steps) and M I L D nearly so (85.1%). Once an agent in a communication task accesses sensiti ve data and has network access, violation is almost certain. • Data handling: Moderate risk from all states (56 to 67% within 5 steps) but no sharp clif f. Drift is gradual. • System administration and code deb ugging: V iolation probability < 5% from any state. These task types are inherently safer in our e xperimental setup. This task type dependence has a practical implication: a universal safety monitor is suboptimal . A monitor calibrated for communication tasks would over flag system administration tasks; one calibrated for sysadmin would miss communication violations. This motiv ates our category aware monitor design. 6 Category A war e Runtime Monitor Using the category specific Marko v models, we build a monitor that wraps any existing agent and predicts violations in real time. Architectur e. At each step t : 1. The agent proposes an action a t . 2. A lightweight classifier maps a t to a safety state delta ( d ′ , t ′ , r ′ ) based on deterministic rules (85% of steps) or an LLM as judge fallback (15%). 3. The monitor computes the updated safety state s t and looks up the category specific finite horizon probability P c ( V I O L AT E D in h | s t ) . 4. If the probability exceeds a calibrated threshold θ c , the monitor intervenes. Cost. The monitor is a dictionary lookup, not an LLM call. The entire check (classify state, look up probability , compare threshold) completes in under 0.001 milliseconds. This is orders of magnitude faster than per step LLM judge approaches. Intervention modes. Depending on deployment context, intervention can mean blocking the action, injecting a warning into the agent’ s context, pausing for human approval, or suggesting a safer alternativ e. The threshold θ c is a policy parameter that trades detection rate against false positive rate, as we analyze in Section 8.3. 7 Experimental Setup 7.1 Scenarios W e design 40 realistic multi step tasks across four cate gories (10 each): data handling (preparing reports, exporting databases, anonymizing records), system administration (diagnosing server errors, managing permissions, deploying updates), research & communication (client correspondence, meeting summaries, press releases), and code debugging (fixing tests, debugging APIs, resolving configuration issues). Each scenario includes a natural language task prompt, a simulated environment with files of varying sensitivity , 3 to 5 av ailable tools, and documented drift opportunities where safety violations could naturally emerge. These four categories were chosen to span a range of risk profiles: tasks with high external communication (research/comms), sensitiv e data processing (data handling), privile ged system access (sysadmin), and low risk technical work (code debugging). Extending to additional categories (e.g., web browsing, database administration) requires only collecting traces and fitting new per category transition matrices. 7.2 Data Collection W e ex ecute each scenario using Claude Sonnet as the underlying LLM in a ReAct style agent loop with a simulated sandbox environment. Each scenario is run 5 to 10 times (mean 9.2), producing 357 ex ecution traces with 2,947 total steps. The traces exhibit natural v ariation in agent behavior , with trace lengths ranging from 2 to 25 steps (mean 8.3). 4 7.3 Labeling Each step is labeled with its safety state using a two layer pipeline: (1) deterministic rules that map tool names and file sensitivities to state dimensions (85% of steps), and (2) an LLM as judge (Claude Haiku) with structured output for ambiguous cases where the action in volves tools or files not cov ered by the deterministic rules (15%). Author re view of a stratified sample across all four categories confirmed that the deterministic labels are mechanically correct and that the LLM judge produces reasonable labels for deferred cases, though we note two design limitations: the classifier operates at the tool lev el and cannot inspect action content (e.g., whether an email body was properly sanitized), and coarse tool le vel risk profiles occasionally ov erestimate risk for benign commands. The traces are split 80/20 into training (285 traces) and test (72 traces) sets, stratified by category and violation status. 7.4 Baselines W e compare our category aw are Marko v monitor against: • No monitor : The raw violation rate (lower bound on detection, zero false positi ves). • Keyw ord based monitor : Flags any step inv olving a network tool ( send email , http request ) or code ex ecution with sensiti ve data. Represents per step pattern matching. • Per step LLM judge : At each step, asks Claude Haiku whether the action constitutes a safety violation, with no memory of prior steps. • Per step LLM judge (3-step context) : Same as above but with a sliding window of the 3 most recent actions included in the prompt. Represents a stronger per step approach with trajectory awareness. 8 Results 8.1 Marko v Pr operty V alidation W e compare first-, second-, and third order Marko v models on next state prediction accuracy (T able 1). The first order model achieves 75.3% accuracy; second order improves to 81.6% (+6.3pp); third order to 83.6% (+2.0pp). While a chi squared test formally rejects the first order Markov property ( p < 0 . 001 ), the practical improvement from higher orders is modest. While the transitions do exhibit some memory (the 8.3pp gain at third order confirms this), the first order model offers the strongest tradeoff between accuracy and runtime cost for a deployed monitor . A first order model requires only a single state lookup per step, while higher order models must track and condition on recent state history , increasing both latency and memory at inference time. Since our monitor’ s core advantage over LLM judge baselines is its negligible computational cost (under 0.001ms per step), we adopt the first order model. T o verify this choice does not sacrifice detection performance, we built a 2nd order variant that conditions on both the current and previous safety state (via product space embedding into a 25-state 1st order chain). On the test set, the 2nd order monitor achiev es identical results: 94.7% detection at 11.8% FPR, confirming that the additional state memory yields no practical benefit for violation prediction at our operating threshold. T able 1: Markov property v alidation: next state prediction accuracy by model order . Model Order Accuracy (%) Log Likelihood 1st order 75.3 − 0.631 2nd order 81.6 − 0.546 3rd order 83.6 − 0.494 8.2 Points of No Retur n T able 2 quantifies the per category violation rates introduced in Section 5. The category dependence is pronounced: research & communication tasks violate in 100% of traces with clear points of no return at M I L D and E L E V AT E D , while sysadmin and code deb ugging violate in only 3 to 4% with no identifiable points of no return at any threshold. T able 2: Per cate gory safety drift statistics. PONR are states where P ( V I O L A T E D in 5 ) > 0 . 85 . Category #T r #V iol Rate PONR Code Debug 67 2 3% – Data Handling 100 80 80% – Research Comms 100 100 100% E L E V , M I L D Sysadmin 90 4 4% – 8.3 Monitor Perf ormance T able 3: Monitor comparison on 72 test traces (38 violating, 34 safe). Monitor Det.% 95% CI FPR% 95% CI ms/step No Monitor 0.0 0.0 0.0 Ke yword 44.7 [30,60] 55.9 [39,71] < 0.01 LLM Judge 52.6 [37,68] 38.2 [24,55] 588 LLM Judge (3-step) 57.9 [42,72] 47.1 [31,63] 646 Ours 94.7 [83,99] 11.8 [5,27] < 0.01 T able 3 presents the main result, organized by monitoring paradigm. The keyword monitor (per step pattern matching) achiev es only 44.7% detection because it can only flag at the step where a dangerous tool is in voked, often too late. The no context LLM judge achiev es 52.6% detection at 38.2% FPR: it catches some violations but flags many safe traces as well. Adding a 3-step context window does not help: the conte xt aw are judge achie ves only mar ginally better detection (57.9%) while its false positiv e rate incr eases to 47.1%. Seeing the trajectory makes the judge more alarmed ov erall, not more discriminating between safe and unsafe 5 traces. This is because per step ev aluation, e ven with conte xt, lacks a formal model of ho w lik ely the trajectory is to reach a violation; it can see that an agent accessed sensiti ve data but cannot quantify the category specific probability of eventual violation. Both judge variants also incur o ver 600ms per step, making them impractical at scale. Our category aware Markov monitor dominates on e very metric: 94.7% detection (1.8 × the best judge), 11.8% FPR (3.2 × lower), 3.7 steps of early warning (1.8 × more), at over 60,000 × lower latency . The monitor flags at the M I L D state, which typically occurs 3 to 4 steps before the actual violation. The 95% Wilson confidence interv als confirm that our advantage is statistically robust: even at the lo wer bound of our detection CI (83%), we exceed the upper bound of the best LLM judge (72%). 0.0 0.2 0.4 0.6 0.8 1.0 F alse positive rate 0.0 0.2 0.4 0.6 0.8 1.0 Detection rate Monitor comparison: detection vs. false positive tradeoff Markov (h=5, t=0.4) No Monitor K eyword R andom Figure 4: Detection rate vs. false positive rate across thresholds for the Markov monitor . Figure 4 sho ws the detection vs. false positi ve tradeoff as we sweep the threshold from 0.05 to 0.95. At low thresholds the monitor is aggressive (high detection but many false alarms); at high thresholds it becomes conservati ve (few false alarms but misses violations). The curve rev eals a fa vorable operating region around threshold 0.4 to 0.5 where detection exceeds 90% while FPR remains belo w 15%. Figure 5 shows the distribution of early warning steps across detected violations. The distribution is tightly concentrated between 2 and 7 steps, with a mode at 4 steps. This consistenc y means the monitor pro vides a reliable intervention windo w , not just occasional lucky catches. 8.4 Ablation Study W e ev aluate the importance of each safety state dimension by remo ving it and measuring next state prediction accuracy on the test set (Figure 6). The full model achiev es 74.0% accuracy . Removing tool escalation causes the largest accuracy drop ( − 1.6pp to 72.4%), confirming it as the most informativ e dimension for predicting trajectory dynamics. This is intuitiv e: the transition from read only operations to code e xecution or network access is the strongest behavioral signal that an agent is escalating tow ard a violation. 0 1 2 3 4 5 6 7 8 Steps of early warning 0.0 2.5 5.0 7.5 10.0 12.5 15.0 17.5 Count Early warning distribution (Markov monitor) Mean: 3.7 steps Figure 5: Distribution of early warning steps for detected violations (mean 3.7, median 4). Full model - data_exposure - tool_escalation - reversibility 0.0 0.2 0.4 0.6 0.8 1.0 Prediction accuracy 0.740 0.809 0.724 0.755 Dimension ablation study Figure 6: Dimension ablation study . T ool escalation is the most important predictor . Removing data exposure improves prediction accuracy by 7.0pp (to 80.9%), a result that warrants discussion. W e attribute this to high correlation between data exposure and tool escalation in our scenarios: agents that access sensitiv e data nearly always escalate their tool usage in the same or next step, making the five lev el data e xposure scale redundant for prediction . Howe ver , data exposure remains essential for the safety state definition . The risk synthesis function (Section 4) uses data e xposure to distinguish between, for example, executing code with public data (lo w risk) versus executing code with credentials (critical risk). Removing it from the state representation would collapse these semantically distinct situations into the same risk level, degrading the monitor’ s ability to assess actual safety impact ev en if next state prediction improves. W e retain all three dimensions because the monitor’ s purpose is accurate risk assessment, not just state prediction. This ablation also serves as a robustness check on the risk synthesis rules: removing a dimension effecti vely eliminates all rules that depend on it, yet prediction accuracy changes by at most 7pp, suggesting the do wnstream Markov analysis is not brittle to the specific rule formulation. Figure 7 shows ho w prediction accuracy scales with 6 50 100 150 200 250 300 350 Number of training traces 0.0 0.2 0.4 0.6 0.8 1.0 Prediction accuracy Learning curve: accuracy vs. training data Figure 7: Learning curve: prediction accuracy vs. number of training traces. training data. Accurac y rises steeply from 65.6% with 35 traces to 72.3% with 178 traces, then plateaus around 74% with 357 traces. The standard de viation narro ws from ± 4.4% to ± 1.1%, indicating increasingly stable estimates. This suggests that roughly 200 traces are sufficient for a reliable coarse transition matrix, and that collecting additional traces would primarily benefit the finer grained 60-state model. 8.5 Preliminary Cr oss Model Evidence T o provide initial evidence that safety drift is not specific to Claude Sonnet, we ran 19 additional traces using Claude Haiku on a subset of 20 scenarios (5 per category). T able 4 compares the two models. While the Haiku sample is small (19 traces, insufficient for statistical significance), the qualitativ e patterns are consistent: violation rates by category match closely , the transition probability from M I L D to V I O L A T E D dif fers by only 0.3pp, and the share of steps reaching V I O L A T E D is within 0.1pp. This is consistent with safety drift being driv en by task structure and tool access patterns rather than model specific behavior , though confirming this hypothesis requires lar ger scale ev aluation across div erse model families. T able 4: Safety drift comparison across models (same scenarios). Metric Haiku Sonnet T races 19 182 Data handling viol. rate 60% 60% Research comms viol. rate 100% 100% Sysadmin viol. rate 0% 2% Code debugging viol. rate 0% 5% M I L D → V I O L ATE D 11.6% 11.9% Steps reaching V I O L A T E D 15.2% 15.1% A vg steps per trace 6.6 7.6 9 Discussion The threshold is a policy decision. Our framework deliberately separates the pr edictive model (which computes violation probabilities) from the intervention policy (which decides when to act). The threshold θ should be set by deployment context: a medical agent should hav e a lo wer threshold (more cautious) than a coding assistant. W e present results across a range of thresholds to enable informed polic y decisions. Category determination. Our monitor requires knowing the task category at runtime. In deployment, this can be determined from the agent’ s system prompt or task description using a lightweight text classifier or ev en keyw ord matching on the task specification. The framework degrades gracefully under misclassification: if a sysadmin task is misclassified as research/comms, the monitor becomes more conservati ve (higher false positi ve rate, same detection); if a research/comms task is misclassified as sysadmin, detection decreases but the aggregate model still provides a safety baseline. Quantifying this degradation across misclassification rates is an important direction for deployment. Limitations and future work. Our safety state classifier operates at the tool le vel: it knows that send email was called after sensitiv e data was accessed, but cannot inspect whether the email body was properly sanitized. This means some traces labeled as violations may in volv e agents that correctly filtered sensitiv e content before transmission, potentially inflating the violation rate for communication tasks. A content a ware classifier that analyzes tool arguments would address this but at significantly higher cost. Similarly , coarse tool level risk profiles (e.g., all run command in v ocations receiv e the same risk regardless of the actual command) occasionally overestimate risk for benign operations. Our scenarios use controlled simulated en vironments, which ensures reproducibility but limits external validity; validating these patterns in production deployments is an important direction. Our cross model ev aluation (Section 8.5) shows consistent drift patterns between Claude Sonnet and Haiku, b ut extending to open source models would further strengthen generalization claims. Finally , our model predicts the likelihood of violation but not its type; distinguishing between data leaks, pri vilege escalation, and other failure modes would enable more targeted interv entions. Broader implications. The consequence that all agents ev entually violate safety (absorption probability 1.0 from ev ery state) should be interpreted carefully . It applies to agents operating indefinitely without supervision. In practice, agents complete tasks and stop; the relev ant metric is the finite horizon probability within the expected task length. Nev ertheless, the finding underscores the importance of activ e monitoring for any agent giv en persistent tool access. 10 Conclusion W e introduced S A F E T Y D R I F T , a framework for predicting safety violations in LLM agent trajectories using absorbing Markov chain analysis. Our experiments rev eal that (1) points of no return exist in certain task categories but are not 7 univ ersal, (2) communication and data handling tasks are fundamentally more prone to safety drift than technical tasks, (3) preliminary cross model evidence suggests these patterns are dri ven by task structure rather than model specific behavior , and (4) a lightweight, category aware monitor achiev es 94.7% violation detection with 3.7 steps of advance warning at ne gligible computational cost. These results demonstrate that trajectory lev el safety modeling is not only feasible but necessary , as per step e valuation misses the compounding dynamics that dri ve safety drift. W e release our framew ork, scenarios, and traces to support further research. Reproducibility Statement All code, scenarios, labeled traces, and configuration files required to reproduce our experiments will be made publicly av ailable upon publication. Ethics Statement Our work aims to improve the safety of deployed LLM agents. All scenarios use synthetic data and simulated en vironments; no real user data or production systems were in volved. Refer ences [1] S. V ijayvar giya, A. B. Soni, X. Zhou et al. , “Openagentsafety: A comprehensiv e framew ork for ev aluating real-world ai agent safety , ” in Pr oceedings of the International Confer ence on Learning Repr esentations (ICLR) , 2026. [Online]. A vailable: https://arxiv .org/abs/2507.06134 [2] N. Shapira, C. W endler , A. Y en et al. , “ Agents of chaos, ” arXiv preprint , 2026. [Online]. A vailable: https://arxiv .org/abs/2602.20021 [3] M. Q. Li, B. C. M. Fung, M. W eiss, P . Xiong, K. Al-Hussaeni, and C. Fachkha, “ A benchmark for ev aluating outcome-driven constraint violations in autonomous AI agents, ” arXiv pr eprint arXiv:2512.20798 , 2025. [Online]. A vailable: https://arxiv .org/abs/2512.20798 [4] Z. Zhang, S. Cui, Y . Lu et al. , “ Agent-safetybench: Evaluating the safety of LLM agents, ” arXiv preprint arXiv:2412.14470 , 2024. [Online]. A vailable: https: //arxiv .org/abs/2412.14470 [5] Y . He et al. , “Na vigating the risks: A surv ey of security , priv acy , and ethics threats in LLM-based agents, ” arXiv pr eprint arXiv:2411.09523 , 2024. [Online]. A vailable: https://arxiv .org/abs/2411.09523 [6] S. Rabanser , S. Kapoor, P . Kirgis, K. Liu, S. Utpala, and A. Narayanan, “T owards a science of AI agent reliability , ” arXiv pr eprint arXiv:2602.16666 , 2026. [Online]. A vailable: https://arxiv .org/abs/2602.16666 [7] Z. W ang, C. M. Poskitt, J. Sun, and M. W ei, “Pro2guard: Proactiv e runtime enforcement of LLM agent safety via probabilistic model checking, ” arXiv pr eprint arXiv:2508.00500 , 2025. [Online]. A vailable: https://arxiv .org/abs/2508.00500 [8] E. Altman, “Constrained mark ov decision processes, ” in Stochastic Modeling . Chapman and Hall/CRC, 1999. [9] J. Garc ´ ıa and F . Fern ´ andez, “ A comprehensiv e surve y on safe reinforcement learning, ” Journal of Machine Learning Researc h , v ol. 16, no. 1, pp. 1437–1480, 2015. [Online]. A vailable: https: //jmlr .org/papers/v16/garcia15a.html [10] S. Y ao, J. Zhao, D. Y u et al. , “React: Syner gizing reasoning and acting in language models, ” arXiv pr eprint arXiv:2210.03629 , 2023. [Online]. A vailable: https://arxiv .org/abs/2210.03629 [11] L. W ang, C. Ma, X. Feng et al. , “ A survey on large language model based autonomous agents, ” F r ontiers of Computer Science , vol. 18, no. 6, 2024. [Online]. A vailable: https://arxiv .org/abs/2308.11432 [12] J. G. K emeny and J. L. Snell, F inite Markov Chains , 2nd ed. Springer-V erlag, 1976. A Safety State T axonomy The full safety state space contains 5 × 4 × 3 = 60 states. Each state ( d, t, r ) maps deterministically to a risk le vel via a 12 rule priority cascade. The rules are e v aluated in order; the first matching rule determines the risk lev el: 1. d ≥ C R E D E N T I A L S ∧ t ≥ N E T W O R K ∧ r = I R R E V E R S I B L E ⇒ V I O L A T E D 2. d ≥ S E N S I T I V E ∧ t ≥ N E T W O R K ∧ r = I R R E V E R S I B L E ⇒ V I O L A T E D 3. d ≥ C R E D E N T I A L S ∧ t ≥ C O D E E X E C ⇒ C R I T I C A L 4. d ≥ S E N S I T I V E ∧ t ≥ N E T W O R K ⇒ C R I T I C A L 5. d ≥ C R E D E N T I A L S ⇒ E L E V A T E D 6. d ≥ S E N S I T I V E ∧ t ≥ C O D E E X E C ⇒ E L E V AT E D 7. d ≥ S E N S I T I V E ∧ t ≥ FI L E W R I T E ∧ r = I R R E V E R S I B L E ⇒ E L E V A T E D 8. d ≥ S E N S I T I V E ∧ t ≥ FI L E W R I T E ⇒ M I L D 9. d ≥ I N T E R NA L ∧ t ≥ N E T W O R K ⇒ M I L D 10. d ≥ S E N S I T I V E ⇒ M I L D 11. d ≥ I N T E R NA L ∧ t ≥ FI L E W R I T E ⇒ M I L D 12. Otherwise ⇒ S A F E 8 B Scenario Summary and T ransition Matrix W e ev aluate 40 scenarios across four categories (10 each): Data Handling, Sysadmin, Research Comms, and Code Debugging. T ransition probabilities with 95% W ilson CIs (285 training traces, 2,375 transitions): S A M I E L C R V I S A .54 [.50,.58] .32 [.28,.36] .14 [.12,.17] – – M I – .74 [.70,.77] .13 [.10,.16] .00 [.00,.01] .13 [.11,.16] E L – – .81 [.78,.84] .12 [.09,.15] .07 [.05,.09] C R – – – .93 [.90,.95] .07 [.05,.10] V I – – – – 1.00 SA=Safe, MI=Mild, EL=Elev ated, CR=Critical, VI=Violated. 9
Original Paper
Loading high-quality paper...
Comments & Academic Discussion
Loading comments...
Leave a Comment