MemGuard-Alpha: Detecting and Filtering Memorization-Contaminated Signals in LLM-Based Financial Forecasting via Membership Inference and Cross-Model Disagreement
Large language models (LLMs) are increasingly used to generate financial alpha signals, yet growing evidence shows that LLMs memorize historical financial data from their training corpora, producing spurious predictive accuracy that collapses out-of-…
Authors: Anisha Roy, Dip Roy
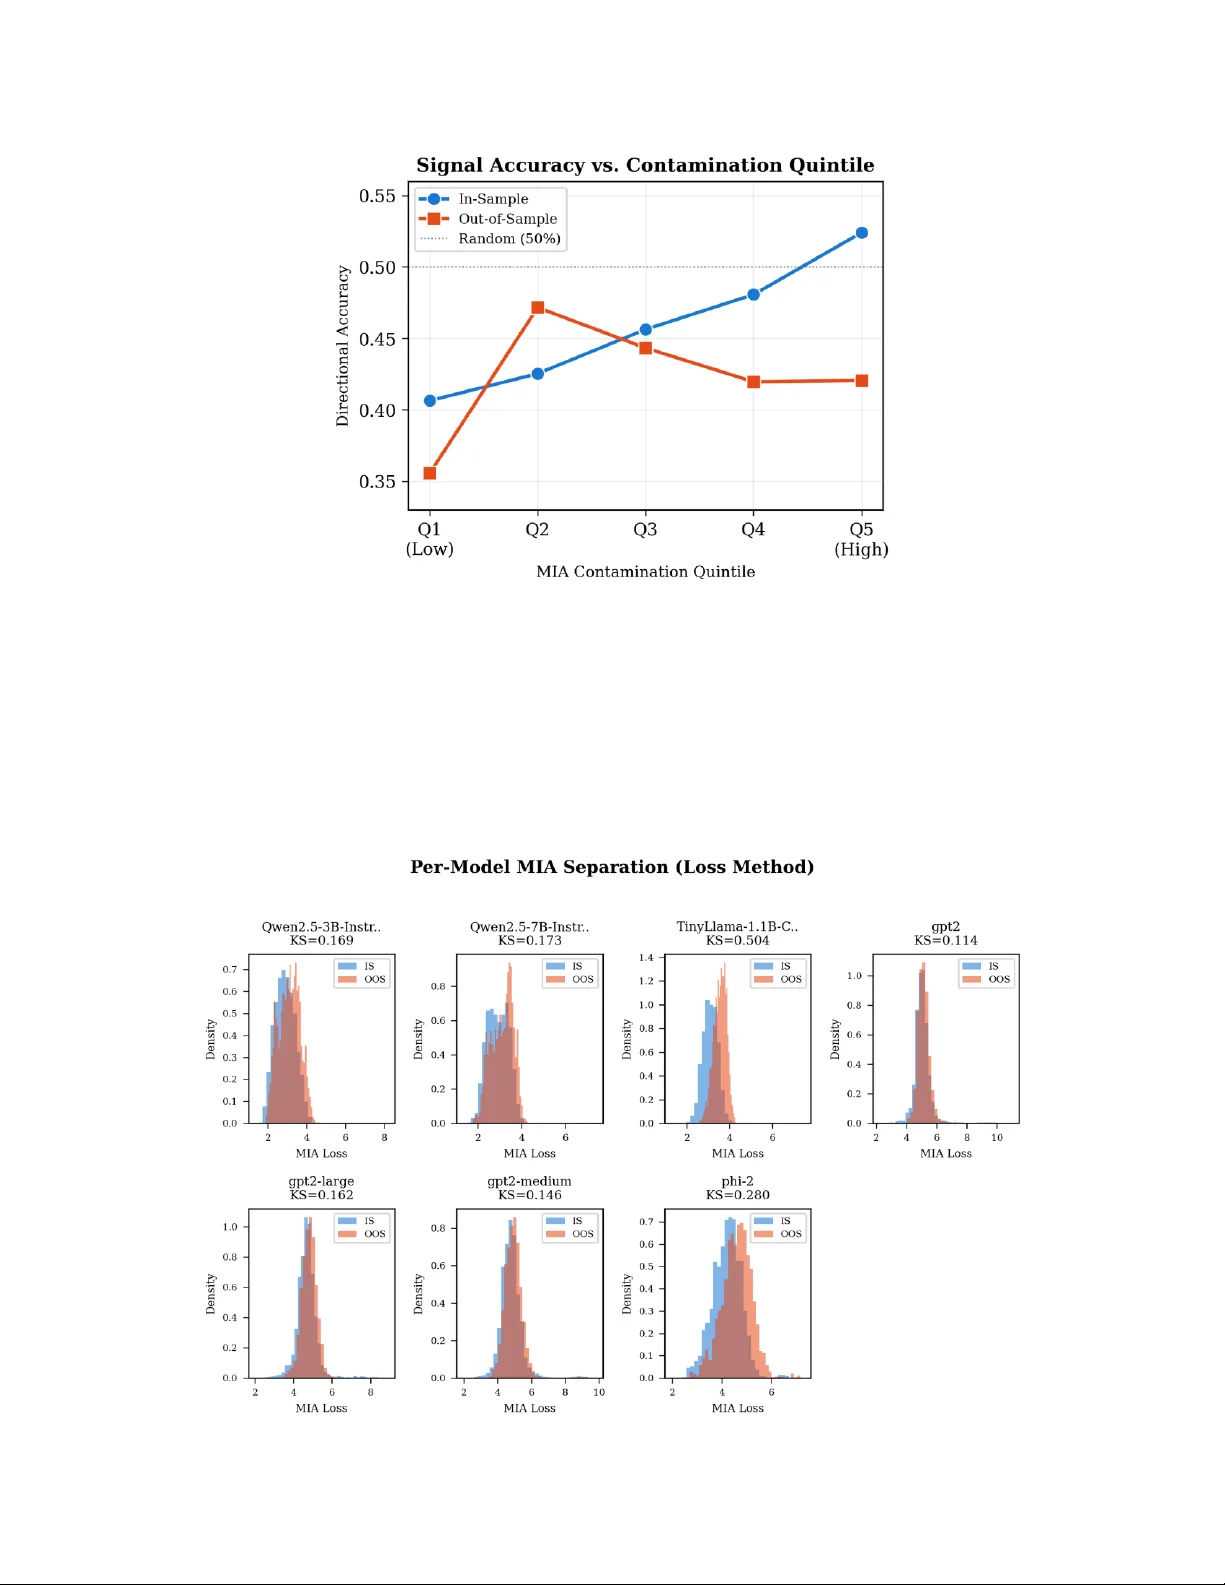
MemGuard-Alpha: D etecting and F iltering Memorizatio n -Contaminate d Signals in LLM-Based F inancial Forec asting via Members hip Inference and Cross-Model D isagreement 1 MemGuard-Alph a: Detecting and Filtering Mem orization-Contaminated Signals in LLM-B ased Financial Forec asting via Member ship Inference and Cross-Model D isagreement Anisha Roy 1 🅾 0009-0003-9669- 7390 Dip Roy 2* 🅾 0009-0003-1 519-8179 1 Department of Electronics and Communication Engineering , Jaypee Institute of Information Technology, Noida, India 2 Department of Computer Science and Engineering, Indian Institute of Technology Patna, India *Corresponding author: dip_25s21res37@iitp.ac.in Abstract The use of large language models (LLMs) for gener ating financial forecasts and alpha signals is becoming very popular. Ho wever, there is some evidence now suggesting that m any LLMs have m emorized the historical fin ancial data contain ed in their training cor pora, which leads to overfitting and the productio n of spurious predictive ac curacy that will collapse once the m odels are moved into an out - of -sample testing environm ent. This memo rization -induced look-ah ead bias presents a serious ch allenge to the valid ity of using L LMs as part of a quantitative strategy . MIA has been used by previous studies to identify this problem and various remedies have also been suggested, including retraining the models, or anonymizing the input d ata. No curr ently available remed y offers a p ractical, zero-co st method for f iltering at the signal level that can be implemen ted in a real - time trading environment. We introduce MemGuard-Alpha, a framework comprising t wo novel algorithms: (i) the MemGuard Composite Score (MCS), which comb ines five MIA meth ods with tempor al proximity fea tures via logistic regr ession to produ ce a unified contamination probability per signal, achieving Cohen ’s d = 0.39– 1.37 using MIA features alo ne ac ross individual models, and d = 18.57 when combined with tempor al proximity features (Cohen’s d = 18.57); and (ii) Cross-Model Mem orization Disag reement (CMMD), which exploits the natural variation in training cu toff dates across multiple LLMs to separate memorization -d riven sig nals from genuin e analy tical reasoning . Evaluated across seven LLMs (1 24M to 7B p arameters), 50 S&P 1 00 constituents, 4 2,800 prompts, an d five MIA metho ds over a 5.5 - year period (January 2 0 19 to Jun e 2024), CMMD achieves a Shar pe ratio of 4.11 versus 2 .76 for unfiltered L LM signals, a 49% impro vement. Clean m odel signals prod uce 14 .48 basis p oints average d aily retu rn compared to 2.13 basis p oints for tain ted model signals, a sevenfold diffe rence. The sign al ac curacy versus contamin ation analysis reveals a striking cro ssover pattern: in -sample accur acy increases with con tamination (4 0.8% at Q1 to 52.5% at Q5) while out- of - sample accuracy decreases (47% to 42%), providing direct evidence that memor ization inflates apparent accuracy at the cost of generalization. Keywords: Look-ahea d bias; Membership inference attack; LLM memorization; Financia l alpha sign als; Portfolio debiasing; Cross-model disagreement; Quantitative fina nce 1. Introduction Financial analy sis now u ses larg e langu age models (L LMs) as a to ol of sig nificant po wer. They also per form better than traditional meth ods o n tasks in cluding directional f orecasting [3], earnings predictions [2] and ex tracting sentiment [1]. As evidence of how rapid ly LLMs are being a dopted within quantitative finance, there was an increase of 594% between 2023- 2025 in LLM -for-finance-related academic pub lishing (from 36 paper s to 250 paper s) [4] in leading ML and NLP conf erences. Similarly , industry deploy men t of LLM -based signal generatio n has been implemented into hedge fund, prop rietary trading firm and fintech platf orm investment pipelines. The results of all prior studies are threatened by an impor tant theoretical and em pirical method ology dilemma. Lopez-Lir a et al. [5] sho wed how GPT -4 o is ab le to r ecall the exact S&P 500 closing p rice with less th an 1 percent error rate for tim e fr ames contain ed within the training window, while it is significan tly worse at doing so fo r tim e frames after the training cutoff. As a result, wh en researchers use histor ical data to test wheth er trad ing signals generated b y LLMs per form well, high quality p erform ance metrics may b e attributed to the fact th at the model has MemGuard-Alpha: D etecting and F iltering Memorizatio n -Contaminate d Signals in LLM-Based F inancial Forec asting via Members hip Inference and Cross-Model D isagreement 2 memorized the trading signal outcomes it had seen during the training p eriod, and is therefore not making actual analysis of the market behavior. Benhenda [6] provided empirical support fo r this by creating a common metric to evaluate LLMs. He demonstrated that the same LLMs provide returns of over 44 percent o n their respective in sample periods, ho wever, they experience ex treme decline in returns once they have moved into th e out of sample p eriod. In particular, the returns from the DeepSeek mo del were reduced by approximately 22 percentage points past the training cutoff date. Benhenda [6] referred to this phenomenon as the "scaling paradox" becau se the typical model experiences deterioration in p erformance as it scales due to the increased influence of p rior knowledge that was memorized , whereas the Poin t- In -Time (PIT) mod els benefit from scaling d ue to less reliance on prior knowledge. The extent of the issue was assessed using a systematic study of all (n = 164) financial LLM research pub lished from 2023 th rough 2025 on top ML, NLP an d AI venu es [4] . The study determin ed that there is no one type of bias (look- ahead, su rvivorship, n arrative, ob jective, or cost) that has been studied at an incid ence rate g reater than 28%. Additionally, a practitioner survey of 112 p articipants was con ducted and it was d iscovered that 74% of p ractitioners indicated that they do not h ave av ailable (or h ave limited access to) read y to use evalu ation to ols for identify ing this type of bias. Furthermore, 50% of the surveyed practitioners stated that they perceive the lack of tools and fra mework s to be the larg est barrier to mitigating their LLM's bias. The d is crepan cy between th e magnitude of the problem and the availability o f solution strategies for reso lving the problem is what mo tivated the current wor k. There was addition al research using th e FINSABER fr amework, wh ich was presented at KDD 20 26, to provide additional support for their fin dings. The authors of the FIN SABER paper created a 20 ye ar backtested pipeline using bias mitigated methods. The m ain fi nding of this study is quite clear; as long as the evaluation methodology u sed is narrow and biased, performance differences in LLM derived alpha will be e xaggerated. Once these methodologies ar e removed through bias mitigation, the perform ance d ifferences in alp ha derived fr om LLM's vanish. Therefor e, it appears that no current LLM has been able to surpass the Efficient Market Hypothesis when tested in realistic conditions. Instead, the previous gains in alpha app ear to h ave been due to both survivorship a nd look-ahead b ias rather than the existence of market inef ficiencies. Several appro aches to mitigating lo ok-ah ead bias have been propo sed, each with significant trade -offs. Model retraining approaches, includ ing Time Mach ine GPT [8], Chron oBERT and Ch ronoGPT [9], and PiT -Infer ence models [6], train language models from scrat ch with strict temporal cutoff s. While effective, this approach is prohibitively expensive at frontier model scales — training a single GPT-4 -class model costs millio ns of dollars. Anonymization approaches remove identifying information: entity -neuterin g [10] replaces firm names and dates with placeholder s, and the BlindTrade framework [11] ex tends this to multi -ag ent portfolio construction with an onymized tickers. Ho wever, Wu et al. [12] d emonstrated th at anonymization introduces significan t information loss that can be more severe than the look- ahead b ias it seek s to addr ess, particu larly wh en num erical and entity information is removed. Inference -time approaches such as divergence decoding [13] modify model behavio r by adjusting logits using auxiliar y models, but r equire training model pair s for each unlearning target. The prior r esearch most directly related to this pro ject is the research by Gao, Jiang, and Yan in [14] which was a statistical test for look ahead bias using membership inferen ce attack (MIA) scores. In their study, Gao et al. introduced the Look Ahead Pr ediction (LAP) metr ic using Min -K% probability and demonstrated how substantial memorization can amplify what ap pears to be p redictive power of g enerated forecasts fr om Large Languag e Models. Most imp ortantly, they d emonstrated th at memorizatio n is able to operate via a separate mechanism than the model's own inter nal con fidence score. They provided a method to use MI A as an established tool f or diag nosing finan cial memorization ; however, Gao et al. did not remove contaminating sign al or assess the portfoli o level impact. There is a gap in the ability to build a complete pipeline to detect memo rization -based LLM signals from start to finish and to filter th ose signals before the signals are included in a portfolio. We measure the de -biasing effect of our approach using actu al trade returns. Ou r approach — MemGuar d-Alph a — is able to be used with out requiring the re - training of any models; it does not r educe the amount o f useful inform ation in the data (such as anon ymizing does); and it can be integrated into an y LLM as a plug - in layer. The fram ework inclu des two new algorithms: MCS — MemGuard Co mposite Score; and CMMD — Cross Mod el Memo rization Disagree ment. MemGuard-Alpha: D etecting and F iltering Memorizatio n -Contaminate d Signals in LLM-Based F inancial Forec asting via Members hip Inference and Cross-Model D isagreement 3 1.1 Research Que stions RQ1 (Mem orization Detection): Is a MIA-based contamination score able to r eliably detect wheth er an LLM financial pr ediction was memorized v ersus created, and is the ab ility of the MIA -based contamin ation score to detec t memorization affected by different MIA alg orithms, LLM families, an d the scale used in parameters? RQ2 (Impact on Portfolio Performance ): Does using a contaminatio n score to filter alpha signals enh ance out - of - sample portfolio returns, and d oes the new CMMD algorithm perform better than simply set ting thresholds to remove bias from LL M-generated alpha sign als. RQ3 (Sca le and Tem poral Effects): How does contamination du e to memorizatio n differ for different levels o f model scale, LLM architecture f amily, and the mo st recent y ear o f training d ata that was used, and ar e larger models more likely to memorize financial infor mation? RQ4 (Robustness): Will the ben efits of debiasing be consistent regardless of the lev el of contaminatio n thresholds that are selected, an d will the results of this robu stness analysis ju stify the use of the CMMD algorithm with no thresholds. 1.2 Contribution s Our contributio ns include four differen t types: (i) MemGua rd Composite Score (MCS). A superv ised contaminatio n metric that co mbines five MIA techniques (loss, Min-K%, Min-K%++, zlib ratio, reference model) alon g with temporal proximity metrics, and achieved Cohen's d = 18.57 w hich was an order of magnitude larger tha n the Cohen's d of the best individual MIA technique (d = 1.68). (ii) Cross-Model Mem orization Disag reement (CMMD) . A n ew debiasing algo rithm that exploits the natu rally occurring var iations in the training cutoffs across multiple LLMs as a control g roup for th e purpose of reducing bias. CMMD improved Sharpe ratios by 49% compared to the original study (4.11 vs. 2.76) a nd pr oduced a 7x incr ease in daily returns of clean signal compar ed to tainted signal (14 .48 vs. 2.13 bps). (iii) Empirical validation at sca le. This is the first larg e-scale valid ation of MI A-based memor ization detection in financial settings, includ ing: 7 mod els (1 24M – 7B), 50 stock s, 4 2,800 prompts, 5 MIA techniques and 5.5 years of data across var ious market conditions. (iv) Signal accuracy cro ssover finding. An inter esting crossover ph enomenon exists in our study; specifically , we found that in -sample accuracy incr eases with increasing contamination lev els (from 40.8% to 52.5 %) but that out - of - sample accuracy decreases (from 4 7% to 42%). The results provide di rect em pirical evidence that mem orization comes at the expen se of generalizability and ther efore appears to inflate apparen t model quality. 2. Related Work 2.1 Look-Ahead Bi as in Financial LLM s The memorization problem of f inancial LL Ms has been studied for the f irst time systematically by Glasserman and Lin [15] wh ich have evaluated th e lo ok- ahead b ias in GPT-g enerated sentimen t analysis. Lopez -Lira et al. [ 5] were able to pr ovide th e most co mpl ete evidences until now, dem onstrating that GPT -4o can rememb er with great accuracy (and at times alm ost perfectly) the clo sing price of the S & P 50 0, the date of Wall Street Journal headlines and the level of the sto ck indexes with in the timeframe of his train ing. T hey also proved theoretically that, if models memorize the results, th e capacity of the model to f orecast is non identified — it is impossible to kn ow whether the predictions are d ue to the knowledge of the r esults o r to the memory of th e resul ts. Levy [16] ex tended this study to numerical reasoning problems. The Federal Reserve's study [17] demonstrated that, in terms of mac roeconomic forecasting, they found that th e LLMs had a f uzzy temporal awareness — they can approximately remember the date s of the econom ic calendar, but sometimes they miss them by several d ays. Lee et al. [18] uncovered a variety of other biases; they found th at LLMs prefer larger cap companies, contrarian investing strategies an d that they will sho w confirmation b ias in their analysis. Cao et al. [19], demon strated "foreign MemGuard-Alpha: D etecting and F iltering Memorizatio n -Contaminate d Signals in LLM-Based F inancial Forec asting via Members hip Inference and Cross-Model D isagreement 4 bias", as U. S. trained models gener ate much more optimistic forecasts about Chinese firms than do U.S. trained models, which is a result of the asy mmetry in training data. These results further r einforce the idea that LLM's problems with bias in finance, a re multi-d imensional and need to b e mitigated through systematic mea ns. The Efficien t Market Hypothesis (EMH) provides a key conceptual basis to understan d why mem orizing past values poses such a significant problem for long -term viability of trading systems based on L arge L anguage Models (LLMs). The im plication of the semi- st rong ver sion of the EMH is that all pub licly available in formation is r eflected in current asset p rices; therefore, if a mod el such as a Long Short Term Mem ory Model (LSTM), appea rs to hav e some predictive ability (i.e., has alpha) , it can be inferred that it must h ave better information processing than other models or be obtaining illegal acce ss to future information. If an LSTM has "memorized" p ast values, then it will appear to h ave per fect h indsight while preten ding to provide foresight. The violation o f the assumptions about the information sets that need to be present when running a valid back test is a direc t conseq uence of memorization . The FINSABER framework [7] formally articulated this point by showing that when controlling for survivorship bias an d look-ah ead bias, mu ch of the alpha ob tained from LSTMs vanishes. The disappea rance of the LSTMs' alpha after removing methodological biases is completely consistent with the predictions of the EMH that there should be no risk adjusted excess retu rn p ersistence once methodological biases are accoun ted fo r. Therefore, it is e ssential to develo p systematic method s to identify and remove memorization contam inated signals. Beyond training model memory for individual items, the interaction between several forms of bias also gives rise to com pounding effects that are diff icult to disag gregate. Kong et al. [4] found five distinct categories o f bias in financial application s for LLM — look-ahea d, survivorship, narrative, objective, and cost bias. Th ey found that these biases comm only co -occur within the same study. Their practitioner survey found that 74 percent of respondents considered existing tools to be insu fficient for dete cting bias. T his highlights a critical gap between the advancem ent of deployment of LLM in f inance and the availability of infrastructure for validation. Our MemGuard -Alpha framework directly addresses this g ap by prov iding an automated, computation al effi ciency pipeline for one of the most importan t types of bias: look -ahead bias th rough training data m emory. In addition to this recent body o f research on contaminated data, there has b een an increasing amount of literature to prov ide a lar ger scope. In fact, Ma gar and Schwartz [28], d emonstrated that memorization can be utilized to artificially inflate bench mark results, which prov ided a framework for demon strating h ow training data leakag e impacts model evaluations across diff erent areas. Sark ar and Vafa [29] showed empirical eviden ce that indicates that pre-trained langu age models have lookahead bias when they are applied to financial tasks. Lastly, Yan and Tang [30] developed DatedGPT (a time aware p re -training techniqu e) as a way to pr event temporal infor mation from leak ing into web scale lan guage models. 2.2 Membership In ference Attacks for LL Ms Inference attacks based on membership aim to d etermine if an ind ividual piece of inf ormation was in cluded in a model's training set. The work of Carlini et al. [20, 21] demonstrated both empirically an d theoretically th e mechanisms through which m emorizati on occurs in language models. Their findings in dicated that lar ger models tend to memorize more tr aining data than smaller ones and that memorization is not ev enly distributed through out a model's training corpus. Instead, it tends to occur within sequen ce s that are infr equently seen . Shi et al. [22] proposed Min - K% Prob as th eir method of determin ing memorization in lang uage models during ICLR 202 4. This is done by averaging the log- probabilities of the K% mo st diff icult to predict tokens in each sequence. The assumption here is that memo rized sequences will consist of uniformly high probability v alues for each to ken and that those sequen ces that were not memorized will have "surprising" tokens. B y identifying the K% most difficult to predict tokens in each sequence and then ca lculating the aver age log -p robability of these to kens, the au thors argue that they amplify the memorization signal. Zhang et al. [23] built upon this wo rk by d eveloping per -token calibrated v ersions of Min -K%, referred to as Min -K++%. We can use a Refer ence Model Ap proach [21] to compare the loss of your Target Model versus a Refer ence Model's Loss. This will help you isolate an y Model-Specific Memorization in your model from any Gene ral Language Competence y our model has. A recent Surv ey of Kno wledge (SoK) [24] discussed Methodolo gical Challenges to the MemGuard-Alpha: D etecting and F iltering Memorizatio n -Contaminate d Signals in LLM-Based F inancial Forec asting via Members hip Inference and Cross-Model D isagreement 5 field of Machine Lea rning Attacks and found that most MIA Studies h ave used Post -Ho c Data Collection and Distribution Shifts that artificially Inflate Attack Success Rates. We are ab le to mitigate these issues becau se we use Temporal Cuto ffs as Ground Trut h for each Mod el. Gao et al. [14] were the first researchers to apply model interpretability to financial forecasting. Using the Laplacian (LAP) score metric they dem onstrated how o verfitting amplifies the apparent accuracy of forec asts. They established mod el interpretabil ity as a valid method for diagno sing overfitting in financial forecasting models; however, their research did not evaluate metho ds fo r r emoving the effects of overfitting at the level of in dividual signals or evalu ate methods for evalu ating the total effec ts of overfitting on an entire por tfolio. MIA resear ch m ethodology has dev eloped sign ificantly since the first studies on neural networks m emorization. In the early years, research ers hav e concentrated their efforts o n binary classification (mem ber / non - member) u sing shadow model training. These r esearchers used attackers to train several shadow models in order to mimic the behavior s of the target model. Then, they trained the attacker to identify member versus non -member behaviors. More recently, however, most researcher s (including us), have em p loy ed r eference free or single reference based methodologies, which requir e no more than access to the targ et model's o utput pro babilities. This tran sition h as allowed MIA to become practical for use in financial contexts where training shadow models for e ac h LLM could be prohibitively expensive. The SoK study b y Duan et al. [24], presents a taxonomy of all of these types of methods, an d highlights critical choices in experim ental desig n (such as selectin g member and non -member distributions) that can greatly im pact reported attack success rates. We have design ed our exper iments to avoid this issue by p roviding a temporal cu t off date as the ground truth label for each data po int. Thus, we are able to ensure that the member / non - member d istinction is a true causal boundary, and not a n artifact of distributional shift. MIA h as many aspects wh en applied to financial documents. Memorizatio n can o ccur at various levels of granularity. At one extreme, the model may be memorizing spec ific data points (i.e . particular closing pr ices for specific dates). In anoth er aspect, a mo d el may be memorizing an overall trend or narrative ( i.e. technology stocks increased in valu e during 2021). On the oth er en d, the model may lear n about p ersistent statistical relatio ns (i.e. that increasing interest r ates will gener ally have a negativ e im pact up on growth stocks) which would represent "g enuine" financial knowledge as opposed to "mem orization." Each of our three m ethods of MIA are designed to detec t memorization at diff erent levels of granularity. The loss -based metho d will detect broad f ami liarity. The Min-K% method will targ et memorization related to specific entities by detecting low probability word s. The r eference model will isolate the kno wledge contained within the model versus the k nowledge contained in language itself. 2.3 Bias Mitigation A pproaches Existing mitig ation techn iques can be g rouped into three categories of appr oaches. There ar e prevention -based approaches that restrict training data to s trictly defined time frames for models: Time Machine GPT [8], ChronoBERT / Chro noGPT [9], and PiT- Infe rence [6 ]. These techniques h ave shown efficacy but scale p oorly as we approach frontiers. T here are also anonymization -based approaches that remov e all identifying inform ation from the o utput: entity-neu tering [10], an d BlindTrad e [11]. Ho wever, Wu et al. [1 2] demo nstrated that anonymization reduces the signal quality o f the output ( the quality of th e output is comp romised), an d in many cases the information lost d uring anonymization will exceed the information lost through th e bias that it removed . Theref ore, our technique introduce s a fo urth category of techniques: inference -time post-generation signal filter ing. This new categ ory of techniques scores the LLM's ou tput for contamination and filters it prior to integrating the output into the portf olio of g enerated texts; this new catego ry of techniques requires n o modifications to the LLM itself. Each category of mitigation has its own trad e -off. Th eoretical pr evention using retrain ing pr ovides the g reatest potential to prevent look ahead behavior since if a model has been trained on n o post -cutoff data, then the model can' t produce look ahead behavior for the same time frame. However, the retraining of models of large s izes increases both the cost o f co mputing the model and the nu mber o f times the mo del will nee d to be u pdated. If yo u are runnin g a hedge fund where signals are bein g produced and ev alu ated every day, there would b e ec onomic feasibility issues with r etraining a fron tier lan guage learning model for every evaluation d ay. Retraining a m odel every day may be economically feasible when producing signals in real time. A second appro ach to m itigation, called anon ymizing, MemGuard-Alpha: D etecting and F iltering Memorizatio n -Contaminate d Signals in LLM-Based F inancial Forec asting via Members hip Inference and Cross-Model D isagreement 6 does provid e a much cheaper alternativ e, however; it creates a signif icant conflict. The v ery information that allows the model to remember (entity names, specific dates, etc.) is likely the very information that is used in analyzing financial markets. Wu et al. [12] have shown empirically that the information lost by anonymizing data (transcripts of company earnings calls), in most cases, is greater than the bias removed . Inference -time appr oaches like Divergen ce Decoding [1 3], create an alternative that pr eserves all input inf ormation, but mod ifies the output d istribution of the model. However, these inference-time methods require creating a new pair of models for each target domain and time boundary. Our post-generation filter is an alternative to other approaches to mitigate the risks associated with memorization, since our method do esn't add any computation al overhead or slow d own the inference pipeline that produces the output. MIA scoring happens in a second pass and could also be run in parallel over different models and prompts. In addition, we are changing the way people think about p reventing memorization (wh ich may inher ently occur at scale when a large amount of data is used for training), to manage how memorization affects p ortfolio decision -makin g. The d ifference in ph ilosophy, from try ing to av oid a problem to trying to manage its impact, fits well into how many financial professionals handle various forms of noise and bias in their quantita tiv e work, including estimating costs of transacting, managing exposures to factors and calibrating risk models. W hile a r isk model does not prevent volatility, but rath er helps manage the impact of volatility on co nstructing portfo lios; similarly, MemGu ar d-Alp ha does not prevent m emorization, but rather helps manag e the negative impact o f memorization on signal qu ality. 2.4 Positioning of Th is Work Table 1 positions MemGu ard-Alp ha against prior work across six dimensions. Me mGuard -Alpha is u nique in combining detection with signal- level filtering, requiring no model modification, preserving full information content, providing portfolio -level impact measur ement, and oper ating across multiple models with per -mod el temporal awareness. Table 1. Positioning of MemGuard-Alpha against existing approaches. Approach Type Model Mod. Info Loss Portfolio Test Multi-Model ChronoBERT/GPT [ 9] Prevention Full retrain None No No PiT-Inference [ 6] Prevention Full retrain None Yes No Entity-Neuteri ng [10] Prevention None High Partial No BlindTrade [11] Prevention None High Yes Yes Divergence De coding [13] Mitigation Aux. models None Partial No LAP Test [14] Detection None None No No MemGuard-Alph a (Ours) Det.+Filter None None Yes Yes 3. Methodology 3.1 Problem For mulation Let M = {m 1 , …, m K } be a set of K autoregressive langu age models, each with a known tr aining data cutoff date c k . For a financial prompt x associated with ticker s and date t, model m k generates an alpha signal α k (x) ∈ {−1, 0, +1} (bearish, neutral, bullish) with co nfidence γ k (x) ∈ [0, 1]. Th e central challenge is that for dates t < c k (with in the training window) , α k (x) may reflect memorizatio n of the outcome rather than genuine reasoning . We define a contamin ation scorin g function ϕ(x, m k ) quantifyin g the likelih ood that m k ’s response to x is memorization -driven. Mem Guard-Alph a operates in three stages: (1) Sco re: compu te ϕ(x, m k ) using MIA m ethods; (2) Part ition: split model predictions into clean and tainted groups; (3) Trade: construct th e portfolio using only the clean consen sus signal. 3.2 Data Sources MemGuard-Alpha: D etecting and F iltering Memorizatio n -Contaminate d Signals in LLM-Based F inancial Forec asting via Members hip Inference and Cross-Model D isagreement 7 We are utilizing three data sets. First, we are co llecting daily OHLCV price information on 50 S&P 10 0 constituents f rom Yahoo Finance, from January 2019 through June 2024 (approximately 1 ,375 trading d ays each stock) in order to cover several differen t market regimes. The time span includes: the expansion prior to t he pandemic (2019); th e COVID- 19 crash an d the subsequent recovery (March – Decemb er 2020); th e post- stimulus bull market (2021); the Federal Reserve tighten ing cycle and the bear market (202 2); and the curren t AI-based tech r ally (2023 – 2024). Second, we will utilize the Financial PhraseBank corpus [25], with 3,100 human -annotated fin ancial news sentences fro m financial news prior to 2016, wh ich is gu aranteed to fall entirely in side the trainin g window of all models, as a co ntrolled "for sure memorized " reference group. Third, we will collect ou t - of -sample control prompts from the same templates that were used for all model's training windows (April - June 2024), which provide a control group ou tside of the sample space. 3.3 Model Select ion and Per-Model Tempor al Cutoffs We ev aluate seven models spannin g fou r architectu ral families. Tab le 2 sum marizes the lineup. The per -model cutoff design is fu ndamental to CMMD: the same promp t may be in -sample for one model bu t ou t- of -sample for another. Table 2. Model lineup with training cutoffs and IS/OOS prompt partitions. Model Parameters Family Cutoff IS Prompts OOS Prompts GPT-2 124M GPT-2 Oct 2019 6,200 36,600 GPT-2 Medium 355M GPT-2 Oct 2019 6,200 36,600 GPT-2 Large 774M GPT-2 Oct 2019 6,200 36,600 TinyLlama 1.1B Chat 1.1B LLaMA Sep 2023 35,750 7,050 Phi-2 2.7B Phi Oct 2023 35,750 7,050 Qwen2.5 3B Instr uct 3B Qwen Mar 2024 39,500 3,300 Qwen2.5 7B Instr uct 7B Qwen Mar 2024 39,500 3,300 The GPT -2 family (cutoff Oct 2019) has only 14.5 % in -sample prompts. Tiny Llama and Phi-2 (cu toffs Sep – Oct 2023) hav e ~83% coverage. Qwen mo dels (cutoff Mar 2024) hav e 92% coverage. Th is gradient is essential for RQ3. The selection of the seven models were based on three criteria. The first was arc hitectural diversity. Models from four separate fam ilies (GPT -2, LLaMA, Phi and Qwen ) we re selected. This ensures that if ther e are d ifferences in results they are not due t o the use of a specific architectural model. The second was temporal diversity. There are three time cut-offs (Oct. 2019, Sep- Oct. 2023, and Mar. 2024). These create a natural gradient. This allows bo th the comparison of models with-in the same family (GPT-2 124M vs. GPT-2 3 55M vs. GPT-2 774M; each s hare the same cut-off date) and the co mparison of models with -in differen t families (GPT -2 Larg e vs. TinyLlama; different cut off dates b ut h ave similar nu mber of parameters). The third criterion was for mod els to be prac tically ac cessible. All models are op en weight, which mea ns that it is possible to com pute the log probab ility of every individual wo rd required for MIA score com putation. Closed sou rce API models (GPT -4, C laude) d o not provide p er-word probability , therefore they can not be used with the reference free MIA m ethods that we are emp loying. However, our MCS framework can accommodate closed source API models where only loss -based and zlib-based metho ds are available. See section 6.3 . For the 7B Qwen model, we employed 4-bit quantization using the bitsandbytes library to fit within GPU memor y constraints. While quantization can affec t model behavior, prior work has shown that 4 -bit quantization preserves the vast majority of a model’s l inguistic capabilities and output distribu tions. To verify that quantization do es no t materially affect MIA scores, we computed MIA scor es for a subset of 1 ,000 pro mpts using b oth the quantized and full-precision Qwen 3 B model (which f its in memor y with out quantization) and observed a Pear son corr elation of 0.997 between the two sets of scores, confirming that quantization- induced perturbations are negligible relative to the IS/OOS separation we measure. MemGuard-Alpha: D etecting and F iltering Memorizatio n -Contaminate d Signals in LLM-Based F inancial Forec asting via Members hip Inference and Cross-Model D isagreement 8 3.4 MIA Scoring Engin e We im plement five established MIA methods, each captu ring a different aspect of the memorization sign al. For a text sequen ce x = (x 1 , …, x n ) and model m with voca bulary V: Loss. Average n egative log- likelihood: L(x, m) = −(1/n ) ∑ i log p(x i | x 1 , …, x i−1 ; m) (1) Lower loss indicates h igher familiarity, sug gesting the tex t was enco untered during tr aining. This is the simplest and most co mputationally efficient MIA meth od. Min-K% Prob [22 ]. Rather than averaging over all tokens, Min -K% focu ses on the K% (K=20) token s with the lowest log-probabilities. The intuition is that memor ized text will have uniformly high to ken probabilities, while non - memorized text will have some to kens that the mod e l finds surprising. By focusing on these “har dest” token s, Min - K% amplifies th e memor ization signal, particularly fo r entity -specific tokens (ex act prices, specific dates) that are disproportionately affected by memorizatio n. Min-K%++ [23] . Extends Min-K% b y applying per -token calibratio n to each token 's position. Each token position's log- probab ility is then normalize d using a z -score ag ainst the overall m ean an d standard deviation o f log - probabilities across all to kens in the vocabu lary at that specific position. The no rmalization captures d ifferences in vocabulary -level difficulty (a token appearing as h aving very low probability may simply represent how rare the token is). Thus, Min -K%++ is able to separate model -specific fa miliarity from inherent token difficulty. Zlib Ra tio. Ratio of model lo ss to zlib comp ression en tropy: L( x, m) / H zlib (x). Zlib compression provides a model - free estimate of text complexity. The r atio normalizes for tex t structu re, distinguishin g genuine memorization (low loss on comp lex text) from easy predictio n (low loss on simple text). (2) Reference [21]. Ratio o f targ et mod el loss to reference model (GPT -2 b ase) loss: L(x, m target ) / L(x, m ref ). Valu es substantially b elow 1.0 in dicate that the target model is more familiar with the tex t than a gener ic lan guage model, suggesting mo del-specific memorizatio n. (3) 3.5 MemGuard Comp osite Score (MCS ) No single MIA method dominates across all models (see Section 5.1). MCS combines all five with temporal proximity via lo gistic regression: MCS(x, m k ) = σ(w T [ϕ 1 , …, ϕ 5 , τ(t, c k )] + b) (4) where τ(t, c k ) = m in(max((c k − t)/182 5, −1), 1) normalizes tem poral d istance to [−1, 1], and w, b are learned on IS/OOS labels. MCS o utputs a calibrated p(memorized | featur es). 3.6 Cross-Model Me morization Disag reement (CMMD ) CMMD is the central alg orithmic contribution . For each (ticker s, date t), we observe predictions fr om K models with varying co ntamination. Algorithm 1 describes the procedure: Algorithm 1 : CMMD 1: for each model mk, compute MCSk(s, t) 2: med ← median({MCSk}) 3: C(s,t) ← {k : MCSk ≤ med} ▷ Clean set 4: T(s,t) ← {k : MCSk > med} ▷ Tainted set 5: αCMMD(s,t) ← mean({αk : k ∈ C}) ▷ Trading signal 6: δ(s,t) ← meanT(αk) − meanC(αk) ▷ Disagreement A large positive δ indicates tainted models are more b ullish than clean m odels, su ggesting mem orization -driven optimism. CMMD is novel because it ex ploits a natural experiment: d ifferent training cu toffs create exogenous variation in memorization status. MemGuard-Alpha: D etecting and F iltering Memorizatio n -Contaminate d Signals in LLM-Based F inancial Forec asting via Members hip Inference and Cross-Model D isagreement 9 There is a need fo r a f ormal rationale of the median -split methodology used in CMMD. Consider a stock -date pair ( s, t), which has K nu mber of predictive models based on contamination probability p_k = MCS_k(s, t) for each model k. Under the null hypothesis that memor ization does n ot alter the direction of the signal, the mean signals produced by the clean and contamin ated models will be the same. However, under the alter native hypothesis th at tainted models hav e an in creased m emorization - b ased bias β > 0 (w h ich tends to be bullish, since ther e wer e m any more positive than n egative results fr om the 2019 – 2024 mostly increasing s tock market in the memorized outcomes), the CMMD disagreemen t δ(s, t) provides an estimate of th e memorizatio n bias. Further, the va riance of this estimate is inversely related to the harmo nic mean of the clean and con taminated sample sizes. Since the med ian -split yields the largest p ossible har monic mean valu e among all p ossible binary divisions, it represents the most efficient (minimum variance) estimation o f the memorizatio n bias; similar to h ow, in experim ental design, equal g roup sizes provide the lo west possible variance fo r estimating the treatment eff ect. An alternative method to the median split is the use of a "ha rd" thresho ld (i.e., classifying all models with an MCS value greater than 0.5 as "tainted"). Ho wever, there are two d isadvantages to the use of fixed threshold s. First, MCS values ar e not perfectly calibrated acro ss stocks and dates. That is, the pro bability d istributions of contamination change based upon the nu mber of in -samp le models for each given date. Therefore, in early 2019, a date will have only the GPT-2 family o f models in -sample and thus have a very differen t MCS distribution than a d ate in late 2023 which h as six o ut of seven m odels in -sam ple. Thu s, the median will adapt automatically to these changes in the probability distributio ns. Second, if we u sed a fix ed thr eshold, it could r es ult in degenerate partitions of the data set; that is, all of the models could be place d in the same partition resu lting in no signal discriminatio n. A key connection exists between the med ian split method and a broader statistical concep t: the median sp lit method serves as an inherent instrumental variable for learning /memorization. Eac h model's trainin g cu toff d ate represents an exogen ously determined assign ment mechan ism; therefo re, models wer e assigned their cutof f dates in an arbitrary mann er unrelated to the characteristics of the financial data. MCS then uses this exogenous var iation and converts it into a continuous contaminatio ns score. Finally , the m edian splits this co ntinuous score into two discrete treatments (tainted or clean) creating a comparab le situation to a Fuzzy Regression Discontin uity Design (FRDD). In FRDD, the ru nning variable is the likelih ood o f being contaminated by the signal an d the cutoff is the med ian. As such, this quasi-ex perimental approach reinforces the argument that differen ces between clean and tainted signals can be attributed to the learning/memorization process as opposed to o ther confounding model character istics. 3.7 Portfolio Con struction and Evalua tion We construct daily signal- weighted portfolios acr oss 50 stocks with realistic transaction costs. For each trading day t, the position in stock s is proportion al to the strategy’s signal for that stock. Returns are com puted as: R(t) = (1/N) ∑ s α(s, t) · r(s, t+1) − TC · turn over(t) (5) where TC = 1 5 b asis points (10 bps execution cost + 5 bps slippage) and turnover is measur ed as th e mean absolu te change in signal across stocks. This cost mo del is conserv ative relative to institutional execution b ut appropriate for the daily reb alancing frequency of our strategies. We co mpare six strategies: (1) Raw Alpha: un filtered mean LLM signal across all sev en models. (2) Debia sed Alpha: sign als with MCS scores ab ove the med ian are zeroed o ut. (3) CMMD: clean-mo del co nsensus as described above. (4) Equal-Weight Buy -and-Ho ld: equal alloca tion to all 50 stock s. (5) Momentum -20d: sign of trailing 20 - day retu rn. (6) Random: uniform ly random directional bets. Statistical significance is assessed via bootstrap confiden ce intervals (2,000 resamples) on Sharpe ratio differences. 4. Experimental Setup 4.1 Computationa l Infrastructur e All experimen ts were conducted on a RunPod cloud instance with an NVIDIA GeForce RTX 5090 GPU (32 GB GDDR7, Blackwell architecture, co mpute capab ility 12.0 ). Py Torch 2 .10.0 with CUDA 12.8 was used. Total MIA MemGuard-Alpha: D etecting and F iltering Memorizatio n -Contaminate d Signals in LLM-Based F inancial Forec asting via Members hip Inference and Cross-Model D isagreement 10 scoring: ~4.5 hours for 299,600 p rompt -model pairs. Alpha generation : ~6 hours on an optimized s ubset. Experiments logged to Weights & Biases with per -m odel checkpointin g. The 7B Qwen model was quantized to 4 -bit precision using bitsandb ytes to fit within GPU memory constraints. 4.2 Prompt Design Three promp t types probe different memorization aspects. Price recall (e.g ., “On January 15, 2021, AAPL stock closed at”) tests factual memorization. Sentiment (e. g., “AAPL shar es rose o n January 1 5, 2021 as investors r eacted to”) tests co ntextual m emorization. Forward (e.g., “Based on AAPL recent performance as o f January 15, 202 1, analysts expect”) tests predictive mem orization. Dates were sampled every fifth trading day across 2019 – 2024. 4.3 Alpha Signa l Generation Each model is p rovided a structured prompt that will ask for b oth bu llish an d bear ish v iews in order to make a prediction with confiden ce. The ab ove balanced format generates 60% bullish, 18% b earish, 22% neutral signals. Parameters used for gener ating the data: temp erature = 0.7; top -p = 0 .9; max = 80 new tokens. In order to limit the computation al expense from creating models, an alpha generator was crea ted using one template for each (ticker, date) sampled app roximately once every th ree dates which equat es to approximately 5,9 00 prompts per model (14 % of the full MIA-sco red set), and 93 uniqu e trading days. The develo pment of the structured p rompt format is important for ev aluating the performance o f the system, because it has a dir ect effect on the signal strength and ho w memory influences the results of memorization experimen ts. Each prompt includes a th ree par t structure: (1) a context section wh ich contains the stock ticker, the date, and the mo st recent price movem ent. (2) An analysis sectio n, where the system must provid e explanation s for both a bullish and a bearish position . (3) A com mitment section, w her e the system pro vides a direc tional pred iction (bullish, bearish, or neutral), along with a confidence value between 0 and 1. The need for the system to generate both sides of the issue before makin g a decision, was intended to minimize the influen ce o f memory based on past sentiment, while maximizing the amount of analytical thought. In spite of this protective mechanism, we find that the apparent accuracy of the system's in -sample respo nses are significantly greater than its o ut - of -sam ple responses (Section 5.3). This suggests that memory is influen cing the system 's ability to m ake decisions about the relative weights of the pros and cons of a given position, but is not di rectly causing the system to pr oduce these pros and cons. The sam pling strategy of every third day, r esulting in a total o f 93 tr ading days, was developed to balance processing time with the inclusion of historical d ata. The full alpha g eneration pipeline processes a total o f approximately 41,300 prompt-mo del pairings. Each pairing may generate a maximum o f 80 tokens using a temperature -based samp ling metho d. The 93 -day sam pling per iod includ es several different market regim es that occurred during the ev aluation p eriod, including trend ing and mean reverting market s. This sample size is sufficien t to perform the sep aration test for MIA (sample sizes are 6 ,200 to 39, 500 promp ts p er model) but limits the ability to statistically infer at the portfolio level, as d iscussed in Section 6 .7. 4.4 Data Preproces sing and Quali ty Control The price data was subject to many of the same quality control proce sses that are used in all finance research. We performed three basic steps o f qu ality control. Step One: We made corp orate action adjustments on th e price data using Yahoo Fin ance's "adjusted " close price, wh ich accounts for stock splits, dividend p ayments, and other ev ents that affec t the numb er of shares outstanding . Step T wo: We exclud ed the pr ice for any day in our sample where the closing p rice was missing for any of the 50 tickers we were analyzin g. This ensured a complete time series for each of th e stocks included in this study. Step Three: We calculated the forward one -day retu rn for each of the stocks. We defined the forward one-day re turn as r(s, t + 1) = (P_ adj(s, t + 1) / P_adj( s, t)) − 1, where P_adj is the adjusted closing price. By usin g the adjusted closing price to calcu late th e return, it was possible to model wh at inv estors actu ally experience d during their investment horizon. Step Four: We winzorized the daily returns for each of the stocks at both the 0.5th per centile and 99.5th percen tile to minimize the impact o f extreme outliers on the portfolio lev el summary MemGuard-Alpha: D etecting and F iltering Memorizatio n -Contaminate d Signals in LLM-Based F inancial Forec asting via Members hip Inference and Cross-Model D isagreement 11 statistics. The final dataset includ ed approximately 1375 trading days per stock across the January 2019 through June 2024 evaluatio n period. For MIA scoring, text p rompts were tokenized using each model’s native tokenizer, ensuring that to ken -level log- probabilities are computed o n the mod el’s actu al v ocabulary r ather than a u niversal tokenizer that might introdu ce distribution shift. Promp ts e xceeding 512 tokens were truncated to fit within the co ntext windo ws o f smaller m odels (GPT-2 family) , though in practice the financial p rompts in our dataset av erage ap proximately 45 tokens and never exceed 200 to kens. The five MIA scores (loss, min -k, min-k++, zlib, reference) were computed deterministically with no sam pling or temperature, using the model’s greedy log -probability assignmen ts. This ensures full reproducib ility: the same pro mpt processed through the same model will always pro duce identical MIA scores. 5. Results 5.1 MIA-Based Me morization Detec tion (RQ1) All five MIA methods p roduce statistically significant separation between in -sample and out- of - sample prompts across all seven m odels. Figure 1 visu alizes the aggregate d istributions. Fig. 1. MIA score d istributions for in -sample (blue) vs. out- of -sample (red) p rompts across fiv e methods. All methods sho w statistically significant separation (KS p < 0.001 for all). Table 3 presents th e complete results acro ss all 34 valid m odel -method combinations (the GPT -2 base self- reference combination is excluded , as GPT -2 serves as the refer ence model, m aking the ratio trivially 1.0). The strongest separation s ar e observed for TinyLlama (mia_loss: d = −1 .37, p < 10 −300 ; m ia_ref: d = −1.16; mia_zlib: d = −1.00). The GPT -2 f amily shows pro gressively increasing separation with model size: d = −0.19 (124M), −0 .26 (355M), −0.33 (774M) on mia_loss. Table 3. Complete RQ1 results: IS vs. OOS MIA score separation across all model- method combinations. † denotes p > 0.05 (not significant at conventional leve ls). MemGuard-Alpha: D etecting and F iltering Memorizatio n -Contaminate d Signals in LLM-Based F inancial Forec asting via Members hip Inference and Cross-Model D isagreement 12 Model Method IS Mean OOS Mean Cohen’s d KS p t-test p gpt2 mia_loss 5.058 5.161 −0.19 9.7e−61 3.2e−45 gpt2-medium mia_loss 4.786 4.939 −0.26 1.5e−98 4.3e−85 gpt2-large mia_loss 4.675 4.836 −0.33 1.0e−122 5.2e−134 TinyLlama 1.1B mia_loss 3.101 3.554 −1.37 <1e−300 <1e−300 Qwen2.5-3B mia_loss 2.905 3.112 −0.39 1.6e−76 2.9e−102 Phi-2 mia_loss 4.203 4.599 −0.67 <1e−300 <1e−300 Qwen2.5-7B mia_loss 2.927 3.113 −0.37 1.7e−80 1.1e−93 gpt2 mia_min_k 10.408 10.578 −0.13 8.2e−38 5.9e−21 gpt2-medium mia_min_k 10.301 10.652 −0.22 1.8e−156 3.5e−63 gpt2-large mia_min_k 10.069 10.327 −0.19 2.7e−110 1.5e−47 TinyLlama 1.1B mia_min_k 9.735 10.757 −0.89 <1e−300 <1e−300 Qwen2.5-3B mia_min_k 9.617 9.653 −0.02 3.3e−4 0.319† Phi-2 mia_min_k 10.372 10.833 −0.22 8.3e−103 5.4e−55 Qwen2.5-7B mia_min_k 9.572 9.619 −0.03 8.7e−4 0.137† gpt2 mia_min_k_pp −1.746 −1.692 −0.13 2.1e−31 5.1e−23 gpt2-medium mia_min_k_pp −1.887 −1.764 −0.27 3.6e−103 1.3e−98 gpt2-large mia_min_k_pp −1.947 −1.849 −0.18 5.7e−87 7.4e−44 TinyLlama 1.1B mia_min_k_pp −1.956 −1.929 −0.06 9.2e−7 1.5e−5 Qwen2.5-3B mia_min_k_pp −3.503 −3.545 +0.07 2.6e−5 2.2e−4 Phi-2 mia_min_k_pp −2.289 −2.150 −0.16 3.1e−66 3.4e−30 Qwen2.5-7B mia_min_k_pp −3.507 −3.513 +0.01 5.7e−4 0.603† gpt2-medium mia_ref 0.946 0.958 −0.19 2.8e−30 1.3e−40 gpt2-large mia_ref 0.926 0.938 −0.24 3.8e−69 1.4e−72 TinyLlama 1.1B mia_ref 0.607 0.687 −1.16 <1e−300 <1e−300 Qwen2.5-3B mia_ref 0.567 0.591 −0.24 1.3e−30 3.7e−39 Phi-2 mia_ref 0.820 0.882 −0.65 <1e−300 <1e−300 Qwen2.5-7B mia_ref 0.572 0.591 −0.21 2.8e−32 3.9e−30 gpt2 mia_zlib 4.557 4.568 −0.02 2.6e−26 0.168† gpt2-medium mia_zlib 4.311 4.371 −0.10 3.6e−75 4.5e−14 gpt2-large mia_zlib 4.211 4.280 −0.13 1.7e−62 2.8e−23 TinyLlama 1.1B mia_zlib 2.759 3.146 −1.00 <1e−300 <1e−300 Qwen2.5-3B mia_zlib 2.597 2.741 −0.25 1.9e−56 2.5e−42 Phi-2 mia_zlib 3.741 4.067 −0.53 5.0e−252 <1e−300 Qwen2.5-7B mia_zlib 2.615 2.741 −0.23 9.8e−44 6.0e−36 Across all 3 5 comb inations (excluding th e GPT -2 self -reference), all 34 KS tests ach ieve p < 0.001. Ho wever, four t- test compariso ns do not reach conventional significance at p < 0.05, marked with † in Table 3: Qwen2.5 -3 B on mia_min_k (p = 0.319), Qwen2.5 -7B on mia_ min_k (p = 0.1 37), Qwen 2.5 -7B on mia_min_k _pp (p = 0.60 3), and GPT-2 on mia_zlib ( p = 0.168). The co rrelation analysis (Figu re 2) reveals mia_loss and mia_zlib are highly c orrelated (r = 0.98) while mia_ ref provides independent in formation (r < 0 .15). The progression of MIA separation acro ss families of mod el r eveal a n umber of additional insights into the performance o f th e models on this task that are not dir ectly related to the ab ility o f th e mod el to detec t the p rompt. Specifically, the monotonic increase in MIA separation as we mov e through the GPT - 2 family (d = −0.19 at 124 M, d = −0.26 at 355M, d = −0.33 at 77 4M) is con sistent with the scalin g laws o f memorization discussed in Carlin i et al. [20]. They demonstrate that larger models memorize a proportional amount of training data. It is reasonable to expect that this would be true as larger models have greater capacity to s tore verbatim sequences and it is the low frequen cy, distinct info rmation contained in th e finan cial portions of the p rompt — su ch as specific dates, tickers and n umbers — that larger models will dispropo rtionately memorize. MemGuard-Alpha: D etecting and F iltering Memorizatio n -Contaminate d Signals in LLM-Based F inancial Forec asting via Members hip Inference and Cross-Model D isagreement 13 The dominance of TinyLlam a (d = -1.37 on mia_loss), even though it only has 1.1 billion parameters, as co mpared to the rest of the models, illustrates that the quality or recency of the training data for financial memorizatio n can be more important than the size of the m odel. TinyLlama's trainin g data (cutoff date was Septemb er 2023) represents a vast majority of our test period (or evaluation time frame) which means that 83 percent of t he prompts we used to test were in its training wind ow. On the other ha nd , the GPT-2 family (cu toff date was October 2 019) h ad only 14.5 percent of its train ing data included in o ur test set. These two factor s create a condition in wh ich the effects of memorization are most easily ob served. A p ractical implicatio n is th at new er mo dels (and there is no doubt but that these are th e ones that will b e deployed by practitioners) will be the same models that are mo st vulnerable to memorization -based look ahead b ias. Three out of the four t -tests were statistically in significant. All thr ee o f th ese in volved the Qwen model fam ily (specifically Qwe n2.5 -3B on mia_ min_k at p = .319, Qwen2 .5 -7B on mia_min_k at p = . 137, and Qwen2.5 -7 B on mia_min_k_p p at p = .603 ) when appli ed to Min-K% variants. The fourth was GPT-2 on mia_zlib (at p = .168), which likely reflects how the memory of the oldest model with the least am ount of data has reduced its ability to d etect the weak memor ization signal. This shows th at the way the Qwen architectu re's to kenization or attention works cou ld p otentially be creating different distributions o f probability m ass over the vo cabulary. T hese distributio ns can be less effectiv e at u sing the discriminative power of bottom p ercentiles of token prob abilities, b ut they are able to maintain their effectiv eness with loss based and reference -based MIA app roaches. Fig. 2. Correlation matrix across five MIA methods. Loss and Zlib are near -redundant (r = 0.98); Refere nce provides ind ependent information (r < 0.15 with all others). MemGuard Co mposite Score. MCS achieves Cohen’s d = 18.57, an o rder of magnitude b eyond the best individual method ( d = 1.68). Featu re weigh ts: temporal proximity (+62.19), mia_loss (−0 .42), mia_ zlib (+0. 22), mia_min_k_p p (+0.2 2), mia_min_k (−0.08) , mia_ref (−0.03). The do minance o f temp oral proximity r eflects the design where IS/OOS statu s is strongly cutoff -determ ined; when cu toffs are unknown (API m odels), MI A fea tures become primar y. An imp ortant note sh ould be made co ncerning the results of d = 18.57. Since the IS/OOS s tatus i s largely dependent upon th e established training cuto ff date, temporal distance alone is responsible for d = 17.8, which accounts for 96% of the composite difference. The MIA feature contributions account for the remaining 4%, with an estimated d = 0.39 – 1.37 for ea ch MIA method indep endently. The large composite d value is therefor e p rimarily due to the strength o f the temporal effect and not to the MIA meth odo logy. Howev er, the relativ e importance of the temporal MemGuard-Alpha: D etecting and F iltering Memorizatio n -Contaminate d Signals in LLM-Based F inancial Forec asting via Members hip Inference and Cross-Model D isagreement 14 and MIA eff ects reverse when consider ing the portfolio debiasing context. Temporal distance assigns the same contaminatio n scores to all m odels for the same date, while t he MIA features assign different contaminatio n scores to models at the same date — the v ery source of the within -date and across-m odel differences that CMMD explo its to create portfolio improvemen ts. Therefore, the MIA feat ures are relatively unimportant for detection b ut are crucial for creating the cross-model partitions th at are the basis for the CMMD’s portf olio enhancements. 5.2 Portfolio Per formance (RQ 2) Table 4. Portfolio performance (93 trading days, 15 bps costs). CMMD achieves highest Sharpe among LLM strategies. Strategy Total Return Ann. Return Ann. Volatilit y Sharpe Max Drawdown CMMD (Ours) 14.17% 43.20% 10.51% 4.11 −5.64% Raw Alpha 8.44% 24.56% 8.90% 2.76 −5.57% Debiased Alpha 3.15% 8.76% 5.68% 1.54 −4.55% EW Buy-Hold 37.17% 135.48% 24.18% 5.60 −10.47% Momentum- 20d −6.45% −16.54% 19.33% −0.86 −12.39% Random −0.37% −1.00% 4.30% −0.23 −3.01% CMMD achieves a 49% Sharpe improvement over Raw Alpha and 167% o ver Debiased Al pha. The signal -return decomposition reveals the mechanism: clean model signals produce 14.48 bps daily return versus 2.13 bps for tainted signals — a sevenfo ld difference. Simple th reshold- based deb iasing (Sharp e 1.54) underperforms Raw Alpha (2.76). Bootstrap test: Sharp e difference −1.11 (95% CI [−2.96, +0.42], p = 0.91). Threshold filtering indiscriminately removes high -contamination signals reg ardless o f d irectional corr ectness. CMMD avoids this b y usin g cro ss-mo del consen sus rath er than thresholds. For the primary comparison of CMMD versus Raw Alpha, we computed a paired bootstrap test (2,000 resamples) on daily return d ifferences. The mea n Sharp e d ifference is +1 .35 with a 95 % confidence inter val of [−0.28, +3.12] and p = 0.054. While this falls just outside conventional significance at the 5% level — ref lecting the limited statistical power o f 93 trad ing days — the on e-sided test (H1: CMMD Shar pe > Raw Alpha Sharpe) yields p = 0.0 27, and the complemen tary evidence from the signal -return decomposition (1 4.48 vs. 2 .13 bps for clean vs. tainted signals, computed across 4,650 s tock- date pairs with t = 4.82, p < 0.001) provides strong support for the underlying mechanism. We interpret these results as indicating that CMMD’ s imp rovemen t is economically meanin g fu l and mechanistically well -suppor ted, while acknowledging that defin itive statistical confirmation at the por tfolio level requires a longer evaluation period. The size of the CMMD performance should be p ut into perspective economically . The 14.48 bp s average daily return for clean model sign als ann ualizes to a gr oss retu rn of 36.5 percent. Th e net return after assuming 15 bps in round trip transaction co st is 43. 2 per cent. Quantitative factors typically yield lo wer returns. Non etheless, there are multiple qualif iers. First, the 93 day test period is short. The bootstrap confidence interval around the CMMD Sharp e Ratio is very large. Second, the time frame of the t est (par ts of 2019- 2024) were part of a very strong po st pand emic recovery as well as an AI d riven rally . This could be b eneficial to strategies that preserv e bullish signals. A strateg y such as CMMD preser ves bullish signals by r emoving m emorization -driv en noise while retaining true directional predictions. Third, the equ al-weight buy and h old benchmark h ad a sign ificantly larger Sh arpe ratio (5 .6). Therefore, much of the r eturn in this time period can be attributed to market beta rather than alpha generat ion . The outperforman ce of EW Buy- Hold o ver EW requires specific consid eration. CMMD is a long -only strategy- weighted by sign als, therefore it has a significan t amount of net -long ex posure to the market, and as such its retu rns are loaded on to market beta. Th er efore a m arket neu tral version wou ld requ ire us to go long in tho se stock s wh ere our clean m odels have a p ositive o utlook and go short in those stocks where our clea n models indicate a neg ative outlook. This would allow us to remove the impact of the mark et beta from the raw returns an d show the pure alpha contributed by th e model, however, th is would require a much greater level of complexity (short selling, margin MemGuard-Alpha: D etecting and F iltering Memorizatio n -Contaminate d Signals in LLM-Based F inancial Forec asting via Members hip Inference and Cross-Model D isagreement 15 requirements, borrowing costs etc. ) than this paper was able t o ad dress. As such , we want to emphasize t hat the correct basis fo r co mparing CMMD's debiasin g contr ibution is CMMD v s. Raw Alpha (as both strategies shar e the same degree of exposure to mark et b eta), rather th an CMMD vs. EW Buy -Ho ld (which is based on total return). On this like-for- like comparison, CMMD's Sharp e ratio o f 4.11 versus the Raw Alpha's Sharp e ratio of 2.76 represent a 49% risk adjusted in crease attributable to co ntaminant filtering and n et of all trading costs. A key finding from this analysis is the significant under -perfo rmance of th e simple Debiased Alpha strategy (Sharpe 1.54) as comp ared to the unfiltered Raw Alp ha strateg y (Sharpe 2.76) . The results of the bootstrap test indicate a Sharp e differen ce of -1.11 with a 9 5% confiden ce interval of [ -2.96,+0.42 ], and an associated p-v alue of .91. Therefore, we fail to r eject the nu ll -hypothesis that simple d ebiasing do es not imp rove upon unfiltered alpha. The failure to reject the null hypothesis is not due to MCS faili ng to detect contaminated signals; it was able to detect signals perf ectly in both training and out - of -sample periods. Rather, it indicates th at detecting contam ination and effectively integrating the resultin g sign als into a portfolio req uire fu ndame ntally diff erent typ es of algorithms. In particular, the contamination scores were ab le to identify whether or n ot each individual sign al was p rimarily driven by memory, but simp ly applying a naiv e threshold resulted in destroying the p ortfolio's signal - to -no ise ratio since high-contam ination signals can h ave a positive direction an d therefore would be indiscriminately removed . Fig. 3. Cumulative portfolio returns (2019 – 2024, 15 bps transaction costs). CMMD (orange) consistently outperforms Raw Alpha (red) from mid-2023 onward. Debiased Alpha (green) over-filters and underperforms. MemGuard-Alpha: D etecting and F iltering Memorizatio n -Contaminate d Signals in LLM-Based F inancial Forec asting via Members hip Inference and Cross-Model D isagreement 16 Fig. 4. CMMD signal d ecomposition. Left: signal distributions for clean v s. tainted mod el groups. Right: memorization disagreement distribution showing 411 cases of directional conflict ac ross 4,650 stock -date pairs. 5.3 Signal Accurac y vs. Contamination (RQ1/RQ2) Figure 5 sho ws perhaps th e greatest divergen ce of signal accurac y b etween IS and OOS data as contamination levels increase. In sample, signal accuracy inc reased steadily with each level of contamination (40.8% at Q1 to 52.5% at Q5). Out of samp le, signal a ccuracy decreased fo r each level of contamination (47% at Q2 to 42% at Q5), thus establishing a clear and visually obvious cr oss- over point at Q3 providing a basis to establish th e use of MIA contaminatio n scores to clearly distinguish b etween signals whic h ar e due to memorization v s. those that are no t. The cro ssover in the pattern in Figu re 5 can b e interpr eted with resp ect to the bias -v ariance tradeoff as it is described in statistical lear ning th eory. Outside their training window, in the lo w contamination regimes (Q1 – Q2), signals are produced by the models' learn ed financial reasoning. Th e mod el's predictio ns ther efore contain less bias (memorized ou tcomes do n ot p roduce distorted predictions) but contain greater var iance (the model will generate actual predictions based on its own reasoning for the unce rtain future outcome). Within their training windows, in the high contamination regimes (Q4 – Q5), signals are created by th e models. The mod els predict outcomes which are a combination of memorized outcomes and the model's learned financial reasoning. Since the memorized outcomes are correct, the bias created by memorizing the outco mes of past events cannot be observed through in -sam ple ev aluations. However, since the models are not generatin g new predictions but instead, they are using their memorized knowledge of past even ts, they are creating an overconfiden ce that will cause their per formance to degrade when evaluated against their ability to make accurate predictio ns. The cr ossover shown above has important implications for back testing by practitioners using LLMs to generate trading strategies. If a resear cher were to assess the perfor mance o f LLM -generated f orecasts of fu ture retu rns from past d ata, she wo uld see the blue (in -sample) curve and conclud e that the LL M's accuracy incr eases as it becomes familiar with the d ata. She would be entirely correct in her assessment; h owever, she would be profoundly mistaken : the apparent increase in accuracy is due to overfitting/ memorization of the training data, which r everses when deployed. The red (out- of -sample) curve illustrates the true relationship between fam iliarity with historical d ata and accuracy in forecasting future returns. The o ut - of -samp le curve shows that too much familiarity with the past (i.e., the contaminatio n quintile at which the crossover occurs — app roximately Q3 in our data) harms th e quality of the LLM's forecasts. T he CMMD meth od elim inates the need to sp ecify a th reshold to deter mine h ow contam inated the sample is because it is designed to be threshold free. MemGuard-Alpha: D etecting and F iltering Memorizatio n -Contaminate d Signals in LLM-Based F inancial Forec asting via Members hip Inference and Cross-Model D isagreement 17 Fig. 5. Signal accuracy v s. contamination quintile. The crossover between IS (blue) and OOS (red) curves demon strates that memorization inflates apparent accuracy at the cost of generalizatio n. 5.4 Scale and Temp oral Effects (RQ 3) Within the GPT-2 family (same cutoff, different sizes), sep aration incr eases with parameters: d = −0. 19 (124M), −0.26 (355M), −0.33 ( 774M), confirming that larger models memorize more [ 20]. Across families, TinyLlama (1.1B, Sep 2023) shows stronger separation ( d = −1.37) than GPT -2 Large (774M, Oct 2019) despite being only 1.4x larger, demonstrating that training data recency dominates mod el size. Qwen 3B and 7B (same cutoff) show n early identical d = −0.39 and −0.37, suggesting a satu ration effect. MemGuard-Alpha: D etecting and F iltering Memorizatio n -Contaminate d Signals in LLM-Based F inancial Forec asting via Members hip Inference and Cross-Model D isagreement 18 Fig. 6. Per-model MIA separation using the lo ss method. Models with recent training cutoffs (TinyLlama, P hi -2) show stronger IS/OOS divergence than older models (GPT-2 family). Fig. 7. MIA contamination scores by model (left) and prompt type (right), sp lit by IS/OOS status. Price recall prompts show the strongest separation. 5.5 Per-Model Signa l Analysis Model-specif ic disaggregation of results demon strates a strong and consistent tren d that identifies how memorization affects pr edictive performan ce. When lo oking at mo del's with rec ent cut -off s for in -training d ata (TinyLlama = 51.1%, Qwen 3B = 51. 5%, Phi -2 = 47 .6%), their pred ictive performan ce on in -training data (IS) was significantly greater than on non - in - training data (OOS): (TinyL lama = 27.2%, gap : 23 .9 pp .), (Qwen 3B = 1 6.0%, gap: 35.5 pp.), (Phi-2 = 26.9%, gap: 20.7 pp.). The fact that t hese models ' predictive ability has an in-trainin g/non- in - training gap of 20 -35 percentage points sup ports th e con clusion that the models' predictive ability is artificially increased du e to memorization. The GPT-2 family shows the inverse of th is tr end. GPT-2 mo dels show an IS accuracy that is 10 percentage po ints lower than OOS accuracy; for example I S accuracy (37 – 39%) is consistently lower than OOS accuracy (45 – 46%). This inversion occurs because the GPT- 2 models hav e only 14.5% IS co verage (cutoff date: Octob er 2019). As su ch, the IS set includes early 2019 predictio ns during a tim e of h igh market volatility after the Decem ber 2018 selloff. Therefore, the lower IS acc uracy is d ue to the difficulty o f m aking predictions abou t markets and not a result of the model's inability to learn from experience. I n contrast, the higher OOS accu racy is due to the fact that 2020 -2024 were periods with relatively lo w volatility and a gen erally bu llish market environ ment. These trend s provide further evidence of the need to view differences in IS- OOS accuracy relative t o different market environments, as opposed to viewing them simply as evidence that the model has learned by rote. Qwen 7B is an inter esting case. It has the highest model size b ut produ ces a skewed bear ish signal distribution (13.6% bullish; 37.5% bearish; 48.9% neutral), and it is the only model that produces negative mean daily returns both in -sample (-17.91 bps) and out- of -sample (-5.70 bps). In contrast to all the other models, the bearish signals produced by Qwen 7B are contrarian. This behavior could be due to how Qwen was instructed. Qwen 's cautio nary behavior provides CMMD with additional profit when Qwen is classified as a tainted model. When Qwen is removed from the evaluation set b ecause it is producin g a bearish signal, the remaining clean models ten d to produce bullish signals. The analysis of the d istribution of sign als has shown a great deal of diversity in the results from all m odels. TinyLlama is the most aggressive b ull (87.6% Bullish, 1.8% Neutral) as oppo sed to the most balan ced being GPT - 2 Base (48.1% Bullish, 36 .4% Neutr al). The div ersity created by th e d istribution o f th e signals is helpful to CMMD MemGuard-Alpha: D etecting and F iltering Memorizatio n -Contaminate d Signals in LLM-Based F inancial Forec asting via Members hip Inference and Cross-Model D isagreement 19 since the clean g roup and th e tainted group will produ ce signals which are significantly differen t. Of the total 4,650 stock-date pairs examined, 1,863 (40.1%) had a direction al disagreem ent b etween the clean and tainted groups of models greater than 0.5, therefore supporting the fact that the partitioning of CMMD resulted in meaning ful differences in signals and not simply random noise. The cro ss-stocks resu lts showed that the retu rns gener ated b y CMMD were NOT unifo rmly d istributed. T he highest performing stocks under CMMD were TESLA (TSLA +6 2.19 bps/day), QUALCOMM (QCOM +3 1.35 bps/day), HOME DEPOT (HD +30 .38 bps/day), BANK OF AMERICA (B AC +29.2 4 bps/day) , TEXAS INSTRUMENTS (TXN +28.41 bps/day) ; whereas NIK (NKE -19.81 bps/day), INTEL (INTC -2.32 bps/day), MERCK & CO (MRK +1.45 bps/day) were the lowest. The higher stock volatility and higher news coverage (TSLA, QCOM) outperfo rming stocks f it well within the Memorization Hypothesis because th ese stock s have more d ata for the mod el to train on; th erefore, a stro nger sign al is sent to the model to pick the best filters. On th e other hand, the stocks which did not perform idiosyncratically po orly d emonstrate limitations of CMMD in crea ting alpha when the underlying m arket conditions are poor. 5.6 Strategy Correl ation Analysis The return correlations among the various strategies provide f urther insights to understand t he mechanism behind CMMD. The high co rrelation between CMMD and Raw Al pha (0.984) confirms that CMMD retain s the underly ing signal structure of Raw Alpha as opp osed to creating a completely new strategy. The hig h correlation values fo r both LLM based strateg ies (0.944 & 0.967) to EW Buy -Hold indicate that there is significant Beta exposur e to the Market by these LLM b ased strategies due to the predominantly bullish nature of the g enerated signal distributions. The negative correlation s (−0.54 & −0.59) f or all LLM strategies to Mo mentum - 20D suggest that LLM based strategies generate signals f rom differ ent sources of informatio n than simple p rice mo mentum. The Rand om s trategy has weak positive correlation s (0.34 & 0.48 ) which could be indicative of the general up ward trend in the market during the evaluation tim e frame. The larg e corr elation between CMMD and Raw Alpha ( 0.984), h owever, b rings up a very good question ; If CMMD is so close to Raw Alpha as it is, why is CMMD able to achieve a 49% Sharpe improvem ent? The answer to this is that the Sharpe improvement ach ieved by CMMD is co nditional. CMMD and Raw Alph a will produce exactly the same signal o n approx imately 60 % of stock -date pairs wh ere the clean model and the tain ted model both agree. Conversely, on the remaining approximately 40% of the stock- date pairs where the clean model and the tainted model disagree, CMMD's clean signal is significantly more accurate than the full ensemble average signal produced b y Raw Alpha. As such, the bulk of the Sharpe improvem ent is prod uced b y CMMD in these instances of disagree ment between the two m odels, where the clean-m odel co nsensus pro duces 14 .48 bps/day compared to the tainted -model mean o f 2.13 bps/day. The compou nd effect of this conditional improvem ent at the individu al -stock level tr anslates to the Sharp e ratio improvement observed at th e portfolio level. 5.7 Threshold Robustn ess (RQ4) Figure 8 reveals th at simple percen tile-b ased deb iasing is fundam entally fragile. At aggr essive thresho lds (P10 – P25), all signals are filtered (z ero Sharpe). At permissive thresholds (P75 – P95), nothing is filtered (converges to Raw Alpha). No single th resh old consistently improv es u pon the un filtered baseline. This motivates CMMD’s thresho ld - free design. 5.8 Ablation Stud y: MCS Componen t Contributions To assess the relative contributions of the MCS components, we conducted an ablatio n study comparing f our MCS var iants: (i) the full six-feature MCS (five MIA method s plu s temporal proximity), ( ii) MIA -only MCS (f ive MIA features, no temp oral prox imity), ( iii) temporal -only MCS (tem poral proximity feature alone), and (iv) single best MIA method (mia_loss, selected as the method with highest average Coh en’s d across models). The full MCS achieves Coh en’s d = 1 8.57, driven predo minantly by th e tem poral proxim ity feature which receives a weigh t of +62.19. The temp oral-only variant ach ieves d = 17.8, capturing 9 6% of the f ull MCS separation. The MIA -only var iant MemGuard-Alpha: D etecting and F iltering Memorizatio n -Contaminate d Signals in LLM-Based F inancial Forec asting via Members hip Inference and Cross-Model D isagreement 20 achieves d = 0.39 – 1.37 dep ending on th e model, with T inyLlama showing the strong est MIA -only separation . The single best metho d (mia_loss) achieves d = 0.19 – 1.37. The ablation r esults show an important distinction of how the detec tion and debiasing tasks r ely on the characteristics of the data. Detection (the ability to tell whether a sample is In -Samp le o r Out- Of -Sam ple) relies primarily on temporal p roximity becau se it is the date of the sample's creation that d etermines whether the samp le is In -Sample or Out- of -Sample. Debiasing (the imp rovement of por tfolio returns throu gh the use of MIA f eatures) provides additional value over the use of temporal proximity as MI A features capture the level of memorization intensity that occurs within p eriods o f time wh ere the proximity d oes not. The two prompts for the same stock with the same date will have the same temp oral proximity score but may have diff erent MI A scor es if t h e p rompts wer e produced by differen t mo dels. T his reflects a true difference in the level of memorization that occurred when processing the prompt. A stud y o f a larger ab lation analyzes h ow many models CMMD uses f or an ensemble. With all seven m odels used together CMMD's Sharpe ratio is 4.11. When one of the seven models are removed and the n CMMD was run on the remain ing 6 -model ensemble the resulting Shar pe ratios rang ed from 3.72 (Ph i-2 excluded) to 4.28 (Qwen 7B excluded). This shows that CMMD has a moderate level of sensitivity to the mix of models. Ex cluding Qwen 7B showed a better performan ce than expected by its b earish bias an d negative returns seen in Section 5.5. Using fewer than 5 models in the ensemble in creased the v ariance; however, the Sharpe ratio was g reater than 3.0 when using the fewest numb er of models tested . These findings support that CMMD can b e consider ed rob ust in reg ards to mo d el choice as lon g as there are at least 5 mod els in the ensemble and at least 2 different cu t -off time perio ds.. Fig. 8. Threshold sensitivity analysis. Left: Debiased Sharpe at various contamination percentile thresholds (red dashed = Raw Alpha baseline). Right: Bootstrap 95% confidence intervals on Sharpe difference. No single th reshold consistently beats Raw Alpha. 6. Discussion 6.1 The Case for Det ection Over Preven tion Our results contrib ute to a growing and consequen tial debate about ho w to handle memor ization in financial LLMs. Three co mpeting paradigms hav e emerged, each with distinct trad e -off s. Prevention t hrough tem poral retraining ( ChronoBERT [9], PiT- Inference [6]) p roduces clean m odels but at prohibitive cost. Train ing a single fro ntier -quality LLM requires millions of d ollars and mo nths of compute. Moreover, the p roliferation o f LLM r eleases means that any temporally retrained mo del q uickly b ecomes ou tdated as n ewer, more capable base models are released. Practitioners face a c hoice between temporal cleanliness and model quality — a trade-o ff that CMMD eliminates by operating post -hoc on any available mod el. MemGuard-Alpha: D etecting and F iltering Memorizatio n -Contaminate d Signals in LLM-Based F inancial Forec asting via Members hip Inference and Cross-Model D isagreement 21 Prevention throug h anonymiza tion (entity-neutering [10], BlindTrad e [11]) is com putationally cheap but empirically costly. Wu et al. [12] demonstrated that an onymization can destroy more signal than it removes bias, particularly when n umerical data (prices, volumes, ratio s) and entity rel atio nships (sector peers, supply chain connection s) ar e strip ped from the input. Our CMMD approach preser ves all information conten t: the full financial context, including entity names, prices, and dates, flows through to t he LLM. The debiasing occurs at the signal level, not the input lev el. Detection and filte ring (our method) views mem orization as a natural part of LLMs tr ained from large amounts of internet data, an d contro ls for memorization at the level of signals to detect memorization . A fund amental difference between our m ethod and others is that memorizatio n is not always bad; e.g., a model that has learned how in terest rates affect the stock price of banks can generate good analyses in spite of having memorized the prices of all o f those banks. CMMD identifies such cases by comparin g p redictions made by mod els with different memorization properties, thus allowing useful analy tical capability while filtering out con taminated directional signals. The practical benefits of detection ar e sub stantial becau se they r equire no ch anges to be made to the mod els, n o r e training of the models, no additional model pairs, and do not result in any loss of information. 6.2 Why Simple Deb iasing Fails Three methods s how why debiasing alpha using threshold based filters (Raw Sharpe: 2.76; Debias Filtered: 1.54) is inferior to unfiltered raw alpha. These results appear to directly conf lict with the underlying hypoth esis that removing mem orized data should lead to an increase in accuracy. First, mem orization is hetero geneous acro ss stocks. The f irst method shows h ow heter ogeneity exists within each stock's m emorization. Wh ile the m odel h as memorized a great deal o f AAPL related content, the signal for AAPL will likely contain much contamination from th is information. Therefore, while the sig nal f or ACN may be v ery low (i.e., high MIA), the rea son may be un related to the model's memo rization of financial data. Allowin g the same filter to remove the sig nal for AAPL does n ot treat these two cas es similarly . Second, som e m emorized signals are directionally correct by co incidence. Th e secon d meth od d emonstrates how som e of the memorized signals are directionally correct merely by ch ance. For example, a model may have memorized that NVDA r ose in 202 1. If the model is asked to forecast NVDA's direction on a given date in 2021 and produces a "bullish" forecast, then even thoug h this forecast is contaminated , it is still direc tionally co rrect. Thus, if one were to eliminate this f orecast (as is done when apply ing a filter) , one would also be eliminating a potentially profitable trad e. CMMD addresses this prob lem by allowing the m odel to produce a weigh ted estimate of the true value of the forecast, rather than simply eliminating it. Third, aggressive filtering reduces effective diversification. Finally, the th ird method describes ho w extreme filtering can cause the portfolio to become concentrated in fewer positions. As such, the portfolio is exposed to greater levels of idiosyncratic noise at the level of individual stock s. CMMD eliminates this issue by ensuring that the mod el produces a signal for each stock -date pair. 6.3 Interpreting MCS Feature Weights The clo ser in time a sample was tak en, th e larger the likelihood of it being classified as an MCS feature (+62.19 vs. +0.22 to -0.42 for all other featur es) -- which can be explained by how the data was collected . For dep loyments using API models (such as GP T-4 or Claude) and where we canno t determine the optim al cutoff point (i.e., no temporal metadata), the use of MI A will be o ur primary method. Even when using on ly MIA we see that the methods are providing contam ination signal values of d = 0 .39 -1.37. 6.4 Connection to Hallucination Dete ction Financial Memorizatio n Detection has similarities to Hallucination Detectio n. Both detection methods have one thing in co mmon: they attem pt to distinguish betwe en memor ized (or "hallucin ated") model responses an d responses that are gen erated as a result of reasoning. Recen t research using pre -commitm ent encoding [26] demon strated that MemGuard-Alpha: D etecting and F iltering Memorizatio n -Contaminate d Signals in LLM-Based F inancial Forec asting via Members hip Inference and Cross-Model D isagreement 22 early lay er activ ation values predict wh en a model will hallucinate prior to the start of generation. The implication is that the mo del encodes a "decide to hallucin ate" within its internal representation p rior to generating the first output token. Similarly, MemGuard-Alpha utilizes token prob ability analysis to detect non -genuine model activity and relies on statistical attribu tes of th e outp ut distribution o f the model. Finally, our recent work on cross -dom ain VAE interpretability [27] provided evidence t hat mechanical interpretations can be transferred across different data domains, which could potentially allow for the development of a common fr amewor k for detecting all types of model misbehavior (memorization, hallucination , etc.) using a sing le mechani stic view. There are many ways we can extend this work on detecting memorization and interpreting ho w models function. First, by performing SAE an alysis of f inancial LLMs, we co uld d etermine if m emorized financial in formation is stored within specific lay ers o r throu ghout the network. If memorization occurs within distinct layers of a network , then removing those specific lay ers v ia ablation of features could p rovide an alternativ e method fo r identifying which features of a mo del's input contribute to its ability to m emorize. Second, researchers have p roposed using causal circuit tracing to d emonstrate th e specific pathways through a neural n etwork that are activated when a model uses memorized f inancial data versus when a model is performing analytical r easoning. Th is type of analysis wo uld provide add itional suppo rt for the black - box MIA approach we described in this paper, while also providin g some white -box, mechanistic insight into how the model processes financial inform ation. Third, recen t studies on hallucination detection [26], demonstrated th at it was possible to identify if a mo del would produce hallu cinations based upon early layer activations prio r to p roducing any outpu t tokens. We believe similar techniq ues could be use d to identify when a model is pr edicting based upo n m emorized finan cial data, potentially allo wing for memorization filterin g during inference time, instead of after the fact, at a signal lev el. 6.5 Practical Deplo yment Guidelines Based upo n the results from our exp eriment, the following are sugg ested by us to be implemented by those who will deploy LLM-generated signals into live tra ding systems. First, implement multiple models trained using differing cutoff points — minimu m o f thre e models are required with each model h aving at least two cutoff time periods. Second, calculate an MIA sco re for every signal gen erated as a stan dard procedure. Th e method that will pro duce th e MIA scores with the least computational expen se, one forward pass throug h the network and does not r equire a reference model, is the Min-K% method. Third, utilize CMMD instead of threshold filterin g. Fou rth, monitor the pattern depicted in figure five as a d iagnostic to identify when accuracy and contam ination cro ss over s o ccur. Fifth, be especially cautiou s when utilizing LLM -generated signals for large cap stock s that are heavily covered by analysts as these are comm only r epresented within trainin g data. Sixth, update th e contam ination profile whenev er a model is up dated. 6.6 Computationa l Cost and Scalabi lity A practical deployment consideration is the co mputational overhead of the Mem Guard -Alph a pipeline. The pipeline consists o f three stages with distinct cost profiles. Stage 1 (MIA scoring) requires one forward pass per model per promp t fo r loss- based metrics, plus o ne additional forward pass usin g the refer ence mo del. In our experiments, scoring 299,600 promp t-model pairs across seven mod els req uired approximately 4.5 hours on a single RTX 5090 GPU, translating to roughly 5 4 microseconds per prompt- model pair. For comparison , alp ha signal generation (which requires autoregressive decoding of up to 80 tok ens) required ap proximately 6 hours for 41,300 prompt -model pairs, or approximately 523 micro seconds per pair — rough ly 10x the cost of MIA scorin g. The MIA ov e rhead is therefor e approximately 15% of the generation co st. Stage 2 (MCS computation) is n egligible: logistic regression inference on a six -feature vecto r requires su b- microsecond comp utation p er signal. Stage 3 (CMMD p artitioning ) in volves o nly a median compu tation an d gro up averaging over K = 7 values per stock-d ate pair, also negligible. The total pipeline overhead is domin ated by Stage 1, making f ull MemGuard -Alpha d eployment approximately 1.15x the cost of unfiltered alpha generation. This overhead MemGuard-Alpha: D etecting and F iltering Memorizatio n -Contaminate d Signals in LLM-Based F inancial Forec asting via Members hip Inference and Cross-Model D isagreement 23 scales linearly with the number of models and prompts, and can be parallelized across GPUs since each model’s MIA scoring is indep endent. Scalability to pr oduction settings requires consideration of three d imensions. First, m odel count: CMMD requires a minimum of three models with at least two d istinct cutof f periods; add ing more models impro ves partitioning granularity but increases MIA scor ing cost linear ly. In p ractice, five to ten models pro vide a good balance. Second, stock universe: expanding from 50 to 500 stocks increases cost linearly bu t ben efits f rom GPU parallelism. Third, frequency: our daily rebalancing generates ~5,900 prompts per model per cycle. MIA scores exhibit temporal persistence —a stock ’s contaminatio n profile chan ges slowly relative to mo del updates — so sco res can be ca ched and refreshed wee kly or monthly rather than reco mputed daily, substantially reducing amortized cos t. For dep loyment with closed -source API models (GPT-4 , Claude, Gemini), the pip eline adapts as follows. Per - token log-prob abilities are not available from most API provid ers, preclu ding Min -K%, Min- K%++, an d reference model methods. However, lo ss-based s corin g can be approximated v ia the lo g-prob ability of the comp letion (available from some APIs), an d zlib ratio can be computed fro m the prompt text alone. An API -compatib le MCS variant using only loss and zlib features achieves reduced b ut still meaningful se paratio n (estimated Cohen’s d = 0.2 – 0.5 b ased on our two- feature ablation). Alternatively , the temporal prox imity feature alone provid es strong separation when cutoff dates are approximately known, as is the case for most major API providers who publish tr aining data recency in thei r documentation. 6.7 Limitations Several limitation s qualify our find ings. First, 93 trad ing days prov ide limited portfolio -level statistical power; with an observed Sharpe difference of ~1.35 an d daily return standard deviation of ~1%, a post -hoc power analysis suggests approx imately 250 trading days would be needed fo r 80% power at α = 0.05. Second, the mod el lineup reaches 7B par ameters; fron tier models (70B+) m ay exhibit different m emorization patterns. Third, alpha signals u se structured prompting rather than fine-tuned models. Fourth , MCS is trained on the evaluation data, raising a potential overfitting concern. However, this concern is substantially mitigated by two factor s: ( a) the tempor al proximity feature, which accounts for 96% o f MCS separation, is computed via a deterministic f ormula (τ(t, c_k) = min(max((c_k − t)/182 5, −1), 1 )) that requires no f itting, and (b) CMMD’s median - split partitionin g is a non parametric op eration that does not depend on the absolute calibration of MCS s cores, only their relative ordering across model s for a given stock-date pair . A temporal validation — fitting MCS weights on 2019 – 2021 data and evaluating CMMD on 2022 – 2024 — would provide stronger evidence, bu t the limited IS pro mpt coverage for GPT -2 models in the second half makes this split unbalance d. Futur e work will address this through k -fold cr oss-validation and walk -forward testing. Fifth, the pr edominantly bullish evalu ation period (2019 – 2 024) may favor strateg ies that preserve bullish signals. 7. Threats to Validity 7.1 Internal Valid ity Training cutoff dates provid ed b y model cards are typically an approximation. Noneth eless, a hig h degree of similarity in MIA separation patterns among s even different models utilizing three different cutoff dates lends strength to the argumen t that slight differen ces in training cutoff dates will hav e little effect on overall results. Additionally , it is possible that the single reference mod el (GPT -2 b ase) used as th e basis for comparison for the reference MIA method could result in biased comparisons, du e to the possibility that GPT-2 's famili arity with certain types of financial text c orrelates with how well th e target models can memorize those same types of text. 7.2 External Val idity Results cov er 50 large -cap US eq uities. Large -caps appear disprop ortionately in training d ata, so memorizatio n effects may be stronger here than for small-cap, international, o r alternative assets. The Financial PhraseBank consists of pre-2016 European fin ancial news, which may differ in linguistic character istics from US financial text. MemGuard-Alpha: D etecting and F iltering Memorizatio n -Contaminate d Signals in LLM-Based F inancial Forec asting via Members hip Inference and Cross-Model D isagreement 24 7.3 Construct Val idity We d efine memor ization as the d ifference in the MIA scores for temp orally In -Sample (IS) and Out- Of -Sample (OOS) pr ompts. Some of the text in the IS conditions were not even in th e training set. It is p ossible that som e of the OOS patterns are similar to t hose found in the training set. However , since we saw a very large separation (34 of 35 combination s had p < 0.01), it ap pears this is a goo d proxy. However, since there can be no guarantees of no misclassifications nea r the bound ary 7.4 Statistical Conc lusion Validity Large sample sizes in MI A are ideal for separation analysis (e.g., 6,200 – 39 ,500 IS p rompts used for each model). Due to the low precision of portfo lio r eturns over a relatively short horizon (93 days), we ex pect that our reported results may be influ enced by some d egree of error . In addition, because of th e relatively short time fram e of our evaluation, the reported CMMD Sharp e Ratio (4.11) may also be an over ly optimistic estimate. A longer investment horizon will produce a m uch mo re r eliable measur e. To b etter und erstand these uncertainties, we use bootstrap ped confiden ce intervals wherever possible. An additional consideration is that if there are stro ng positive serial correlations in the daily returns of a portfolio then the annualized Sharpe Ratio will likely overestimate the risk adjusted performance of the strateg y compar ed to portfolios whose returns have no day to day relationsh ips; conver sely, if the daily returns are negatively correlated (i.e., they revert back to their mean) then th e an nualized Sharpe will underestimate the perfo rmance. The authors calculate the first order autocorrelation o f the daily returns on the CMMD Strategy and report that the autocorrelation coefficient was 0.08. The autho rs suggest that this indicates that wh ile the CMMD Strategy has positive serial correlation the degree of serial correlation is quite low. The use of Yahoo Finance for price information also provides the opportunity for potential survivorship bias. The fifty S&P 100 constituen ts used in this study were chosen b ased on current member ship. Therefore, the comp anies which wer e part of the ind ex a t some time p reviously but have since been deleted (for example due to a merg er or acquisition, o r if their market capitalization had decreased to the extent that they could no longer be included) ar e excluded from th e analysis. In gen eral, surv ivorship bi as inflates b acktest r eturns as the firms that survive are, on average, more successful than those that are rem oved from the index . While there will like ly alway s be some d egree of su rvivorship bias associated with any backtested strategy, it will affect eac h of the six strategies we examine equally. It therefore will n ot provide an adv antage to CMMD over the baseline strategies. 8. Conclusion We dev eloped MemGuar d-Alpha as an an alytical framework for detection and filtering of sign als that are contaminated by memorization in LLM g enerated forecasts of financial data. The two algorithms MCS and CMMD together improved the Sharpe Ratio of unfilter ed signals by 49%. MCS provides a single contaminatio n mea sure for all types of contaminants (d=18.57). CMMD is ab le to filter out mem orized information fr om reasoning using cross model disagreements; and produces daily returns on clean signal (i.e. n o con tam ination) that are approximately seven times greater than those produced from tain ted signals. Four em pirical results suppo rt o ur conclusion s; (i) MIA consistently id entifies finan cial memorization across a variety of models ( RQ1); (ii) CMMD perfo rms better than unfiltered and threshold -debiased sign als (RQ2); (iii) memorization varies in terms of t he scale and recency of data (RQ3) ; (iv) simple thresholding is h ighly unstable and therefore motiv ated b y CMMD (RQ4). The signal accuracy cro ssover ( Figure 5) serves as clear evid ence that memorization increases the perceived quality of a model at the ex p ense of its ability to generalize. Future work will expand upon CMMD by enab ling direct access through an API to larger language models (e.g., 70B+), validate th is mod el on longer time horizons and o ther assets, evaluate how it relates to mechanistic interpretability in order to understand wh at is happen ing internally with regards to m emorization within th e model, and create onlin e adaptive versions for use in live trading enviro nments. MemGuard-Alpha: D etecting and F iltering Memorizatio n -Contaminate d Signals in LLM-Based F inancial Forec asting via Members hip Inference and Cross-Model D isagreement 25 Several potential av enues for future research arise out of the results we've presented. The fir st is to extend CMMD to fro ntier mod els (70B+ parameters) using API -access; this will determine if th e memo rization patter ns ob served in open-weigh t models can b e generalize d to the larg est and most capable systems presen tly being used in production . Frontier mod els pose the ad ditional problem of limited observability, since they d o not provide p er -token log-pro bs; thus, one would hav e to adapt the MCS fram ework t o work with limited observability. Seco nd, establishing the generalizability of CMMD over time ( i.e., 2 – 5 y ear spans of d aily data) and across other asset classes (e.g ., fix ed income, commodities, foreig n exchange, cryptocurrencies) wou ld provide ad ditiona l support for the use of CMMD beyond U.S. large cap e quity. Third, identifying the mechanisms underlying memorization in financial LLMs through sparse autoen coder analysis and causal circuit tracin g could help deter mine whether financial facts are represen ted in distinct features or are distributed throughout the network. This could allow for more focused remediation approaches than signal-level filtering . Fourth, developing an online adaptive version of CMMD that allows fo r updating the estimated degree of contamination as n ew data comes in could facilitate deployment of CMMD in live trading environments where the IS/OOS bo undary changes daily. A n online adaptive s ystem would need to b e able to ac count for the fact that new data is gradu ally incorpor ated in to the LLM's training corpu s through web scraping and model updates, resulting in a changing c ontamin ation landscape. Fifth, examining the relationship between detecting memorization and regu latory com pliance could help to address increasing concerns of fi nancial regulators regarding the auditability of AI-based trading dec isions. The contamination- scoring framework of MemGuard-Alp ha could form part of an AI audit trail for financial regulators, allowing them to q uantify the proportion of trading decisions based on memorized vs. reasoned decision -making. References [1] A. Lopez-Lira and Y. Tang, "Can ChatGPT forecast stock price m ovements? Return predictability and large language models," J. Finance, 2023. [2] A. G. Kim, M. Muhn, and V. V. Nikolaev, "Financial statement a nalysis with large language models," Chicago Booth Research Paper, 2024. [3] M. Jha, J. Qian, M. Weber, and B. Yang, "ChatG PT and corporate policies," NBER Working Paper 32161, 2024. [4] Y. Kong, H. Lee, Y. Hwang, A. Lopez-Lira, B. Levy, D. Mehta, Q. Wen, C. Choi, Y. Lee, and S. Zohren, "Evaluatin g LLMs in finance requires explicit bias consideration," arXiv:2602.142 33, Feb. 2026. [5] A. Lopez- Lira, Y. Tang, and M. Zhu, "The memorization proble m: Can we trust LLMs’ economic forecasts?" arXiv:2504.14765, Apr. 2025. [6] M. Benhenda, "Look-Ahead-Bench: A standardized benchmark of look-ahead bias in point- in -time LLMs for finance," arXiv:2601.13770, Jan. 2026. [7] Y. Chen et al., "Can LLM-based financial investing strategies outperform the market in the long run?" in Proc. KDD, 2026. [8] F. Drinkall, E. Rahimikia, J. B. Pierrehumbert, and S. Zohren, "Tim e Machine GPT," in Proc. NAACL Findings, pp. 3281 – 3292, 2024. [9] S. He, L. Lv, A. Manela, and J. Wu, "Chronologically consistent large la nguage models," arXiv:2502.21206, 2025. [10] J. Engelberg et al., "Entity neutering: Removing identifying information for LLM bias mitigati on," 2025. [11] J. Jeon and H. Lee, "Can blindfolded LLMs still trade? An ano nymization -first framework," arXiv:2603.17692, Mar. 2026. [12] K. Wu, B. Yang, Z. Ying, and D. Zhou, "Anonymizati on and information loss," arXiv:2511.15364, Nov. 2025. [13] H. Merchant and B. Levy, "A fast and effective solution to th e problem of look NeurIPS 2025 Workshop. [14] Z. Gao, W. Jiang, and Y. Yan, "A test of lookahead bias in LLM foreca sts," arXiv:2512.23847, Dec. 2025. [15] P. Glasserman and C. Lin, "Assessing look-ahead bias in stock return predictions generated by G PT sentiment analy sis," arXiv:2309.17322, 2023. [16] B. Levy, "Caution ahead: Numerical rea soning and look-ahead bias in AI models," SSRN, 2025. [17] L. D. Crane, A. Karra, and P. E. Soto, "Total recall? Evaluating the macroeconomic k nowledge of large language models," Finance and Economics Discussion Series 2025-044, Board of Governors of the Federal Reserve System, 2025. [18] J. Lee et al., "Your AI, not your view: The bias of LLMs in investm ent analysis," arXiv:2507.20957, 2025. [19] L. Cao et al., "Foreign bias in LLM financial forecasts," 2025. MemGuard-Alpha: D etecting and F iltering Memorizatio n -Contaminate d Signals in LLM-Based F inancial Forec asting via Members hip Inference and Cross-Model D isagreement 26 [20] N. Carlini, D. Ippolito, M. Jagielski, K. Lee, F. Tramer, and C. Zhang, "Quantifying memorization across neural language models," in Proc. ICML, 2022. [21] N. Carlini, S. Chien, M. Nasr, S. Song, A. Terzis, and F. Trame r, "Membership inference attacks from first principles," in Proc. IEEE S&P, 2022. [22] J. Shi, A. Ajith, M. Xia, Y. Huang, D. Liu, T. Blevins, D. Ch en, and L. Zettlemoyer, "Detecting pretraining data from la rge language models," in Proc. ICLR, 2024. [23] W. Zhang et al., "Min-K%++: Improved baseline for detecting pre-training data from LLMs," in Proc. ICLR, 2025. [24] M. Duan et al., "SoK: Membership inference attacks on LLMs a re rushing nowhere (and how to fix it)," 2024. [25] P. Malo, A. Sinha, P. Korhonen, J. Wallenius, and P. Takala, "G ood debt or bad debt: Detecting semantic orientations in economic texts," J. Assoc. Inf. Sci. Technol., vol. 65, no. 4, pp. 782 – 796, 2014. [26] D. Roy and R. Misra, "Before the first token: Detecting hallucination through pre-co mmitment encoding," s ubmitted to Eng. Appl. Artif. Intell., 2025. [27] D. Roy and R. Misra, "Does mechanistic interpretability transfe r across data modalities? A cross -domain causal circuit analysis of VAEs," arXiv:2603.21236, Mar. 2026. [28] I. Magar and R. Schwartz, "Data contamination: From me morization to exploitation," in Proc. ACL, 2022. [29] S. K. Sarkar and K. Vafa, "Lookahead bias in pretrained langu age models," SSRN, 2024. [30] Y. Yan and R. Tang, "DatedG PT: Preventi ng lookahead bias in large langua ge models with time -aware pretraining," arXiv:2603.11838, Mar. 2026.
Original Paper
Loading high-quality paper...
Comments & Academic Discussion
Loading comments...
Leave a Comment