Uncertainty-Guided Label Rebalancing for CPS Safety Monitoring
Safety monitoring is essential for Cyber-Physical Systems (CPSs). However, unsafe events are rare in real-world CPS operations, creating an extreme class imbalance that degrades safety predictors. Standard rebalancing techniques perform poorly on tim…
Authors: John Ayotunde, Qinghua Xu, Guancheng Wang
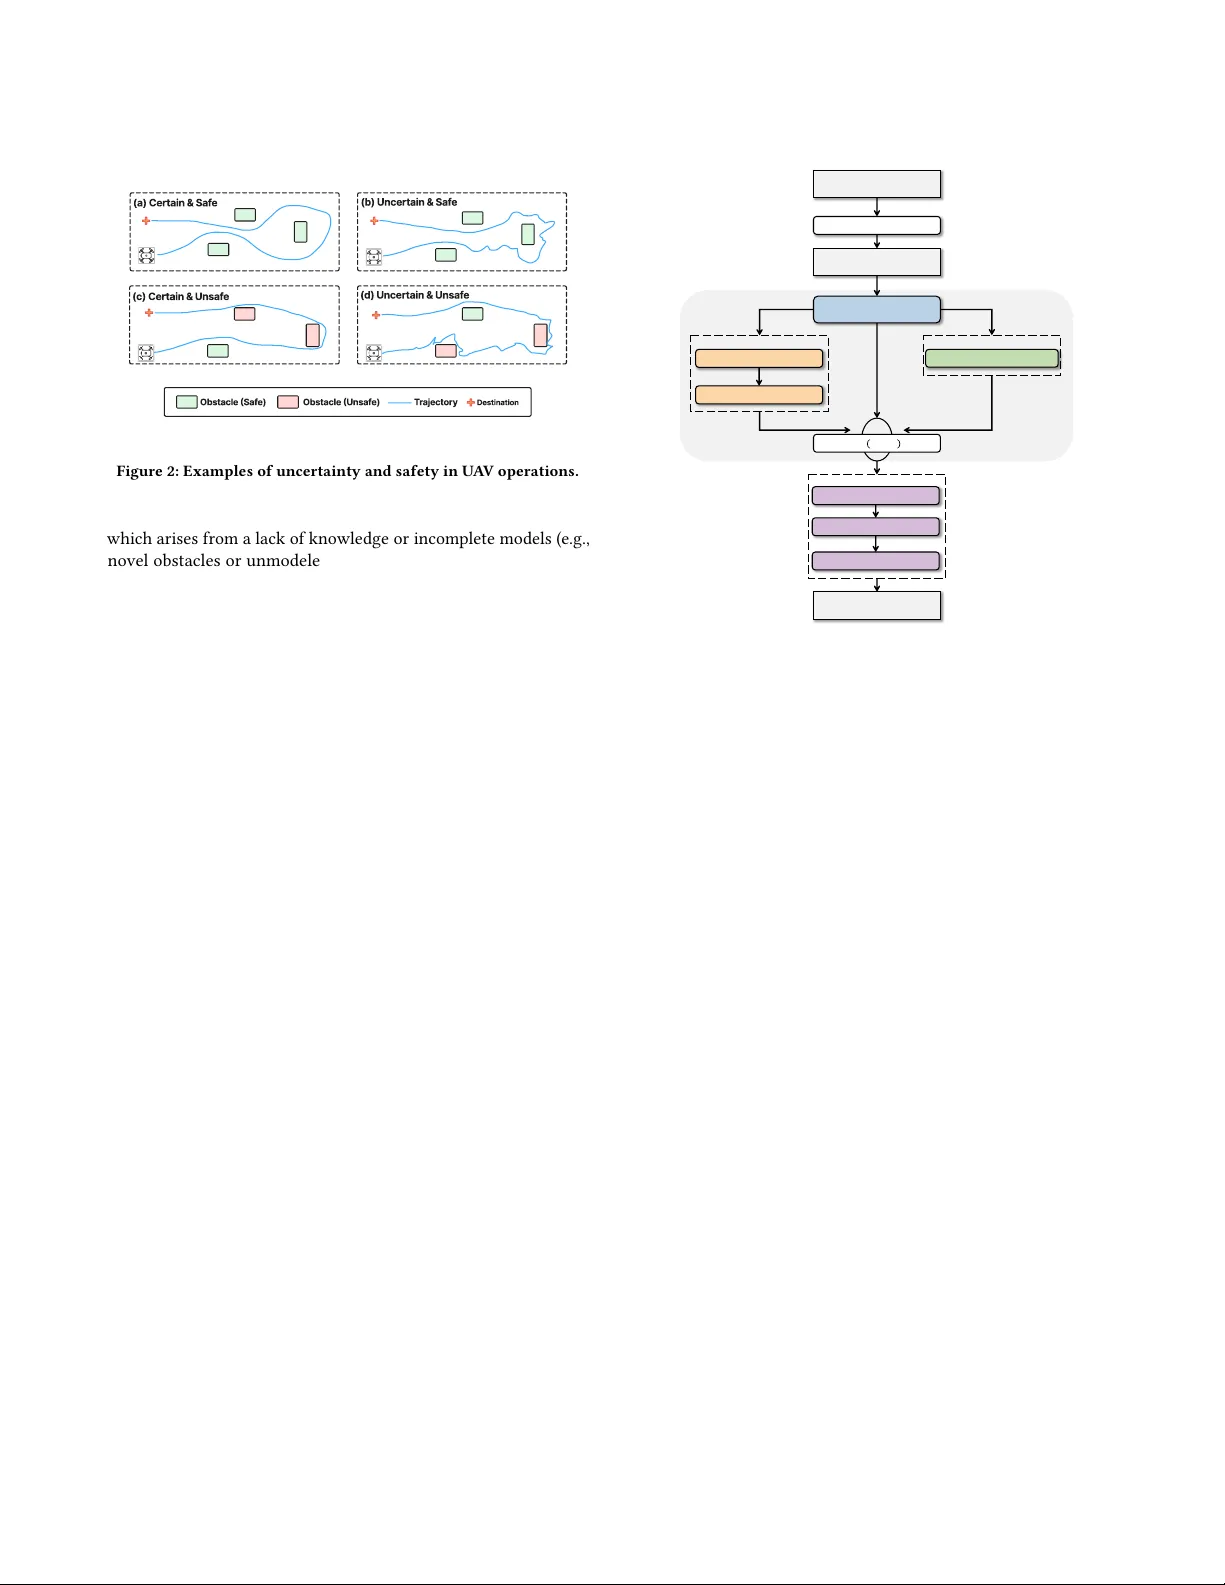
Uncertainty-Guided Label Rebalancing for CPS Safety Monitoring John A yotunde Lero Research Ireland Centr e for Software Research, University of Limerick Castletroy, Limerick, Ireland ayotunde.johnoluwatobiloba@ul.ie Qinghua Xu Lero Research Ireland Centr e for Software Research, University of Limerick Castletroy, Limerick, Ireland qinghua.xu@ul.ie Guancheng W ang Lero Research Ireland Centr e for Software Research, University of Limerick Castletroy, Limerick, Ireland guancheng.wang@ul.ie Lionel C Briand University of Ottawa, Canada, and Lero Research Ir eland Centre for Software Research, Univ ersity of Limerick Limerick, Ireland Lionel.Briand@lero.ie Abstract Safety monitoring is essential for Cyber-Physical Systems (CPSs) such as Unmanned Aerial V ehicles ( U A V s). Howev er , unsafe events are rare in real-world CPS operations, creating an extreme class imbalance that degrades data-driven safety predictors. Standard rebalancing techniques (e.g., SMOTE and class weighting) perform poorly on time-series CPS telemetr y , either generating unrealistic synthetic samples or overtting on the minority class. Meanwhile, behavioral uncertainty in CPS operations, dene d as the degree of doubt or uncertainty in CPS decisions (e .g., erratic control signals or rapid heading changes), is often correlated with safety outcomes: Uncertain behaviors are more likely to lead to unsafe states. How- ever , this valuable information ab out uncertainty is underexplored in safety monitoring. T o that end, we propose U-Balance , a super vised approach that leverages behavioral uncertainty to rebalance imbalanced datasets prior to training a safety predictor . U-Balance rst trains a GatedMLP- based uncertainty predictor that summarizes each telemetry win- dow into distributional kinematic features and outputs an uncer- tainty score. It then applies an uncertainty-guided label rebalancing ( uLNR ) mechanism that probabilistically relabels safe -labeled win- dows with unusually high uncertainty as unsafe , thereby enriching the minority class with informative b oundary samples without synthesizing new data. Finally , a safety predictor is traine d on the rebalanced dataset for safety monitoring. W e evaluate U-Balance on a large-scale U A V benchmark with a 46:1 safe-to-unsafe ratio. Results conrm a moderate but signicant correlation between b ehavioral uncertainty and safety . W e then identify uLNR as the most eective strategy to exploit uncertainty information, compared to direct early and late fusion. U-Balance achieves a 0.806 F1 score, outperforming the strongest baseline by 14.3 percentage points, while maintaining competitive inference Permission to make digital or hard copies of all or part of this work for personal or classroom use is granted without fee provided that copies are not made or distributed for prot or commercial advantage and that copies bear this notice and the full citation on the rst page. Copyrights for components of this work owned by others than the author(s) must be honor ed. Abstracting with credit is permitted. T o copy otherwise, or republish, to post on servers or to redistribute to lists, requires prior specic permission and /or a fee. Request permissions from permissions@acm.org. Conference acronym ’XX, W oodstock, N Y © 2018 Copyright held by the owner/author(s). Publication rights licensed to ACM. ACM ISBN 978-1-4503-XXXX -X/2018/06 https://doi.org/XXXXXXX.XXXXXXX eciency . Ablation studies conrm that both the GatedMLP-base d uncertainty predictor and the uLNR mechanism contribute signi- cantly to U-Balance ’s eectiveness. T o our knowledge, this work is the rst to exploit b ehavioral uncertainty for dataset rebalanc- ing in CPS data-driven safety monitoring, demonstrating a novel way to leverage uncertainty beyond conventional fusion-based approaches. CCS Concepts • Software and its engineering → Software safety ; • Comput- ing methodologies → Learning from imperfect data ; Neural networks ; • Computer systems organization → Embedded and cyber-physical systems . Ke ywords Cyber-Physical Systems, Safety Monitoring, Lab el Rebalancing A CM Reference Format: John A y otunde, Qinghua Xu, Guancheng W ang, and Lionel C Briand. 2018. Uncertainty-Guided Label Rebalancing for CPS Safety Monitoring . In Pro- ceedings of Make sure to enter the correct conference title from your rights conrmation email (Conference acronym ’XX). A CM, New Y ork, NY, USA, 13 pages. https://doi.org/XXXXXXX.XXXXXXX 1 Introduction Cyber-physical Systems (CPSs), such as Unmanned Aerial V ehicles (U A V s), are deployed in various application scenarios [ 43 ], including crop monitoring [ 82 ] and disaster rescue [ 76 ]. T o enable these rich functionalities, CPSs are becoming increasingly complex, exposing them to broader safety threats [ 21 , 23 , 25 , 32 ]. Recent incidents involving U A V crashes or operational failures hav e caused property damage, environmental damage, or even loss of life [ 30 , 33 , 41 , 65 ], highlighting the importance of ensuring CPS safety . Safety monitoring has been studie d as a vital strategy for detect- ing and prev enting unsafe behaviors during CPS operations [ 39 ]. By continuously assessing system behavior , monitoring approaches can detect deviations from expected norms, enabling timely inter- ventions such as human takeover [ 78 ] or fail-safe modes [ 68 , 81 ]. Traditional safety monitoring primarily r elies on static rule-based strategies [ 2 , 3 , 72 ], which are insucient in dynamic, unpredictable environments. Therefore, there has be en a shift towards data-driven approaches, leveraging machine learning (ML) models to predict Conference acronym ’XX, June 03–05, 2018, W oodsto ck, NY A yotunde et al. unsafe system behaviors from real-time sensor/actuator data [ 54 , 71 , 79 , 80 ]. Most data-driven approaches rely on super vised learning, which requires labeled datasets and is sensitive to label imbalance. Howev er , safety monitoring datasets are often highly imbalanced, with safe data vastly outnumbering unsafe data. For example, the safe/unsafe data ratio is appro ximately 46 : 1 in the U A V datasets collected by Khatiri et al . [43] . Supervise d ML models trained on such imbalanced datasets tend to be biased toward the majority class and struggle to capture representative patterns in rare yet critical unsafe data. Common rebalancing techniques, such as the Synthetic Minority Over-sampling T echnique (SMOTE) [ 14 ] and class weighting [ 5 , 87 ], aim to address this issue but hav e notable limitations: SMOTE can amplify noise and introduce unrealistic synthetic samples, whereas class weighting often struggles under severe class imbalance. More recently , label noise r ebalancing (LNR) has emerged as a promising strategy that rebalances labels with- out synthesizing any samples, even under extreme imbalance [ 36 ]. LNR stochastically ips the labels of majority-class samples near the decision boundar y to the minority class, thereby reducing bias. Howev er , LNR was originally developed for image data. Its applica- bility to time-series data remains largely unexplor ed, particularly in CPS settings that operate in open conte xts [ 7 , 77 ], where data are generated in dynamic and unpredictable real-world environments. Meanwhile, recent work by Khatiri et al . [43] has demonstrated that behavioral uncertainty in CPS operations—dened as the de- gree of doubt or uncertainty in CPS decisions and manifested as erratic control signals or rapid heading changes—is correlated with safety outcomes: Uncertain behaviors are more likely to lead to un- safe states. This suggests that uncertainty information could ser ve as a valuable signal for improving safety prediction. However , how to eectively leverage such uncertainty information to enhance the eectiveness of safety monitoring remains underexplor ed. T o that end, we propose U-Balance , a safety-monitoring ap- proach that leverages behavioral uncertainty to adapt LNR to time- series CPS data. U-Balance rst trains an uncertainty predictor that summarizes each telemetry window into distributional kinematic features and outputs an uncertainty score, capturing behavioral uncertainty in CPS operations (e.g., rapid changes in U A V heading angles). It then applies an uncertainty-guided LNR ( uLNR ) me ch- anism that pr obabilistically relabels safe -labeled windows with unusually high uncertainty as unsafe , thereby enriching the minor- ity class with informative boundary samples without synthesizing new data. Finally , a safety predictor is trained on the rebalanced dataset to monitor runtime safety . W e assess the p erformance of U-Balance on the U A V benchmark constructed by Khatiri et al . [43] . Experimental results demonstrate that behavioral uncertainty is moderately but signicantly corre- lated with safety , and uLNR is the most eective strategy for in- corporating uncertainty information with U-Balance , compared to direct early and late fusion. U-Balance achieves an F1 score of 0.806 for safety pr ediction, outperforming the best baseline by 14.3 percentage points ( pp ). Ablation studies conrm that uLNR im- proves safety prediction; replacing it with existing class-imbalance mitigation methods reduces the F1 score by 13.1-26.6 pp . In summary , our contributions are threefold: PX 4 - Autopilot PX 4 - Avoidan ce Cyber Par t Actuators Sensors Physical Par t 𝑎 ! Mission Plan Origin Destination v " v " # v " $ Figure 1: Example of a U A V operation (1) W e propose U-Balance , intr oducing uLNR for CPS safety monitoring. T o the best of our knowledge, it is the rst ap- proach to exploit b ehavioral uncertainty for dataset rebal- ancing, improving the eectiveness of data-driven safety monitoring, and demonstrating an alternative way to lever- age uncertainty beyond standard fusion-based strategies. (2) W e propose a novel uncertainty predictor for time-series telemetry that summarizes each window with distributional kinematic features and estimates uncertainty using a novel GatedMLP architecture. This design enables U-Balance to eectively adapt the original LNR to time-series data. (3) W e report experimental r esults on a large U A V dataset, sho w- ing that U-Balance substantially outperforms all baselines by at least 14 . 3 pp in F1 scores. 2 Background 2.1 Unmanned Aerial V ehicles This work focuses on U A V s, a representative class of CPSs widely adopted across various domains [ 76 , 82 ]. U A V systems integrate a physical component, such as sensors ( e.g., cameras, LiD AR, GPS) and actuators (e .g., motors and gimbals), with a cyber component, such as autopilot rmware (e.g., PX4-A utopilot or ArduPilot) [ 43 ]. In this section, we describe a typical U A V operation and demonstrate the denition of safety and uncertainty in U A V operations. U A V in Operation. As depicted in Figure 1, a typical U A V operation begins with a high-level mission plan that sp ecies a sequence of 𝑚 navigation wayp oints { ( 𝑥 𝑤 𝑖 , 𝑦 𝑤 𝑖 , 𝑧 𝑤 𝑖 ) } 𝑚 𝑖 = 0 , where ( 𝑥 𝑤 𝑖 , 𝑦 𝑤 𝑖 , 𝑧 𝑤 𝑖 ) denotes the 3-D position of the 𝑖 -th waypoint. During operation, the U A V continuously acquires envir onmental information using onboard sensors, such as GPS. At the timestep 𝑡 , the physical component of the U A V sends the system state v ec- tor 𝑣 𝑡 = ( 𝑥 𝑡 , 𝑦 𝑡 , 𝑧 𝑡 , 𝑟 𝑡 ) to the cyber component for processing, in- cluding the current position ( 𝑥 𝑡 , 𝑦 𝑡 , 𝑧 𝑡 ) and heading angle 𝑟 𝑡 . The PX4- A utopilot module computes the next desired state 𝑣 𝑑 𝑡 based on the mission plan, while the obstacle avoidance module (i.e., PX4- A voidance) renes these by incorporating the current U A V state. It produces the modie d state vector 𝑣 𝑠 𝑡 , which is translated into control commands 𝑎 𝑡 by the autopilot module to adjust the U A V’s motion, including thrust, pitch, roll, and yaw . U A V Uncertainty & Safety The closed-loop mission process en- ables the self-adaptation of U A V s in operation, but it is susceptible to uncertainties in real-world applications, including sensor noise, weather variability , and unexpected obstacles. These uncertain- ties can be categorized into two types: (1) aleatoric uncertainty , which stems from inherent randomness in the CPS or environment (e.g., sensor noise and weather inuence); (2) epistemic uncertainty , Uncertainty-Guided Label Rebalancing for CPS Safety Monitoring Conference acronym ’XX, June 03–05, 2018, W oodsto ck, NY ( a ) C e r t a i n & S a f e ( b ) U n c e r t a i n & S a f e ( c ) C e r t a i n & U n s a f e ( d ) U n c e r t a i n & U n s a f e O b s t a c l e ( S a f e ) O b s t a c l e ( U n s a f e ) T r a j e c t o r y D e s t i n a t i o n Figure 2: Examples of uncertainty and safety in U A V operations. which arises from a lack of knowledge or incomplete models (e.g., novel obstacles or unmo deled dynamics in the environment) [ 1 ]. Both types manifest as behavioral uncertainty , characterized by inconsistencies in U A V behavior , such as erratic control signals or rapid changes in heading angles over a short period. Such b ehavioral uncertainty is often corr elated with ight safety , typically characterize d by predened safety rules, such as limits on altitude and spe ed, and minimum separation from obstacles. Following common practice in the literature [ 43 , 44 ], we deem a ight unsafe whenever the distance between the U A V and any obstacle falls below 1.5 m. Figure 2 illustrates examples of safety and uncertainty in U A V operations. Plot (a) depicts a certain and safe ight where the U A V exhibits a smooth and stable trajector y , successfully navigating around obstacles without hesitation. An uncertain but safe ight (b) exhibits erratic heading adjustments when appr oaching obstacles but constantly maintains a safe distance until reaching its desti- nation. A certain but unsafe ight (c) maintains a stable trajectory but violates safe rules by ying too close to obstacles. Lastly , an uncertain and unsafe ight (d) displays both b ehavioral uncertainty and violations of safety rules. 2.2 Safety Monitoring in CPSs In the standard safety monitoring task for U A V s, the focus is on predicting unsafe states from runtime data to enable timely in- terventions. Formally , given a dataset D = { ( 𝜔 𝑡 , 𝑙 𝑠 𝑡 ) } 𝑁 𝑡 = 1 , where 𝜔 𝑡 ∈ R 𝑇 × 𝐹 is a window of 𝑇 timesteps with 𝐹 features (e .g., actual position and heading angle of U A V s in operation ( 𝑥 𝑡 , 𝑦 𝑡 , 𝑧 𝑡 , 𝑟 𝑡 ) ), and 𝑙 𝑠 𝑡 ∈ { 0 , 1 } is the binary label for safety ( 0 :safe, 1 :unsafe). The goal is to learn a predictor 𝑓 : R 𝑇 × 𝐹 → [ 0 , 1 ] that estimates the probability of an unsafe window . One key challenge in this task is severe label imbalance, with safe samples vastly outnumbering unsafe ones. This imbalance is common in U A V operations, as unsafe behaviors are rare in real-w orld operations. Consequently , a safety predictor trained on such an imbalanced dataset often exhibits high overall accuracy but fails to reliably detect critical unsafe states. 3 Approach This section presents U-Balance , a supervised learning approach for safety monitoring in CPSs. The objective of U-Balance is to Preprocessing Distributional Feat ures 𝑑 ! ∈ ℝ " 6 Data at Timepoint 𝑡 𝜔 ! = {𝑋 !#$%" , 𝑋 !#$ , … , 𝑋 ! } Projection Linear ( 16 . → . 64 ) + ReLU Linear ( 64 . → . 128 ) + ReLU Linear ( 128 . → . 64 ) Linear ( 64. → . 64 ) + sigmoid Linear ( 64 . → . 32 ) + ReLU Dropout ( 0.3) Linear ( 32 . → .1 ) Uncertainty Score 𝑢 ! 5 Tra ns fo rm Path wa y Gate Pat hwa y 𝑔 ! ⨀ℎ ! + 1 − 𝑔 ! ⊙ 𝑑 ! < Gated Residual Fusion 𝑑 ! < 𝑑 ! < 𝑑 ! < skip - connection 𝑜 ! . ℎ ! g ! Classification GatedMLP Figure 3: Overview of the Uncertainty Predictor ( 1 ○ ). train an ee ctive safety predictor in the presence of a highly im- balanced dataset. U-Balance is a supervised approach trained with both safety and uncertainty lab els, which can be obtained from predened safety rules (e .g., minimum distance to obstacles) and from detecting behavioral inconsistencies, such as abrupt heading changes over short time intervals. In particular , the uncertainty labels can be automatically generated using simple rules. The de- tailed proce dure is described by Khatiri et al . [43] and is beyond the scope of this work. U-Balance consists of three components that op erate collabo- ratively: 1 ○ Uncertainty Predictor , 2 ○ uLNR , and 3 ○ Safety Predictor . Let the imbalanced training dataset be D = ( 𝜔 𝑡 , 𝑙 𝑠 𝑡 , 𝑙 𝑢 𝑡 ) 𝑁 𝑡 = 1 , where 𝜔 𝑡 , 𝑙 𝑠 𝑡 , and 𝑙 𝑢 𝑡 denote the 𝑡 -th window of ight data, its safety label, and its uncertainty label, respectively . The uncertainty predictor ( 1 ○ ) is rst trained using uncertainty labels and produces an uncertainty score for each window . uLNR ( 2 ○ ) then converts these scor es into ip rates and stochastically relabels windows in the majority class as the minority class, yielding a rebalanced dataset 𝐷 𝑏𝑎𝑙 . Finally , the safety predictor ( 3 ○ ) is trained on 𝐷 𝑏𝑎𝑙 for safety monitoring. In the rest of this section, we elaborate on each comp onent, namely Uncertainty Predictor (Section 3.1), uLNR (Section 3.2), and Safety Predictor (Section 3.3). U-Balanc3 3.1 Uncertainty Predictor The uncertainty predictor detects behavioral uncertainty in U A V operations. Figure 3 presents its architecture, consisting of three main steps: Proprocessing , GatedMLP , and Classication . Preprocessing . Each window 𝜔 𝑡 consists of multivariate time-series data collecte d over 𝑁 time steps. W e use the term channel to denote one scalar variable measured at each time step (i.e., one dimension of the multivariate time series). At each time step, four kinematic Conference acronym ’XX, June 03–05, 2018, W oodsto ck, NY A yotunde et al. channels are recorded: the heading angle 𝑟 and the spatial coordi- nates 𝑥 , 𝑦 , and 𝑧 . W e denote the sequence of values for each channel within window 𝜔 𝑡 as 𝜔 𝑟 𝑡 , 𝜔 𝑥 𝑡 , 𝜔 𝑦 𝑡 , and 𝜔 𝑧 𝑡 , respectively , where each sequence contains 𝑁 measurements. For example , the heading se- quence can be written as 𝜔 𝑟 𝑡 = 𝑟 𝑡 , 1 , 𝑟 𝑡 , 2 , . . . , 𝑟 𝑡 ,𝑁 , representing the heading angle observed over the window . T o capture the temporal characteristics, we transform the raw time-series window into a distributional kinematic feature vector 𝑑 𝑡 ∈ R 16 by computing four descriptive statistics for each channel: mean, standard deviation, minimum, and maximum as in Equation 1. 𝑑 𝑟 𝑡 = ( 𝑚𝑒𝑎𝑛 ( 𝜔 𝑟 𝑡 ) , 𝑠 𝑡 𝑑 ( 𝜔 𝑟 𝑡 ) , 𝑚𝑖𝑛 ( 𝜔 𝑟 𝑡 ) , 𝑚𝑎𝑥 ( 𝜔 𝑟 𝑡 ) ) 𝑑 𝑥 𝑡 = ( 𝑚𝑒𝑎𝑛 ( 𝜔 𝑥 𝑡 ) , 𝑠 𝑡 𝑑 ( 𝜔 𝑥 𝑡 ) , 𝑚𝑖𝑛 ( 𝜔 𝑥 𝑡 ) , 𝑚𝑎𝑥 ( 𝜔 𝑥 𝑡 ) ) 𝑑 𝑦 𝑡 = ( 𝑚𝑒𝑎𝑛 ( 𝜔 𝑦 𝑡 ) , 𝑠 𝑡 𝑑 ( 𝜔 𝑦 𝑡 ) , 𝑚𝑖𝑛 ( 𝜔 𝑦 𝑡 ) , 𝑚𝑎𝑥 ( 𝜔 𝑦 𝑡 ) ) 𝑑 𝑧 𝑡 = ( 𝑚𝑒𝑎𝑛 ( 𝜔 𝑧 𝑡 ) , 𝑠 𝑡 𝑑 ( 𝜔 𝑧 𝑡 ) , 𝑚𝑖𝑛 ( 𝜔 𝑧 𝑡 ) , 𝑚𝑎𝑥 ( 𝜔 𝑧 𝑡 ) ) 𝑑 𝑡 = ( 𝑑 𝑟 𝑡 , 𝑑 𝑥 𝑡 , 𝑑 𝑦 𝑡 , 𝑑 𝑧 𝑡 ) (1) Each statistic is computed over the 𝑁 timesteps within the win- dow 𝜔 𝑡 for the corresponding channel. These distributional features capture the temporal variability and extr eme values of U A V kine- matic behavior within a window . For example, a high standard deviation in the heading channel indicates frequent or erratic di- rectional changes, which can reect unstable control behavior and thus indicate behavioral uncertainty . GatedMLP . The distributional feature vector 𝑑 𝑡 is rst passed to a linear layer 𝑊 proj ∈ R 𝑝 × 16 with bias 𝑏 proj ∈ R 𝑝 , followed by a ReLU activation as in Equation 2. ReLU is applied after the projection to ensure only positive activations are passed forward, which has be en shown to improve training stability in feed-forward networks [ 56 ]. ˜ 𝑑 𝑡 = ReLU ( 𝑊 proj 𝑑 𝑡 + 𝑏 proj ) , ˜ 𝑑 𝑡 ∈ R 𝑝 (2) where 𝑝 denotes the projection dimension. The projecte d represen- tation ˜ 𝑑 𝑡 is then passed through a GatedMLP blo ck, which employs a gating mechanism inspired by the Gated Recurrent Unit (GRU) [ 22 ] to control information o w . W e choose a gating mechanism o ver a standard MLP because distributional features vary in r elevance across ight conditions, and gating allows the model to dynami- cally suppress uninformative features rather than treating all inputs equally [ 22 ]. Sp ecically , the blo ck consists of two parallel path- ways: a transform pathway and a gate pathway . The transform pathway applies a bottleneck expansion to capture non-linear in- teractions among features: ℎ 𝑡 = 𝑊 2 ReLU ( 𝑊 1 ˜ 𝑑 𝑡 + 𝑏 1 ) + 𝑏 2 (3) where 𝑊 1 ∈ R 𝑒 × 𝑝 further transforms the representation into an intermediate dimension 𝑒 > 𝑝 , and 𝑊 2 ∈ R 𝑝 × 𝑒 reduces it back. The gate pathway produces an element-wise gating vector: 𝑔 𝑡 = 𝜎 ( 𝑊 𝑔 ˜ 𝑑 𝑡 + 𝑏 𝑔 ) , 𝑔 𝑡 ∈ [ 0 , 1 ] 𝑝 (4) where 𝜎 denotes the sigmoid function. The gate 𝑔 𝑡 performs a learned element-wise interpolation between the transformed repr e- sentation and the original projected input via a residual connection: 𝑜 𝑡 = 𝑔 𝑡 ⊙ ℎ 𝑡 + ( 1 − 𝑔 𝑡 ) ⊙ ˜ 𝑑 𝑡 (5) Classication . Finally , the output 𝑜 𝑡 is passed through a classica- tion block consisting of a fully connected layer with ReLU activation Uncertainty Predictor Uncertainty Scoring Z- score Normalization Flip Rate Calculation Stochastic Relabeling 𝑝 ! "#$% remain safe flip Imbalanced 𝒟 safe unsafe Balanced 𝒟 !"# max tanh 𝑧 $ − 𝜏 , 0 Figure 4: Overview of uLNR ( 2 ○ ) and dropout regularization: ˆ 𝑢 𝑡 = 𝑊 4 ReLU ( 𝑊 3 𝑜 𝑡 + 𝑏 3 ) + 𝑏 4 (6) where ˆ 𝑢 𝑡 ∈ R is the predicted uncertainty score. 3.2 Uncertainty-guided Label Rebalancing Adapted from the original LNR [ 36 ], the uLNR rebalances class labels in the training set using uncertainty information. Specically , it leverages the output ˆ 𝑢 𝑡 from the uncertainty predictor to identify samples that exhibit unusually high behavioral uncertainty and stochastically relabels them as unsafe. uLNR operates in three steps, namely Uncertainty Scoring , F lip-rate Calculation , and Stochastic Relabeling . Uncertainty Scoring. T o characterize how unusual a sample is relative to typical safe samples in terms of uncertainty , we compute uncertainty scores for all safe windows and transform them into z-scores, which express each score as a signed distance from the mean in units of standard deviation. This standardization allows us to identify samples that deviate signicantly from the distribution of safe behavior in a threshold-independent manner [ 36 ]. Z-score is calculated as 𝑧 𝑡 = ˆ 𝑢 𝑡 − 𝜇 S 𝜎 S + 𝜖 , where 𝜇 S and 𝜎 S denote the mean and standard deviation of uncertainty scores among the set of safe samples 𝑆 , and 𝜖 is a small constant for numerical stability . The resulting z-score 𝑧 𝑡 measures how much a window’s uncer- tainty deviates from typical safe behavior . A higher value indicates that the corresponding window exhibits greater uncertainty than most safe samples and is therefore more likely to pose safety risks. Flip-rate Calculation. The z-scor es ar e transformed into ip prob- abilities using a shifted hyperbolic tangent as in Equation 7, 𝑝 ip 𝑡 = ( max tanh ( 𝑧 𝑡 − 𝜏 ) , 0 if 𝑙 𝑠 𝑡 = 0 , 0 if 𝑙 𝑠 𝑡 = 1 , (7) where 𝜏 is a thr eshold parameter that controls the aggressiveness of relabeling. The tanh function pr ovides a smooth, bounde d mapping from z-scores to probabilities, while the max ( · , 0 ) operator ensures that samples with 𝑧 𝑡 ≤ 𝜏 receive zero ip probability . Note that only safe-labeled samples are eligible for relabeling, thereby increasing the number of minority samples. Stochastic Relabeling. Each safe-lab eled sample is independently relabeled by drawing from a Bernoulli trial parameterized by its ip probability as depicted in Equation 8, ˜ 𝑙 𝑠 𝑡 = ( 1 if 𝑙 𝑠 𝑡 = 0 and 𝜉 < 𝑝 ip 𝑡 , 𝑙 𝑠 𝑡 otherwise , 𝜉 ∼ Uniform ( 0 , 1 ) (8) Uncertainty-Guided Label Rebalancing for CPS Safety Monitoring Conference acronym ’XX, June 03–05, 2018, W oodsto ck, NY Linear ( 32 # → # 32 ) + ReLU Linear ( 32 # → #1 )+Sigmoid Data at Time point 𝑡 𝜔 ! = {𝑋 !"#$% , 𝑋 !"# , … , 𝑋 ! } Classification Bi - LSTM Multi - Laye r Bi - LSTM 0:safe 1:unsafe Figure 5: Overview of the Safety Predictor ( 3 ○ ) where ˜ 𝑙 𝑠 𝑡 denotes the corrected safety label. As a result, samples de ep within the safe distribution ( 𝑧 𝑡 ≪ 𝜏 ) are unaected, while samples with high uncertainty are relabeled with probability pr oportional to their de viation. The corrected labels ˜ 𝑙 𝑠 𝑡 replace the original labels 𝑙 𝑠 𝑡 , yielding a more balanced dataset D 𝑏𝑎𝑙 . 3.3 Safety Predictor The safety predictor takes the raw kinematic sequence 𝜔 𝑡 ∈ R 𝑁 × 𝐶 for each window in D 𝑏𝑎𝑙 , wher e 𝑁 = 25 timesteps and 𝐶 = 4 channels ( 𝑟 , 𝑥 , 𝑦, 𝑧 ) , and outputs a binar y safety prediction ˆ 𝑙 𝑠 𝑡 ∈ { 0 , 1 } . Each channel is independently standardized before being fed to the model. The safety predictor comprises two components: the BiLSTM block and the classication block. Multi-Layer Bi-LSTM . 𝜔 𝑡 is processed by a multi-layer bidirec- tional LSTM encoder [ 67 ]. At each lay er , the forward and backward hidden states are computed over the input sequence, with inter- layer dropout applied between consecutive layers. The hidden states from the nal timestep of the last layer are concatenated to form the sequence representation ℎ 𝑡 . Classication . This hidden vector ℎ 𝑡 is passed to a classication block, consisting of a linear layer with ReLU activation as in Equa- tion 9 ˆ 𝑙 𝑠 𝑡 = 𝜎 𝑊 2 ReLU ( 𝑊 1 ℎ 𝑡 + 𝑏 1 ) + 𝑏 2 (9) where 𝜎 denotes the sigmoid function. ReLU is applied to introduce non-linearity before the nal projection, and a sigmoid activation maps the output to a probability in [0,1], suitable for binary classi- cation [56]. 4 Experiment Design In Se ction 4.1, we introduce three research questions (RQs), fol- lowed by dataset details in Section 4.2. Subsequently , we present the baselines, evaluation metrics, and implementation details of our experiments in Sections 4.3, 4.4, and 4.5, respectively . 4.1 Research Questions RQ0 (Uncertainty Integration) : Does uncertainty correlate with ight safety in U A V operations? If so, how can uncertainty be eectively leveraged to improve the accuracy of safety pre- diction? This research question examines our key assumption that ight safety and behavioral uncertainty are correlated: U A V s tend to exhibit higher uncertainty during unsafe operations and lower uncertainty during safe ones. Specically , we calculate the Point- biserial correlation between the predicted uncertainty score and its safety label for each window . W e then compare uLNR , direct early fusion, and direct late fusion strategies [ 9 , 84 ] to identify the most eective strategy for lev eraging uncertainty . The performance of these integration strategies is assessed by their F1 scores on the safety prediction task. RQ1 (Ee ctiveness and Eciency) : How ee ctive and ef- cient is U-Balance in safety prediction, compared to SOT A baselines? This RQ evaluates both the predictive performance and com- putational eciency of U-Balance in the safety monitoring task. T o this end, we conducted comprehensive experiments comparing U-Balance against 14 SOT A baselines spanning classical machine learning, deep learning, and ensemble approaches. W e assess the eectiveness using precision, recall, and F1 score, and eciency using model size (number of parameters) and inference latency . RQ2 ( Ablation) : Ho w much do the ke y components contribute to U-Balance ’s eectiveness, including the uncertainty predic- tor and the uLNR ? This RQ quanties the individual contribution of major com- ponents in U-Balance . For the uncertainty predictor , w e ablate its main components, namely (i) the distributional feature prepro- cessing and (ii) the GatedMLP model. T o assess prepr ocessing, we remove it and train standard sequential encoders (RNN, GRU, LSTM) instead. T o assess the Gate dMLP model, we replace it with a plain MLP without any gates. For uLNR , we comprehensiv ely compare with (i) uLNR using al- ternative ip thr eshold values, i.e., 𝜏 ∈ { 0 . 5 , 1 . 0 , 1 . 5 , 2 . 0 , 2 . 5 , 3 . 0 , 3 . 5 } , and (ii) w/o uLNR and 14 rebalancing te chniques spanning data-level and algorithm-level approaches [ 36 ]. Data-level methods modify the training set directly to r ebalance the class distribution. These include oversampling methods, which generate synthetic minority- class samples ( SMOTE [ 14 ], AD ASYN [ 34 ], Borderline-SMOTE [ 31 ], T emp oral-oriented SMOTE (T -SMOTE) [ 85 ] and Rare-class Sample Generator (RSG) [ 75 ]); mixup-based methods, which cr eate new samples by interpolating b etween existing ones ( ReMix [ 17 ] and SelMix [ 60 ]); and undersampling methods, which reduce the ma- jority class ( Random Under-Sampling (RUS) [ 10 ], One-Sided Selec- tion (OSS) [ 6 ], and Cluster Centroids (CC) [ 52 ]). Algorithm-level methods modify the loss function or training procedure to penalise minority-class errors more heavily , including Class W eight (CW) [ 5 ], Label-Distribution-A ware Margin Loss with Deferr ed Re- W eighting (LD AM-DRW) [ 11 ], Graph Contrastive Learning (GCL) [ 49 ], and Mixup and Label-A ware Smoothing (MiSLAS) [ 86 ]. Among them, T -SMOTE [ 55 , 57 , 85 ] is identied as an SOT A baseline for rebalanc- ing time-series data. More r ecent methods, such as scor e conditioned diusion model ( SOIL ), are excluded due to unavailable code. 4.2 Dataset W e evaluate U-Balance on the U A V dataset constructed by Khatiri et al . [43] . W e select this dataset for two reasons. First, it is a large- scale, diverse benchmark comprising 1,498 ights totaling approx- imately 53 hours and 39 minutes of ight time, enabling a com- prehensive evaluation of U-Balance . Second, to the best of our Conference acronym ’XX, June 03–05, 2018, W oodsto ck, NY A yotunde et al. knowledge, it is the only public U A V dataset that includes uncer- tainty annotations, making it dir ectly suitable for U-Balance ; using other datasets would require additional uncertainty labeling. The ights were generated using Surrealist [ 45 ], an automated simulation-based test case generation to ol for U A V s. Surrealist gen- erates challenging environments by iteratively introducing static obstacles into PX4 autopilot missions, adjusting their size, position, and orientation to create scenarios in which the PX4- A v oidance collision-prevention system struggles to identify a safe path. The tool also enables multiple simulations per test case to account for non-deterministic behavior . The r esulting dataset covers a range of ight conditions, including safe, unsafe , certain, and uncertain behaviors, as illustrated in Figure 2. Following Khatiri et al . [43] , we segment each ight into xed- length windows, with each window containing 25 time points. W e then sequentially partition the dataset into training, validation, and test sets at an 8:1:1 ratio [ 8 ], preserving temporal order to prevent future information leakage. The thr ee splits contain 69,364, 3,944, and 3,946 wido ws, respectively . Safe & certain samples make up the vast majority of each split (68,298 in training, 3,475 in validation, and 3,637 in test), while the remaining classes are considerably rarer: unsafe & certain accounts for 107, 41, and 20 samples; unsafe & uncertain for 798, 420, and 259; and safe & uncertain for just 161, 8, and 30 samples across training, validation, and test respectively . 4.3 Baselines W e compare U-Balance with 14 baselines spanning classical ma- chine learning, deep learning, and ensemble methods. In particular , the T emporal Fusion Transformer (TFT) was identie d as the SOT A approach for safety monitoring [ 63 ], while Superialist is the only prior method specically designe d for this U A V dataset. Classical ML. W e include Logistic Regression (LR) [ 19 ], Supp ort V ector Machine (SVM) [ 70 ], Decision T ree (DT) [ 59 ], K-Nearest Neigh- bors (KNN) [ 18 ], and Multi-Layer Perceptron (MLP) [ 61 ] as standard classication baselines. Deep Learning. W e include several sequence models widely used for time-series classication, including CNN [ 47 ], Bi-LSTM [ 37 ], Bi- GRU [ 16 ], and Transformer (TF) [ 74 ]. W e also consider TFT [ 50 ], a transformer-based architecture that models temporal dependencies and assigns dierent time steps varying weights via attention. In addition, we evaluate TimeMoE [ 66 ], a pretrained time-series foun- dation model based on a mixture-of-experts architecture, trained on large-scale time-series data. Finally , we include Superialist [ 43 ], the only method specically dev eloped for this U A V dataset. It uses a CNN autoencoder to detect unsafe ights via reconstruction error and operates at the ight level rather than the window lev el. Ensemble Methods. W e include Random Forest (RF) [ 10 ] and Gra- dient Boosting (GB) [ 28 ] as representative ensemble baselines. RF builds an ensemble of DT s, while GB constructs the ensemble se- quentially , with each base classier correcting the residual error of its predecessor . Both methods are considered strong baselines across various classication tasks [27]. 4.4 Evaluation Metrics and Statistical T esting Correlation. T o assess the correlation b etween behavioral uncer- tainty and safety (RQ0), we calculate the Point-biserial correlation coecient ( 𝑟 𝑝𝑏 ), a common correlation metric between a continu- ous variable (uncertainty score) and a dichotomous variable (safety label) [ 20 , 46 , 73 ]. 𝑟 𝑝𝑏 ranges from − 1 to 1 , where values closer to 0 indicate weaker correlation and values closer to − 1 or 1 indicate stronger negative or positive correlation. Eectiveness. W e evaluate U-Balance and all baselines using pre- cision, recall, and F1 score [ 35 ], as these are standard metrics for classication tasks, particularly under class imbalance. These met- rics are computed from the numb ers of true positives (TP), true negatives (TN), false positives (FP), and false negativ es (FN). In our context, TP , TN, FP, and FN denote unsafe windows correctly predicted as unsafe, safe windows correctly predicted as safe, safe windows incorrectly predicted as unsafe, and unsafe windo ws in- correctly predicted as safe, respectively . Eciency . W e assess computational eciency to determine whether U-Balance can generate predictions within practical time con- straints. W e report two eciency metrics: model parameter count (#Params), which measures model size , and per-sample inference latency , which measures the time required to generate a single safety prediction. Statistical T esting. T o assess whether the obser ved dierences ar e statistically signicant, we repeat each experiment 30 times and apply the Mann- Whitney U test with a signicance level of 0 . 05 , following Arcuri and Briand [4] . The Mann- Whitney U test is a non- parametric test for determining whether two sample distributions dier signicantly . W e also report the ˆ 𝐴 12 eect size to quantify the magnitude of the dierence. ˆ 𝐴 12 ranges from 0 to 1 and represents the probability that one method outperforms the other . 4.5 Implementation Details The hyperparameters of U-Balance and all baselines are tuned via an extensive grid search on a held-out validation set. Each method is evaluated over at least 50 hyperparameter combinations, amounting to over 700 congurations in total. Details of hyperparameter tun- ing are provided in our repository . For U-Balance , the uncertainty predictor uses a projection dimension of 64, expansion dimension of 128, and dropout of 0.3, trained for 30 ep ochs with AdamW (lr = 10 − 3 , weight decay = 10 − 4 , batch size = 256). The ip threshold is set to 𝜏 = 3 . 0 . The safety predictor is a 3-layer bidirectional LSTM with hidden dimension 64 and dr opout 0.3, trained for 50 epochs with AdamW (lr = 10 − 2 , weight decay = 10 − 4 , batch size = 256, gra- dient clipping at 1.0). For traditional ML baselines, tuned hyperpa- rameters are: LR ( 𝐶 = 10 , solver = liblinear), DT (max_depth = 15, min_samples_leaf = 2), RF ( 𝑛 est = 50 , max_depth = None), SVM ( 𝐶 = 10 , RBF kernel), MLP (hidden layers = (128, 64), 𝑙 𝑟 = 0 . 01 ), KNN ( 𝑘 = 7 , distance-weighted, Manhattan metric), and GB ( 𝑛 est = 200 , max_depth = 7, lr = 0.1). For deep learning baselines, all mod- els share the same training conguration as the safety predic- tor (50 ep ochs, AdamW , lr = 10 − 2 , batch size = 256). Architecture- specic settings are: CNN (lters 32 → 64 → 64, kernel sizes 5/5/3), TF ( 𝑑 model = 64 , 4 heads, 2 layers), TFT ( hidden dim = 64, 4 heads, dropout = 0.1), and TimeMoE (hidden dim = 64, 4 experts, 3 expert layers). All experiments were conducted on a w orkstation equippe d with an Intel Xeon w9-3495X processor and 128 GB of RAM. The imple- mentation uses Python 3.10 and PyT orch 2.9 [ 58 ]. Each experiment Uncertainty-Guided Label Rebalancing for CPS Safety Monitoring Conference acronym ’XX, June 03–05, 2018, W oodsto ck, NY T able 1: Comparison of uncertainty integration strategies, including uLNR (ours), Plain (without uncertainty), Early Fusion , and Late Fu- sion . Strategy Precision Recall F1 p -value ˆ A 12 uLNR (ours) 0.792 ± 0.057 0.822 ± 0.033 0.806 ± 0.031 — — Plain 0.873 ± 0.052 0.498 ± 0.025 0.633 ± 0.022 < 0.001 1.000 (L) Early Fusion 0.851 ± 0.030 0.520 ± 0.017 0.645 ± 0.014 < 0.001 1.000 (L) Late Fusion 0.848 ± 0.036 0.526 ± 0.016 0.648 ± 0.009 < 0.001 1.000 (L) conguration was repeated across 30 random seeds. W e will release our code and data publicly for replication upon acceptance. 5 Results and Analysis W e present results for all the RQs in this section. All results are reported as mean ± std over 30 independent runs. T o demonstrate the signicance of the observed dierences, w e also report p -values from the Mann- Whitney U test and V argha-Delaney ee ct size ˆ 𝐴 12 (N=Negligible, S=Small, M=Medium, L=Large). 5.1 RQ0: Uncertainty Integration W e rst quantify the correlation between the predicted b ehavioral uncertainty score ˆ 𝑢 and the ground-truth safety label 𝑦 𝑠 at the win- dow level. Across 30 runs, the p oint-biserial correlation is moderate but signicant ( 𝑟 𝑝𝑏 = 0 . 444 ± 0 . 014 , 𝑝 < 0 . 001 ), indicating that unsafe windows tend to e xhibit higher uncertainty , but with sub- stantial overlap between safe and unsafe score distributions. This overlap is expected in our setting: many safe windows occur near challenging maneuvers or boundary conditions and can therefore exhibit elevated behavioral uncertainty but remain safe. This moderate correlation raises an important follow-up ques- tion: what is the most eective way to exploit uncertainty for safety prediction? W e investigate three integration strategies: (i) Early Fu- sion , which adds the uncertainty score as an additional input to the safety predictor; (ii) Late Fusion , which concatenates uncertainty to the model’s latent representation b efore classication; and (iii) uLNR , which uses uncertainty to rebalance the dataset by r elabeling highly uncertain safe windows prior to training the safety predic- tor . Early and Late Fusion are standard methods for incorp orating auxiliary signals correlated with the target task [29, 69]. T o identify the optimal strategy for integrating uncertainty , we implement each strategy in U-Balance , and evaluate their perfor- mance in the safety prediction task using F1 scores. T able 1 shows that uLNR , which uses uncertainty to rebalance the dataset, achieves the highest F1 score of 0 . 806 ± 0 . 031 , outperforming all alternatives. The Plain baseline, which uses no uncertainty information, achie ves an F1 score of 0.633, conrming that uncertainty provides a mean- ingful signal for safety prediction. Early Fusion achiev es an F1 of 0.645 and Late Fusion achieves a comparable F1 of 0.648. Both fu- sion strategies yield only modest impr ovements over the Plain baseline ( 1 . 2 pp and 1 . 5 pp , respectively), indicating that treating uncertainty as an additional dimension in vector representations does not substantially improv e the classier . A plausible explana- tion is that, under extr eme class imbalance, the classier r emains biased toward the majority class because the training distribution is unchanged. In contrast, uLNR improves F1 by 17 . 3 pp , 16 . 1 pp , and 15 . 8 pp over Plain, Early Fusion, and Late Fusion, respectively . All comparisons are statistically signicant ( 𝑝 < 0 . 001 ) with large eect sizes ( ˆ 𝐴 12 = 1 . 000 ). This result indicates that uncertainty is more eective as a rebalancing signal than as an additional feature: uLNR enriches the minority class with informative samples by re- shaping the training distribution using uncertainty information. W e further verify the generalizability of uLNR by applying it to all baseline methods, which yields consistent F1 gains of 5.4–25.1 pp across all models compared to Early/Late Fusion. Full results are provided in the repository due to page limitations. The answer to RQ0 is that uncertainty is moderately cor- related with safety , and uLNR is the optimal strategy for leveraging the uncertainty signal to predict safety . 5.2 RQ1: Safety Prediction Eectiveness and Eciency T able 2 compares U-Balance with 14 baselines spanning across deep learning, machine learning, and ensemble methods in terms of eectiveness (precision, recall, and F1 score) and eciency (#Params, per-sample inference latency). Eectiveness. U-Balance achieves the highest F1 score of 0 . 806 ± 0 . 031 , substantially outperforming all baselines. All comparisons are statistically signicant ( 𝑝 < 0 . 001 , Mann-Whitne y U test) with large eect sizes ( ˆ 𝐴 12 = 1 . 000 ), indicating that ev ery run of U-Balance outperforms every run of each baseline . With the exception of Supe- rialist, all baselines exhibit high precision (0.81–0.93) but lo w recall (0.25–0.53). These models correctly identify unsafe windows when they predict them, but miss the majority of truly unsafe windo ws, which is unacceptable in safety-critical applications. U-Balance , by contrast, achieves a recall of 0.822 while maintaining reason- able precision (0.792), demonstrating that uncertainty-guided lab el rebalancing recovers unsafe windo ws that baselines miss. Among the deep learning baselines , TimeMoE achieves the high- est F1 score (0.663), follow ed by CNN (0.643) and Bi-LSTM (0.633). TimeMoE benets from large-scale pretraining on diverse time- series data, yet U-Balance still outperforms it substantially by 14 . 3 pp , suggesting that uncertainty-aware features are more infor- mative for this task than general temporal representations learned from external data. Superialist [ 43 ] achieves the lowest F1 (0.175) among all approaches. Unlike the other baselines, Superialist is an unsupervise d anomaly detection method that op erates at the ight level rather than the window level, agging entire ights based on reconstruction error . While it attains moderate recall (0.366), its precision of 0.115 means that the vast majority of its predictions are false alarms, rendering it impractical for runtime safety monitoring at the window granularity required in our setting. Among machine learning baselines , MLP (0.656) and KNN (0.644) lead the group, while LR achieves only 0.314 due to its limited modeling capacity . The ensemble baselines , RF ( 𝐹 1 = 0 . 656 ) and GB ( 𝐹 1 = 0 . 633 ), perform comparably to the b est machine learning baselines, but still remain well below U-Balance . W e note, however , that these methods benet from ensemble learning by aggregating multiple decision models, which typically increases computational Conference acronym ’XX, June 03–05, 2018, W oodsto ck, NY A yotunde et al. T able 2: Eectiveness and eciency of U-Balance and baselines. Δ F1 shows the dierence in F1 between U-Balance and each baseline. #Params is the number of model parameters. "–" denotes non-parametric models. Lat. (s) represents the per-sample inference time in seconds. Eectiveness Eciency Method Precision Recall F1 Δ F1 p -value ˆ A 12 #Params Lat.(s) U-Balance 0.792 ± 0.057 0.822 ± 0.033 0.806 ± 0.031 — — — 285.9K 0.0045 Deep Learning Metho ds TFT 0.827 ± 0.078 0.484 ± 0.030 0.608 ± 0.029 +0.197 < 0.001 1.000 (L) 106.7K 0.0026 TimeMoE 0.909 ± 0.026 0.522 ± 0.012 0.663 ± 0.010 +0.143 < 0.001 1.000 (L) 113.4M 0.0045 Superialist 0.115 ± 0.002 0.366 ± 0.012 0.175 ± 0.004 +0.631 < 0.001 1.000 (L) 4.1K 0.3429 Bi-LSTM 0.873 ± 0.052 0.498 ± 0.025 0.633 ± 0.022 +0.172 < 0.001 1.000 (L) 238.7K 0.0012 CNN 0.859 ± 0.035 0.514 ± 0.016 0.643 ± 0.010 +0.163 < 0.001 1.000 (L) 25.8K 0.0010 Bi-GRU 0.813 ± 0.068 0.473 ± 0.030 0.596 ± 0.032 +0.209 < 0.001 1.000 (L) 180.0K 0.0011 TF 0.269 ± 0.174 0.474 ± 0.205 0.296 ± 0.126 +0.510 < 0.001 1.000 (L) 102.4K 0.0016 Machine Learning Methods MLP 0.893 ± 0.030 0.519 ± 0.012 0.656 ± 0.011 +0.150 < 0.001 1.000 (L) 21.2K 0.0008 SVM 0.813 ± 0.000 0.498 ± 0.000 0.618 ± 0.000 +0.188 < 0.001 1.000 (L) – 0.3847 DT 0.894 ± 0.018 0.471 ± 0.008 0.617 ± 0.007 +0.189 < 0.001 1.000 (L) 0.2K 0.0003 LR 0.410 ± 0.000 0.254 ± 0.000 0.314 ± 0.000 +0.491 < 0.001 1.000 (L) 0.1K 0.0004 KNN 0.810 ± 0.000 0.534 ± 0.000 0.644 ± 0.000 +0.162 < 0.001 1.000 (L) – 0.0627 Ensemble Metho ds RF 0.925 ± 0.027 0.509 ± 0.009 0.656 ± 0.003 +0.149 < 0.001 1.000 (L) 45.2K 0.1163 GB 0.904 ± 0.014 0.486 ± 0.005 0.633 ± 0.004 +0.173 < 0.001 1.000 (L) 10.0K 0.0059 cost. In contrast, U-Balance does not r ely on ensembling. This sug- gests that the performance gains of U-Balance stem from uLNR rather than from model aggregation, and could potentially be fur- ther improved if combined with an ensemble strategy . Though U-Balance fares substantially better than baselines, its eectiveness is still imperfe ct. The precision-recall trade-o can be adjusted by tuning the ip threshold 𝜏 to match specic application needs. For example, safety-critical applications may favor higher recall to detect as many unsafe cases as possible, while resource- constrained settings may prefer higher precision to reduce false alarms [ 51 ]. W e discuss the inuence of 𝜏 in Section 5.3.2 in detail. Imperfect ee ctiveness can also b e alleviated by combining dierent safety predictors or involving a human in the loop [38, 71]. Eciency . U-Balance contains 285.9K parameters and achieves a per-sample inference latency of 0.0045 s. This latency is comparable to other deep learning baselines such as TFT (0.0026 s) and TimeMoE (0.0045 s), indicating that the improved predictiv e performance of U-Balance does not come at the cost of increased inference time. Notably , U-Balance is substantially faster than Superialist (0.3429 s), which requires a full autoencoder reconstruction pass per sam- ple during inference. Among the machine learning baselines, SVM (0.3847 s) and KNN (0.0627 s) also incur higher latency despite their simpler architectures, as they rely on distance computations across training samples at infer ence time. Se veral classical models achieve lower latency (e.g., DT : 0.0003 s), but their prediction accuracy remains substantially lower . U-Balance maintains competitive in- ference eciency relative to the baselines e valuated under the same hardware conditions, while achieving substantially higher predic- tive performance. T able 3: Ablation study of the uncertainty predictor under dierent preprocessing settings and model ar chitectures. Preprocess Architecture Precision Recall F1 p -value ˆ A 12 Y es GatedMLP 0.792 ± 0.057 0.822 ± 0.033 0.806 ± 0.031 — — Y es Plain MLP 0.713 ± 0.058 0.757 ± 0.053 0.732 ± 0.042 < 0.001 0.944 (L) No Bi-LSTM 0.753 ± 0.090 0.690 ± 0.126 0.707 ± 0.066 < 0.001 0.902 (L) No Bi-GRU 0.727 ± 0.099 0.688 ± 0.087 0.697 ± 0.051 < 0.001 0.972 (L) No Bi-RNN 0.769 ± 0.080 0.652 ± 0.116 0.695 ± 0.068 < 0.001 0.938 (L) The answer to RQ1 is that U-Balance is eective for safety monitoring, substantially outperforms all baselines by at least 14 . 3 pp in F1 scores, while maintaining competitive inference eciency . 5.3 RQ2: Ablation Study 5.3.1 Ablation of Uncertainty Predictor . W e assess the individual contribution of the two key components in the uncertainty predic- tor , namely the preprocessing and the GatedMLP mo del. As shown in the rst two rows of T able 3, replacing the Gat- edMLP with a plain MLP reduces the F1 score from 0.806 to 0.732. The Mann- Whitney U test conrms that this reduction is statisti- cally signicant, with a large eect size ( 𝐴 12 = 0 . 944 ). This perfor- mance gap is likely due to the gating mechanism, which modulates information ow at the featur e level. By learning which distribu- tional features to emphasize and which to suppress, the Gate dMLP produces more discriminative uncertainty estimates. In contrast, a plain MLP treats all features uniformly , making it less eective at separating informative patterns from less rele vant ones. W e further compare U-Balance with sequential models that op- erate directly on raw telemetr y to assess the contribution of distribu- tional feature preprocessing. As sho wn in T able 3, U-Balance con- sistently outperforms all three variants, including Bi-LSTM (0.707), Uncertainty-Guided Label Rebalancing for CPS Safety Monitoring Conference acronym ’XX, June 03–05, 2018, W oodsto ck, NY T able 4: Ablation study of the ip threshold 𝜏 in uLNR . Lab els f lipped is the number of safe-labelled windows relabelle d as unsafe. Flip ratio is the proportion of training samples relabelled. Final ratio is the proportion of unsafe samples in the training set after relabelling. 𝝉 Labels ipped Flip ratio Final ratio Pr ecision Recall F1 0.5 7557 11.0% 12.2% 0.467 0.907 0.616 1.0 6602 9.6% 10.8% 0.500 0.900 0.643 1.5 5456 8.0% 9.2% 0.547 0.896 0.679 2.0 4146 6.1% 7.3% 0.608 0.878 0.718 2.5 2653 3.9% 5.1% 0.738 0.849 0.790 3.0 1140 1.7% 2.9% 0.792 0.822 0.806 3.5 0 0.0% 1.3% 0.873 0.498 0.633 Bi-GRU (0.697), and Bi-RNN (0.695). The Mann- Whitney U test shows that all impro vements are statistically signicant, with large eect sizes. These results highlight the value of the prepr ocessing step. In U A V telemetr y , uncertainty is often reecte d in the sta- tistical properties of kinematic signals within a window , such as variability , e xtreme deviations, and shifts in central tendency . By explicitly encoding such properties through distributional features, U-Balance provides a mor e eective representation for uncertainty prediction and, in turn, improves do wnstream safety prediction. 5.3.2 Ablation of uLNR . W e ablate uLNR along two dimensions: (1) the sensitivity of the ip threshold 𝜏 , and (2) a comparison against 14 established rebalancing strategies. Flip threshold 𝜏 . T able 4 reports results for 𝜏 ∈ { 0 . 5 , 1 . 0 , . . . , 3 . 5 } . The threshold has a substantial inuence on b oth the training com- position and the model’s behaviour . Lower values of 𝜏 ip more labels, up to 7,557 samples (11.0%) at 𝜏 = 0 . 5 , producing a more balanced dataset but at the cost of precision, as many relabelle d samples may not be genuinely unsafe. As 𝜏 increases, fewer labels are ipped, and precision improv es, but recall drops as the model sees fewer uncertain samples relab elled as unsafe. At 𝜏 = 3 . 5 , no labels are ippe d at all, and U-Balance achieves high precision but p oor recall. The b est F1 (0.806) is achieved at 𝜏 = 3 . 0 , which ips 1,140 samples (1.7%). Although the nal ratio (2.9%) remains low , uLNR ensures that the ipped samples lie near the decision boundary of the safety predictor , thereby improving the training of U-Balance on the noisiest cases. These results conrm that uLNR is sensitive to the choice of 𝜏 . Consequently , w e recommend that practitioners tune this hyperparameter using a held-out validation dataset, as demonstrate d in Section 4.5, to identify the optimal value for their CPS. Alternative Rebalancing Approaches. T able 5 compares uLNR ( U-Balance ) against 14 establishe d rebalancing strategies. uLNR achieves the highest recall and F1 score among all methods. Mann- Whitney U tests show that all the dierences between uLNR and alternative approaches are signicant ( 𝑝 -value < 0 . 001 ) with large eective sizes ( ˆ 𝐴 12 = 1 ). Notably , T -SMOTE, the current SOT A rebalancing method for time-series data, achieves the highest pre- cision (0.898) and the second highest F1 (0.675) after uLNR , but its low recall (0.541) indicates that it still fails to detect nearly half of unsafe windows. Among data-level methods, oversampling approaches such as SMOTE (0.556), AD ASYN (0.596), Borderline-SMOTE (0.540), RSG (0.571), and T -SMOTE(0.675) all fall substantially below uLNR (0.806) T able 5: Comparison of uLNR against SOT A rebalancing strategies. Strategy Precision Recall F1 p -value ˆ A 12 uLNR 0.792 ± 0.057 0.822 ± 0.033 0.806 ± 0.031 — — Data-level SMOTE 0.559 ± 0.170 0.581 ± 0.090 0.556 ± 0.102 < 0.001 1.000 (L) Borderline-SMOTE 0.524 ± 0.163 0.594 ± 0.051 0.540 ± 0.094 < 0.001 1.000 (L) T -SMOTE 0.898 ± 0.028 0.541 ± 0.014 0.675 ± 0.009 < 0.001 1.000 (L) ADASYN 0.623 ± 0.189 0.613 ± 0.052 0.596 ± 0.099 < 0.001 1.000 (L) RSG 0.605 ± 0.168 0.568 ± 0.061 0.571 ± 0.092 < 0.001 1.000 (L) RUS 0.438 ± 0.077 0.592 ± 0.065 0.499 ± 0.064 < 0.001 1.000 (L) OSS 0.852 ± 0.050 0.503 ± 0.022 0.631 ± 0.020 < 0.001 1.000 (L) CC 0.457 ± 0.083 0.632 ± 0.085 0.520 ± 0.041 < 0.001 1.000 (L) ReMix 0.649 ± 0.075 0.389 ± 0.030 0.484 ± 0.030 < 0.001 1.000 (L) SelMix 0.637 ± 0.093 0.415 ± 0.030 0.499 ± 0.036 < 0.001 1.000 (L) Algorithm-level CW 0.585 ± 0.283 0.630 ± 0.188 0.511 ± 0.194 < 0.001 1.000 (L) LDAM-DRW 0.073 ± 0.006 1.000 ± 0.000 0.136 ± 0.010 < 0.001 1.000 (L) GCL 0.757 ± 0.112 0.490 ± 0.056 0.590 ± 0.054 < 0.001 1.000 (L) MiSLAS 0.842 ± 0.070 0.497 ± 0.036 0.624 ± 0.036 < 0.001 1.000 (L) in F1 scores, with gaps ranging from 13.1 to 26.6 pp . Undersam- pling methods such as Random Under-Sampling (0.499) and Cluster Centroids (0.520) p erform even worse, indicating that simply re- moving majority-class samples discards informativ e training data rather than helping the classier . One-Sided Selection achieves the highest F1 scor e among all alternative approaches, but still substan- tially underperforms uLNR by 17 . 5 pp . Mixup-based methods ReMix and SelMix exhibit F1 scores b elow 0.5, as interpolating between samples from dierent classes does not pr oduce realistic training examples when the data has temporal structure. Algorithm-level methods show similarly limited ee ctiveness. MiSLAS achieves the highest F1 (0.624), followed by GCL (0.590) and Class W eighting (0.511). LD AM-DRW achieves the lowest F1 in the entire table (0.136) despite a recall of 1.000, indicating that it predicts nearly all windows as unsafe. This b ehaviour is consistent with LDAM-DRW , which assigns larger margins to minority classes based on class frequency . Under a 46:1 ratio, this margin becomes disproportionately large, pushing the decision boundar y so far toward the majority class that the model predicts nearly everything as minority (unsafe). This is consistent with known limitations of margin-based methods under extreme imbalance ratios [62]. The answer to RQ2 is that both the preprocessing and the GatedMLP architecture contribute signicantly to the eectiveness of safety prediction. uLNR is sensitive to the ip threshold hyperparameter and 𝜏 = 3 . 0 achieves the highest F1 score, outperforming alternative rebalancing techniques by at least 13 . 1 pp . 6 Threats to V alidity Internal validity refers to whether the obser ved performance improvements can b e attributed to U-Balance rather than to con- founding factors. A potential threat arises from the choice of hy- perparameters (e .g., learning rate, hidden layer size), which can aect model performance. T o mitigate this threat, we extensiv ely tune hyperparameters using grid search across all approaches com- pared, including U-Balance and the baselines. Detailed results are provided in our repository . Conference acronym ’XX, June 03–05, 2018, W oodsto ck, NY A yotunde et al. Conclusion V alidity concerns whether the obser ved dierences between U-Balance and the baselines are statistically signicant. T o reduce the inuence of randomness, we repeated each experi- ment 30 times and applied the Mann- Whitney U test, following the guidelines in the literature [4]. External V alidity concerns the extent to which our results gen- eralize beyond the evaluated setting. W e addr ess this threat from three aspects: dataset generalizability , method generalizability , and the availability of uncertainty labels. First, we evaluate U-Balance on a recent benchmarking U A V dataset collected by Khatiri et al . [43] , which pr ovides a str ong and repr esentative testbed with 1,498 ights totaling approximately 54 ight hours. Second, we examine the generalizability of uLNR by applying it to all baseline methods. The results show consistent improvements of 5.4 - 25.1 pp in F1 score across dierent methods, indicating that the approach is not tied to a specic model architecture. Due to space limitations, the full results are pro vided in the repositor y . Third, while U-Balance relies on uncertainty labels, obtaining such lab els in practice is not a fundamental barrier . Uncertainty can be automatically annotate d using domain-specic rules [ 43 ]. For example, a ight window can be agged as uncertain if the heading angle changes frequently within a short time period, indicating unstable navigation. Conse- quently , existing safety-monitoring datasets can be readily extended with uncertainty labels using similar rule-based procedures. 7 Related W ork In this section, we discuss related works about safety monitoring in CPS (Section 7.1) and dataset rebalancing techniques (Section 7.2). 7.1 Safety Monitoring in CPS Safety monitoring in CPS aims to detect hazar dous system states during operation and prevent violations of safety constraints. Prior research follows two main methodological directions: model-based and data-driven monitoring. Model-based safety monitoring relies on explicit system mo d- elling or formal spe cications to dene and verify safety proper- ties [ 48 ]. STP A [ 48 ] models safety as a control pr oblem, identifying hazards arising from unsafe interactions between the controller and the controlled process rather than from isolate d component failures. STL [ 24 , 53 ] measures the extent to which safety properties are satised or violated. However , these methods rely on accurate system and environmental models, and their guarantees degrade under model mismatch and as system complexity increases. Data-driven safety monitoring addresses these limitations by inferring safety-relevant patterns directly from operational data without requiring explicit system models. Unsupervised anomaly detection frameworks identify abnormal system states by agging statistical de viations fr om learned nominal behavior [ 13 , 43 ]. While eective for detecting novel faults, these metho ds cannot distin- guish between safety-critical anomalies and benign operational variations because they lack explicit knowledge of what constitutes an unsafe outcome. Supervised approaches address this by learn- ing to predict safety violations directly fr om labeled data. Several studies have used supervise d deep learning models to predict safety violations at runtime [ 12 , 51 , 64 ]. Howev er , supervised safety pre- dictors are fundamentally limited by the extr eme class imbalance inherent in CPS datasets, where unsafe events occur far less fre- quently than safe system states. Our work follows this research line but directly addresses the imbalance limitation by incorporat- ing uncertainty information from CPS operations to rebalance the training data and subsequently improve safety prediction. 7.2 Dataset Rebalancing Existing approaches to imbalanced learning ar e commonly grouped into two categories: data-level and algorithm-lev el methods [ 15 , 40 ]. Algorithm-level methods address imbalance by modifying the training objective to mitigate bias without altering the training data. Cost-sensitive learning penalizes misclassication of minority- class samples more heavily during training [ 26 ]. Class weighting scales the loss contribution according to inverse class frequency , i.e., by assigning larger loss weights to rar er classes [ 42 , 87 ]. LDAM- DRW [ 11 ] assigns larger classication margins to classes with fewer training samples, increasing the separation between minority and majority classes, and defers the application of class re-weighting to a later stage of training, allowing the model to rst learn an informative feature r epresentation before rebalancing. GCL [ 49 ] re- weights the contrastive loss so that minority-class pairs contribute more to representation learning. Mixup and Label-A ware Smooth- ing (MiSLAS) [ 86 ] applies lab el-aware smoothing that varies the smoothing intensity per class based on the number of class samples, reducing over-condent predictions for majority classes. Data-level methods rebalance class distributions through over- sampling or undersampling . Oversampling increases minority-class samples. For instance, SMOTE [ 14 ] generates synthetic minority samples by interpolating existing examples, while AD ASYN [ 34 ] extends SMOTE by generating more synthetic samples for mi- nority class examples that ar e challenging to classify . Borderline- SMOTE [ 31 ] generates samples near the class boundary , while Rare-class Sample Generator (RSG) [ 75 ] synthesizes minority-class samples in feature space based on patterns learned from majority- class data. T -SMOTE [ 85 ], the current SOT A oversampling method for imbalanced time-series classication, adapts SMOTE to time- series data by generating synthetic minority samples that preser ve temporal structure, particularly near class boundaries. Mixup-based methods such as ReMix [ 17 ] and SelMix [ 60 ] create new train- ing samples by interpolating samples from dierent classes [ 83 ]. In contrast, undersampling reduces majority-class samples. SOT A undersampling methods include One-Sided Selection (OSS) [ 6 ], which removes majority-class samples misclassied by a nearest- neighbour classier , and Cluster Centroids (CC) [ 52 ], which reduces the majority class by replacing each cluster with its centroid. LNR [ 36 ] adopts an alternative data-le vel strategy that stochasti- cally ips majority class labels near decision boundaries to mitigate imbalance without synthesizing new samples or reducing existing samples. Originally developed for image classication, LNR’s appli- cation to time-series data remains largely unexplored. T o the best of our knowledge, this paper presents the rst adaptation of LNR to time-series data by incorporating uncertainty information derived from CPS operations. Uncertainty-Guided Label Rebalancing for CPS Safety Monitoring Conference acronym ’XX, June 03–05, 2018, W oodsto ck, NY 8 Conclusion and Future W ork In this paper , we propose U-Balance , a novel safety monitoring approach for Cyber-P hysical Systems (CPSs). U-Balance rst trains an uncertainty predictor that summarizes each telemetry window into distributional kinematic features and outputs an uncertainty score. It then applies an uncertainty-guided LNR ( uLNR ) mechanism that probabilistically relabels safe-labeled windows with unusually high uncertainty as unsafe, enriching the minority class with infor- mative boundary samples without synthesizing new data. Finally , a safety predictor is trained on the rebalanced dataset for runtime safety monitoring. Our experiments show that uncertainty is mo derately but sig- nicantly correlated with safety , and that uLNR is the optimal strat- egy for integrating uncertainty information into safety prediction, compared to direct Early/Late Fusion. Further study shows that U-Balance achieves an F1 scor e of 0.806 in safety prediction, sub- stantially outperforming the baselines by at least 14.3 percentage points. Ablation studies conrm the use of preprocessing and Gat- edMLP in the uncertainty predictor , and the uLNR contribute signif- icantly to the overall eectiveness of U-Balance . Future work includes evaluating U-Balance across additional CPS domains, such as autonomous submarines, to assess generalis- ability across sensor modalities and operational settings. W e also plan to investigate alternative uncertainty estimation techniques, such as MC Dropout and Deep Ensembles, to better understand how the accuracy of the uncertainty estimates inuences the ee c- tiveness of rebalancing. 9 Acknowledgement This publication has emanated from r esearch conducted with the nancial support of T aighde Éireann – Resear ch Ireland under Grant number 13/RC/2094_2. References [1] Moloud Abdar , Farhad Pourpanah, Sadiq Hussain, Dana Rezazadegan, Li Liu, Mo- hammad Ghavamzadeh, Paul Fieguth, Xiaochun Cao, Abbas Khosravi, U Rajendra Acharya, et al . 2021. A review of uncertainty quantication in deep learning: T echniques, applications and challenges. Information fusion 76 (2021), 243–297. [2] Marian Sorin Adam, Morten Larsen, Kjeld Jensen, and Ulrik Pagh Schultz. 2016. Rule-based dynamic safety monitoring for mobile robots. Journal of Software Engineering for Rob otics 7, 1 (2016), 120–141. [3] Sorin Adam, Morten Larsen, Kjeld Jensen, and Ulrik Pagh Schultz. 2014. T owards rule-based dynamic safety monitoring for mobile robots. In International Confer- ence on Simulation, Modeling, and Programming for A utonomous Robots . Springer , 207–218. [4] Andrea Arcuri and Lionel Briand. 2011. A practical guide for using statistical tests to assess randomized algorithms in software engine ering. In Proceedings of the 33rd International Conference on Software Engineering (W aikiki, Honolulu, HI, USA) (ICSE ’11) . Association for Computing Machiner y , New Y ork, N Y , USA, 1–10. doi:10.1145/1985793.1985795 [5] Batuhan Bakirarar and Atilla Halil Elhan. 2023. Class weighting technique to deal with imbalanced class problem in machine learning: Methodological research. Türkiye Klinikleri Biyoistatistik 15, 1 (2023), 19–29. [6] Gustavo EAP A Batista, Andre CPLF Carvalho, and Maria Carolina Monard. 2000. Applying one-sided selection to unbalanced datasets. In Mexican International Conference on A rticial Intelligence . Springer , 315–325. [7] Kirstie Bellman, Jean Botev , Ada Diaconescu, Lukas Esterle, Christian Gruhl, Christopher Landauer , Peter R Lewis, Phyllis R Nelson, Evangelos Pournaras, An- thony Stein, et al . 2021. Self-improving system integration: Mastering continuous change. Future Generation Computer Systems 117 (2021), 29–46. [8] Christopher M Bishop and Nasser M Nasrabadi. 2006. Pattern recognition and machine learning . V ol. 4. Springer. [9] Said Y acine Boulahia, Abdenour Amamra, Mohamed Ridha Madi, and Said Daikh. 2021. Early , intermediate and late fusion strategies for robust de ep learning-based multimodal action recognition. Machine Vision and A pplications 32, 6 (2021), 121. [10] Le o Breiman. 2001. Random forests. Machine learning 45, 1 (2001), 5–32. [11] Kaidi Cao, Colin W ei, Adrien Gaidon, Nikos Arechiga, and T engyu Ma. 2019. Learning imbalance d datasets with label-distribution-aware margin loss. Ad- vances in neural information processing systems 32 (2019). [12] Ferhat Ozgur Catak, Tao Yue, and Shaukat Ali. 2022. Uncertainty-aware pre- diction validator in deep learning models for cyber-physical system data. ACM Transactions on Software Engineering and Metho dology (TOSEM) 31, 4 (2022), 1–31. [13] V arun Chandola, Arindam Banerjee, and Vipin Kumar . 2009. Anomaly dete ction: A survey . ACM computing surveys (CSUR) 41, 3 (2009), 1–58. [14] Nitesh V Chawla, Kevin W Bowyer , Lawrence O Hall, and W Philip Kegelmey er . 2002. SMOTE: synthetic minority over-sampling technique. Journal of articial intelligence research 16 (2002), 321–357. [15] Wuxing Chen, Kaixiang Y ang, Zhiwen Y u, Yifan Shi, and CL Philip Chen. 2024. A survey on imbalanced learning: latest research, applications and future directions. A rticial Intelligence Review 57, 6 (2024), 137. [16] K yunghyun Cho, Bart V an Merriënboer, Çağlar Gulçehre, Dzmitry Bahdanau, Fethi Bougares, Holger Schwenk, and Y oshua Bengio . 2014. Learning phrase representations using RNN encoder–decoder for statistical machine translation. In Proceedings of the 2014 conference on empirical methods in natural language processing (EMNLP) . 1724–1734. [17] Hsin-Ping Chou, Shih-Chieh Chang, Jia- Y u Pan, W ei W ei, and Da-Cheng Juan. 2020. Remix: rebalanced mixup. In European conference on computer vision . Springer , 95–110. [18] Thomas Cov er and Peter Hart. 1967. Nearest neighbor pattern classication. IEEE transactions on information theory 13, 1 (1967), 21–27. [19] David R Cox. 1958. The regression analysis of binary sequences. Journal of the Royal Statistical Society Series B: Statistical Methodology 20, 2 (1958), 215–232. [20] Linda Crocker and James Algina. 1986. Introduction to classical and modern test theory . ERIC. [21] Raaello D’ Andrea. 2014. Guest editorial can drones deliver? IEEE Transactions on Automation Science and Engineering 11, 3 (2014), 647–648. [22] Rahul Dey and Fathi M Salem. 2017. Gate-variants of gate d recurrent unit (GRU) neural networks. In 2017 IEEE 60th international midwest symposium on circuits and systems (MWSCAS) . IEEE, 1597–1600. [23] Andrea Di Sorbo, Fiorella Zampetti, Aaron Visaggio, Massimiliano Di Penta, and Sebastiano Panichella. 2023. Automated identication and qualitative characteri- zation of safety concerns reported in uav software platforms. ACM Transactions on Software Engineering and Methodology 32, 3 (2023), 1–37. [24] Alexandre Donzé and Oded Maler . 2010. Robust satisfaction of temporal logic over real-valued signals. In International conference on formal modeling and analysis of time d systems . Springer , 92–106. [25] W enli Duo, MengChu Zhou, and Abdullah Abusorrah. 2022. A survey of cyber attacks on cyber physical systems: Recent advances and challenges. IEEE/CAA Journal of Automatica Sinica 9, 5 (2022), 784–800. [26] Charles Elkan. 2001. The foundations of cost-sensitive learning. In International joint conference on articial intelligence , V ol. 17. Lawrence Erlbaum A ssociates Ltd, 973–978. [27] Manuel Fernández-Delgado, Eva Cernadas, Senén Barr o, and Dinani Amorim. 2014. Do we need hundreds of classiers to solve real world classication problems? The journal of machine learning research 15, 1 (2014), 3133–3181. [28] Jerome H Friedman. 2001. Greedy function approximation: a gradient boosting machine. Annals of statistics (2001), 1189–1232. [29] Konrad Gadzicki, Razieh Khamsehashari, and Christoph Zetzsche. 2020. Early vs late fusion in multimodal convolutional neural networks. In 2020 IEEE 23rd international conference on information fusion (F USION) . IEEE, 1–6. [30] Ben Grindley , K atie Phillips, Katie J Parnell, T om Cherrett, James Scanlan, and Katherine L Plant. 2024. Over a decade of U A V incidents: A human factors analysis of causal factors. A pplied Ergonomics 121 (2024), 104355. [31] Hui Han, W en-Y uan W ang, and Bing-Huan Mao. 2005. Borderline-SMOTE: a new over-sampling method in imbalanced data sets learning. In International conference on intelligent computing . Springer , 878–887. [32] Liping Han, Shaukat Ali, Tao Yue, Aitor Arrieta, and Maite Arratibel. 2023. Uncertainty-aware robustness assessment of industrial ele vator systems. ACM Transactions on Software Engineering and Methodology 32, 4 (2023), 1–51. [33] Sigurd Haugse. 2022. Investigation of U A V related incidents and accidents . Master’s thesis. UiT The Arctic University of Norway . [34] Haibo He, Y ang Bai, Edwardo A Gar cia, and Shutao Li. 2008. ADASYN: A daptive synthetic sampling approach for imbalanced learning. In 2008 IEEE international joint conference on neural networks (IEEE world congress on computational intelli- gence) . Ieee, 1322–1328. [35] Mohammad Hossin and Md Nasir Sulaiman. 2015. A review on evaluation metrics for data classication evaluations. International journal of data mining & knowledge management process 5, 2 (2015), 1. [36] Guangzheng Hu, Feng Liu, Mingming Gong, Guanghui W ang, and Liuhua Peng. 2025. Learning Imbalanced Data with Benecial Label Noise. In Proceedings of the 42nd International Conference on Machine Learning (Proceedings of Machine Conference acronym ’XX, June 03–05, 2018, W oodsto ck, NY A yotunde et al. Learning Research, V ol. 267) , Aarti Singh, Maryam Fazel, Daniel Hsu, Simon Lacoste-Julien, Felix Berkenkamp, T egan Maharaj, Kiri W agsta, and Jerr y Zhu (Eds.). PMLR, 24535–24569. https://proceedings.mlr.pr ess/v267/hu25p.html [37] Zhiheng Huang, W ei Xu, and Kai Yu. 2015. Bidirectional LSTM-CRF models for sequence tagging. arXiv preprint arXiv:1508.01991 (2015). [38] Nicholas Jerey , Qing T an, and José R Villar. 2024. Using ensemble learning for anomaly detection in cyber–physical systems. Electronics 13, 7 (2024), 1391. [39] Y uchen Jiang, Shen Yin, and Okyay Kaynak. 2018. Data-driven monitoring and safety control of industrial cyber-physical systems: Basics and beyond. IEEe Access 6 (2018), 47374–47384. [40] Justin M Johnson and Taghi M Khoshgoftaar . 2019. Survey on de ep learning with class imbalance. Journal of big data 6, 1 (2019), 27. [41] Piotr Jan Kasprzyk and Anna Konert. 2021. Reporting and investigation of Unmanned Aircraft Systems (U AS) accidents and serious incidents. Regulatory perspective. Journal of Intelligent & Robotic Systems 103, 1 (2021), 3. [42] Salman H Khan, Munawar Hayat, Mohammed Bennamoun, Fer dous A Sohel, and Roberto T ogneri. 2017. Cost-sensitive learning of deep feature representations from imbalanced data. IEEE transactions on neural networks and learning systems 29, 8 (2017), 3573–3587. [43] Sajad Khatiri, Fatemeh Mohammadi Amin, Sebastiano Panichella, and Paolo T onella. 2025. When uncertainty leads to unsafety: Empirical insights into the role of uncertainty in unmanne d aerial vehicle safety . Empirical Software Engineering 30, 6 (2025), 166. [44] Sajad Khatiri, Sebastiano Panichella, and Paolo T onella. 2023. Simulation-base d T est Case Generation for Unmanned Aerial V ehicles in the Neighborhood of Real Flights. In 2023 IEEE Conference on Software T esting, V erication and V alidation (ICST) . 281–292. doi:10.1109/ICST57152.2023.00034 [45] Sajad Khatiri, Sebastiano Panichella, and Paolo T onella. 2023. Simulation-base d test case generation for unmanned aerial vehicles in the neighborhood of real ights. In 2023 IEEE Conference on Software Testing, V erication and Validation (ICST) . IEEE, 281–292. [46] Diana Kornbrot. 2014. Point biserial correlation. Wiley StatsRef: Statistics Reference Online (2014). [47] Y ann LeCun, Léon Bottou, Y oshua Bengio, and Patrick Haner . 2002. Gradient- based learning applied to document recognition. Proc. IEEE 86, 11 (2002), 2278– 2324. [48] Nancy Leveson, Chris Wilkinson, Cody Fleming, John Thomas, and Ian T racy . 2014. A comparison of STP A and the ARP 4761 safety assessment process. Massachusetts Institute of T echnology , Cambridge, MA (2014). [49] Mengke Li, Yiu-ming Cheung, and Y ang Lu. 2022. Long-tailed visual recognition via gaussian clouded logit adjustment. In Procee dings of the IEEE/CVF conference on computer vision and pattern recognition . 6929–6938. [50] Bryan Lim, Sercan Ö Arık, Nicolas Loe, and Tomas Pster . 2021. T emp oral fusion transformers for interpretable multi-horizon time series forecasting. International journal of forecasting 37, 4 (2021), 1748–1764. [51] Vivian Lin, Ramne et Kaur , Y ahan Yang, Souradeep Dutta, Yiannis Kantaros, Anirban Roy , Susmit Jha, Oleg Sokolsky , and Insup Lee. 2025. Safety monitoring for learning-enabled cyber-physical systems in out-of-distribution scenarios. In Proceedings of the ACM/IEEE 16th International Conference on Cyber-Physical Systems (with CPS-Io T W eek 2025) . 1–11. [52] J MacQueen. 1967. Multivariate obser vations. In Procee dings ofthe 5th Berke- ley symp osium on mathematical statisticsand probability , V ol. 1. University of California press Oakland, CA, USA, 281–297. [53] Oded Maler and Dejan Nickovic. 2004. Monitoring temporal properties of con- tinuous signals. In International symposium on formal techniques in real-time and fault-tolerant systems . Springer, 152–166. [54] Rhiannon Michelmore, Matthew Wicker, Luca Laurenti, Luca Cardelli, Y arin Gal, and Marta K wiatkowska. 2020. Uncertainty quantication with statistical guarantees in end-to-end autonomous driving control. In 2020 IEEE international conference on robotics and automation (ICRA) . IEEE, 7344–7350. [55] Ojas Ankush Naik, Pooja Shyamsundar , and Navrati Saxena. 2025. AI-Enabled Anticipatory Handover Predictions in 5G Networks. In 2025 International Confer- ence on Emerging Trends in Networks and Computer Communications (ETNCC) . IEEE, 61–68. [56] Vinod Nair and Georey E. Hinton. 2010. Rectied linear units improve restricted boltzmann machines. In Proceedings of the 27th International Conference on Inter- national Conference on Machine Learning (Haifa, Israel) (ICML’10) . Omnipress, Madison, WI, USA, 807–814. [57] Bhushankumar Nemade, Kiran Kishor Maharana, Vikram Kulkarni, Surajit Mon- dal, GS Pradeep Ghantasala, Amal Al-Rashee d, Masresha Getahun, and Ben Oth- man Souene. 2024. IoT -base d automated system for water-related disease prediction. Scientic Reports 14, 1 (2024), 29483. [58] Adam Paszke, Sam Gross, Francisco Massa, Adam Lerer , James Bradbury , Gregor y Chanan, T revor Killeen, Zeming Lin, Natalia Gimelshein, Luca Antiga, et al . 2019. Pytorch: An imperative style, high-performance deep learning library. Advances in neural information processing systems 32 (2019). [59] J. Ross Quinlan. 1986. Induction of decision trees. Machine learning 1, 1 (1986), 81–106. [60] Shrinivas Ramasubramanian, Harsh Rangwani, Sho T akemori, Kunal Samanta, Y uhei Umeda, and V enkatesh Babu Radhakrishnan. 2024. Selective Mixup Fine- T uning for Optimizing Non-De composable Obje ctives. arXiv preprint arXiv:2403.18301 (2024). [61] David E Rumelhart, Georey E Hinton, and Ronald J Williams. 1986. Learning representations by back-propagating errors. nature 323, 6088 (1986), 533–536. [62] Bhargava Satya, Rama Krishna Gorthi, et al . 2024. Eective-LDAM: An Eective Loss Function T o Mitigate Data Imbalance for Robust Chest X-Ray Disease Classication. arXiv preprint arXiv:2407.04953 (2024). [63] Sepehr Shari, Andrea Stocco, and Lionel C Briand. 2025. System safety monitor- ing of learned components using temporal metric forecasting. ACM Transactions on Software Engineering and Methodology 34, 6 (2025), 1–43. [64] Sepehr Shari, Andrea Stocco, and Lionel C Briand. 2025. System safety monitor- ing of learned components using temporal metric forecasting. ACM Transactions on Software Engineering and Methodology 34, 6 (2025), 1–43. [65] Sanjiv Sharma and D Chakravarti. 2005. UA V operations: An analysis of incidents and accidents with human factors and crew resource management perspective. Indian Journal of Aerospace Medicine 49, 1 (2005), 29–36. [66] Xiaoming Shi, Shiyu W ang, Y uqi Nie, Dianqi Li, Zhou Y e, Qingsong W en, and Ming Jin. 2024. Time-moe: Billion-scale time series foundation models with mixture of experts. arXiv preprint arXiv:2409.16040 (2024). [67] Sima Siami-Namini, Neda T avakoli, and Akbar Siami Namin. 2019. The perfor- mance of LSTM and BiLSTM in forecasting time series. In 2019 IEEE International conference on big data (Big Data) . IEEE, 3285–3292. [68] Rohan Sinha, Edward Schmerling, and Marco Pavone. 2023. Closing the loop on runtime monitors with fallback-safe mpc. In 2023 62nd IEEE Conference on Decision and Control (CDC) . IEEE, 6533–6540. [69] Cees G. M. Sno ek, Marcel W orring, and Arnold W . M. Smeulders. 2005. Early versus late fusion in semantic video analysis. In Proceedings of the 13th Annual ACM International Conference on Multimedia (Hilton, Singapore) (MULTIMEDIA ’05) . Association for Computing Machinery , New Y ork, NY, USA, 399–402. doi:10. 1145/1101149.1101236 [70] Ingo Steinwart and Andreas Christmann. 2008. Support vector machines . Springer Science & Business Media. [71] Andrea Stocco, Michael W eiss, Marco Calzana, and Paolo T onella. 2020. Mis- behaviour prediction for autonomous driving systems. In Proceedings of the ACM/IEEE 42nd international conference on software engineering . 359–371. [72] Shuai- W en Tang, Zhi-Jie Zhou, Chang-Hua Hu, Fu-Jun Zhao, and Y ou Cao. 2020. A new evidential reasoning rule-based safety assessment metho d with sensor reliability for complex systems. IEEE Transactions on Cybernetics 52, 5 (2020), 4027–4038. [73] Seema V arma. 2006. Preliminary item statistics using point-biserial correlation and p-values. Educational Data Systems Inc.: Morgan Hill CA. Retrieved 16, 07 (2006), 1–7. [74] Ashish Vaswani, Noam Shazeer , Niki Parmar, Jakob Uszkoreit, Llion Jones, Aidan N Gomez, Łukasz Kaiser , and Illia Polosukhin. 2017. Attention is all you need. Advances in neural information processing systems 30 (2017). [75] Jianfeng W ang, Thomas Lukasiewicz, Xiaolin Hu, Jianfei Cai, and Zhenghua Xu. 2021. Rsg: A simple but eective module for learning imbalanced datasets. In Proceedings of the IEEE/CVF conference on computer vision and pattern recognition . 3784–3793. [76] Y untao W ang, Zhou Su, Qichao Xu, Ruidong Li, T om H Luan, and Pinghui W ang. 2023. A secure and intelligent data sharing scheme for U A V -assisted disaster rescue. IEEE/ACM Transactions on Networking 31, 6 (2023), 2422–2438. [77] Patrick W olf and Rasmus Adler. 2025. Enhancing Safety and Performance of Autonomous Systems in Open Contexts Through the Layers of Protection Ar- chitecture (LOP AAS). In 2025 20th European Dep endable Computing Conference Companion Proce edings (EDCC-C) . IEEE, 207–212. [78] Linli Xu, Lie Guo , Pingshu Ge, and Xu W ang. 2022. Eect of multiple monitoring requests on vigilance and readiness by measuring eye mo vement and takeover performance. Transportation research part F: trac psychology and behaviour 91 (2022), 179–190. [79] Qinghua Xu, Shaukat Ali, and T ao Y ue. 2021. Digital twin-based anomaly detec- tion in cyber-physical systems. In 2021 14th IEEE Conference on Software Testing, V erication and V alidation (ICST) . IEEE, 205–216. [80] Qinghua Xu, Shaukat Ali, and T ao Y ue. 2023. Digital twin-based anomaly detec- tion with curriculum learning in cyber-physical systems. ACM Transactions on Software Engineering and Methodology 32, 5 (2023), 1–32. [81] W ei Xue, Bo Y ang, T sutomu Kaizuka, and Kimihiko Nakano. 2018. A fallback approach for an automated vehicle encountering sensor failure in monitoring environment. In 2018 IEEE Intelligent V ehicles Symposium (I V) . IEEE, 1807–1812. [82] Pabelco Zambrano, Fernanda Calderon, Héctor Villegas, Jonathan Paillacho, Doménica Pazmiño, and Miguel Realpe. 2023. U A V Remote Sensing applications and current trends in crop monitoring and diagnostics: A Systematic Literature Review . In 2023 IEEE 13th International Conference on Pattern Re cognition Systems (ICPRS) . IEEE, 1–9. [83] Hongyi Zhang, Moustapha Cisse, Y ann N Dauphin, and David Lopez-Paz. 2017. mixup: Beyond empirical risk minimization. arXiv preprint Uncertainty-Guided Label Rebalancing for CPS Safety Monitoring Conference acronym ’XX, June 03–05, 2018, W oodsto ck, NY (2017). [84] Liangliang Zhao, Shuyi Huang, and Junsong Li. 2025. Multimodal Data Fusion Research Review: From T raditional Methods to Unsuper vised Learning Methods. In Proceedings of the 2025 2nd Symposium on Big Data, Neural Networks, and Deep Learning . 249–254. [85] Pu Zhao, Chuan Luo, Bo Qiao , Lu W ang, Saravan Rajmohan, Qingwei Lin, and Dongmei Zhang. 2022. T -SMOTE: T emp oral-oriented Synthetic Minority Over- sampling T echnique for Imbalanced Time Series Classication.. In IJCAI . 2406– 2412. [86] Zhisheng Zhong, Jiequan Cui, Shu Liu, and Jiaya Jia. 2021. Improving calibration for long-tailed r ecognition. In Proceedings of the IEEE/CVF conference on computer vision and pattern recognition . 16489–16498. [87] Min Zhu, Jing Xia, Xiaoqing Jin, Molei Yan, Guolong Cai, Jing Y an, and Gang- min Ning. 2018. Class weights random forest algorithm for processing class imbalanced medical data. IEEE access 6 (2018), 4641–4652. Received 20 February 2007; revised 12 March 2009; accepted 5 June 2009
Original Paper
Loading high-quality paper...
Comments & Academic Discussion
Loading comments...
Leave a Comment