The Role of Data and Metrics in Measuring Inequality Worldwide. A Tribute to Giovanni Andrea Cornia's Lifelong Work on the World Ginis
This paper pays tribute to Professor Giovanni Andrea Cornia's lifelong contributions to the measurement of global inequality. We review twelve world and regional databases of the Gini coefficient, illustrate their coverage, overlapping, and data gaps…
Authors: Lidia Ceriani, Paolo Verme
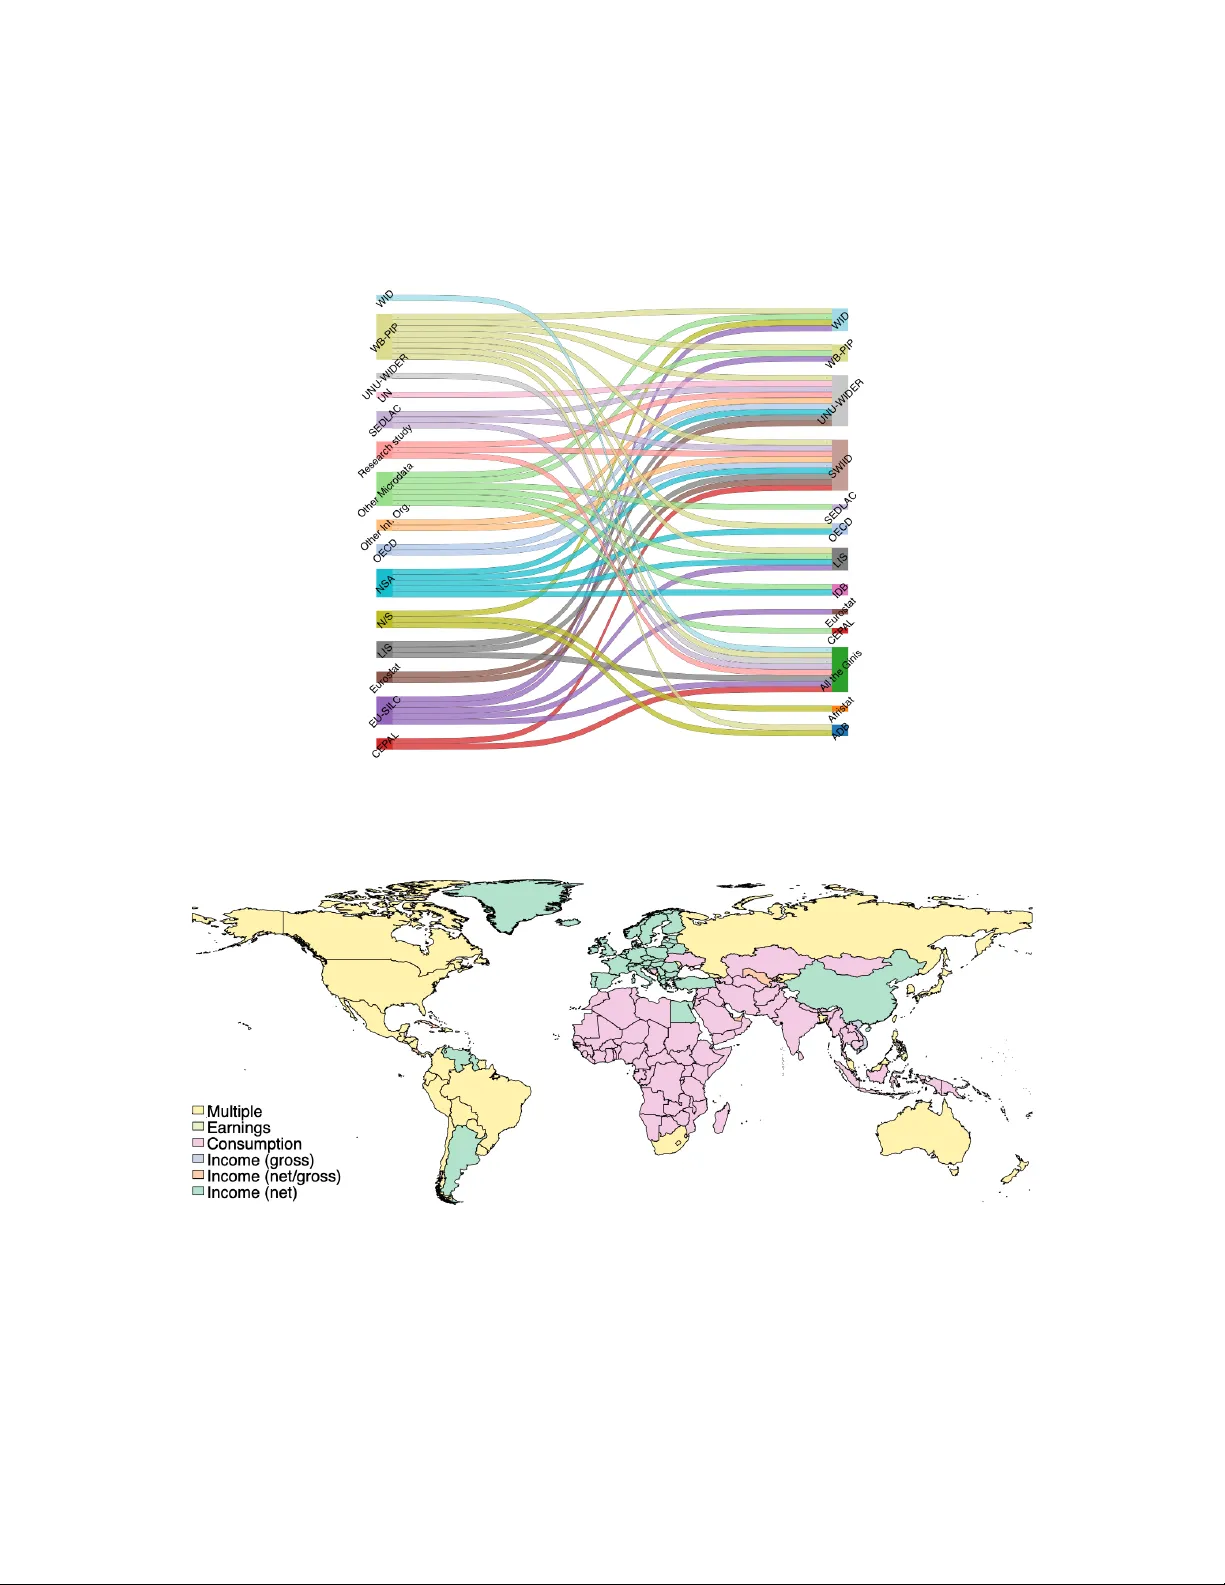
The Role of Data and Metrics in Measuring Inequalit y W orldwide A T ribute to Giovanni A ndr e a Cornia’s Lifelong Work on the World Ginis Lidia Ceriani ∗ Univ ersity of V erona P aolo V erme † Univ ersit y of Bologna Abstract This pap er pa ys tribute to Professor Giov anni Andrea Cornia’s lifelong contribu- tions to the measuremen t of global inequalit y . W e review tw elve w orld and regional databases of the Gini co efficient, illustrate their cov erage, ov erlapping, and data gaps, and analyse the ma jor sources of discrepancy among published Ginis. Merging all databases into a unified collection of o ver 122,000 observ ations spanning 222 countries from 1867 to 2024, we do cumen t how differences in welfare metrics, reference units, sub-metric definitions, post-survey adjustmen ts, and survey design pro duce Gini esti- mates that diverge considerably—sometimes by as muc h as 50 p ercentage points—for the same country and year. W e quantify pairwise cross-database discordance, do cu- men t the income–consumption Gini gap by region and income group, and discuss the con tributions of welfare metric and equiv alence scale choices to cross-database disp er- sion. W e extend the analysis with a dedicated discussion of comparability across time and across measurement dimensions, sho wing ho w m ultiple lay ers of metho dological c hoice interact to mak e any single Gini figure a pro duct of a complex chain of decisions that are rarely fully disclosed. Our analysis confirms that the choice of welfare metric remains the single most imp ortant source of cross-country non-comparability , while sub-metric definitions and equiv alence scales introduce further systematic differences that are routinely o verlooked in comparative w ork. JEL Co des: D31, D63, I31, O15, C81 Keyw ords: Gini co efficient; income inequalit y; consumption; welfare measuremen t; cross- coun try comparabilit y; global databases; Gio v anni Andrea Cornia ∗ lidia.ceriani@univr.it † Corresp onding author: paolo.verme@unibo.it 1 1 In tro duction Gio v anni Andrea Cornia (1947–2024) dev oted m uch of his in tellectual life to understanding ho w inequality shap es h uman developmen t. F rom his pioneering w ork with UNICEF in the 1980s on the human costs of structural adjustment [Cornia et al., 1987], to his role in establishing and maintaining one of the first comprehensive world databases of inequality statistics, to his sustained sc holarly engagemen t with the determinants and consequences of income inequality across the dev elopment sp ectrum, Cornia never ceased asking the fundamen tal question: what are the actual distributional consequences of economic policies and structural change? 1 Cornia’s con tribution to the measurement of global inequalit y is among the most en- during of his legacies. In the late 1990s and early 2000s, he play ed a central role at UNU- WIDER in building and expanding the W orld Income Inequality Database (WI ID)—a pro ject that grew out of the earlier Deininger–Squire dataset [Deininger and Squire, 1996] and ev olved into one of the mos t comprehensive collections of inequality statistics ev er assem bled. By providing researchers worldwide with a single p oint of access to Gini co effi- cien ts, income shares, and distributional data drawn from hundreds of household surv eys and secondary sources, the WI ID transformed empirical inequality researc h. It allow ed sc holars to mov e b eyond country-specific studies and ask genuinely global questions ab out the tra jectory of inequality , the relationship b etw een gro wth and distribution, and the effects of trade lib eralisation, fiscal p olicy , and technological change on income disp ersion. Cornia used this infrastructure, and the researc h it enabled, to adv ance a substantiv e agenda. His edited v olume on inequality in the era of liberalisation [Cornia, 2004] syn- thesised evidence from dozens of countries and do cumen ted a widespread tendency tow ard rising inequalit y during the 1980s and 1990s—a finding that c hallenged the optimistic pre- dictions of trade-based mo dels and highlighted the distributive costs of rapid op ening. His w ork with Kiiski and Addison on post-WWI I trends in income distribution [Cornia and Kiiski, 2001, Cornia et al., 2004] provided some of the most careful empirical documen- tation of the so-called “inequalit y turn” of the late tw entieth cen tury . And his abiding in terest in Latin America—a region that exp erienced some of the most dramatic swings in inequalit y of the past half cen tury—generated analysis that was simultaneously rigorous, p olicy-relev an t, and historically informed. This pap er pays tribute to Professor Cornia’s contributions b y revisiting the world of Gini data that he help ed create and taking sto c k of where the science of global inequality measuremen t stands to da y . Our exercise cov ers t w elve world and regional databases of the Gini co efficient and pursues fiv e ob jectives: (1) reviewing the databases and their metho d- ological c haracteristics; (2) illustrating co verage, ov erlapping, and data gaps; (3) under- standing sources of discrepancy among published Ginis; (4) quantifying the magnitude of 1 This pap er was originally prepared for the conference “Ine quality and Development R evisite d: The L e gacy of Giovanni A ndr e a Cornia” , organised in the summer of 2025 by the Universit y of Florence in memory of Giov anni Andrea Cornia (1947–2024). 1 these discrepancies; and (5) generating a larger, consolidated collection of world Ginis that the research communit y can use as a starting p oin t for future work. This is no easy task because understanding the Gini figures published b y different databases requires a level of detail that most databases do not provide. No database review ed here supplies a complete list of items included in the w elfare metric used to estimate the Gini. The quan tit y and qualit y of metadata v aries widely across sources. This is therefore a necessarily incomplete exercise, but one that aims to improv e on the current state of understanding of the world Ginis—a goal that Cornia would ha v e recognised and endorsed. The pap er is organised as follo ws. Section 2 describ es the tw elve databases we co ver and their key metho dological characteristics. Section 3 describ es the new unified database and provides st ylised facts ab out global Gini co verage. Section 4 analyses the main sources of discrepancy in depth. Section 5 quantifies cross-database discordance through a series of new empirical exercises. Section 6 uses Colombia as a detailed country illustration, and Section 7 concludes with reflections on Cornia’s legacy . 2 Global and Regional Collections of Gini Measures W e cov er t welv e databases, distinguishing b etw een global and regional databases, and b et ween primary and secondary data sources. In this con text, primary sources refer to databases that compute inequalit y indicators—such as Gini co efficients—directly from the underlying micro data (e.g., household surveys or administrativ e records). Secondary sources, by contrast, are collections of inequality indicators compiled from other studies, rep orts, or databases, rather than calculated directly from micro data by the data pro vider. The complete list is pro vided b elo w; A detailed methodological o verview of eac h is a v ailable up on request. Global databases • Primary sour c es – LIS — Luxembourg Income Study (Inequalit y and Po v ert y Key Figures) – W orld Bank — Po vert y and Inequality Platform (PIP) – WID — W orld Inequality Database (Paris Sc ho ol of Economics and the Univer- sit y of California, Berkeley) • Se c ondary sour c es – UNU-WIDER — W orld Income Inequalit y Database (WI ID) – All the Ginis (A TG) — Stone Cen ter on So cio-Economic Inequalit y (maintained b y Brank o Milano vic) 2 – SWIID — Standardised W orld Income Inequality Database (maintained b y F rederic k Solt) Regional databases • Primary sour c es – CEP AL/ECLA C — Economic Commission for Latin America and the Caribb ean – CEDLAS — Cen ter of Distributive, Lab or and So cial Studies (SEDLAC database) – IDB — Inter-American Developmen t Bank (So ci´ ometro) – Eurostat — Income and Living Conditions (EU-SILC) • Se c ondary sour c es – OECD — Income Distribution Database (IDD) – ADB — Asian Developmen t Bank (Key Indicators Database) – Afristat — Conditions de vie des m´ enages These tw elve databases constitute the largest and most widely used collections of Ginis w orldwide. T able 1 provides a comparative o v erview of their k ey metho dological charac- teristics. [T able 1 ab out her e] The databases differ along several dimensions that directly affect the Gini v alues they rep ort: the temp oral and geographic cov erage, the w elfare concept used (income v ersus consumption, and gross versus net income), the level of disaggregation (ov erall p opulation, urban/rural, gender, age, and other), the level of aggregation (household, tax unit, indi- viduals), the reference unit (p er capita, adult equiv alen t, or household), and the degree of reliance on secondary sources. 3 A Unified Database As a first exercise, w e merged the t w elv e databases in to one, generating the largest database of w orld Ginis to date. The resulting database includes 122,351 observ ations and spans 222 coun tries and territories from 1867 to 2024 (T able 2). The p erio d with the b est cov erage runs from roughly 2003 to 2017, whic h all databases cov er without exception. [T able 2 ab out her e] 3 The early p ost-W orld W ar I I p erio d is cov ered by only a few databases, and the years prior to 1900 b y a single source—the WID, which reconstructs historical inequalit y using a v ariet y of arc hiv al sources. The v ariation in temporal co verage reflects the history of household survey programmes w orldwide. Income and consumption surv eys emerged after W orld W ar I I in high-income coun tries and expanded significan tly in middle- and lo w-income countries starting from the 1980s, partly in resp onse to the W orld Bank’s Living Standards Measuremen t Study programme and related initiatives. Results for the most recent years app ear in world databases with some delay , o wing to the time needed to release micro data and the irregular up date schedules of some sources. By merging these databases, we are also able to construct a series of harmonised v ari- ables capturing the welfare metric (income, consumption, or exp enditure), the t yp e of metric (gross, net, or mixed income), the reference unit (p er capita, adult equiv alen t, household), the data source, the surv ey design characteristics, and many other features. One evident limitation is that these features are fragmentary across observ ations. Aside from the income–versus–consumption distinction—whic h is generally rep orted—only some databases include the kind of metho dological detail needed to fully characterise the w elfare aggregate. It is, for example, very difficult to obtain complete information on the sub-items included in income aggregates, such as go vernmen t transfers and in-kind b enefits, and al- most imp ossible to know the details of imputation pro cedures for items such as imputed ren t or home pro duction. The absence of this information mak es meaningful comparison across Ginis arduous, but merging databases at least allows us to identify precisely where the gaps lie. Merging databases also allows us to map data pro v enance across sources. Figure 1 presen ts a Sank ey diagram of these genealogical relations. [Figur e 1 ab out her e] On the left-hand side are the data origins (primary surv e ys, national statistical agencies, and existing secondary databases) and on the righ t-hand side are the destinations (the t welv e databases co vered here). The global secondary databases—UNU-WIDER WI ID, SWI ID, and All the Ginis—dra w on the largest num b er of sources. These sources ov erlap substan tially , making the secondary databases very similar to one another; but the ov erlaps are not complete, which k eeps them distinct. National Statistical Agencies (NSAs) feed in to the largest num b er of destination databases, since they provide the household surveys that are the ultimate source of virtually all Ginis. 4 Sources of Discrepancy Measuring economic inequality matters b ecause it reveals how coun tries distribute resources through the system of pro duction—via capital, lab our, and taxes—and redistribute re- 4 sources through public sp ending financed by taxes. The Gini co efficient is, arguably , the most widely used summary statistic of inequalit y . Y et the science of estimating it is fraught with complications and technicalities that make comparison across countries and time p e- rio ds genuinely challenging. It is not uncommon to find estimates of inequality for the same measure, country , and y ear that diverge substantially . V erme et al. [2014], for example, report m ultiple Gini estimates for Egypt based on the same underlying data source. What explains these differ- ences? In principle, any asp ect of survey design, data pro cessing, or metho dological c hoice that affects the shap e of the income or consumption distribution can pro duce div ergent results. This section fo cuses on the principal sources of discrepancy , whic h we group into six categories: survey design; survey implementation; welfare metrics; welfare sub-metrics; reference units; and p ost-survey adjustments. 4.1 Surv ey Design Ev en in the absence of tec hnical errors, survey design inv olv es normative choices that affect any distributional statistic. One imp ortant example is the inclusion or exclusion of marginalised p opulation groups: prisoners, residents of institutions, homeless p eople, refugees, and in ternally displaced p ersons (IDPs). F or most countries, these groups repre- sen t less than one p ercent of the p opulation and their exclusion has only mo dest effects on the Gini. But in countries that host large refugee p opulations—Lebanon after the Syrian crisis b eing the most dramatic recent case, where refugees hav e at times constituted more than 20 p ercent of the resident p opulation—the treatmen t of these groups can change the measured level of inequality substantially (Ceriani and V erme, 2022). A second normative choice concerns the reference p erio d used for income or consump- tion measuremen t, particularly when measuremen t relies on recall questions. Short refer- ence p erio ds reduce recall error but increase the volatilit y of measured income; long refer- ence p erio ds smo oth idiosyncratic sho cks but may in tro duce systematic recall bias. These c hoices affect the quality of resp onses and the item non-resp onse rate, and ultimately the degree of measurement error in the distribution. Neither of these c hoice s is routinely disclosed in the metadata accompanying world Gini databases, which means that end users comparing Ginis across sources may unkno w- ingly b e comparing estimates that differ for reasons of survey design rather than economic substance. 4.2 Surv ey Implemen tation Measuremen t errors are a p ersistent feature of income and consumption surveys. Income and consumption are particularly prone to mismeasuremen t: income fluctuates, inv olves m ultiple sources that resp ondents may not rep ort fully , and is sub ject to delib erate con- cealmen t; consumption is complex to measure accurately across div erse household types 5 and requires careful attention to unit of measuremen t. Of equal or greater imp ortance is the problem of non-resp onse, which may manifest as item non-resp onse (missing v alues for particular income comp onen ts) or unit non-resp onse (missing households). If non-resp onse is Missing Completely A t Random (MCAR), the p ost-surv ey sample remains representativ e and an y distributional statistic computed from it will b e unbiased. But if non-resp onses are Missing A t Random (MAR), or worse Missing Not A t Random (MNAR)—as is w ell known to b e the case for high incomes—then ignoring missing observ ations will bias inequalit y estimates do wn w ard. The concentration of non- resp onses at the upp er tail of the income distribution means that ev en a small share of missing high-income households can substantially depress the estimated Gini. V ery rarely are users of world Gini data informed ab out the presence of non-resp onses and how they ha ve b een treated. 4.3 W elfare Metrics The most fundamental c hoice in measuring inequality is the selection of the welfare metric: income or consumption. These measures are structurally differen t—one captures income flo ws, the other actual consumption exp enditure—and they differ in the degree of mismea- suremen t and non-response they suffer. In countries where w ork is largely informal and income is erratic, o ccasional, or difficult to capture, consumption may b e the more reliable indicator of living standards. In countries with well-dev elop ed formal lab our markets and reliable income records, income may b e preferable. Figure 2 maps the w orld according to the welfare metric predominantly used in each coun try’s most recent observ ation in our database. There is a clear geographical divide: lo w-income countries, particularly in Sub-Saharan Africa and South Asia, rely predomi- nan tly on consumption; middle- and high-income coun tries—across the Americas, Europ e, and including China—use predominantly income or mixed metrics. This structural differ- ence in data collection practice makes comparisons of Ginis b etw een countries at different lev els of dev elopmen t inheren tly problematic. [Figur e 2 ab out her e] Figure 3 compares, for the same coun try-y ear observ ations, Gini estimates deriv ed from income and from consumption. [Figur e 3 ab out her e] The scatter of p oints deviates markedly from the 45-degree line of p erfect concordance. Ginis deriv ed from gross or net income are consistently and considerably larger than those 6 deriv ed from consumption—an exp ected result, since income is more disp ersed than con- sumption, but the magnitude of the difference is striking. F or some coun try-year obser- v ations, the gap b etw een income and consumption Ginis reaches 50 p ercentage p oints. A consumption Gini of 30 can corresp ond to an income Gini of 70 or more for the same coun- try in the same y ear. Researchers who com bine income and consumption Ginis without explicit cont rols for this distinction risk sev ere comparabilit y problems. 4.4 W elfare Sub-metrics More subtle, and harder to detect from standard database metadata, are differences arising from the precise comp onen ts included in the w elfare aggregate. Consider income as the c hosen metric: this may b e measured including or excluding different comp onents, suc h as go vernmen t cash transfers, p ensions, imputed rent, home pro duction, or in-kind b enefits from public services. Figure 4 illustrates this using data from Eurostat, which is distinctiv e in rep orting Ginis for several explicitly defined v ariants of disp osable income sim ultaneously . [Figur e 4 ab out her e] The figure distinguishes Ginis computed from: (i) equiv alised disp osable income; (ii) equiv- alised disposable income b efore so cial transfers but including pensions; and (iii) equiv alised disp osable income b efore all social transfers including p ensions. The three distributions are clearly separated across coun tries, with pre-transfer Ginis substan tially higher than p ost- transfer ones, as exp ected. The gaps b etw een these v arian ts are often large—measured in tens of p ercen tage p oin ts—and are systematic across all Europ ean countries in the sample. Researc hers who compare Ginis from different sources without chec king whether transfers are included or excluded may b e comparing fundamen tally differen t economic concepts. 4.5 Reference Unit The choice of reference unit—the unit ov er which welfare is measured and in whose name the distribution is computed—in tro duces additional comparabilit y c hallenges. The main c hoices are b etw een individual-lev el measures (with some form of adjustmen t for household size) and household-lev el measures (which treat the household as the unit of analysis). Within individual-lev el measures, the c hoice b etw een p er-capita income and income per adult equiv alen t (with a chosen equiv alence scale) further affects distributional compar- isons. Considering the equiv alence scale used in each country’s most recent database obser- v ation, a clear geographical pattern emerges: countries in the Global South predominan tly rep ort p er capita measures, whereas coun tries in the Global North—particularly in Eu- rop e—tend to use adult-equiv alen t measures. F or Latin American countries co vered b y 7 SEDLA C, whic h rep orts inequality measures under both definitions, the difference be- t ween p er capita and adult-equiv alen t Gini co efficients is typically only a few p ercentage p oin ts, rather than the larger gaps observ ed for welfare aggregates. Nev ertheless, even dif- ferences of three to five p ercentage p oin ts can b e consequential for cross-coun try compar- isons, particularly where relatively small distributional differences carry significan t p olicy implications. 4.6 Bottom and T op Incomes Sp ecial attention is w arran ted for households with very low or very high rep orted incomes. Negativ e incomes can exist for legitimate accoun ting reasons—for example, farmers inv est- ing in one season and reaping returns in another—but it is unclear whether these households should b e treated as p o or (Hlasny et al., 2022). Zero incomes p ose a smaller problem; our analysis confirms that including or excluding households with zero gross income do es not substan tially c hange the estimated Gini, consistent with these cases being a small share of all observ ations. T o our knowledge, the W orld Bank’s Po vert y and Inequality Platform (PIP) is the only database that explicitly do cuments the treatment of negative and zero incomes. In particular, all pov erty and inequality indicators in PIP are computed using income and consumption distributions that exclude negative v alues and replace all obser- v ations b elow $ 0.28 p er p erson p er day with $ 0.28 p er p erson p er da y (W orld Bank [2024], § 2.6). T op incomes are more consequen tial. A well-documented stylised fact is that the v ery ric h are systematically underrepresented in household surv eys, either b ecause they do not resp ond to surv eys, resp ond with incomplete information, or are en tirely excluded from sampling frames. A comp ounding issue is that statistical agencies routinely apply top- co ding to micro data b efore public release—replacing the highest income v alues with a common cap or with syn thetic v alues—primarily as a disclosure-con trol measure to pro- tect the iden tity of high-income resp onden ts. T op-co ding therefore introduces a further do wnw ard distortion in measured inequality , o v er and ab ov e the bias already caused b y non-resp onse at the top. Hlasny and V erme [2022] show that for the United States, the Gini computed from public-access data (whic h are top-co ded) and the Gini estimated after correcting for top-co ding div erge b y as muc h as 10 p ercentage points, with wide confidence in terv als reflecting fundamental uncertain t y about the upp er tail of the income distribution. 4.7 P ost-Survey Adjustmen ts Bey ond the top-income problem, statistical agencies and database administrators rou- tinely mak e several other t yp es of p ost-survey adjustmen ts. These include: spatial and in ter-temp oral price adjustmen ts (using consumer price indices or Purc hasing Po w er Par- it y conv ersion factors); imputations for missing or implausible v alues; top and b ottom co ding for data anon ymisation; and, in some databases, large-scale re-calibration of surv ey 8 distributions against National Accounts aggregates. Eac h of these adjustmen ts can affect measured inequality . The anc horing of survey dis- tributions to National Accounts is especially significan t: it is a cen tral feature of the W orld Inequalit y Database’s Distributional National Accounts (DINA) metho dology [Blanchet et al., 2024], and it explains muc h of wh y WID Ginis—which incorp orate top-income ad- justmen ts based on tax records and other administrativ e sources—tend to b e considerably higher than surv ey-based alternativ es (the mean Gini in WID is 55.4 versus 37.1 for the W orld Bank PIP; see T able 2). 4.8 Comparabilit y Across Time A dimension that receives less attention in discussions of cross-country comparability , but is no less imp ortant for empirical research, is comparabilit y across time within a single coun try . Long time series of Gini co efficients—of the kind that appear in the WI ID, SWI ID, and WID for many coun tries—are susceptible to spurious trends arising from c hanges in survey design, the measurement of welfare aggregates, or the treatmen t of extreme observ ations. If a national statistical agency shifts from ann ual to mon thly income measuremen t, revises its imputation pro cedure for missing income v alues, or alters the geographic cov erage of its survey , the resulting Gini series will exhibit a structural break that can b e mistaken for a gen uine distributional trend. The WID’s DINA metho dology introduces a further complication: the administrativ e records used to supplement surveys—primarily tax filings—hav e themselv es evolv ed ov er time, as tax systems ha ve b een reformed, enforcement has tigh tened or relaxed, and re- p orting requiremen ts ha v e c hanged. A rising trend in WID Ginis for a given country could therefore reflect gen uine concen tration of income at the top, impro ved capture of top incomes in administrative records, or changes in tax law that alter what is rep orted. Distinguishing among these explanations requires access to the underlying administrative data and a detailed knowledge of each coun try’s tax history—information that most users of global databases do not possess and that is not provided in database do cumen tation. F or the databases in our collection, the p erio ds with the densest co verage—roughly 2003 to 2017—also exhibit the smallest cross-database Gini ranges, in part b ecause all databases draw on the same generation of national household surveys, and in part b ecause metadata do cumen tation has improv ed. Earlier decades show greater disp ersion, partly b ecause fewer databases co ver those y ears, but also b ecause the surveys underlying the estimates are more heterogeneous in design and geographic scop e. Researchers relying on long time series from secondary databases should treat structural breaks in co verage—the en try or exit of a database, a c hange in the primary survey underlying the series, or a revision of historical estimates—as p otential sources of spurious apparent trends. 9 4.9 The Cum ulativ e Challenge The six sources of discrepancy discussed ab ov e do not op erate indep enden tly . Survey de- sign choices determine whic h p opulations are included; survey implemen tation affects how accurately their w elfare is measured; the welfare metric determines whether we measure income or consumption; sub-metric definitions determine which comp onents are included in either aggregate; the reference unit determines ho w w elfare is distributed across indi- viduals within the household; and p ost-survey adjustmen ts mo dify the raw distribution in w ays that are often only partially disclosed. Eac h c hoice in tro duces a la yer of non-comparabilit y , and their effects accumulate. A comparison b etw een a gross income p er-capita Gini from one country—t ypical of the Global North—and a consumption p er-capita Gini from another—typical of the Global South— conflates at minimum t w o ma jor sources of discrepancy before any differences in survey design or implemen tation are tak en in to accoun t. The welfare metric alone accounts for a mean gap of approximately 5 Gini p oints globally , rising to 9 p oints for low-income coun tries; income sub-concept differences (gross versus net, with or without transfers) add sev eral further p oints; and equiv alence scale conv entions contribute a smaller but non- negligible amoun t. This cum ulativ e c hallenge is what mak es the study of global inequality so demanding and the in terpretation of published Gini figures so hazardous for researchers who do not lo ok behind the headline num b er. The t welv e databases we review are not tw elve inde- p enden t measurements of the same underlying distribution; they are tw elv e differen t op er- ationalisations of an inherently complex concept, each em b edding metho dological choices that are often undo cumented, inconsistently applied across sources, and correlated with observ able features of countries such as income level and region. Progress tow ard genuine global comparabilit y will therefore require agreement on welfare concepts, reference units, and sub-metric definitions at the level of primary data collection—not merely at the lev el of secondary database assembly . 5 Quan tifying Cross-Database Discordance Ha ving catalogued the sources of discrepancy , we no w quantify how muc h databases actu- ally disagree in practice. W e present four complementary exercises. 5.1 Within-Coun try-Y ear Gini V ariabilit y F or each country-y ear com bination with observ ations from tw o or more databases, we compute the absolute range (maximum minus minim um Gini) and the standard deviation across database observ ations. T able 3 and T able 4 summarise these statistics b y W orld Bank region and income group, respectively . 10 [T able 3 ab out her e] [T able 4 ab out her e] The results reveal striking heterogeneity . The mean within-coun try-y ear range across all 3,419 coun try-year pairs with at least t w o observ ations is 6.6 Gini p oin ts, with a median of 4.2 p oin ts. The highest v ariability is found in North America (mean range 9.1 pp) and Europ e and Cen tral Asia (8.9 pp), reflecting the particularly div erse income concepts used across databases for high-income coun tries. Sub-Saharan Africa and South Asia exhibit m uch lo wer v ariabilit y (mean ranges of 3.6 and 3.6 pp resp ectively), consisten t with these regions relying more uniformly on consumption-based welfare aggregates from a limited set of primary sources. By income group, v ariability is highest for high-income countries (mean range 9.4 pp) and lo west for lo w-income coun tries (mean range 2.5 pp). This coun terintuitiv e pattern arises b ecause high-income coun tries hav e extensive co verage across m ultiple databases using different welfare concepts (income and consumption), while lo w-income countries are cov ered primarily b y the global secondary databases, which largely draw on the same underlying survey sources. Maximum v alues reach 38.5 Gini p oints for some country-y ear pairs in Europ e and Central Asia—a reminder that no t w o databases should b e treated as in terchangeable for individual coun try observ ations. 5.2 P airwise Cross-Database Concordance W e compute, for eac h pair of databases sharing at least t w ent y o v erlapping country-y ear observ ations, b oth the Pearson correlation co efficient and the mean absolute difference (MAD) of their resp ective Gini v alues. T able 5 presents the full concordance matrix. [T able 5 ab out her e] The concordance matrix rev eals a clear structure. Databases that dra w on the same primary micro data sources are highly correlated and sho w small MADs. The closest pair in Panel B is SEDLAC and WB-PIP , with a MAD of only 0.11 Gini p oin ts—reflecting that b oth rely heavily on the same Latin American household surveys. Similarly , A TG and SEDLAC (MAD = 0.66) and LIS and OECD (MAD = 0.88) are very close, reflecting shared primary sources and similar w elfare concept co verage. Eurostat is the clear outlier: its MAD with resp ect to all other databases ranges from 8.9 to 11.4 Gini p oin ts. This is explained by the fact that Eurostat co v ers only Europ ean coun tries, which hav e distinctiv ely lo w inequalit y lev els compared to the global sample, and uses a specific equiv alised income concept (the OECD-modified scale) that is not replicated in databases with broader global co verage. 11 Notably , even among databases with high P earson correlations—LIS and OECD hav e a correlation of 0.963—the MAD can still b e substan tial (0.88 pp on a verage across country- y ears). Correlation measures rank ordering; it do es not preclude level differences that matter for cross-sectional inequality comparisons. 5.3 The Income–Consumption Gap b y Region Building on the biv ariate comparisons in Figure 3, T ables 6 and 7 do cument the income– consumption Gini gap across all country-y ear pairs in our unified database where b oth an income estimate and a consumption estimate are av ailable for the same observ ation. The gap is p ositive and substantial across all world regions and income groups: income-based Ginis are consisten tly higher than consumption-based Ginis for the same coun try and y ear. Regionally , the gap is widest in North America (mean 10.0 Gini points) and Sub- Saharan Africa (8.4 p oints), and narro west in Europ e and Central Asia (2.4 p oints). This pattern partly reflects the sp ecific income sub-concepts prev alen t in each region—gross income is common in North America while Europ ean databases often use net disp osable income, reducing the gap relativ e to consumption—and partly reflects genuine differences in ho w income and consumption div e rge as w elfare aggregates across dev elopment con texts. By income group, the gap is largest for lo w-income coun tries (mean 9.0 Gini p oints) and declines to 3.1 p oints for high-income coun tries. This gradient is itself a reflection of the structural divide in welfare measurement practice do cumented in Section 4: low-income coun tries predominan tly use consumption-based surv eys while high-income countries use income-based ones. An y cross-country comparison that mixes the t wo metrics without adjustmen t will therefore tend to understate inequalit y in lo wer-income countries relative to higher-income countries b y a margin that, at the extremes, approac hes 9 Gini p oints—far larger than most genuine cross-country distributional differences of p olicy interest. [T able 6 ab out her e] [T able 7 ab out her e] 5.4 W elfare Metric and Equiv alence Scale: What the Evidence Sho ws Tw o further sources of descriptiv e evidence allo w us to b ound the contribution of metho d- ology to measured inequality levels. First, the Eurostat data—unique in rep orting three income concept v arian ts for the same countries and y ears sim ultaneously—show that social transfers reduce the Gini by 10 to 20 percentage p oints in Europ ean countries (Figure 4). A researcher who uses a pre-transfer Gini from one database and a p ost-transfer Gini from another for the same coun try will therefore dramatically o verstate differences in underlying distributional structure. This is not a hypothetical risk: the global secondary databases 12 (WI ID, SWIID) po ol observ ations from sources with different transfer treatmen t, and database metadata rarely sp ecifies which income concept is in use for each country-y ear. Second, the SEDLA C data confirm that shifting from p er-capita to adult-equiv alent income raises the Gini b y roughly 2 to 4 p oints for Latin American countries. This is mo dest compared to the income–consumption gap, but not negligible for comparisons b et ween coun tries at similar income levels where distributional differences are narro w. These patterns indicate that metho dological c hoices collectiv ely drive muc h of the cross- database disp ersion do cumen ted ab ov e. The upshot for users of global inequality data is direct: the Gini co efficien t do es not measure a single, well-defined quan tity . The num b er rep orted b y an y giv en database is the pro duct of a chain of metho dological decisions— decisions that are often undo cumen ted, inconsisten tly applied across sources, and correlated with observ able features of countries such as income lev el and geographic region. 6 A Country Example: Colom bia The com bination of the factors discussed abov e can pro duce dramatically differen t Gini v alues for the same country and year. T o illustrate this p oint, we fo cus on Colombia, one of the coun tries with the highest num b er of data points in our aggregated database. The Gini series for Colom bia co v ers the p erio d 1964–2023 and, for man y y ears, includes multiple observ ations from different databases using differen t welfare concepts, reference units, and metho dological choices. Figure 5 shows b ox plots of Gini estimates for Colombia by year. [Figur e 6 ab out her e] The disp ersion is substan tial—gaps b etw een minim um and maxim um v alues often ex- ceed 10 p ercen tage p oin ts in years with at least four observ ations. The mean and median Gini also v ary considerably across years, p artly reflecting genuine distributional c hange and partly reflecting the c hanging comp osition of av ailable estimates (whic h series are rep orted in whic h year v aries across databases). Colom bia pro vides an esp ecially instructiv e case b ecause it is one of the most extensively co vered countries in the databases fo cused on Latin America (IDB, SEDLAC, CEP AL, A TG) and is also included in global secondary databases (WI ID, SWI ID). The estimates span a wide range of welfare concepts—household p er-capita income from surveys with differen t cov erage of urban and rural areas, different treatments of zero incomes, and dif- feren t p erio ds of reference. A researcher in terested in trac king Colombian inequality ov er the past 30 years faces a difficult task of selecting among these estimates, and the choice made can materially affect conclusions ab out the trend. Authors’ analysis on other coun tries confirms that the c hallenges illustrated for Colom- bia are general. F or instance, Brazil, another high-cov erage Latin American coun try , 13 sho ws dispersion patterns similar to Colombia. India is cov ered almost exclusively by consumption-based measures, whic h limits cross-database disp ersion but also makes com- parison with income-based measures from other databases problematic. South Africa, despite having a larger share of income-based estimates than most Sub-Saharan African coun tries, shows wide dispersion reflecting the div ersity of sources and welfare concepts. German y , as a high-income country cov ered b y many databases, shows the large income– v ersus–disp osable-income gaps typical of the Europ ean context (Figures av ailable up on request). 7 Conclusion Professor Cornia foresa w the importance of monitoring inequalit y w orldwide and pioneered some of the early efforts to assem ble cross-coun try Gini data. His role in building and expanding the WI ID at UNU-WIDER remains one of the most imp ortant institutional con tributions to the scientific study of global inequality . The database he helped create has b een the starting p oin t for hundreds of studies examining the determinants and con- sequences of inequality across coun tries and ov er time. And his own use of these data—to do cumen t the inequality turn of the 1980s and 1990s, to trac k the rise and fall of inequality in Latin America, and to situate the distributional consequences of liberalisation and struc- tural adjustment—set a standard for empirical rigour and p olicy relev ance that contin ues to inspire. This pap er has shown that comparing Ginis across time and space remains tec hni- cally demanding despite considerable progress ov er the past three decades. The t welv e databases we hav e reviewed differ mark edly in w elfare concept, reference unit, sub-metric definitions, p ost-survey adjustmen ts, and geographic and temporal cov erage. These dif- ferences translate in to large and systematic discrepancies in measured inequality . The income–consumption gap alone—av eraging around 5 Gini p oints globally and exceeding 8–10 p oints in North America, South Asia, and Sub-Saharan Africa—is large enough to fundamen tally affect cross-country comparisons and time-series analyses that mix the t wo w elfare concepts without correction. Our quantitativ e exercises add precision to this picture. Descriptive evidence from databases that simultaneously rep ort multiple welfare concept v ariants—Eurostat for pre- and p ost-transfer income, SEDLA C for p er-capita and adult-equiv alent measures—confirms that sub-metric definitions and equiv alence scale c hoices each introduce differences of sev- eral Gini p oin ts. The companion journal article presen ts a formal meta-regression that quan tifies these effects, showing that w elfare concept and equiv alence scale together ac- coun t for close to 80 p ercen t of within-coun try-year cross-database v ariation. The pairwise concordance matrix confirms that databases sharing the same primary data sources are far more consistent than databases that aggregate across different welfare concepts. And the within-coun try-y ear v ariability analysis demonstrates that high-income countries, para- 14 do xically , exhibit the highest cross-database disp ersion—b ecause they are cov ered b y more databases employing diverse metho dological approaches. What would Professor Cornia ha ve made of this situation? W e think he would hav e found it concerning but not discouraging. Concerning, b ecause the proliferation of databases without adequate metadata standards and without explicit harmonisation of welfare con- cepts creates real risks for empirical research: systematic differences across databases can in tro duce severe measuremen t error into gro wth, p o vert y , or p olitical-econom y regressions. Researc hers who fail to account for these differences risk dra wing conclusions that are arte- facts of database choices rather than actual economic findings. Not discouraging, b ecause the proliferation also reflects a vibrant researc h communit y and a gro wing institutional commitmen t to inequality measurement—a field to whic h Cornia contributed enormously . The road ahead requires greater transparency in metadata, b etter harmonisation of w elfare definitions across primary data collection efforts, and more systematic atten tion to the sources of cross-database discordance. This is what, we believe, Cornia would hav e w anted. And it is the b est wa y we can honour the remark able legacy he left us. References ADB. Key indicators for asia and the pacific 2024. data for climate action. 55th edition, Asian Developmen t Bank (ADB), 2024. ADB. Key indicators database (KIDB). Database, Asian Dev elopment Bank (ADB), 2025. URL https://kidb.adb.org/ . Afristat. Conditions de vie des menages. T ec hnical rep ort, Afristat, 2025. URL https://afristat.opendataforafrica.org/loxnvcc/conditions- de- vie- des- m%C3%A9nages . Thomas Blanchet, Lucas Chancel, Ignacio Flores, Marc Morgan, et al. Distributional na- tional accounts guidelines: Metho ds and concepts used in the world inequalit y database. T ec hnical rep ort, W orld Inequalit y Lab, 2024. V ersion of F ebruary 27, 2024. CEDLAS and WB. So cio-economic database for latin america and the caribb ean. Database, CEDLAS and The W orld Bank, 2024. URL https://www.cedlas.econo.unlp.edu.ar/ wp/wp- content/uploads/2024_Act1_inequality_LAC.xlsx . CEP AL. CEP ALST A T – bases de datos y publicaciones estad ´ ısticas. Database, Comisi´ on Econ´ omica para Am´ erica Latina y el Carib e (CEP AL/ECLA C), 2024. URL https: //statistics.cepal.org/portal/cepalstat/ . Lidia Ceriani and P aolo V erme. Population changes and the measuremen t of inequalit y . So- cial Indic ators R ese ar ch , 162(2):549–575, 2022. doi: 10.1007/s11205- 021- 02849- 7. URL https://doi.org/10.1007/s11205- 021- 02849- 7 . 15 Gio v anni Andrea Cornia, editor. Ine quality, Gr owth, and Poverty in an Er a of Lib er aliza- tion and Glob alization . Oxford Univ ersity Press, Oxford, 2004. Gio v anni Andrea Cornia and Sampsa Kiiski. T rends in income distribution in the p ost- WWI I p erio d: Evidence and interpretation. In Wider Discussion Pap ers , num b er 2001/89. 2001. Gio v anni Andrea Cornia, Ric hard Jolly , and F rances Stew art. Adjustment with a h uman face: Protecting the vulnerable and promoting growth. 1987. Gio v anni Andrea Cornia, T ony Addison, and Sampsa Kiiski. Income distribution changes and their impact in the p ost-Second W orld W ar p erio d. World Development , 32(5): 827–856, 2004. Klaus Deininger and Lyn Squire. A new data set measuring income inequalit y . World Bank Ec onomic R eview , 10(3):565–591, 1996. Vladimir Hlasn y and Paolo V erme. T op incomes and the measurement of inequalit y in the United States. R eview of Inc ome and We alth , 68(2):386–412, 2022. Vladimir Hlasny , Lidia Ceriani, and P aolo V erme. Bottom incomes and the measure- men t of p o vert y and inequalit y . R eview of Inc ome and We alth , 68(4):970–1006, 2022. doi: https://doi.org/10.1111/roiw.12535. URL https://onlinelibrary.wiley.com/ doi/abs/10.1111/roiw.12535 . IADB. IDB op en data. Database, Inter-American Developmen t Bank (IADB), 2025. URL https://data.iadb.org/ . LIS. Luxembourg income study database. Database, Luxembourg Income Study , 2024. URL https://www.lisdatacenter.org/our- data/lis- database/ . Brank o Milanovic. Description of All the Ginis dataset. T ec hrep ort, Graduate Cen ter, City Univ ersity of New Y ork and Stone Center on So cio-economic Inequalit y , 2019. OECD. Metadata on OECD income distribution database (IDD). Database, Or- ganization for Economic Co op eration and Developmen t (OECD), 2024. URL https://www.oecd.org/content/dam/oecd/en/data/datasets/income- and- wealth- distribution- databases/idd- metadata- sources- and- income- years.pdf . F rederic k Solt. Measuring income inequalit y across countries and ov er time: The stan- dardized w orld income inequality database. So cial Scienc e Quarterly , 101(3):1183–1199, 2020. UNU-WIDER. W orld income inequality database (WIID). Dataset, United Nations Univ ersity W orld Institute for Developmen t Economics Research, 2025. URL https: //www.wider.unu.edu/database/world- income- inequality- database- wiid . 16 P aolo V erme, Branko Milano vic, Sherine Al-Shaw arb y , Sahar El T awila, May Gadallah, and Enas Ali El-Ma jeed. Inside Ine quality in the Ar ab R epublic of Egypt: F acts and Per c eptions A cr oss Pe ople, Time, and Sp ac e . W orld Bank Publications, W ashington, DC, 2014. W orld Bank. P ov erty and Inequalit y Platform. PIP database, W orld Bank Group, 2024. URL https://pip.worldbank.org/ . 17 List of T ables W ellb eing Dataset Primary # Obs Countries Time Range Concept Lev el Sharing Reference Source Dataset (% Cons.) Unit Unit GLOBAL A TG no 5,120 200 1948–2017 37 o verall HH Mixed † Milano vic [2019] LIS y es 932 52 1963–2023 0 HH AE LIS [2024] OECD IDD no 616 45 1974–2023 0 o verall HH AE OECD [2024] UNU-WIDER WI ID no 26,161 201 1867–2023 12 o v erall HH Mixed ∗ UNU-WIDER [2025] WB PIP y es 2,456 172 1963–2024 40 o verall HH PC W orld Bank [2024] WID y es 10,419 217 1900–2023 0 ov erall T ax Unit PC Blanchet et al. [2024] SWI ID no 26,900 199 1960–2023 14 o verall Ind HH Mixed ∗∗ Solt [2020] REGIONAL Afric a Afristat no 84 20 1994–2023 ? o verall ? ? Afristat [2025] East Asia and the Pacific ADB no 322 40 2000–2023 86 o verall HH PC ADB [2024, 2025] Eur op e Eurostat y es 787 37 2014–2024 0 ov erall < 18 years HH AE v ariable ilc di12c L atin Americ a and the Caribb e an CEP AL/ECLAC yes 959 19 2000–2023 0 ov erall urban/rural HH PC CEP AL [2024] IDB y es 45,656 26 1970–2023 0 ov erall urban/rural gender migration ethnicit y disabilit y quin tiles HH Ind PC IADB [2025] SEDLA C y es 442 24 1974–2023 0 ov erall urban main cities HH PC/AE CEDLAS and WB [2024] ∗ 39% PC; 41% AE; 20% Household Based † 72% Per capita; 8% Household Based ∗∗ 32% Per capita; 52% AE; 15% Household Based T able 1: Ov erview of Databases Included in the Unified Collection 18 T able 2: Summary Statistics by Dataset Dataset # Obs. # Coun tries Min Y ear Max Y ear Mean Gini ADB 322 40 2000 2023 34.52 A TG 5,121 175 1948 2017 38.76 Afristat 84 20 1994 2023 39.40 CEP AL 887 18 2000 2023 47.10 Eurostat 2,102 37 2003 2024 37.71 IDB 45,656 26 1970 2023 36.69 LIS 930 52 1963 2023 33.70 OECD 616 45 1976 2023 31.85 SEDLA C 649 23 2000 2024 48.22 SWI ID 26,900 199 1960 2023 39.49 UNU-WIDER 26,161 200 1867 2023 37.06 WB-PIP 2,504 172 1963 2024 37.17 WID 10,419 217 1900 2023 55.45 T otal 122,351 222 1867 2024 39.19 T able 3: Cross-Database Gini V ariability by Region (country-y ears with ≥ 2 database observ ations) Region # Obs Mean Range Mean SD Median Range Max Range East Asia & Pacific (EAS) 406 4.39 2.31 2.61 28.10 Europ e & Central Asia (ECS) 1,532 8.94 3.89 6.52 38.51 Latin America & Caribb ean (LCN) 631 5.15 2.26 4.27 45.25 Middle East & N. Africa (MEA) 200 3.18 1.62 1.91 19.66 North America (NAC) 127 9.13 3.80 8.50 28.04 South Asia (SAS) 182 3.57 1.90 2.15 22.52 Sub-Saharan Africa (SSF) 341 3.63 2.01 1.92 27.65 T otal 3,419 6.55 2.97 4.20 45.25 Note: “R ange” is maximum minus minimum Gini acr oss datab ases for the same c ountry-ye ar. SD is standar d deviation. Al l values in Gini p oints (pp). T able 4: Cross-Database Gini V ariability by Income Group (country-y ears with ≥ 2 database observ ations) Income Group # Obs Mean Range Mean SD Median Range Max Range High income 1,334 9.42 4.14 7.30 38.51 Upp er middle income 811 4.99 2.25 3.63 31.72 Lo wer middle income 484 3.33 1.69 2.15 26.52 Lo w income 126 2.46 1.34 1.07 24.08 T otal 2,755 6.73 3.03 4.41 38.51 19 T able 5: Pairwise Pearson Correlation and Mean Absolute Difference (pp) Across Databases A TG CEP AL Eurostat IDB LIS OECD SEDLA C SWI ID UNU-WIDER WB-PIP Panel A: Pe arson Correlation A TG 1.000 0.915 0.327 0.817 0.944 0.919 0.972 0.783 0.870 0.958 CEP AL 0.915 1.000 . 0.830 0.862 0.492 0.964 0.861 0.889 0.922 Eurostat 0.327 . 1.000 . 0.219 0.357 . 0.095 0.234 0.332 IDB 0.817 0.830 . 1.000 0.855 0.550 0.834 0.580 0.649 0.791 LIS 0.944 0.862 0.219 0.855 1.000 0.963 0.823 0.644 0.861 0.955 OECD 0.919 0.492 0.357 0.550 0.963 1.000 0.414 0.462 0.684 0.917 SEDLAC 0.972 0.964 . 0.834 0.823 0.414 1.000 0.879 0.909 0.987 SWIID 0.783 0.861 0.095 0.580 0.644 0.462 0.879 1.000 0.721 0.751 UNU-WIDER 0.870 0.889 0.234 0.649 0.861 0.684 0.909 0.721 1.000 0.886 WB-PIP 0.958 0.922 0.332 0.791 0.955 0.917 0.987 0.751 0.886 1.000 Panel B: Me an Absolute Differ enc e (Gini p oints) A TG 0.00 1.46 10.55 2.94 3.36 2.10 0.66 3.76 2.88 1.17 CEP AL 1.46 0.00 . 2.85 3.34 2.77 1.20 2.08 1.72 1.39 Eurostat 10.55 . 0.00 . 11.42 10.27 . 9.81 8.89 9.48 IDB 2.94 2.85 . 0.00 5.55 5.69 3.22 4.92 4.53 3.38 LIS 3.36 3.34 11.42 5.55 0.00 0.88 3.20 6.73 3.85 2.64 OECD 2.10 2.77 10.27 5.69 0.88 0.00 2.10 6.49 4.12 1.88 SEDLAC 0.66 1.20 . 3.22 3.20 2.10 0.00 1.88 1.40 0.11 SWIID 3.76 2.08 9.81 4.92 6.73 6.49 1.88 0.00 4.26 3.71 UNU-WIDER 2.88 1.72 8.89 4.53 3.85 4.12 1.40 4.26 0.00 2.44 WB-PIP 1.17 1.39 9.48 3.38 2.64 1.88 0.11 3.71 2.44 0.00 Note: Pairs with fewer than 20 overlapping country-ye ar observations ar e denote d by a p erio d. 20 T able 6: Income–Consumption Gini Gap by Region Region # Obs Mean Gap Median Gap P75 Gap East Asia & Pacific 133 4.52 4.18 7.49 Europ e & Central Asia 408 2.43 2.18 5.42 Latin America & Caribb ean 98 8.50 8.12 11.78 Middle East & N. Africa 78 3.59 3.46 5.40 North America 46 10.04 11.30 12.75 South Asia 61 7.49 6.23 10.15 Sub-Saharan Africa 63 8.44 7.22 13.80 T otal 887 4.68 4.37 7.46 Note: Gap define d as inc ome Gini minus c onsumption Gini for same c ountry- ye ar. Al l values in Gini p oints. T able 7: Income–Consumption Gini Gap by Income Group Income Group # Obs Mean Gap Median Gap High income 367 3.06 2.49 Upp er middle income 295 5.46 5.13 Lo wer middle income 157 6.78 5.63 Lo w income 28 9.00 7.83 T otal 847 4.78 4.42 21 List of Figures Figure 1: Data Sources and Destinations (Sankey Diagram) Figure 2: Coun tries’ Prev alen t W elfare Metric (most recen t observ ation) 22 Figure 3: Ginis F rom Gross Income and Consumption (same coun try-y ear) 23 Figure 4: Ginis F rom Different Sub-metric Definitions (Eurostat, latest y ear) 24 Figure 5: Distribution of Gini Estimates for Colom bia by Y ear (all databases) 25
Original Paper
Loading high-quality paper...
Comments & Academic Discussion
Loading comments...
Leave a Comment