Decomposing Crowd Wisdom: Domain-Specific Calibration Dynamics in Prediction Markets
Prediction markets are increasingly used as probability forecasting tools, yet their usefulness depends on calibration, specifically whether a contract trading at 70 cents truly implies a 70% probability. Using 292 million trades across 327,000 binar…
Authors: Nam Anh Le
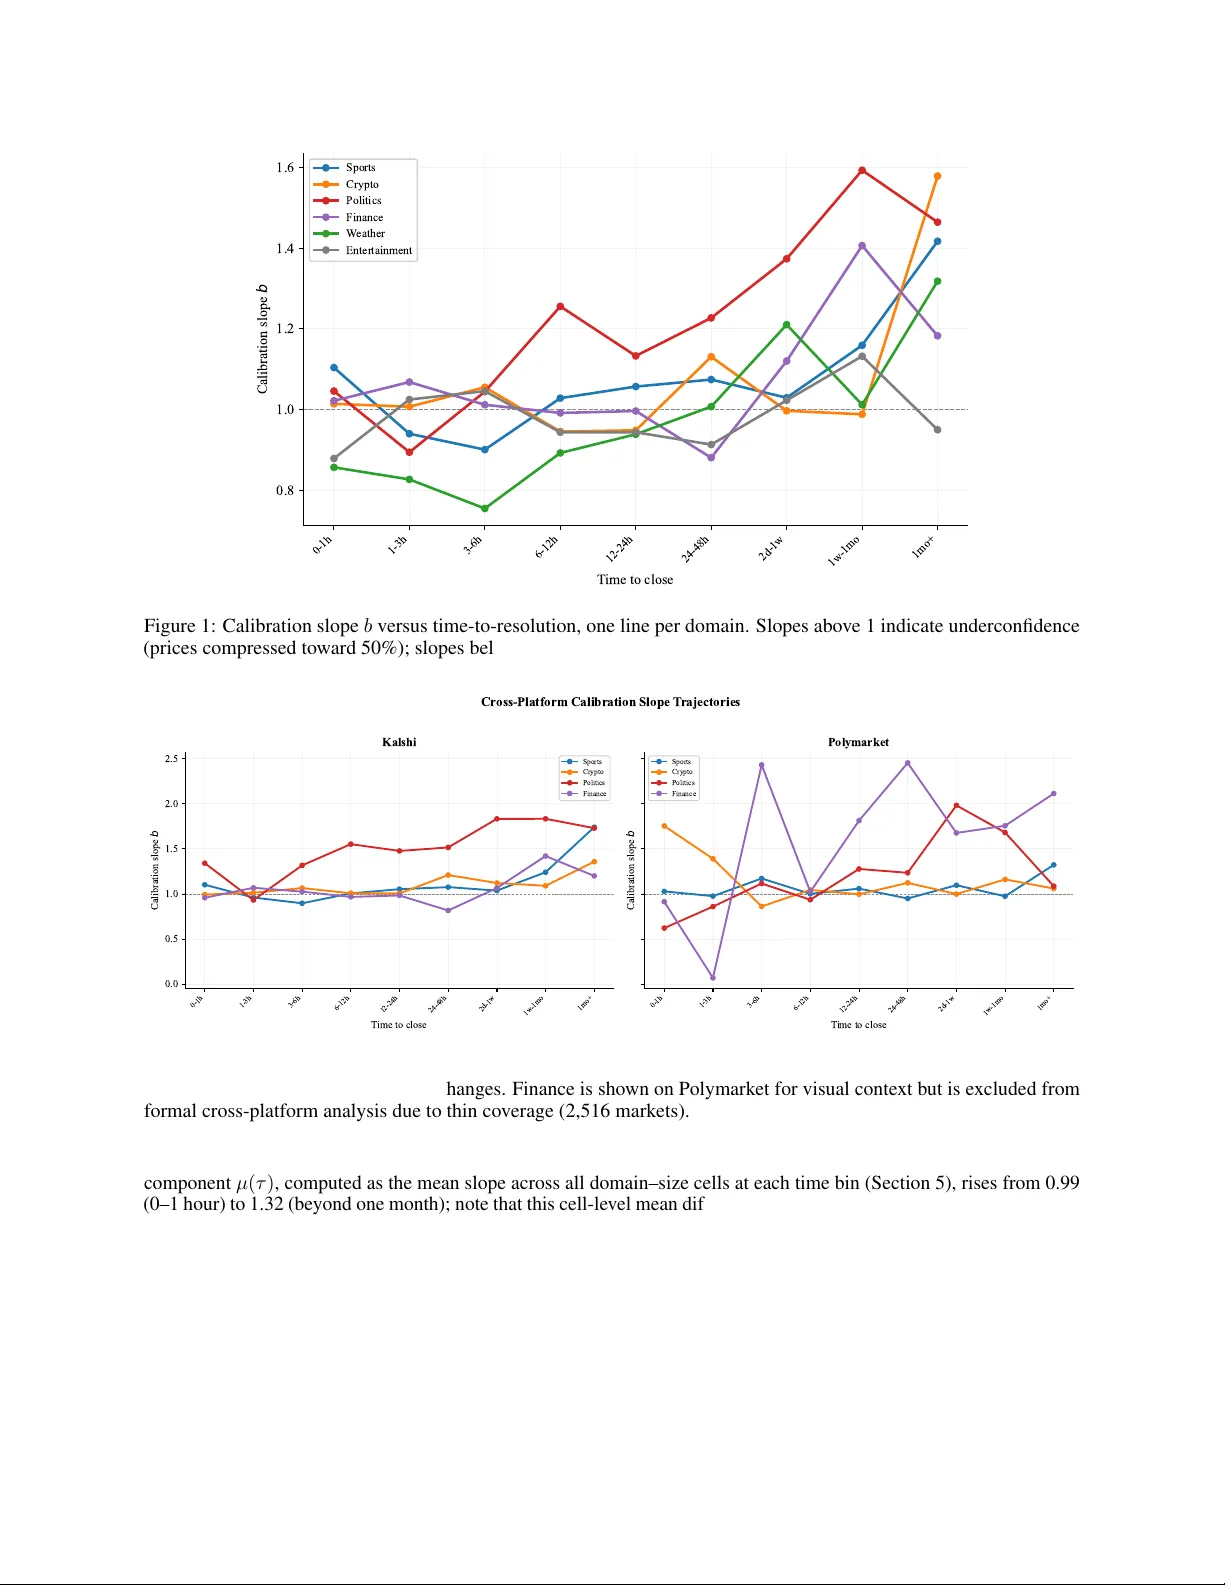
D E C O M P O S I N G C R O W D W I S D O M : D O M A I N - S P E C I FI C C A L I B R A T I O N D Y N A M I C S I N P R E D I C T I O N M A R K E T S ∗ Nam Anh Le National Economics Univ ersity V ietnam me@namanhle.com A B S T R AC T Prediction markets are increasingly used as probability forecasting tools, yet their usefulness depends on calibration, specifically whether a contract trading at 70 cents truly implies a 70% probability . Using 292 million trades across 327,000 binary contracts on Kalshi and Polymarket, this paper sho ws that calibration is a structured, multidimensional phenomenon. On Kalshi, calibration decomposes into four components (a univ ersal horizon effect, domain-specific biases, domain-by-horizon interac- tions and a trade-size scale effect) that together explain 87.3% of calibration variance. The dominant pattern is persistent underconfidence in political markets, where prices are chronically compressed tow ard 50%, and this bias generalises across both exchanges. Howe ver , the trade-size scale ef fect, whereby large trades are associated with amplified underconfidence in politics on Kalshi ( ∆ = 0 . 53 , 95% confidence interv al [0 . 29 , 0 . 75] ), does not replicate on Polymark et ( ∆ = 0 . 11 , [ − 0 . 15 , 0 . 39] ), suggesting platform-specific microstructure. A Bayesian hierarchical model confirms the frequentist decomposition with 96.3% posterior predictiv e coverage. Consumers of prediction market prices who treat them as face-value probabilities will systematically misinterpret them, and the direction of misinterpretation depends on what is being predicted, when and by whom. K eywords Bayesian hierarchical models · calibration · crowd wisdom · fa vourite–longshot bias · information aggregation · prediction markets 1 Introduction On the e vening of 5 Nov ember 2024, millions of people worldwide refreshed prediction mark et websites to track the US presidential election. Kalshi and Polymarket sho wed one candidate trading at 62 cents. News outlets reported this as a “62% probability of winning. ” Social media amplified the number . Policymakers cited it. But what does 62 cents actually mean? If the market is well calibr ated , contracts that trade at 62 cents should correspond to ev ents that occur 62% of the time. If it is not, the price is a distorted signal, and the millions of people relying on it are being misled. This paper in vestigates whether prediction markets are well calibrated, and discov ers that the answer is that it depends. It depends on what is being predicted, when you look, and who is trading. These three dimensions (domain, time horizon and trade size) interact in structured, predictable ways that are characterised here using the two largest publicly av ailable prediction market datasets assembled to date. Prediction markets are financial exchanges where contracts pay $1 if a specified event occurs and $0 otherwise [ 22 , 55 ]. A contract trading at price p ∈ (0 , 1) is commonly interpreted as encoding a crowd-sourced probability p that the ev ent will happen. This interpretation rests on substantial theoretical work linking market equilibrium prices to aggre gated beliefs [ 2 , 42 , 70 ]. The broader claim that decentralised aggregation mechanisms can outperform centralised experts draws on a long intellectual tradition [ 23 , 31 , 34 , 63 ]. Prediction markets ha ve been deployed for electoral forecasting [ 7 , 22 , 56 ], economic policy , pandemic monitoring [ 30 ], and corporate decision-making [ 14 ], and their use has surged dramatically in recent years. ∗ Citation : Le, N.A. (2026). Decomposing Crowd W isdom: Domain-Specific Calibration Dynamics in Prediction Markets. Preprint. Decomposing Crowd W isdom: Domain-Specific Calibration Dynamics in Prediction Markets The quality of these probability forecasts is assessed through calibration , the property that ev ents assigned probability p occur with empirical frequency p . A substantial literature examines prediction market calibration, with broadly positive but mixed conclusions. Page and Clemen [49] found a fa vourite–longshot bias, an underconfidence pattern where fa vourites are underpriced and longshots are o verpriced (first documented in horse-race betting by 28 , and formalised by 1 ; 66 ; 61 ), that worsens with time to e xpiration. Rothschild [56] found reasonable calibration for US elections but systematic biases at extreme probabilities. Ber g et al. [7] showed that the Io wa Electronic Markets outperformed polls (see also 58 ; 20 ; 39 , for competing assessments). T etlock and Gardner [65] demonstrated that structured forecasting tournaments can identify “superforecasters” whose calibration e xceeds both markets and con ventional e xperts. More recently , Liu et al. [41] proposed Bayesian approaches to recalibration, and Satopää et al. [57] dev eloped logit-based methods for combining probability predictions. Dreber et al. [18] and Camerer et al. [12] demonstrated that prediction markets can forecast the replicability of scientific findings. A critical limitation of this literature is the implicit assumption that calibration is a domain-agnostic property of the aggregation mechanism. A market forecasting tomorro w’ s football score and a market forecasting the next president are treated as facing the same calibration challenges. This paper demonstrates that they do not. Using 292 million trades across 327,000 binary contracts spanning six kno wledge domains on two major exchanges (Kalshi and Polymark et), calibration is decomposed into four components that together explain 87.3% of observed calibration variance. Cross- platform validation confirms that the dominant pattern, persistent underconfidence in political markets, generalises beyond an y single exchange, while the trade-size scale effect prov es platform-specific. The decomposition reveals that crowds are not uni versally wise or foolish; their forecast quality depends systematically on the epistemic structure of what they are predicting. 1.1 Summary of findings The central finding is that prediction market calibration decomposes into four interpretable components: A universal horizon ef fect ( µ ). All domains share a tendenc y toward under confidence , with prices compressed tow ard 50%, at long time horizons. The mean cell-le vel calibration slope µ ( τ ) , av eraged across all domain–size cells at each horizon, rises from 0.99 (within one hour of resolution) to 1.32 (beyond one month). This accounts for 30.2% of calibration v ariance. At long horizons, mark ets systematically understate the probability of the f av oured outcome: a contract trading at 70 cents one month out corresponds to a true probability closer to 75%. This pattern holds on both Kalshi and Polymarket. Domain-specific structural biases ( α ). Politics is the clear outlier , with a domain intercept ( +0 . 15 ) far above all other domains, indicating persistent underconfidence (prices chronically too compressed) at nearly all time horizons. W eather ( − 0 . 09 ) and Entertainment ( − 0 . 09 ) exhibit the opposite pattern, with prices that are too e xtreme, reflecting ov erconfidence. This component accounts for 14.6% of v ariance. The political bias is confirmed on Polymarket (mean slope 1.31 vs Kalshi 1.64), establishing it as a structural property of political prediction markets rather than a single-platform artefact. Domain-by-horizon inter actions ( β ). This is the single largest domain-specific component at 26.0% of v ariance. Domains follow genuinely dif ferent calibration trajectories . Political markets are underconfident at nearly all horizons (slopes 0.93–1.83), with prices persistently too compressed. Sports markets are well calibrated at short-to-medium horizons (slopes 0.90–1.10) but become sharply underconfident be yond one month (slope 1.74). W eather markets are over confident at short horizons (slopes 0.69–0.97), with prices too extreme relativ e to base rates, before transitioning to underconfidence at longer horizons. A trade-size scale effect ( γ ). In political mark ets, large trades (o ver 100 contracts) exhibit calibration slopes of 1.74, compared to 1.19 for single-contract trades, a gap of 0.53 (95% bootstrap CI [0 . 29 , 0 . 75] ). Larger trades are associated with mor e compr essed prices. In sports markets, no such gap exists ( ∆ = 0 . 07 , 95% CI [ − 0 . 07 , 0 . 26] ). This component accounts for 16.5% of v ariance. Notably , this ef fect does not replicate on Polymarket ( ∆ = 0 . 11 , 95% CI [ − 0 . 15 , 0 . 39] ), suggesting it reflects Kalshi’ s specific market microstructure rather than a uni versal feature of political prediction markets. 1.2 Related work This work connects to se veral research areas. The prediction mark et ef ficiency literature e xamines whether mark et prices aggregate dispersed information. Hayek [31] provided the conceptual foundation; the ef ficient markets hypothesis [ 21 ] and the impossibility of informationally efficient prices under costly information acquisition [ 29 ] frame the theoretical debate; Plott and Sunder [54] provided early experimental e vidence; W olfers and Zitzewitz [70] formalised the link between prices and beliefs; Arro w et al. [2] argued for broader adoption. Manski [42] cautioned that prices may not 2 Decomposing Crowd W isdom: Domain-Specific Calibration Dynamics in Prediction Markets equal mean beliefs under heterogeneous preferences, though W olfers and Zitzewitz [71] showed di vergence is typically small. Chen and Plott [13] demonstrated experimentally that information aggreg ation can be remarkably efficient e ven with few traders. Ottaviani and Sørensen [48] provided a theoretical foundation for the fav ourite–longshot bias in parimutuel markets. The decomposition presented here characterises precisely when and where aggregation succeeds or fails, and connects the dominant miscalibration pattern (underconfidence in political markets) directly to Manski’ s theoretical concern about heterogeneous beliefs compressing prices. The forecast calibration literature pro vides the measurement frame work for this study . Lichtenstein et al. [40] established the foundations of probability calibration research, building on earlier work by Brier [10] on verification of probability forecasts, Murphy and W inkler [45] on the reliability of probability assessments, Dawid [15] on the well-calibrated Bayesian, and DeGroot and Fienberg [16] on the comparison and combination of forecasters. The logistic recalibration approach [ 9 , 27 , 53 , 69 ] parameterises calibration through a slope in logit space; Ziegel [72] established the theoretical foundations for when such functionals can be consistently estimated from scoring rules. A slope exceeding one, con ventionally termed underconfidence or the fa vourite–longshot bias, indicates that forecasts are insuf ficiently extreme. Satopää et al. [57] dev eloped a logit model for combining multiple probability predictions. Liu et al. [41] dev eloped Bayesian boldness–recalibration, and Palle y and Satopää [50] addressed biased priors in crowd forecasts. The present study extends this work by modelling calibration as a structured function of multiple co variates. The Bayesian hierarchical modelling literature provides the inferential frame work. Hierarchical models for structured data are widely used in epidemiology , ecology and small-area estimation [ 24 , 25 , 33 ]. Hamiltonian Monte Carlo [ 8 , 46 ] and the No-U-T urn Sampler [ 32 ] hav e transformed posterior computation, enabling the fitting of complex hierarchical structures with ef ficient exploration of high-dimensional parameter spaces. Bayesian change-point methods [ 3 ] and MCMC con ver gence diagnostics [ 11 , 44 ] inform the computational strategy employed here. T etlock [64] and T etlock and Gardner [65] provide the broader intellectual conte xt for understanding when and why crowd forecasts succeed or fail. Finally , the scale-dependent miscalibration finding connects to the market microstructure literature. K yle [38] predicts that large trades con ve y priv ate information and should improv e prices (see also 26 ; 19 , on the relationship between trade size and information content). The finding that lar ge trades are associated with mor e compressed prices in political markets suggests a dif ferent mechanism whereby opposing large bets from confident partisans cancel each other out, pulling prices tow ard 50% rather than tow ard truth. The forecasting tournament literature pro vides an important benchmark. The Good Judgment Project [ 43 ] demonstrated that structured forecasting teams can achieve remarkable accurac y , and Baron et al. [5] showed that extremising transformations improv e calibration, a finding directly relev ant to the underconfidence documented here. More recently , DellaV igna and Pope [17] used prediction markets to benchmark beliefs about experimental outcomes, and Metaculus and other platforms have generated large-scale calibration datasets [ 37 ]. This literature establishes that calibration quality depends on the structure of the forecasting problem, a principle formalised here through domain-specific decomposition. 1.3 Plan of the paper Section 2 describes the data from both exchanges. Section 3 presents the empirical calibration landscape, establishes three stylised facts, and validates each on Polymarket. Section 4 diagnoses potential artefacts. Section 5 introduces the decomposition model and addresses confounding concerns. Section 6 de velops a Bayesian hierarchical model. Section 7 discusses implications. Section 8 concludes. 2 Data 2.1 Data source Data are drawn from two major prediction market exchanges using the pre-collected dataset of Becker [6] . The primary analysis platform is Kalshi, regulated by the US Commodity Futures T rading Commission (CFTC), which operates a central limit order book for binary ev ent contracts paying $1.00 if a specified ev ent occurs and $0.00 otherwise. Contracts trade at prices between $0.01 and $0.99. For cross-platform v alidation, the analysis uses Polymarket, a decentralised exchange operating on the Polygon blockchain, with the same central limit order book mechanism. Unlike Kalshi, Polymark et is unregulated, globally accessible, and allo ws pseudonymous trading via blockchain wallets. These structural dif ferences (regulatory en vironment, trader demographics, market mechanism) make Polymark et an informativ e v alidation platform: patterns that replicate across both exchanges are unlikely to be platform-specific artefacts. 3 Decomposing Crowd W isdom: Domain-Specific Calibration Dynamics in Prediction Markets T able 1: Summary statistics by domain: Kalshi (cutoff 31 December 2025). Domain Markets T rades Contracts Resolved Med. v ol. Base rate Sports 55,637 43.2M 12.7B 98.1% 76 41.3% Crypto 76,181 6.5M 742.9M 99.1% 35 40.7% Politics 6,609 4.9M 2.2B 94.1% 127 40.2% Finance 38,058 4.3M 677.2M 99.0% 38 37.7% W eather 26,911 4.4M 279.1M 99.5% 74 24.0% Entertainment 7,212 1.5M 174.5M 96.7% 60 38.0% T otal 210,608 64.7M 16.8B 98.6% 47 38.1% Note: Resolved (%) computed o ver markets past their close date. Base rate is the percentage of resolved mark ets where outcome = yes. Median volume is the median number of trades per mark et. Components may not sum to totals due to rounding. The Kalshi dataset comprises 64.7 million trades across 210,608 binary contracts, representing approximately 16.8 billion contracts traded, with a cutof f date of 31 December 2025. For each trade, the dataset includes the contract identifier , e xecution price (in cents), number of contracts, the side taken by the trade initiator , and the execution timestamp (millisecond precision). For each market, the dataset includes the contract identifier , e vent category , resolution status and outcome (yes or no), and close time. Of the 210,608 markets, 98.6% of those past their close date hav e resolved with a definiti ve yes/no outcome (T able 1). The Polymarket dataset comprises 227.6 million trades across 116,000 resolved contracts (61.3 billion contracts traded), with the same cutof f date. Polymarket trade timestamps are deriv ed from Polygon block numbers with approximately 3-hour noise, a limitation that af fects the two shortest time bins (Section 3). 2.2 Domain classification Kalshi organises contracts into ev ents via a hierarchical ticker structure. Markets are classified into six knowledge domains (see supplementary material for full classification rules): Sports (professional leagues including NFL, NB A, MLB and NHL), P olitics (elections, electoral college outcomes, go vernment policy), Crypto (cryptocurrency price contracts), F inance (equity indices, interest rates, economic indicators), W eather (temperature records, precipitation, natural e vents) and Entertainment (awards, media, culture). The classification uses a deterministic mapping from ev ent ticker prefixes, ensuring reproducibility . For Polymarket, which has no structured ticker namespace, mark ets are classified using compiled regular expression patterns applied to mark et titles. This yields three comparable domains (Sports, Crypto, Politics); Finance is excluded due to thin cov erage (2,516 Polymarket markets vs 38,058 on Kalshi), and W eather and Entertainment ha ve negligible Polymark et presence. The 42.5% of Polymarket mark ets classified as ‘Other’ reflects its long tail of bespoke markets (celebrity e vents, technology launches, meme markets). T ables 1 and 2 provide summary statistics. Se veral features merit comment. Sports dominates Kalshi by v olume (43.2 million trades, 66.7% of the total) but Politics commands disproportionate contract value (2.2 billion contracts from only 6,609 mark ets, representing 13.3% of total volume from 3.1% of markets). Politics also has the highest median volume per market (127 trades), reflecting intense engagement with a smaller number of high-profile events. The distribution of trade sizes is heavily right-ske wed across all domains: the median trade in volv es 40 contracts, but 0.15% of trades (those exceeding 10,000 contracts) account for approximately 15% of total contract volume. Polymarket (T able 2) shows a strikingly dif ferent composition: 4 . 0 × more trades ov erall but 0 . 8 × fewer markets, reflecting 8 . 0 × higher median per -market volume. The most consequential difference is in Politics, where Polymark et has 9 . 3 × more trades (45.7M vs 4.9M) and 11 × more contracts (24.6B vs 2.2B), suggesting substantially deeper price discov ery . 2.3 Measuring calibration Calibration is measured using logistic recalibration [ 47 , 53 ]. F or a collection of N trades inde xed by i , each with mark et price p i ∈ (0 , 1) and binary outcome y i ∈ { 0 , 1 } , the follo wing logistic regression is fitted by maximum likelihood. logit P ( y i = 1) = a + b · logit( p i ) , (1) where logit( x ) = log { x/ (1 − x ) } . The log-likelihood is ℓ ( a, b ) = N X i =1 y i log π i + (1 − y i ) log(1 − π i ) , (2) 4 Decomposing Crowd W isdom: Domain-Specific Calibration Dynamics in Prediction Markets T able 2: Summary statistics by domain: Polymarket (three comparable domains; cutof f 31 December 2025). Domain Markets T rades Contracts Resolved Med. v ol. Base rate Sports 25,340 49.1M 21.1B 90.0% 129 34.0% Crypto 73,918 125.3M 10.7B 98.8% 674 45.0% Politics 14,225 45.7M 24.6B 81.1% 452 30.7% T otal 113,483 220.1M 56.4B — 417 38.2% Note: Polymarket comparison is restricted to three domains with suf ficient coverage; Finance is e xcluded due to thin cov erage (2,516 markets). W eather and Entertainment hav e negligible Polymarket presence. The 42.5% of Polymarket markets classified as ‘Other’ reflects its long tail of bespoke markets. Median volume is the median number of trades per market. T able 3: Logistic recalibration slopes by domain and time-to-resolution. V alues abo ve 1.0 indicate underconfidence (prices compressed); below 1.0 indicate o verconfidence (prices too e xtreme). Domain 0–1h 1–3h 3–6h 6–12h 12–24h 24–48h 2d–1w 1w–1mo 1mo+ Politics 1.34 0.93 1.32 1.55 1.48 1.52 1.83 1.83 1.73 Sports 1.10 0.96 0.90 1.01 1.05 1.08 1.04 1.24 1.74 Crypto 0.99 1.01 1.07 1.01 1.01 1.21 1.12 1.09 1.36 Finance 0.96 1.07 1.03 0.97 0.98 0.82 1.07 1.42 1.20 W eather 0.69 0.84 0.74 0.87 0.91 0.97 1.20 1.20 1.37 Entertainment 0.81 1.02 1.00 0.92 0.89 0.84 1.07 1.11 0.96 with π i = σ ( a + b · logit( p i )) and σ ( x ) = { 1 + exp( − x ) } − 1 . The slope b captures calibration quality . When b = 1 , the market is perfectly calibrated and prices correspond to true probabilities. When b > 1 , the market is under confident , meaning prices are insuf ficiently extreme, compressed tow ard 50%. A 70-cent contract actually corresponds to a true probability gr eater than 70%; the f av ourite is underpriced and the longshot is overpriced. This is the classic fav ourite–longshot bias [ 28 , 49 ]. Con versely , b < 1 indicates over confidence , with prices that are too extreme, overstating the probability gap between fav ourites and longshots. The intercept a captures directional bias (systematic over - or under-prediction of “yes” outcomes); the focus here is on the slope as the primary calibration measure. The analysis is restricted to trades with prices between 5 and 95 cents, excludes markets with fewer than 10 trades, requires at least 200 trades per analysis cell, and applies mild L 2 regularisation ( C = 10 ; 35 ). These choices are conservati ve; results are robust to alternati ve price ranges including [2 , 98] and [10 , 90] (Appendix A). 2.4 Analysis dimensions For each trade, time-to-resolution is computed as τ = close_time − trade_time and discretised into nine bins, [0 , 1 h ) , [1 h , 3 h ) , [3 h , 6 h ) , [6 h , 12 h ) , [12 h , 24 h ) , [24 h , 48 h ) , [2 d , 1 w ) , [1 w , 1 mo ) and [1 mo , ∞ ) . T rade sizes are discretised into four bins, Single (1 contract), Small (2–10), Medium (11–100) and Large ( > 100). The full analysis grid comprises 6 × 9 × 4 = 216 cells, all satisfying the minimum sample-size requirement. A total of 58.7 million Kalshi trades and 220.1 million Polymarket trades enter the calibration analysis after price filtering. Because Polymarket timestamps ha ve approximately 3-hour noise (from block-number bucketing), the tw o shortest time bins (0–1h and 1–3h) are unreliable for cross-platform comparison; all Polymark et time-horizon results belo w use the se ven reliable bins (3–6h through 1mo+). 3 The calibration landscape Figure 1 plots calibration slopes against time-to-resolution for each domain. The detailed slopes are reported in T able 3. Slopes above 1 indicate underconfidence (prices compressed toward 50%); slopes below 1 indicate overconfidence (prices too extreme). T wo features are immediately apparent: domains differ sharply , and these differences reflect different shapes of calibration trajectory , not mere lev el shifts. 3.1 Three stylised facts Stylised F act 1: All markets ar e underconfident about the distant futur e. At long time horizons, prices in e very domain become compressed tow ard 50%, insufficiently extreme relati ve to the true outcome frequencies. The univ ersal horizon 5 Decomposing Crowd W isdom: Domain-Specific Calibration Dynamics in Prediction Markets b Figure 1: Calibration slope b versus time-to-resolution, one line per domain. Slopes above 1 indicate underconfidence (prices compressed tow ard 50%); slopes below 1 indicate o verconfidence (prices too extreme). b b Figure 2: Cross-platform calibration slope trajectories: (A) Kalshi vs (B) Polymarket. The dominant pattern, political underconfidence, replicates across exchanges. Finance is sho wn on Polymarket for visual context b ut is excluded from formal cross-platform analysis due to thin cov erage (2,516 markets). component µ ( τ ) , computed as the mean slope across all domain–size cells at each time bin (Section 5), rises from 0.99 (0–1 hour) to 1.32 (beyond one month); note that this cell-le vel mean dif fers from the simple av erage of the six aggregate domain slopes in T able 3, which are contract-weighted pooled estimates. This pattern is the classic fav ourite–longshot bias [ 28 , 59 , 61 , 66 ] documented at unprecedented scale: at long horizons, fav ourites are systematically underpriced and longshots are overpriced. It persists after restricting to high-volume markets (Appendix A), is consistent with theoretical predictions about favourite–longshot bias worsening with time to expiration [ 49 ], and is confirmed on Polymarket across all three comparable domains. Stylised F act 2: Domains follow dif fer ent calibration tr ajectories (the full posterior β matrix is in T able 13). This is the key insight. Political markets exhibit persistent underconfidence at nearly all horizons (slopes 0.93–1.83), with prices chronically compressed to ward 50%. A 70-cent contract in Politics one week before resolution corresponds to a true probability of approximately 83%, not 70%. Sports markets are well calibrated at short-to-medium horizons (slopes 0.90–1.10 from 0 to 48 hours) b ut become sharply underconfident at long horizons, reaching 1.74 beyond one 6 Decomposing Crowd W isdom: Domain-Specific Calibration Dynamics in Prediction Markets T able 4: Calibration slopes by domain and trade size (Kalshi). ∆ (L − S) is the mean of time-bin-specific slope dif ferences between the Lar ge and Single bins (the bootstrap estimand). On Polymarket, the Politics ∆ is +0 . 11 [ − 0 . 15 , +0 . 39] (not significant); Sports +0 . 01 [ − 0 . 20 , +0 . 17] ; Crypto +0 . 09 [ − 0 . 16 , +0 . 36] . Domain Single Small Medium Large ∆ (L − S) Politics 1.19 1.22 1.37 1.74 +0 . 53 Sports 1.00 1.01 1.01 1.01 +0 . 07 Crypto 1.03 1.03 1.02 1.00 − 0 . 02 Finance 1.10 1.08 1.05 1.05 − 0 . 05 W eather 0.96 0.94 0.91 0.89 − 0 . 07 Entertainment 0.98 1.02 1.00 0.99 +0 . 01 month. W eather markets exhibit the opposite pattern: o verconfidence at short horizons (slopes 0.69–0.97 within 48 hours), where prices are too e xtreme. A journalist asking “Should I trust this prediction market price?” receiv es a fundamentally dif ferent answer depending on the subject matter and timing. These domain-specific trajectories replicate on Polymarket: Politics is underconfident (mean slope 1.31), Sports is near-calibrated (1.08), and Crypto is mildly underconfident (1.05). Stylised F act 3: In political markets, lar ge tr ades ar e associated with gr eater price compr ession. On Kalshi, lar ge trades (ov er 100 contracts) in political markets produce calibration slopes of 1.74, compared to 1.19 for single-contract trades (T able 4). The gap of 0.53 (95% bootstrap CI [0 . 29 , 0 . 75] ) is both statistically significant and practically consequential. In sports markets, the corresponding g ap is 0.07 ( [ − 0 . 07 , 0 . 26] ). Because prediction mark et prices weight traders by position size, these large, poorly calibrated trades are associated with disproportionate influence on the price. Howe ver , the effect is platform-specific: on Polymarket, the Politics gap shrinks to 0.11 ( [ − 0 . 15 , 0 . 39] ), which is not statistically significant. The scale effect appears to reflect Kalshi’ s specific microstructure rather than a uni versal property of political prediction markets. 4 Diagnosing potential artefacts 4.1 Is political underconfidence dri ven by a subset of markets? Political markets encompass div erse subcategories. If underconfidence were dri ven by a single subcategory , the finding would be narro wer than claimed. Examining 10 political subcategories with sufficient data (see supplementary material), the pattern is found to be broadly distrib uted. Electoral College contracts show the strongest underconfidence (slopes 1.53–2.87 across time bins), while Trump Administration contracts span a wider range (0.54–1.64). Other Politics (1.42–2.38), Gov ernor (1.19–4.02) and NYC Mayor (1.12–3.18) all exhibit persistent underconfidence. 4.2 Composition effects in the 1–3 hour bin T able 3 shows that Politics achie ves its lo west slope (0.93) at the 1–3 hour horizon, the only time bin where Politics appears slightly overconfident rather than underconfident. Disaggregation re veals a composition effect. T rump Administration markets comprise 63% of trades in this bin and ha ve a moderate slope of 1.08. Meanwhile, Electoral College contracts (7.4% of trades, slope 1.81) and Other Politics (5.8%, slope 2.17) remain strongly underconfident but are diluted by the Trump Administration majority . Leav e-one-out analysis confirms the mixing: remo ving T rump Administration (the moderate majority) drops the aggregate from 0.93 to 0.88, revealing that the remaining subcategories are highly heterogeneous: some strongly underconfident (Electoral College 1.81, Other Politics 2.17), others overconfident (Biden Administration − 0 . 14 , a negati ve slope based on only 3.6% of trades in this bin, likely reflecting thin, stale markets during the administration transition). Their opposing biases average to a misleadingly low aggregate. Removing Electoral College (the most underconfident minority) drops the aggre gate to 0.69. The lo w aggregate slope reflects subcate gory mixing, not a genuine regime shift. 4.3 W eighting sensitivity and the scale effect Prediction market prices implicitly weight traders by position size. T o disentangle the market price (contract-weighted) from the crowd belief distrib ution (trade-weighted), the two weighting schemes are compared. In Politics, contract- weighted slopes exceed trade-weighted slopes by an average of 0.33 across all time bins, with the gap reaching 0.54 at the 2-day-to-1-week horizon. Contract-weighted prices are mor e compressed than trade-weighted prices: larger positions are associated with prices further from truth. In Sports, the corresponding gap averages 0.06 and is concentrated at 7 Decomposing Crowd W isdom: Domain-Specific Calibration Dynamics in Prediction Markets the longest horizon (0.35 at 1 month+, near zero else where). The influence of large trades is amplified by the heavy right ske w in trade sizes: the median trade inv olves 40 contracts, but just 0.15% of trades (those exceeding 10,000 contracts) account for approximately 15% of total contract volume, confirming that a small number of large trades ex ert disproportionate influence on contract-weighted prices. On Polymarket, the Politics weighting gap collapses to +0 . 05 , a more than six-fold reduction, and oscillates in sign across time bins, independently confirming that the scale effect is platform-specific. 5 The decomposition model 5.1 Framework The patterns in Section 3 suggest an additive structure. The calibration slope is modelled as θ observed in cell ( d, τ , s ) , where d index es domain, τ index es time-to-resolution bin and s indexes trade-size bin: θ ( d, τ , s ) = µ ( τ ) + α d + β d ( τ ) + γ d ( s ) + ε, (3) where µ ( τ ) is a universal horizon function capturing the shared tendency toward underconfidence at long horizons; α d is a domain inter cept capturing persistent bias (positiv e for Politics, negativ e for W eather); β d ( τ ) is a domain-by-horizon interaction capturing how each domain’ s trajectory de viates from the uni versal curve; and γ d ( s ) is a scale effect capturing ho w trade size modulates calibration within each domain. The model is identified by the follo wing constraints. D X d =1 α d = 0 , (4) D X d =1 β d ( τ ) = 0 for each τ , (5) S X s =1 γ d ( s ) = 0 for each d. (6) These ensure that the universal horizon function µ ( τ ) absorbs the cross-domain mean at each horizon, the domain intercepts α d absorb the cross-horizon mean for each domain, and the scale effects are mean-centred within each domain. The additiv e specification is chosen for interpretability and parsimony . In logit space, calibration slopes are unbounded and approximately continuous, making additi ve decomposition on the logit-transformed calibration measure a natural first-order approximation. A multiplicative specification (modelling log slopes) was also considered; the two yield nearly identical fits because the slopes are concentrated in the range [0 . 7 , 1 . 9] , where additive and log-additi ve structures are approximately equiv alent. A non-domain-specific size–horizon interaction term was tested (Section 5.4) and found to explain only 2.6% additional v ariance, insufficient to justify the 54 additional parameters it requires. The Bayesian hierarchical model in Section 6 provides a complementary check: its continuous parameterisation of the scale ef fect ( δ d × log s ) dif fers structurally from the cate gorical specification here, yet the two approaches yield parameter estimates within 0.005 of each other (T able 6), supporting the robustness of the additi ve decomposition to functional-form assumptions. 5.2 V ariance decomposition The decomposition is estimated using sequential projection, analogous to T ype I sums of squares. Let ¯ θ denote the grand mean of all 216 observed slopes. The total sum of squares is SS tot = X d,τ ,s θ ( d, τ , s ) − ¯ θ 2 , (7) and the residual sum of squares after fitting (3) is SS res = X d,τ ,s θ ( d, τ , s ) − ˆ θ ( d, τ , s ) 2 , (8) where ˆ θ ( d, τ , s ) = ˆ µ ( τ ) + ˆ α d + ˆ β d ( τ ) + ˆ γ d ( s ) . Each component’ s marginal contrib ution is computed sequentially: R 2 µ = 1 − SS ( µ ) res / SS tot , then R 2 α = R 2 µ,α − R 2 µ , and so on. T able 5 reports the variance e xplained. The model accounts 8 Decomposing Crowd W isdom: Domain-Specific Calibration Dynamics in Prediction Markets T able 5: V ariance decomposition of calibration slopes (216 cells, T ype I). Component Interpretation Marginal R 2 Cumulativ e R 2 µ ( τ ) Univ ersal horizon effect 0.302 0.302 α d Domain intercept 0.146 0.448 β d ( τ ) Domain × horizon interaction 0.260 0.708 γ d ( s ) Domain × size effect 0.165 0.873 ε Residual 0.127 — for 87.3% of calibration variance across 216 cells. The model has 72 parameters (9 for µ , 5 for α , 40 for β , 18 for γ ) for 216 observations, yielding an adjusted R 2 of 0.810. It is worth noting, howe ver , that the Bayesian hierarchical model in Section 6, which imposes partial pooling through hierarchical priors and thus penalises effecti ve model complexity , achiev es 96.3% posterior predictive coverage (Section 6.3), confirming that the four-component structure captures genuine signal rather than noise. The domain-by-horizon interaction β is the single lar gest domain-specific component (26.0%). Kno wing which domain a market belongs to and when you observe it is more informati ve about calibration quality than either piece of information alone. A domain-agnostic model, ho wev er sophisticated, misses the largest source of calibration v ariation. Because T ype I decomposition is order-dependent, verification is conducted with T ype II and T ype III sums of squares. The interaction terms are nearly identical across all three types, with β accounting for 26.0% and γ for 16.1–16.5% regardless of decomposition order (the small range reflects minor numerical dif ferences between sequential projection and OLS estimation). Only the main effects shift between types, as e xpected when time and domain share variance. Additionally , weighting cells by in verse estimation v ariance yields the weighted decomposition ˆ ϕ WLS = arg min ϕ X d,τ ,s w dτ s θ ( d, τ , s ) − ˆ θ ( d, τ , s ; ϕ ) 2 , w dτ s = 1 / SE 2 dτ s , (9) where ϕ = ( µ, α, β , γ ) collects all model parameters. This yields a total R 2 of 0.995, with the horizon effect µ dominating (0.74 vs 0.30 unweighted). This confirms that the four -component model explains nearly all v ariance in precisely estimated cells; the 12.7% residual in the unweighted decomposition is concentrated in noisy , lo w-volume cells (Appendix A). The domain intercepts replicate on Polymarket: Politics remains the clear positiv e outlier (mean slope 1.31 at reliable horizons), while Sports (1.08) and Crypto (1.05) cluster near perfect calibration, the same qualitati ve ranking as on Kalshi (Appendix C reports full cross-platform comparison tables). 5.3 Statistical significance All components are highly significant (T able 10). Domain intercepts differ ( F (5 , 144) = 33 . 16 , p < 10 − 16 ). Domain- specific trajectories are necessary ( F (40 , 144) = 7 . 40 , p < 10 − 16 ). The domain-by-size interaction is confirmed ( F (18 , 144) = 10 . 42 , p < 10 − 16 ). The Politics scale effect (the slope dif ference of 0.53 between large and single-contract trades) is formally defined as ∆ d = 1 T T X τ =1 θ ( d, τ , s L ) − θ ( d, τ , s S ) , (10) where s L and s S index the Large and Single trade-size bins respectiv ely , and T = 9 is the number of time bins. This within-horizon av eraging ensures that the estimand is not confounded by compositional differences across horizons. The 95% trade-level bootstrap CI is [0 . 29 , 0 . 75] . Because trades within the same market are serially correlated, a market-clustered bootstrap is also computed (resampling entire markets rather than individual trades). The clustered CI is wider , as expected with fewer ef fecti ve resampling units, but still excludes zero ( [0 . 13 , 1 . 29] ). The Sports scale effect remains null under both methods (trade-lev el [ − 0 . 07 , 0 . 26] ; clustered [ − 0 . 03 , 0 . 05] ). 5.4 Is the scale effect confounded with time horizon? If large trades concentrate at long horizons, the scale effect could be an artefact of horizon confounding. Three checks rule this out. First, in Politics, lar ge trades have shorter median horizons (213 hours) than single-contract trades (862 hours); confounding would therefore bias against finding a scale effect, not in favour of it. Second, adding a non-domain-specific size–horizon interaction to the model explains only 2.6% additional variance; the domain-specific scale effect γ remains substantial ( R 2 = 0 . 132 vs 0 . 161 in the OLS specification without the interaction; the sequential 9 Decomposing Crowd W isdom: Domain-Specific Calibration Dynamics in Prediction Markets ( ) ( ) d d d ( ) d ( ) d ( s ) d ( s ) Figure 3: Four -panel decomposition of calibration slopes. (A) Universal horizon ef fect µ ( τ ) . (B) Domain intercepts α d . (C) Domain-by-horizon interactions β d ( τ ) . (D) Domain-by-size ef fects γ d ( s ) . projection in T able 5 yields 0 . 165 ). Third, within Politics, the scale effect is positiv e in all nine time bins, ranging from +0 . 12 (1–3 hours) to +0 . 81 (2 days–1 week). The scale effect is not an artefact of horizon confounding (T ables 9 and 10). 6 Bayesian hierar chical model The additi ve decomposition in Section 5 is descripti ve: it treats estimated slopes as data without accounting for their estimation uncertainty . A Bayesian hierarchical model is now de veloped that provides coherent uncertainty quantification and partial pooling. 6.1 Model specification For the observ ed calibration slope θ obs in cell ( d, τ , s ) , the model specifies three le vels. At the observ ation lev el, θ obs ( d, τ , s ) ∼ N µ ( τ ) + α d + β d ( τ ) + δ d · ˜ s, σ 2 , (11) 10 Decomposing Crowd W isdom: Domain-Specific Calibration Dynamics in Prediction Markets R 2 = 0 . 8 7 3 Figure 4: Observed v ersus fitted calibration slopes ( R 2 = 0 . 873 ). Each point is one of 216 analysis cells. b Figure 5: Calibration slopes by trade size: (A) Politics versus (B) Sports. In Politics, larger trades are associated with more compressed prices (higher slopes). In Sports, no such gradient exists. where ˜ s = log s − log s is the centred log trade size for bin s . At the prior le vel, each component receives a hierarchical structure. µ ( τ ) ∼ N (1 . 0 , 0 . 5 2 ) , τ = 1 , . . . , 9 , (12) α d ∼ N (0 , σ 2 α ) , 6 X d =1 α d = 0 , (13) β d ( τ ) ∼ N (0 , σ 2 β ) , X d β d ( τ ) = 0 ∀ τ , (14) δ d ∼ N (0 , σ 2 δ ) . (15) 11 Decomposing Crowd W isdom: Domain-Specific Calibration Dynamics in Prediction Markets b Figure 6: Cross-platform scale effect in Politics. (A) Kalshi shows a monotonic increase from Single (1.19) to Lar ge (1.74), ∆ = +0 . 53 [0 . 29 , 0 . 75] . (B) Polymarket sho ws a non-monotonic pattern, ∆ = +0 . 11 [ − 0 . 15 , +0 . 39] (not significant). Bar labels sho w aggregate slope dif ferences (T able 16); bootstrap CIs use the within-horizon estimand of Equation (10). T able 6: Bayesian posterior summaries for domain intercepts α d . Domain Post. mean SD 95% CI Freq. Politics +0 . 151 0.015 [+0 . 122 , +0 . 179] +0 . 156 Sports +0 . 010 0.015 [ − 0 . 020 , +0 . 039] +0 . 009 Crypto +0 . 005 0.015 [ − 0 . 024 , +0 . 034] +0 . 004 Finance +0 . 006 0.015 [ − 0 . 023 , +0 . 035] +0 . 006 W eather − 0 . 086 0.015 [ − 0 . 115 , − 0 . 057] − 0 . 090 Entertainment − 0 . 085 0.015 [ − 0 . 114 , − 0 . 056] − 0 . 086 Note: Freq. column reports the corresponding frequentist estimate. Maximum discrepancy is 0.005 (Politics). The prior for µ ( τ ) is centred at perfect calibration ( b = 1 ). At the hyperprior le vel, σ α , σ β , σ δ , σ ind . ∼ Half - Cauch y(0 , 1) . (16) The non-centred parameterisation α d = σ α · α raw d , with α raw d ∼ N (0 , 1) , is used for all hierarchical effects to improv e sampling efficienc y . Sum-to-zero constraints apply to all domain-le vel parameters. 6.2 Results Posterior inference is conducted via Hamiltonian Monte Carlo [ 8 , 46 ] using NumPyro [ 52 ] (4 chains, 4,000 iterations with 2,000 warmup). The maximum split- ˆ R [ 11 , 68 ] is 1.000, the minimum bulk ef fectiv e sample size is 4,070, and no div ergent transitions occurred. T able 6 reports domain intercepts. Politics is the clear outlier: posterior mean +0 . 151 (95% credible interval [0 . 122 , 0 . 179] ), entirely abov e zero, confirming persistent underconfidence. W eather ( − 0 . 086 , [ − 0 . 115 , − 0 . 057] ) and Entertainment ( − 0 . 085 , [ − 0 . 114 , − 0 . 056] ) are significantly belo w zero, indicating ov erconfidence. Sports ( +0 . 010 ), Crypto ( +0 . 005 ) and Finance ( +0 . 006 ) are indistinguishable from zero. The maximum parameter discrepancy between approaches is 0.005 (Politics), confirming that the hierarchical priors provide appropriate shrinkage without distortion. It is w orth noting that the frequentist model treats γ d ( s ) as categorical (four size bins), while the Bayesian model parameterises the scale effect as δ d × log( s ) , a continuous linear specifi- cation; the close agreement between the two despite this parameterisation difference supports the robustness of the decomposition. The scale sensiti vity δ confirms the scale ef fect, with Politics at δ = +0 . 088 (95% CI [0 . 072 , 0 . 103] ), the only domain with a credible interval entirely above zero, indicating that larger trades are associated with more compressed, less calibrated prices. 12 Decomposing Crowd W isdom: Domain-Specific Calibration Dynamics in Prediction Markets Figure 7: Posterior predictiv e check: observed versus posterior -predicted calibration slopes with 95% intervals. Of 216 cells, 208 (96.3%) fall within their prediction interv als. 6.3 Posterior pr edictive check Of 216 cells, 208 (96.3%) hav e observed slopes within their 95% posterior predictiv e intervals, close to the nominal 95% cov erage (T able 14 reports per-domain breakdo wns). The 8 cells outside are not concentrated in any single domain (Figure 7). 7 Discussion 7.1 Why do domains differ? The finding that domain-by-horizon interactions constitute the largest calibration component (26.0%) demands explana- tion. Three interpreti ve hypotheses are of fered. The bilateral cancellation hypothesis. Political markets attract traders with strong, opposing con victions. In a presidential race, partisans on both sides may trade aggressiv ely , each confident their candidate will win. These opposing bets partially cancel: a large buy order at 65 cents meets a large sell order , and the price stays near 50–60% even when the true probability is substantially higher or lower . The result is systematic price compression (underconfidence) that worsens as larger , more con viction-driv en traders enter the market. This connects directly to Manski’ s (2006) theoretical prediction (see also 48 ) that heterogeneous beliefs and risk preferences can cause prices to div erge from mean beliefs, and explains why the scale ef fect is confined to Politics: the other domains lack the bipolar con viction structure that dri ves bilateral cancellation. Cross-platform evidence strengthens this interpretation: the domain-le vel underconfidence ( b > 1 ) replicates on Polymarket, confirming that bilateral cancellation is a structural feature of political prediction, but the trade-size amplification does not, consistent with Polymarket’ s pseudonymous blockchain en vironment fragmenting whale positions across multiple wallets and its 11 × deeper liquidity absorbing large trades more efficiently (T ables 16 – 17). Note that Politics on Kalshi, despite comprising only 7.6% of trades, accounts for 13.3% of contract volume, consistent with lar ger position sizes driv en by con viction. The signal over -r eaction hypothesis. W eather markets are uniquely ov erconfident at short horizons, the only domain where prices are too extreme. This likely reflects ov er-reaction to meteorological s ignals. When a forecast predicts a storm tomorro w , traders push prices too far: they o vershoot what climatological base rates w ould justify . W eather’ s low base rate (24.0% in T able 1, reflecting threshold exceedance contracts) means that o ver -reacting to “yes” signals is particularly costly . At longer horizons, where meteorological signals are weaker and base rates dominate, weather markets con verge to the uni versal underconfidence pattern. 13 Decomposing Crowd W isdom: Domain-Specific Calibration Dynamics in Prediction Markets The information con ver gence hypothesis. Sports markets are well calibrated at short-to-medium horizons because information is continuous, quantifiable and publicly observ able: game scores update in real time, player statistics are tracked in detail, injury reports follow regular schedules. This generates smooth conv ergence to truth with minimal disagreement, so that prices reach appropriate extremes. At long horizons (1 month+), sports forecasting becomes more speculativ e, information advantage declines, and the same f av ourite–longshot underconfidence that affects all domains takes hold (slope 1.74). The sports trajectory illustrates a general principle: calibration quality tracks the richness of the av ailable information environment [cf. 62]. 7.2 Practical implications for pr ediction market consumers Prediction markets are increasingly cited by journalists, embedded in ne ws coverage and referenced by polic ymakers. The findings suggest domain-specific caution. For any (domain, horizon, trade-size) combination, the estimated slope ˆ θ transforms a raw market price p ∈ (0 , 1) into a recalibrated probability . p ∗ = σ ˆ θ · logit( p ) = p ˆ θ p ˆ θ + (1 − p ) ˆ θ , (17) where σ ( · ) is the logistic function and the second equality follows from algebraic simplification. When ˆ θ > 1 (underconfidence), p ∗ > p for p > 0 . 5 and p ∗ < p for p < 0 . 5 , so the recalibrated probability is more extreme than the raw price. When ˆ θ < 1 (ov erconfidence), the recalibrated probability is more moderate. The full 216-cell calibration matrix is provided as supplementary material. F or political markets. A price of 70 cents in a political market one week before resolution does not mean 70%. Applying (17) with the domain- and horizon-specific slope ˆ θ ≈ 1 . 83 yields p ∗ = 0 . 70 1 . 83 0 . 70 1 . 83 + 0 . 30 1 . 83 ≈ 0 . 83 . (18) Political prediction mark et prices are systematically compressed toward 50%, with fa vourites underpriced and longshots ov erpriced. Journalists who report these prices at f ace value systemat ically understate the confidence that should be attached to the leading outcome. F or sports markets. At horizons under one week, sports market prices are reasonably trustw orthy (slopes 0.90–1.10). Beyond one month, the fa vourite–longshot bias appears strongly (slope 1.74). F or weather markets. At short horizons, weather prices are if anything too e xtreme, ov er-reacting to signals. Consumers of short-horizon weather contracts should recognise that the price may overstate the probability of the predicted outcome. At moderate horizons, weather markets are among the best calibrated. 7.3 Implications for mark et design P osition limits in political mark ets. The scale effect suggests that large positions are associated with amplified price compression in political markets. Position limits or progressive fee structures would reduce the influence of con viction-driv en bilateral trading. One-person-one-vote aggr e gation. The finding that trade-weighted calibration is substantially better than contract- weighted calibration in Politics (mean gap 0.33) suggests that equal-weight aggreg ation may produce better probabilities in politically polarised domains. Prediction polls [ 4 , 51 ] that weight each forecaster equally may outperform wealth- weighted markets for political questions. Domain-specific credibility indicators. Exchanges could display calibration track records alongside prices, such as a traffic-light system indicating whether a giv en domain–horizon combination has historically been well calibrated, compressed, or ov er-reacti ve. 7.4 Implications for f orecasting resear ch These results challenge domain-agnostic calibration studies. The decomposition sho ws that pooling across domains obscures the dominant source of calibration variation. Future studies should stratify by domain and time horizon. The four-component frame work extends naturally to election models, expert platforms and machine learning probability outputs. 14 Decomposing Crowd W isdom: Domain-Specific Calibration Dynamics in Prediction Markets 7.5 Limitations Sev eral limitations should be noted. First, although core findings are v alidated on two exchanges, both are US-centric platforms; prediction markets in different re gulatory environments (e.g. Betf air in the UK; see 60 ) may exhibit dif ferent patterns. The Polymarket comparison is limited to three of six domains and affected by timestamp noise at short horizons. Second, the domain classification is coarse. W ithin Politics, subcategories have different dynamics (Section 4). A finer-grained decomposition w ould require a more complex model. Third, only trades are observed, not trader identities. The bilateral cancellation interpretation of the scale effect is consistent with the data b ut is a hypothesis. Alternativ e e xplanations (institutional hedging, algorithmic artef acts) cannot be ruled out without richer data. Fourth, the logistic recalibration model is one approach to measuring calibration. Reliability diagrams [ 45 ], proper scoring rules [ 10 , 27 ] and nonparametric calibration curv es pro vide complementary perspectives that future w ork should integrate. Fifth, whether these patterns are stable ov er time is an open question. The decomposition is designed to be re-estimated as new data becomes a vailable. 8 Conclusion Prediction markets are powerful information aggregation mechanisms, b ut their po wer is not uniform. This paper shows, using data from two structurally dif ferent exchanges, that calibration v aries systematically across kno wledge domains, time horizons and trade sizes. Four components account for 87.3% of this v ariation on Kalshi, and the dominant pattern, political underconfidence, replicates on Polymarket. All crowds share a tendenc y tow ard the fav ourite–longshot bias at long horizons, with prices compressed to ward 50%, understating the probability of fav oured outcomes. But some crowds, particularly those trading on political ev ents, exhibit this compression at nearly e very horizon, and it is most pronounced among the traders who wager most hea vily . This is interpreted as bilateral cancellation, in which opposing partisan bets pull prices tow ard 50%. This interpretation is consistent with the broader behavioural finance literature on ho w probability weighting distorts risk assessment [ 36 , 67 ]. Cross-platform evidence supports this interpretation. The domain-lev el bias replicates on Polymarket, but the trade-size amplification does not, consistent with pseudonymous blockchain trading fragmenting whale positions. Other cro wds, those trading on weather, display the opposite bias at short horizons, o ver -reacting to signals and pushing prices too far . Sports cro wds, anchored by continuous information and disciplined by professional participants, come closest to the calibration ideal at short-to-medium horizons. These findings have practical consequences. Millions of people now consult prediction markets. If they take prices at face value, the y are systematically misled, and the direction of their error depends on what they are looking at. In political markets, the true probability of the fa voured outcome is substantially higher than the price suggests. In short-horizon weather markets, it may be lo wer . The wisdom of crowds is real, b ut it has a structure. Understanding that structure is essential for using it wisely . Data a vailability statement The Kalshi and Polymarket data used in this study were collected using the data collection framew ork and pre-collected dataset of Becker [6] , a v ailable at https://github.com/Jon- Becker/prediction- market- analysis/ . The raw data are also publicly accessible through the Kalshi API ( https://trading- api.readme.io/ ) and the Gamma API/Polygon blockchain inde xer . The analysis code, domain classification rules and the full 216-cell calibration matrix are av ailable at https://github.com/namanhz/prediction- market- calibration and as supplementary material. All results can be reproduced from the deposited code and the publicly accessible datasets. Supplementary material Supplementary material is av ailable online. It includes (a) the full 216-cell calibration matrix as a CSV file, (b) domain classification rules (560+ pattern rules) and (c) cross-platform comparison tables. 15 Decomposing Crowd W isdom: Domain-Specific Calibration Dynamics in Prediction Markets Acknowledgements The author thanks Jonathan Becker for de veloping the prediction mark et data collection framew ork and pre-collected dataset, which greatly facilitated data acquisition for this study . Funding This research receiv ed no specific grant from any funding agenc y in the public, commercial or not-for-profit sectors. Conflict of interest The author declares no conflict of interest. The author has no financial interest in Kalshi, Polymarket or any prediction market exchange. References [1] M. M. Ali. Probability and utility estimates for racetrack bettors. Journal of P olitical Economy , 85:803–815, 1977. [2] K. J. Arrow , R. Forsythe, M. Gorham, R. Hahn, R. Hanson, J. O. Ledyard, S. Levmore, R. Litan, P . Milgrom, F . D. Nelson, G. R. Neumann, M. Otta viani, T . C. Schelling, R. J. Shiller , V . L. Smith, E. Sno wberg, C. R. Sunstein, P . C. T etlock, P . E. T etlock, H. R. V arian, J. W olfers, and E. Zitze witz. The promise of prediction markets. Science , 320:877–878, 2008. [3] H. Assareh, R. Noorossana, and K. L. Mengersen. Bayesian change point estimation in Poisson-based control charts. J ournal of Industrial Engineering International , 9:32, 2013. [4] P . Atanaso v , P . Rescober , E. Stone, S. A. Swift, E. Servan-Schreiber , P . T etlock, L. Ungar , and B. Mellers. Distilling the wisdom of crowds: prediction markets vs. prediction polls. Manag ement Science , 63:691–706, 2017. [5] J. Baron, B. A. Mellers, P . E. T etlock, E. Stone, and L. H. Ungar . T wo reasons to make aggre gated probability forecasts more extreme. Decision Analysis , 11:133–145, 2014. [6] Jonathan Becker . The microstructure of wealth transfer in prediction mark ets, 2026. URL https://jbecker. dev/research/prediction- market- microstructure . Dataset and analysis framew ork av ailable at https: //github.com/Jon- Becker/prediction- market- analysis/ . [7] J. E. Berg, F . D. Nelson, and T . A. Rietz. Prediction market accuracy in the long run. International Journal of F orecasting , 24:285–300, 2008. [8] M. Betancourt. A conceptual introduction to Hamiltonian Monte Carlo. arXiv pr eprint arXiv:1701.02434 , 2017. [9] J. E. Bickel. Some comparisons among quadratic, spherical, and logarithmic scoring rules. Decision Analysis , 4: 49–65, 2007. [10] G. W . Brier . V erification of forecasts expressed in terms of probability . Monthly W eather Revie w , 78:1–3, 1950. [11] S. P . Brooks and A. Gelman. General methods for monitoring con vergence of iterativ e simulations. J ournal of Computational and Graphical Statistics , 7:434–455, 1998. [12] C. F . Camerer , A. Dreber , E. Forsell, T .-H. Ho, J. Huber, M. Johannesson, M. Kirchler , J. Almenberg, A. Altmejd, T . Chan, E. Heikensten, F . Holzmeister , T . Imai, S. Isaksson, G. Nave, T . Pfeiffer , M. Razen, and H. W u. Evaluating replicability of laboratory experiments in economics. Science , 351:1433–1436, 2016. [13] K.-Y . Chen and C. R. Plott. Information aggregation mechanisms: concept, design, and implementation for a sales forecasting problem. W orking Paper No. 1131, California Institute of T echnology , 2002. [14] B. Cowgill and E. Zitze witz. Corporate prediction markets: e vidence from Google, Ford, and Firm X. Re view of Economic Studies , 82:1309–1341, 2015. [15] A. P . Dawid. The well-calibrated Bayesian. Journal of the American Statistical Association , 77:605–610, 1982. [16] M. H. DeGroot and S. E. Fienberg. The comparison and ev aluation of forecasters. The Statistician , 32:12–22, 1983. [17] S. DellaV igna and D. Pope. Predicting e xperimental results: who knows what? Journal of P olitical Economy , 126:2410–2456, 2018. 16 Decomposing Crowd W isdom: Domain-Specific Calibration Dynamics in Prediction Markets [18] A. Dreber , T . Pfeiffer , J. Almenberg, S. Isaksson, B. W ilson, Y . Chen, B. A. Nosek, and M. Johannesson. Using prediction markets to estimate the reproducibility of scientific research. Pr oceedings of the National Academy of Sciences , 112:15343–15347, 2015. [19] D. Easle y and M. O’Hara. Price, trade size, and information in securities markets. J ournal of F inancial Economics , 19:69–90, 1987. [20] R. S. Erikson and C. Wlezien. Are political markets really superior to polls as election predictors? Public Opinion Quarterly , 72:190–215, 2008. [21] E. F . Fama. Efficient capital markets: a revie w of theory and empirical work. The J ournal of F inance , 25:383–417, 1970. [22] R. Forsythe, F . Nelson, G. R. Neumann, and J. Wright. Anatomy of an experimental political stock market. American Economic Revie w , 82:1142–1161, 1992. [23] F . Galton. V ox populi. Natur e , 75:450–451, 1907. [24] A. Gelman and J. Hill. Data Analysis Using Re gr ession and Multilevel/Hierar chical Models . Cambridge University Press, Cambridge, 2007. [25] A. Gelman, J. B. Carlin, H. S. Stern, D. B. Dunson, A. V ehtari, and D. B. Rubin. Bayesian Data Analysis . Chapman and Hall/CRC, Boca Raton, 3rd edition, 2013. [26] L. R. Glosten and P . R. Milgrom. Bid, ask and transaction prices in a specialist market with heterogeneously informed traders. J ournal of F inancial Economics , 14:71–100, 1985. [27] T . Gneiting and A. E. Raftery . Strictly proper scoring rules, prediction, and estimation. J ournal of the American Statistical Association , 102:359–378, 2007. [28] R. M. Griffith. Odds adjustments by American horse-race bettors. American J ournal of Psychology , 62:290–294, 1949. [29] S. J. Grossman and J. E. Stiglitz. On the impossibility of informationally ef ficient markets. American Economic Revie w , 70:393–408, 1980. [30] R. Hanson. Combinatorial information market design. Information Systems F r ontiers , 5:107–119, 2003. [31] F . A. Hayek. The use of kno wledge in society . American Economic Revie w , 35:519–530, 1945. [32] M. D. Hof fman and A. Gelman. The No-U-T urn sampler: adaptiv ely setting path lengths in Hamiltonian Monte Carlo. J ournal of Machine Learning Resear ch , 15:1593–1623, 2014. [33] J. Hogg, J. Cameron, S. Cramb, P . Baade, and K. Mengersen. A two-stage Bayesian small area estimation approach for proportions. International Statistical Re view , 92:455–482, 2024. [34] L. Hong and S. E. Page. Groups of di verse problem solv ers can outperform groups of high-ability problem solvers. Pr oceedings of the National Academy of Sciences , 101:16385–16389, 2004. [35] D. W . Hosmer , S. Lemesho w , and R. X. Sturdi vant. Applied Logistic Re gression . Wile y , Hoboken, 3rd edition, 2013. [36] D. Kahneman and A. Tv ersky . Prospect theory: an analysis of decision under risk. Econometrica , 47:263–291, 1979. [37] E. Karger , J. T . Monrad, B. A. Mellers, and P . E. T etlock. Reciprocal scoring: a method for forecasting unanswerable questions. J udgment and Decision Making , 18:e3, 2023. [38] A. S. Kyle. Continuous auctions and insider trading. Econometrica , 53:1315–1335, 1985. [39] A. Leigh and J. W olfers. Competing approaches to forecasting elections: economic models, opinion polling and prediction markets. Economic Recor d , 82:325–340, 2006. [40] S. Lichtenstein, B. Fischhoff, and L. D. Phillips. Calibration of probabilities: the state of the art to 1980. In D. Kahneman, P . Slovic, and A. Tversky , editors, J udgment Under Uncertainty: Heuristics and Biases , pages 306–334. Cambridge Univ ersity Press, Cambridge, 1982. [41] Y . Liu, T . Gneiting, and A. E. Raftery . Boldness-recalibration for binary e vent predictions. The American Statistician , 78:426–436, 2024. [42] C. F . Manski. Interpreting the predictions of prediction markets. Economics Letters , 91:425–429, 2006. [43] B. Mellers, L. Ungar , J. Baron, J. Ramos, B. Gurcay , K. Fincher , S. E. Scott, D. Moore, P . Atanasov , S. A. Swift, T . Murray , E. Stone, and P . E. T etlock. Psychological strategies for winning a geopolitical forecasting tournament. Psychological Science , 25:1106–1115, 2014. 17 Decomposing Crowd W isdom: Domain-Specific Calibration Dynamics in Prediction Markets [44] K. L. Mengersen, C. P . Robert, and C. Guihenneuc-Jouyaux. MCMC con vergence diagnostics: a re view . In J. M. Bernardo, J. O. Berger , A. P . Dawid, and A. F . M. Smith, editors, Bayesian Statistics 6 , pages 415–440. Oxford Univ ersity Press, Oxford, 1999. [45] A. H. Murphy and R. L. W inkler . Reliability of subjective probability forecasts of precipitation and temperature. Journal of the Royal Statistical Society , Series C , 26:41–47, 1977. [46] R. M. Neal. MCMC using Hamiltonian dynamics. In S. Brooks, A. Gelman, G. Jones, and X.-L. Meng, editors, Handbook of Markov Chain Monte Carlo , pages 113–162. Chapman and Hall/CRC, Boca Raton, 2011. [47] A. Niculescu-Mizil and R. Caruana. Predicting good probabilities with supervised learning. In Pr oceedings of the 22nd International Confer ence on Machine Learning , pages 625–632, Ne w Y ork, 2005. ACM. [48] M. Ottaviani and P . N. Sørensen. The fav orite–longshot bias: an overvie w of the main explanations. In D. B. Hausch and W . T . Ziemba, editors, Handbook of Sports and Lottery Markets , pages 83–101. North-Holland, Amsterdam, 2008. [49] L. Page and R. T . Clemen. Do prediction mark ets produce well-calibrated probability forecasts? The Economic Journal , 123:491–513, 2013. [50] A. B. Palle y and V . A. Satopää. Robust recalibration of aggre gate probability forecasts using meta-beliefs. International Journal of F or ecasting , 40:1421–1434, 2024. [51] D. M. Pennock, S. La wrence, C. L. Giles, and F . A. Nielsen. The real po wer of artificial markets. Science , 291: 987–988, 2001. [52] D. Phan, N. Pradhan, and M. Janko wiak. Composable ef fects for flexible and accelerated probabilistic program- ming in NumPyro. arXiv pr eprint arXiv:1912.11554 , 2019. [53] J. C. Platt. Probabilistic outputs for support vector machines and comparisons to re gularised likelihood methods. In A. J. Smola, P . L. Bartlett, B. Schölkopf, and D. Schuurmans, editors, Advances in Lar ge Mar gin Classifiers , pages 61–74. MIT Press, Cambridge, MA, 1999. [54] C. R. Plott and S. Sunder . Rational expectations and the aggregation of di verse information in laboratory security markets. Econometrica , 56:1085–1118, 1988. [55] P . W . Rhode and K. S. Strumpf. Historical presidential betting markets. J ournal of Economic P erspectives , 18: 127–141, 2004. [56] D. Rothschild. Forecasting elections: comparing prediction markets, polls, and their biases. Public Opinion Quarterly , 73:895–916, 2009. [57] V . A. Satopää, J. Baron, D. P . F oster , B. A. Mellers, P . E. T etlock, and L. H. Ung ar . Combining multiple probability predictions using a simple logit model. International J ournal of F or ecasting , 30:344–356, 2014. [58] E. Serv an-Schreiber , J. W olfers, D. M. Pennock, and B. Galebach. Prediction markets: does mone y matter? Electr onic Markets , 14:243–251, 2004. [59] H. S. Shin. Optimal betting odds against insider traders. The Economic J ournal , 101:1179–1185, 1991. [60] M. A. Smith, D. Paton, and L. V . Williams. Market efficienc y in person-to-person betting. Economica , 73: 673–689, 2006. [61] E. Snowber g and J. W olfers. Explaining the fav orite–longshot bias: is it risk-lov e or misperceptions? Journal of P olitical Economy , 118:723–746, 2010. [62] C. R. Sunstein. Infotopia: How Many Minds Pr oduce Knowledge . Oxford Uni versity Press, Oxford, 2006. [63] J. Surowiecki. The W isdom of Cr owds . Doubleday , New Y ork, 2004. [64] P . E. T etlock. Expert P olitical Judgment: How Good Is It? How Can W e Know? Princeton Univ ersity Press, Princeton, 2005. [65] P . E. T etlock and D. Gardner . Superfor ecasting: The Art and Science of Pr ediction . Cro wn, New Y ork, 2015. [66] R. H. Thaler and W . T . Ziemba. Anomalies: parimutuel betting markets: racetracks and lotteries. Journal of Economic P erspectives , 2:161–174, 1988. [67] A. Tversk y and D. Kahneman. Advances in prospect theory: cumulati ve representation of uncertainty . J ournal of Risk and Uncertainty , 5:297–323, 1992. [68] A. V ehtari, A. Gelman, D. Simpson, B. Carpenter , and P . C. Bürkner . Rank-normalisation, folding, and localisation: an improv ed ˆ R for assessing con vergence of MCMC. Bayesian Analysis , 16:667–718, 2021. [69] R. L. Winkler . Scoring rules and the ev aluation of probabilities. T est , 5:1–60, 1996. 18 Decomposing Crowd W isdom: Domain-Specific Calibration Dynamics in Prediction Markets T able 7: V ariance decomposition under alternativ e specifications. Specification µ R 2 α R 2 β R 2 γ R 2 T otal R 2 Baseline [5 , 95] , C = 10 0.302 0.146 0.260 0.165 0.873 V olume ≥ 100 0.302 0.146 0.260 0.165 0.873 Price [10 , 90] 0.295 0.097 0.333 0.137 0.861 Price [2 , 98] 0.308 0.157 0.231 0.190 0.885 Price [1 , 99] 0.279 0.158 0.242 0.183 0.861 C = 1 0.302 0.146 0.260 0.165 0.873 C = 100 0.302 0.146 0.260 0.165 0.873 Note: T otal R 2 is stable across all price ranges (0.861–0.885) and regularisation strengths (identical at C = 1 , 10 , 100 ). V olume filtering produces identical results. The wider price range [2 , 98] slightly increases total R 2 to 0.885; the domain ranking is preserved. T able 8: Scale effect: trade-level v ersus market-clustered bootstrap. Domain Bootstrap method Mean ∆ 95% CI Sig.? Politics T rade-lev el +0 . 53 [0 . 29 , 0 . 75] Y es Politics Market-clustered +0 . 59 [0 . 13 , 1 . 29] Y es Sports Trade-le vel +0 . 07 [ − 0 . 07 , 0 . 26] No Sports Market-clustered +0 . 01 [ − 0 . 03 , 0 . 05] No T able 9: Size × horizon confounding diagnostic: median hours to close by domain and trade size. Domain Single Small Medium Large Sports 2.3 7.6 1.5 96.3 Crypto 202.2 5.7 0.6 5,936.7 Politics 862 1,505 1,488 213 Finance 1.7 427.1 0.5 4.5 W eather 14.9 15.8 24.2 156.6 Entertainment 144.3 0.5 0.6 55.5 Note: In Politics, large trades hav e shorter median horizons (213 hours) than single-contract trades (862 hours), meaning any horizon confounding would bias against finding a scale ef fect. T able 10: F -test deriv ation and effect sizes. Source SS df MS F P artial η 2 µ (time) 2.934 8 0.367 42.37 0.702 α (domain) 1.435 5 0.287 33.16 0.535 β (domain × time) 2.562 40 0.064 7.40 0.673 γ (domain × size) 1.624 18 0.090 10.42 0.566 Residual 1.247 144 0.009 — — All p -values are belo w 10 − 16 . Partial η 2 = SS component / (SS component + SS residual ) . [70] J. W olfers and E. Zitzewitz. Prediction markets. J ournal of Economic P erspectives , 18:107–126, 2004. [71] J. W olfers and E. Zitzewitz. Interpreting prediction market prices as probabilities. NBER W orking Paper No. 12200, 2006. [72] Johanna F . Ziegel. Coherence and elicitability . Mathematical F inance , 26(4):901–918, 2016. 19 Decomposing Crowd W isdom: Domain-Specific Calibration Dynamics in Prediction Markets T able 11: Prior specification. Parameter Prior Dim. Constraint µ ( τ ) N (1 . 0 , 0 . 5) 9 None σ α HalfCauc hy(1 . 0) 1 > 0 α raw N (0 , 1) 5 Sum-to-zero σ β HalfCauc hy(1 . 0) 1 > 0 β raw N (0 , 1) 40 Doubly centred σ δ HalfCauc hy(1 . 0) 1 > 0 δ raw N (0 , 1) 6 None σ HalfCauc hy(1 . 0) 1 > 0 Note: The model uses non-centred parameterisations for all hierarchical effects. The domain intercepts satisfy a sum-to-zero constraint. The interaction matrix β is doubly centred. T able 12: Hyperparameter posterior summaries. Parameter Mean SD 95% CI Interpretation σ α 0.097 0.035 [0 . 048 , 0 . 183] Moderate spread σ β 0.098 0.011 [0 . 079 , 0 . 122] W ell-constrained σ δ 0.036 0.013 [0 . 017 , 0 . 067] Small σ 0.097 0.006 [0 . 087 , 0 . 109] Residual ≈ 0 . 10 Note: Maximum ˆ R across all parameters is 1.0000; minimum effecti ve sample size is 4,070. A Robustness checks B Bayesian model specification and diagnostics C Cross-platf orm validation details This appendix provides full tabular results for the cross-platform comparison between Kalshi and Polymarket. Poly- market trade timestamps are deriv ed from Polygon block numbers via a bucketed lookup table with approximately 6-hour granularity , introducing approximately 3 hours of noise. Bins 0–1 hour and 1–3 hours are therefore unreliable for cross-platform comparison and are excluded from mean slope calculations. The Polymarket Politics 2 days to 1 week bin (slope 1.982, 4.32 million trades) is a genuine outlier exceeding e ven the Kalshi v alue at the same horizon (1.833). This likely reflects a concentration of 2024 US election daily-resolution markets whose peak trading fell 2–7 days before resolution. Se veral limitations also merit note. The regex-based domain classifier assigns 42.5% of Polymarket markets to “Other”; W eather and Entertainment are absent; the count field represents contracts per on-chain transaction rather than full position size; and no market-clustered bootstrap has been run for Polymarket. D Additional supplementary appendices The follo wing materials are provided in the supplementary data. (a) Domain classification rules for both Kalshi (560+ ticker -prefix patterns) and Polymarket (compiled regular expression patterns on market titles); (b) the full 216-cell calibration matrix as a CSV file, with observed slopes, standard errors, fitted decomposition components and residuals; and (c) political subcategory analysis, including slope ranges for 10 subcategories and a Simpson’ s paradox diagnostic at the 1–3 hour horizon. 20 Decomposing Crowd W isdom: Domain-Specific Calibration Dynamics in Prediction Markets T able 13: Posterior β matrix (domain × time interaction). Domain 0–1h 1–3h 3–6h 6–12h 12–24h 24–48h 2d–1w 1w–1mo 1mo+ Sports + . 082 − . 030 − . 066 + . 005 + . 032 + . 020 − . 081 − . 050 + . 088 Crypto + . 013 + . 021 + . 051 − . 058 − . 051 + . 063 − . 106 − . 181 + . 249 Politics − . 072 − . 173 − . 066 + . 069 − . 019 + . 028 + . 072 + . 170 − . 008 Finance + . 027 + . 077 + . 027 − . 014 − . 006 − . 118 − . 003 + . 146 − . 135 W eather − . 031 − . 040 − . 101 − . 022 + . 018 + . 044 + . 132 − . 088 + . 088 Entertainment − . 019 + . 144 + . 156 + . 021 + . 027 − . 036 − . 015 + . 004 − . 281 Note: The β matrix captures each domain’ s slope deviation from the uni versal horizon mean µ ( τ ) plus the domain intercept α . 21 Decomposing Crowd W isdom: Domain-Specific Calibration Dynamics in Prediction Markets T able 14: Posterior predictiv e coverage by domain. Domain Cells W ithin 95% Cov erage Mean PPC p -value Sports 36 35 97.2% 0.48 Crypto 36 35 97.2% 0.49 Politics 36 33 91.7% 0.47 Finance 36 35 97.2% 0.50 W eather 36 35 97.2% 0.49 Entertainment 36 35 97.2% 0.51 T able 15: Cross-platform calibration slopes ( ∆ = Polymarket − Kalshi). Bins marked † are unreliable due to timestamp noise. Sports Crypto Politics Bin Kalshi Poly ∆ Kalshi Poly ∆ Kalshi Poly ∆ 0–1h † 1.101 1.028 − 0 . 073 0.993 1.753 +0 . 760 1.341 0.621 − 0 . 720 1–3h † 0.960 0.976 +0 . 016 1.013 1.390 +0 . 377 0.933 0.859 − 0 . 073 3–6h 0.897 1.171 +0 . 275 1.065 0.862 − 0 . 203 1.317 1.116 − 0 . 201 6–12h 1.006 1.001 − 0 . 005 1.007 1.044 +0 . 037 1.552 0.936 − 0 . 616 12–24h 1.053 1.059 +0 . 006 1.006 0.996 − 0 . 009 1.477 1.277 − 0 . 200 24–48h 1.075 0.950 − 0 . 126 1.209 1.123 − 0 . 087 1.515 1.234 − 0 . 281 2d–1w 1.037 1.097 +0 . 059 1.121 0.998 − 0 . 123 1.833 1.982 +0 . 149 1w–1mo 1.240 0.974 − 0 . 266 1.090 1.161 +0 . 071 1.833 1.681 − 0 . 152 1mo+ 1.740 1.322 − 0 . 418 1.357 1.060 − 0 . 298 1.730 1.086 − 0 . 644 Mean (rel.) 1.150 1.082 − 0 . 068 1.114 1.049 − 0 . 065 1.637 1.313 − 0 . 324 Note: Mean (rel.) is the trade-weighted mean slope across the seven reliable time bins (3–6h through 1mo+). Simple arithmetic means of the tabulated slopes dif fer slightly due to variation in per -bin trade counts. T able 16: Cross-platform scale effect by domain and trade size. Domain Platform Single Small Medium Large ∆ (L − S) Sports Kalshi 1.002 1.010 1.007 1.013 +0 . 011 Sports Polymarket 1.120 1.036 1.065 1.038 − 0 . 082 Crypto Kalshi 1.028 1.025 1.023 1.004 − 0 . 024 Crypto Polymarket 1.006 1.066 1.059 1.063 +0 . 057 Politics Kalshi 1.188 1.224 1.373 1.741 +0 . 554 Politics Polymarket 1.193 1.046 1.381 1.373 +0 . 180 Note: ∆ (L − S) is the difference between aggreg ate Large and Single slopes (pooled across all time bins). This differs from the bootstrap estimand in Equation (10) , which averages within-horizon differences: Kalshi Politics aggregate ∆ = +0 . 554 vs within-horizon ∆ = +0 . 531 ; Polymarket Politics +0 . 180 vs +0 . 113 . T able 17: Cross-platform whale effect bootstrap. Platform Domain ∆ (L − S) 95% CI Sig.? Kalshi (cell) Politics +0 . 531 [+0 . 288 , +0 . 747] Y es Kalshi (clustered) Politics +0 . 589 [+0 . 132 , +1 . 289] Y es Polymarket (cell) Politics +0 . 113 [ − 0 . 151 , +0 . 395] No Polymarket (cell) Sports +0 . 006 [ − 0 . 199 , +0 . 170] No Polymarket (cell) Crypto +0 . 092 [ − 0 . 158 , +0 . 358] No 22
Original Paper
Loading high-quality paper...
Comments & Academic Discussion
Loading comments...
Leave a Comment