Detecting Dependencies in Sparse, Multivariate Databases Using Probabilistic Programming and Non-parametric Bayes
Datasets with hundreds of variables and many missing values are commonplace. In this setting, it is both statistically and computationally challenging to detect true predictive relationships between variables and also to suppress false positives. Thi…
Authors: Feras Saad, Vikash Mansinghka
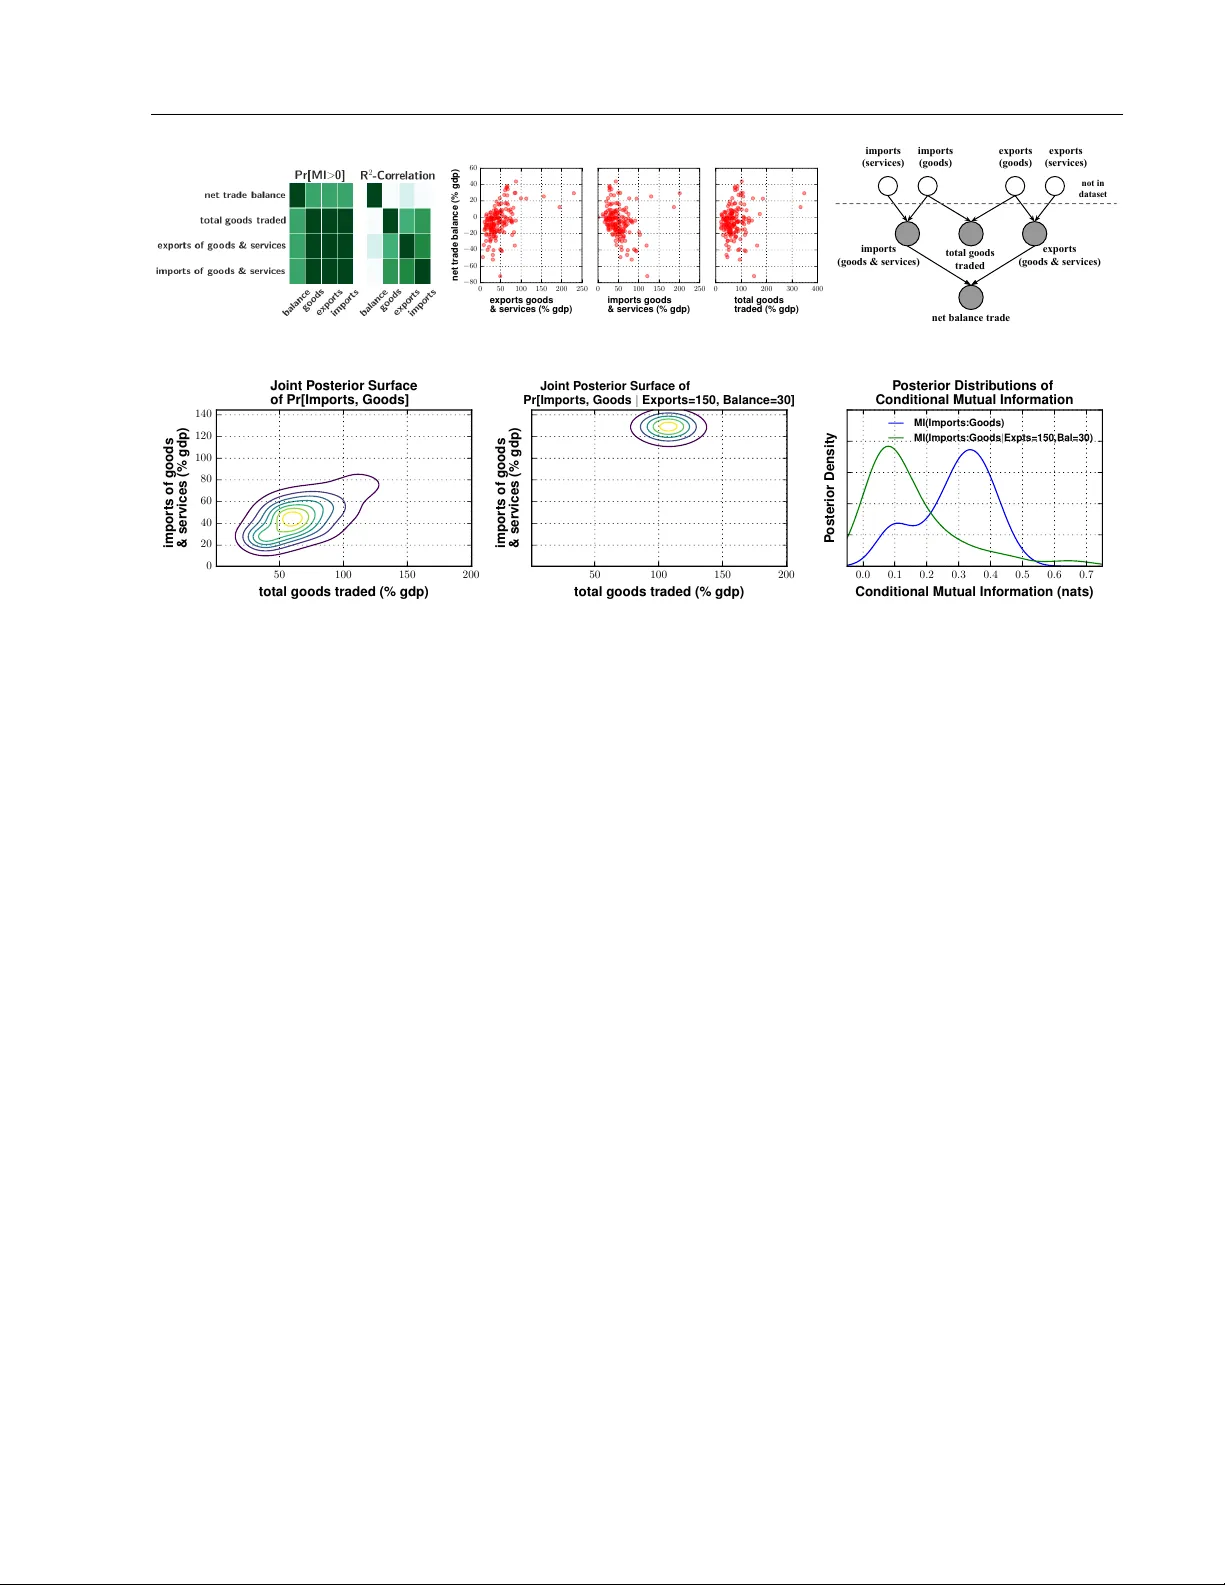
Detecting Dep endencies in Sparse, Multiv ariate Databases Using Probabilistic Programming and Non-parametric Ba y es F eras Saad Vik ash Mansinghk a Probabilistic Computing Pro ject Massac husetts Institute of T ec hnology Probabilistic Computing Pro ject Massac husetts Institute of T ec hnology Abstract Datasets with h undreds of v ariables and man y missing v alues are commonplace. In this setting, it is both statistically and com- putationally c hallenging to detect true pre- dictiv e relationships b et w een v ariables and also to suppress false p ositives. This pap er prop oses an approach that com bines prob- abilistic programming, information theory , and non-parametric Bay es. It shows ho w to use Ba yesian non-parametric modeling to (i) build an ensemble of joint probability mo d- els for all the v ariables; (ii) efficien tly detect marginal indep endencies; and (iii) estimate the conditional mutual information b et ween arbitrary subsets of v ariables, sub ject to a broad class of constraints. Users can access these capabilities using Ba yesDB, a proba- bilistic programming platform for probabilis- tic data analysis, b y writing queries in a sim- ple, SQL-lik e language. This paper demon- strates empirically that the metho d can (i) detect context-specific (in)dependencies on challenging synthetic problems and (ii) yield impro ved sensitivit y and sp ecificit y o ver baselines from statistics and mac hine learn- ing, on a real-w orld database of ov er 300 sparsely observ ed indicators of macro eco- nomic dev elopment and public health. 1 In tro duction Sparse databases with h undreds of v ariables are com- monplace. In these settings, it can b e b oth statisti- cally and computationally c hallenging to detect pre- App earing in Pro ceedings of the 20 th In ternational Con- ference on Artificial In telligence and Statistics (AIST A TS) 2017, F ort Lauderdale, Florida, USA. JMLR: W&CP vol- ume 54. Copyrigh t 2017 b y the author(s). dictiv e relationships betw een v ariables [4]. First, the data may b e incomplete and require cleaning and im- putation b efore pairwise statistics can be calculated. Second, parametric modeling assumptions that under- lie standard hypothesis testing techniques may not b e appropriate due to nonlinear, m ultiv ariate, and/or heterosk edastic relationships. Third, as the n um b er of v ariables grows, it b ecomes harder to detect true relationships while suppressing false p ositiv es. Man y approac hes hav e been prop osed (see [17, T able 1] for a summary), but they each exhibit limitations in prac- tice. F or example, some only apply to fully-observed real-v alued data, and most do not pro duce probabilis- tically coherent measures of uncertain ty . This pa- p er prop oses an approach to dep endence detection that com bines probabilistic programming, informa- tion theory , and non-parametric Bay es. The end-to- end approach is summarized in Figure 1. Queries ab out the conditional mutual information (CMI) b e- t ween v ariables of in terest are expressed using the Ba yesian Query Language [18], an SQL-like proba- bilistic programming language. Appro ximate infer- ence with CrossCat [19] produces an ensemble of join t probabilit y mo dels, which are analyzed for structural (in)dep endencies. F or mo del structures in which de- p endence cannot b e ruled out, the CMI is estimated via Mon te Carlo integration. In principle, this approac h has significant adv antages. First, the method is scalable to high-dimensional data: it can b e used for exploratory analysis without re- quiring exp ensiv e CMI estimation for all pairs of v ari- ables. Second, it applies to heterogeneously typed, incomplete datasets with minimal pre-processing [19]. Third, the non-parametric Ba yesian join t density esti- mator used to form CMI estimates can model a broad class of data patterns, without ov erfitting to highly ir- regular data. This pap er sho ws that the prop osed ap- proac h is effective on a real-world database with h un- dreds of v ariables and a missing data rate of ∼ 35%, detecting common-sense predictive relationships that are missed by baseline methods while suppressing spu- rious relationships that baselines purp ort to detect. Detecting Dep endencies in Sparse, Multiv ariate Databases Sparse T abular Database X Y W Z 19 Congo 170 1.4 14 182 21 India 3.4 17 Lebanon 195 Chile 115 1.1 Australia 2.9 31 190 2.3 . . . . . . . . . . . . Ba yesDB Mo deling P osterior CrossCat Structures X Y W Z X Y W Z X Y W Z Mo del ˆ G 1 Mo del ˆ G 2 Mo del ˆ G 3 . . . BQL CMI Query %bql SIMULATE ... MUTUAL INFORMATION OF ... X WITH Y GIVEN W ... FROM MODELS OF population Ba yesDB Query Engine Cr ossCa t-Cmi (Algorithm 4a) I ˆ G 2 ( X : Y | W ) I ˆ G 1 ( X : Y | W ) I ˆ G 3 ( X : Y | W ) . . . CMI Posterior Distribution Figure 1: W orkflo w for computing p osterior distributions of the CMI for v ariables in a data table using Ba yesDB. Modeling and inference in Bay esDB pro duces an ensemble of p osterior CrossCat samples. Eac h mo del learns a factorization of the join t distribution of all v ariables in the database, and a Dirichlet pro cess mixture within each blo c k of dep enden t v ariables. F or instance, mo del ˆ G 1 sp ecifies that X is indep enden t of ( Y , W ) which in turn is indep enden t of Z , while in ˆ G 3 , all v ariables are (structurally) dependent. End-user queries for the CMI are expressed in the Bay esian Query Language. The BQL in terpreter uses CrossCat structures to optimize the query where possible, by (i) b ypassing Mon te Carlo estimation completely when the queried v ariables are structurally indep enden t, and/or (ii) dropping redundant constrain ts whic h are structurally independent of the queried v ariables. V alues of CMI returned by each model constitute samples from the p osterior CMI distribution. 2 Dra wing Bay esian inferences ab out conditional m utual information Let x = ( x 1 , x 2 , . . . , x D ) denote a D -dimensional random v ector, whose sub-vectors w e denote x A = { x i : i ∈ A} with joint probability density p G ( x A ) . The sym b ol G refers to an arbitrary sp ecification for the “generative” pro cess of x , and parameterizes all its join t and conditional densities. The mutual informa- tion (MI) of the v ariables x A and x B (under generative pro cess G ) is defined in the usual w ay [5]: I G ( x A : x B ) = E ( x A , x B ) log p G ( x A , x B ) p G ( x A ) p G ( x B ) . (1) The mutual information can b e in terpreted as the KL-divergence from the product of marginals p G ( x A ) p G ( x B ) to the joint distribution p G ( x A , x B ) , and is a well-established measure for both the exis- tence and strength of dep endence b et w een x A and x B (Section 2.2). Given an observ ation of the v ariables { x C = ˆ x C } , the c onditional mutual information (CMI) of x A and x B giv en { x C = ˆ x C } is defined analogously: I G ( x A : x B | x C = ˆ x C ) = E ( x A , x B ) | ˆ x C log p G ( x A , x B | ˆ x C ) p G ( x A | ˆ x C ) p G ( x B | ˆ x C ) . (2) Estimating the m utual information b et ween the v ari- ables of x given a dataset of observ ations D remains an op en problem in the literature. V arious parametric and non-parametric metho ds for estimating MI exist [21, 22, 15]; see [24] for a comprehensive review. T radi- tional approaches typically construct a p oint estimate ˆ I ( x A : x B ) (and p ossible confidence in terv als) assuming a “true v alue” of I ( x A : x B ) . In this paper, w e instead tak e a non-parametric Bay esian approach, where the m utual information itself is a derived random v ariable; a similar interpretation w as recently dev elop ed in in- dep enden t work [16]. The randomness of m utual infor- mation arises from treating the data generating pro- cess and parameters G as a random v ariable, whose prior distribution we denote π . Comp osing G with the function h : ˆ G 7→ I ˆ G ( x A : x B ) induces the deriv ed ran- dom v ariable h ( G ) ≡ I G ( x A : x B ) . The distribution of the MI can th us b e expressed as an exp ectation under distribution π : P [ I G ( x A : x B ) ∈ S ] = Z I I ˆ G ( x A : x B ) ∈ S π ( d ˆ G ) = E ˆ G ∼ π I I ˆ G ( x A : x B ) ∈ S . (3) Giv en a dataset D , we define the p osterior distribution of the mutual information, P [ I G ( x A : x B ) ∈ S | D ] as the exp ectation in Eq (3) under the posterior π ( ·| D ) . W e define the distribution ov er conditional mutual infor- mation P [ I G ( x A : x B | ˆ x C ) ∈ S ] analogously to Eq (3), substituting the CMI (2) inside the exp ectation. Saad and Mansinghk a 2.1 Estimating CMI with generativ e p opulation mo dels Mon te Carlo estimates of CMI can b e formed for mo d- els expressed as gener ative p opulation mo dels [18, 28], a probabilistic programming formalism for character- izing the data generating pro cess of an infinite array of realizations of random vector x = ( x 1 , x 2 , . . . , x D ) . Listing 1 summarizes elemen ts of the GPM interface. Listing 1 GPM interface for sim ulating from and as- sessing the densit y of conditional and marginal distri- butions of a random v ector x . Simula te ( G , query: Q = { q j } , condition: ˆ x E = ˆ x e j ) Return a sample s ∼ p G ( x Q | ˆ x E , D ) . LogPdf ( G , query: ˆ x Q = ˆ x q j , condition: ˆ x E = ˆ x e j ) Return the joint log density p G ( ˆ x Q | ˆ x E , D ) These t w o in terface procedures can be combined to deriv e a simple Monte Carlo estimator for the CMI (2), sho wn in Algorithm 2a. Algorithm 2a Gpm-Cmi Require: GPM G ; query A , B ; cond ition ˆ x C ; accuracy T Ensure: Monte Carlo estimate of I G ( x A : x B | x C = ˆ x C ) 1: for t = 1 , . . . , T do 2: ( ˆ x A , ˆ x B ) ← Simula te ( G , A ∪ B , ˆ x C ) 3: m t A∪B ← LogPdf ( G , ˆ x A∪B , ˆ x C ) 4: m t A ← LogPdf ( ˆ x A , ˆ x C ) 5: m t B ← LogPdf ( ˆ x B , ˆ x C ) 6: return 1 T P T t =1 m t A∪B − ( m t A + m t B ) While Gpm-Cmi is an un biased and consistent estima- tor applicable to any probabilistic mo del implemented as a GPM, its quality in detecting dep endencies is tied to the ability of G to capture patterns from the dataset D ; this pap er uses baseline non-parametric GPMs built using CrossCat (Section 3). 2.2 Extracting conditional indep endence relationships from CMI estimates An estimator for the CMI can b e used to discov er sev- eral forms of indep endence relations of interest. Marginal Independence It is straigh tforw ard to see that ( x A ⊥ ⊥ G x B ) if and only if I G ( x A : x B ) = 0 . Con text-Sp ecific Indep endence If the ev ent { x C = ˆ x C } decouples x A and x B , then they are said to b e indep enden t “in the con text” of ˆ x C , denoted ( x A ⊥ ⊥ G x B | { x C = ˆ x C } ) [3]. This condition is equiv- alen t to the CMI from (2) equaling zero. Thus b y estimating CMI, we are able to detect finer-grained indep endencies than can b e detected b y analyzing the graph structure of a learned Ba yesian netw ork [30]. Conditional Indep endence If context-specific in- dep endence holds for all p ossible observ ation sets { x C = ˆ x C } , then x A and x B are c onditional ly indep en- dent given x C , denoted ( x A ⊥ ⊥ G x B | x C ) . By the non- negativit y of CMI, conditional independence implies the CMI of x A and x B , marginalizing out x C , is zero: I G ( x A : x B | x C ) = E ˆ x C [ I G ( x A : x B | x C = ˆ x C )] = 0 . (4) Figure 2 illustrates different CMI queries whic h are used to discov er these three types of dependencies in v arious data generators; Figure 3 shows CMI queries expressed in the Ba yesian Query Language. 3 Building generativ e p opulation mo dels for CMI estimation with non-parametric Ba yes Our approach to estimating the CMI requires a prior π and mo del class G which is flexible enough to em ulate an arbitrary joint distribution o ver x , and tractable enough to implemen t Algorithm 2a for its arbitrary sub-v ectors. W e b egin with a Dirichlet pro cess mixture mo del (DPMM) [12]. Letting L d denote the lik eliho o d for v ariable d , V d a prior ov er the parameters of L d , and λ d the h yp erparameters of V d , the generative pro cess for N observ ations D = x [ i, 1: D ] : 1 ≤ i ≤ N is: DPMM-Prior α ∼ Gamma (1 , 1) z = ( z 1 , . . . , z N ) ∼ CRP ( ·| α ) φ [ d,k ] ∼ V d ( ·| λ d ) d ∈ [ D ] , k ∈ Unique ( z ) x [ i,d ] ∼ L d ( ·| φ [ d,z i ] ) i ∈ [ N ] , d ∈ [ D ] W e refer to [7, 14] for algorithms for p osterior in- ference, and assume w e ha ve a p osterior sample ˆ G = ( α, z [1: N ] , { φ d } ) of all parameters in the DPMM. T o compute the CMI of an arbitrary query pattern I ˆ G ( x A : x B | x C = ˆ x C ) using Algorithm 2a, w e need im- plemen tations of Simula te and LogPdf for ˆ G . These t wo pro cedures are summarized in Algorithms 3a, 3b. Algorithm 3a DPMM-Simula te Require: DPMM G ; target A ; condition ˆ x C Ensure: joint sample ˆ x A ∼ p G ( ·| ˆ x C ) 1: ( l i ) K +1 i =1 ← DPMM-Cluster-Posterior ( G , ˆ x C ) 2: z N +1 ∼ Ca tegorical ( l 1 , . . . , l K +1 ) 3: for a ∈ A do 4: ˆ x a ∼ L a ( ·| φ [ a,z N +1 ] ) 5: return ˆ x A Algorithm 3b DPMM-LogPdf Require: DPMM G ; target ˆ x A ; condition ˆ x C Ensure: log densit y p G ( ˆ x A | ˆ x C ) 1: ( l i ) K +1 i =1 ← DPMM-Cluster-Posterior ( G , ˆ x C ) 2: for k = 1 , . . . , K + 1 do 3: t k ← Q a ∈A L a ( ˆ x a | φ [ a,k ] ) 4: return log P K +1 k =1 ( t k l k ) Detecting Dep endencies in Sparse, Multiv ariate Databases A B C Normal (0,1) Normal (0,1) Sign ( AB ) Exp (2) (a) Ground truth “common-effect” generator [29]. 0 . 0 0 . 1 0 . 2 0 . 3 Pr obability Density MI(A,B) 0 . 0 0 . 1 0 . 2 0 . 3 MI(A,C) 0 . 0 0 . 1 0 . 2 0 . 3 MI(B,C) 0 . 0 0 . 1 0 . 2 0 . 3 MI(A,B | C=-2) 0 . 0 0 . 1 0 . 2 0 . 3 MI(A,B | C=2) 0 . 0 0 . 1 0 . 2 0 . 3 MI(A,B | C) 0 . 0 0 . 1 0 . 2 0 . 3 MI(A,B | C=0) (b) The first three plots verify that A , B , and C are marginally indep endent. The next three plots sho w that conditioning on C “couples” the parents A and B (b oth for fixed v alues of C ∈ { 2 , − 2 } , and marginalizing ov er all C ). The last plot shows that { C = 0 } do es not couple A and B , due to symmetry of signum. A B C Normal (0,1) A 0 : Bern (0.85) A 1 : Bern (0.05) Bern (0.10) Bern (0.75) (c) Ground truth “common-cause” generator. 0 . 0 0 . 1 0 . 2 0 . 3 0 . 4 Pr obability Density MI(A,B) 0 . 0 0 . 1 0 . 2 0 . 3 0 . 4 MI(A,C) 0 . 0 0 . 1 0 . 2 0 . 3 0 . 4 MI(B,C) 0 . 0 0 . 1 0 . 2 0 . 3 0 . 4 CMI(B,C | A=0) 0 . 0 0 . 1 0 . 2 0 . 3 0 . 4 CMI(B,C | A=1) 0 . 0 0 . 1 0 . 2 0 . 3 0 . 4 CMI(B,C | A) (d) The first three plots verify that A , B , and C are marginally dep enden t. The next three plots sho w that conditioning on A “decouples” the children B and C ; the decoupling is weak er for { A = 0 } , because it is 3.4 nats less likely that { A = 1 } . The final plot shows the w eighted CMI under these tw o p ossibilities. Figure 2: Posterior distributions of CMI under the DPMM p osterior, given 100 data p oin ts from canonical Bay es net structures. Distributions p eaked at 0 indicate high probability of (conditional) independence. In both cases, the p osterior CMI distributions correctly detect the marginal, conditional, and context-specific indep endences in the “ground truth” Ba y es nets, despite the fact that b oth “common-cause” and “common-effect” structures are not in the (structural) h yp othesis space of the DPMM prior. Algorithm 3c DPMM-Cluster-Posterior Require: DPMM G ; condition ˆ x C ; Ensure: { p G ( z N +1 = k ) : 1 ≤ k ≤ max( z 1: N ) + 1 } 1: K ← max( z 1: N ) 2: for k = 1 , . . . , K + 1 do 3: n k ← ( | { x i ∈ D : z i = k } | if k ≤ K α if k = K + 1 4: l k ← Q c ∈C L c ( ˆ x c | φ [ c,k ] ) n k 5: return ( l 1 , . . . , l K +1 ) / P K +1 k =1 ( l k ) The subroutine DPMM-Cluster-Posterior is used for sampling (in DPMM-Simula te ) and marginalizing o ver (in DPMM-LogPdf ) the non-parametric mixture comp onen ts. Moreo ver, if L d and V d form a conjugate lik eliho o d-prior pair, then in vocations of L d ( ˆ x d | φ [ d,k ] ) in Algorithms 3a:4 and 3b:3 can be Rao-Blac kwellized b y conditioning on the sufficient statistics of data in cluster k , thus marginalizing out φ [ d,k ] [26]. This op- timization is imp ortan t in practice, since analytical marginalization can b e obtained in closed-form for sev- eral lik eliho ods in the exp onen tial family [9]. Finally , to approximate the p osterior distribution ov er CMI in (2), it suffices to aggregate DPMM-Cmi from a set of p osterior samples n ˆ G 1 , . . . , ˆ G H o ∼ iid π ( ·| D ) . Figure 2 sho ws posterior CMI distributions from the DPMM successfully reco v ering the marginal and conditional indep endencies in tw o canonical Bay esian net works. 3.1 Inducing sparse dep endencies using the CrossCat prior The multiv ariate DPMM makes the restrictive as- sumption that all v ariables x = ( x 1 , . . . , x D ) are (structurally) marginally dep enden t, where their join t distribution fully factorizes conditioned on the mixture assignmen t z . In high-dimensional datasets, imposing full structural dep endence among all v ariables is to o conserv ativ e. Moreov er, while the Monte Carlo error of Algorithm 2a do es not scale with the dimensional- it y D , its runtime scales linearly for the DPMM, and so estimating the CMI is lik ely to b e prohibitiv ely ex- p ensiv e. W e relax these constraints b y using CrossCat [19], a structure learning prior whic h induces sparsit y o ver the dependencies b etw een the v ariables of x . In particular, CrossCat p osits a factorization of x accord- ing to a variable p artition γ = V 1 , . . . , V | γ | , where V i ⊆ [ D ] . F or i 6 = j , all v ariables in blo c k V i are m u- tually (marginally and conditionally) indep enden t of all v ariables in V j . The factorization of x given the Saad and Mansinghk a Sim ulate from the p osterior distribution of the m utual information of ( x 1 , x 2 ) with x 3 , giv en x 4 = 14 . Estimate the probabilit y that the m utual information of ( x 1 , x 2 ) with x 3 , giv en x 4 = 14 and marginalizing ov er x 5 , is less than 0.1 nats. Syn thesize a hypothetical dataset with 100 records, in- cluding only those v ariables whic h are probably indep en- den t of x 2 . SIMULATE MUTUAL INFORMATION OF (x1, x2) WITH (x3) GIVEN (x4 = 14) FROM MODELS OF population ESTIMATE PROBABILITY OF MUTUAL INFORMATION OF (x1, x2) WITH (x3) GIVEN (x4 = 14, x5) < 0.1 BY population SIMULATE ( SELECT * FROM VARIABLES OF population WHERE PROBABILITY OF MUTUAL INFORMATION WITH x2 < 0.1 > 0.9) FROM population LIMIT 100; 1: for G k ∈ M do 2: I G k ← Gpm-Cmi ( G k , { x 1 , x 2 } , { x 3 } , { ( x 4 , 14) } ) 3: return ( I G 1 , . . . , I G |M| ) 1: for G k ∈ M do 2: for t = 1 , . . . , T do 3: ˆ x t 5 ← Simula te ( G k , x 5 , { ( x 4 , 14) } ) 4: I t G k ← Gpm-Cmi ( G k , { x 1 , x 2 } , { x 3 } , ( x 4 , 14) , ( x 5 , ˆ x t 5 ) ) 5: I G k ← 1 T P t I t G k 6: return 1 |M| P j I I G k < 0 . 1 1: S ← ∅ 2: for x i ∈ ( x 1 , . . . , x D ) do 3: for G k ∈ M do 4: I G k ← Gpm-Cmi ( G k , x i , x 2 , ∅ ) 5: p i ← 1 |M| P k I I G k < 0 . 1 6: if p i > 0 . 9 then 7: S ← S ∪ { x i } 8: for t = 1 . . . , 100 do 9: s t ← Simula te ( M , S , ∅ ) 10: return ( s 1 , . . . , s 100 ) English Summary of CMI Query CMI Query in Ba yesian Query Language Inference Algorithm In vok ed b y Query In terpreter Figure 3: End-user CMI queries in the Bay esian Query Language for three data analysis tasks; (top) ev aluating the strength of predictive relationships; (middle) sp ecifying the amount of evidence required for a “predictively” significan t relationship; (b ottom) synthesizing a hypothetical population, censoring probably sensitiv e v ariables. v ariable partition γ is therefore given by: p G ( x | D ) = Y V ∈ γ p G V ( x V | D V ) . (5) Within blo ck V , the v ariables x V = { x d : d ∈ V } are distributed according to a m ultiv ariate DPMM; subscripts with V (such as G V ) now index a set of blo c k-sp ecific DPMM parameters. The joint predic- tiv e density p G V is giv en by Algorithm 3b: p G V ( x V | D ) = K V +1 X k =1 n [ V ,k ] Q d ∈V p G V ( x d | φ [ d,k ] ) P k 0 n [ V ,k 0 ] . (6) The CrossCat generative process for N observ ations D = x [ i, 1: D ] : 1 ≤ i ≤ N is summarized b elo w. Cr ossCa t-Prior α 0 ∼ Gamma (1 , 1) v = ( v 1 , . . . , v D ) ∼ CRP ( ·| α 0 ) V k ← { i ∈ [ D ] : v i = k } k ∈ Unique ( v ) x [ i, V k ] N i =1 ∼ DPMM-Prior k ∈ Unique ( v ) W e refer to [19, 23] for algorithms for posterior infer- ence in CrossCat, and assume we hav e a set of approx- imate samples n ˆ G i : 1 ≤ i ≤ H o of all latent CrossCat parameters from the p osterior π ( ·| D ) . 3.2 Optimizing a CMI query The following lemma shows how CrossCat induces sparsit y for a multiv ariate CMI query . Lemma 1. L et G b e a p osterior sample fr om Cr oss- Cat, whose ful l joint distribution is given by (5) and (6) . Then, for al l A , B , C ⊆ [ D ] , I G ( x A : x B | ˆ x C ) = X V ∈ γ I G V ( x A∩V : x B∩V | ˆ x C ∩V ) , wher e I G V ( x A∩V : ∅ | ˆ x C ∩V ) ≡ 0 . Pr o of. Refer to App endix A. An immediate cons equence of Lemma 1 is that struc- ture discov ery in CrossCat allows us to optimize Monte Carlo estimation of I G ( x A : x B | x C = ˆ x C ) by ignoring all target and condition v ariables whic h are not in the same blo ck V , as sho wn in Algorithm 4a and Figure 4. Algorithm 4a CrossCa t-Cmi Require: CrossCat G ; query A , B ; condition ˆ x C ; acc. T Ensure: Monte Carlo estimate of I G ( x A : x B | x C = ˆ x C ) 1: for V ∈ γ do 2: if A ∩ V and B ∩ V then 3: i V ← Gpm-Cmi ( G V , A ∩ V , B ∩ V , ˆ x C ∩V , T ) 4: else 5: i V ← 0 6: return P V ∈ γ i V Detecting Dep endencies in Sparse, Multiv ariate Databases 1 2 3 4 5 6 7 8 DpMixture Runtime [sec] 0 1 2 3 4 5 6 7 8 Cr ossCat Runtime [sec] Full Monte Car lo Integr ation Optimiz ed Monte Car lo Integr ation No Monte Car lo Integr ation Figure 4: Comparing the run time of CrossCa t-Cmi (Alg 4a) and Gpm-Cmi (Alg 2a) (using the DPMM), on 1000 randomly generated CMI queries from an 8- dimensional dataset. The dashed curve shows the 45- degree line. The green dots at 0 correspond to Cross- Cat detecting structural indep endence b et ween query v ari- ables, bypassing Mon te Carlo estimation completely . The blue dots (below diagonal) correspond to CrossCat opti- mizing the Monte Carlo estimator b y ignoring constraint v ariables which are structurally indep enden t of the target v ariables. The red dots (along diagonal) corresp ond to CrossCat learning no structural independences, requiring full Mon te Carlo estimation and resulting in comparable run time to DPMM. These three cases correspond to the three p osterior CrossCat structures illustrated in Figure 1, when the targets v ariables are X and Y conditioned on W . 3.3 Upp er b ounding the pairwise dep endence probabilit y In exploratory data analysis, we are often in terested in detecting pairwise p redictiv e relationships b et w een v ariables ( x i , x j ) . Using the formalism from Eq (3), w e can compute the probability that their MI is non- zero: P [ I G ( x i : x j ) > 0] . This quantit y can be upper- b ounded by the p osterior probabilit y that x i and x j ha ve the same assignments v i and v j in the CrossCat v ariable partition γ : P [ I G ( x i : x j ) > 0] = P [ I G ( x i : x j ) > 0 | {G : v i = v j } ] P [ {G : v i = v j } ] + P [ I G ( x i : x j ) > 0 | {G : v i 6 = v j } ] P [ {G : v i 6 = v j } ] = P [ I G ( x i : x j ) > 0 | {G : v i = v j } ] P [ {G : v i = v j } ] < P [ {G : v i = v j } ] ≈ 1 H H X h =1 I [ ˆ G h : ˆ v [ h,i ] = ˆ v [ h,j ] ] , (7) where Lemma 1 has b een used to set the addend in line 3 to zero. Also note that the summand in (7) can b e computed in O (1) for CrossCat sample ˆ G h . When dep endencies among the D v ariables are sparse suc h that man y pairs ( x i , x j ) ha ve MI upp er b ounded b y 0, the num b er of inv ocations of Algorithm 4a required to compute pairwise MI v alues is O ( D 2 ) . A compari- son of upp er b ounding MI versus exact MI estimation with Mon te Carlo is shown in Figure 5. 0 . 0 0 . 2 0 . 4 0 . 6 0 . 8 1 . 0 1 . 2 Co v ariance 0 . 0 0 . 2 0 . 4 0 . 6 0 . 8 1 . 0 Dependence Pr obability Dependence Pr obability of ( X , Y ) ∼ N (0 , Σ) Crosscat Upper Bound Pr[I(X:Y) > 0.05] Pr[I(X:Y) > 0.10] Pr[I(X:Y) > 0.20] Pr[I(X:Y) > 0.30] co v=0.15 co v=0.35 co v=0.65 co v=0.90 Figure 5: P osterior probabilit y that dimensions of a bi- v ariate Gaussian are dependent, vs the cov ariance (top). The CrossCat upp er b ound (7) is useful for detecting the existence of a predictiv e relationship; the p osterior distri- bution of MI can determine whether the strength of the relationship is “predictiv ely significant” based on v arious tolerance levels (0.05, 0.10, 0.20, and 0.30 nats). 4 Applications to macro economic indicators of global p o v ert y , education, and health This section illustrates the efficacy of the prop osed approac h on a sparse database from an ongoing col- lab oration with the Bill & Melinda Gates F ounda- tion. 1 The Gapminder data set is an extensive lon- gitudinal dataset of ∼ 320 global developmen tal indi- cators for 200 countries spanning ov er 5 centuries [27]. These include v ariables from a broad set of categories suc h as education, health, trade, p o vert y , p opulation gro wth, and mortality rates. W e exp erimen t with a cross-sectional slice of the data from 2002. Figure 6a sho ws the pairwise R 2 correlation v alues b et w een all v ariables; each row and column in the heatmap is an indicator in the dataset, and the color of a cell is the ra w v alue of R 2 (b et w een 0 and 1). Figure 6b sho ws pairwise binary hypothesis tests of indep endence using HSIC [13], whic h detects a dense set of dep endencies including many spurious relationships (App endix B). F or b oth metho ds, statistically insignifican t relation- ships ( α = 0 . 05 with Bonferroni correction for m ulti- ple testing) are shown as 0. Figure 6c sho ws an up- p er b ound on the pairwise probability that the MI of t wo v ariables exceeds zero (also a v alue b et ween 0 and 1). These entries are estimated using Eq (7) (b ypass- ing Monte Carlo estimation) using H =100 samples of CrossCat. Note that the metric P [ I G ( x i : x j ) > 0] in Figure 6c only indicates the existenc e of a predictive relationship b et ween x i and x j ; it do es not quantify ei- ther the strength or directionalit y of the relationship. 1 A further application, to a real-world dataset of math- ematics exam scores, is shown in Appendix C. Saad and Mansinghk a (a) R 2 Correlation V alue (b) HSIC [13] Indep endence T est (c) P [ I G ( x i : x j ) > 0] , Eq (7) (d) Pairwise heatmaps of all 320 v ariables in the Gapminder dataset using three dep endency detection techniques. Darker cells indicate a detected dep endence b et w een the tw o v ariables. v ariable A v ariable B P [ I G > 0] R 2 ( p 10 − 6 ) personal computers earthquake affected 0.015625 0.974445 road traffic total deaths people living w/ hiv 0.265625 0.858260 natural gas reserves 15-25 yrs sex ratio 0.031250 0.951471 forest pro ducts p er ha earthquake killed 0.046875 0.936342 floo d affected population 40-59 yrs 0.140625 0.882729 0 1 2 3 4 5 6 7 per sonal computer s 0 1 2 3 4 5 6 7 ear thquake 1e7 1e5 8 10 12 14 16 15-25 yr s se x ratio 0 5 10 15 20 25 natural gas 1e2 1e1 (e) Spurious relationships which are correlated under R 2 , but probably independent according to posterior MI. v ariable A v ariable B P [ I G > 0] R 2 ( p 10 − 6 ) inflation trade balance (% gdp) 0.859375 0.114470 DOTS detection rate DOTS cov erage 0.812500 0.218241 forest area (sq. km) forest pro ducts (usd) 0.828125 0.206145 long term unemp. rate total 15-24 unemp. 0.968750 NaN male family workers female self-employ ed 0.921875 NaN 0 20 40 60 80 100 120 dots co vera g e 0 50 100 150 200 dots detection 0 5 10 15 20 f orest area 0 1 2 3 4 5 f orest pr oducts 1e9 1e6 (f ) Common-sense relationships probably dep enden t according to posterior MI, but weakly correlated under R 2 . Figure 6: Comparing dep endences b etw een v ariables in the Gapminder dataset, as detected b y R 2 , HSIC (with Bonferroni correction for m ultiple testing), and p osterior distribution o ver mutual information in CrossCat. It is instructive to compare the dep endencies detected b y R 2 and CrossCa t-Cmi . T able 6e sho ws pairs of v ariables that are spuriously reported as dep enden t according to correlation; scatter plots rev eal they are either (i) are sparsely observed or (ii) exhibit high correlation due to large outliers. T able 6f shows common-sense relationships b etw een pairs of v ariables that CrossCa t-CMI detects but R 2 do es not; scatter plots rev eal they are either (i) non-linearly related, (ii) roughly linear with heterosk edastic noise, or (iii) pair- wise indep endent but dep enden t given a third v ariable. Recall that CrossCat is a product of DPMMs; practi- cally meaningful conditions for w eak and strong con- sistency of Diric hlet lo cation-scale mixtures ha ve b een established by [11, 33]. This supp orts the intuition that CrossCat can detect a broad class of predictiv e relationships that simpler parametric mo dels miss. Figure 7 fo cuses on a group of four “trade”-related v ari- ables in the Gapminder dataset detected as probably dep enden t: “net trade balance”, “total go ods traded”, “exp orts of goo ds and services”, and “imp orts of goo ds and services”. R 2 fails to detect a statistically sig- nifican t dep endence b et ween “net trade balance” and the other v ariables, due to weak linear correlations and heteroskedastic noise as shown in the scatter plots (Figure 7b). F rom economics, these four v ariables are causally related by the graphical mo del in Figure 7c, where the v alue of a no de is a noisy addition or sub- traction of the v alues of its parents. Figure 7d il- lustrates that CrossCat reco v ers predictive relation- ships b et ween these v ariables: conditioning on “ex- p orts” =150 and “balance” =30 (a low probability even t according to the left subplot) centers the p osterior predictiv e distribution of “imp orts” around 120, and decouples it from “total go ods”. The p osterior CMI curv es of “imports” and “total goo ds”, with and with- out the conditions on “exports” and “balance”, formal- ize this decoupling (righ t subplot of Figure 7d). 5 Related W ork There is broad ackno wledgment that new tec hniques for dep endency detection b eyond linear correlation are required. Existing approaches for conditional inde- p endence testing include the use of k ernel metho ds [1, 10, 35, 29], copula functions [2, 25, 17], and char- Detecting Dep endencies in Sparse, Multiv ariate Databases (a) Blo c k of “trade” v ariables de- tected as probably dependent. 0 50 100 150 200 250 e xpor ts goods & ser vices (% gdp) − 80 − 60 − 40 − 20 0 20 40 60 net trade balance (% gdp) 0 50 100 150 200 250 impor ts goods & ser vices (% gdp) 0 100 200 300 400 total goods traded (% gdp) (b) Scatter plots show weak linear correlations and heteroskedastic noise for net balance . exports (goods & services) imports (services) imports (goods) exports (goods) exports (services) imports (goods & services) total goods traded net balance trade not in dataset (c) Ground truth causal structure of v ariables in the “trade” blo c k. 50 100 150 200 total goods traded (% gdp) 0 20 40 60 80 100 120 140 impor ts of goods & ser vices (% gdp) Joint P osterior Surface of Pr[Impor ts, Goods] 50 100 150 200 total goods traded (% gdp) impor ts of goods & ser vices (% gdp) Joint P osterior Surface of Pr[Impor ts, Goods | Expor ts=150, Balance=30] 0 . 0 0 . 1 0 . 2 0 . 3 0 . 4 0 . 5 0 . 6 0 . 7 Conditional Mutual Inf ormation (nats) P osterior Density P osterior Distrib utions of Conditional Mutual Inf ormation MI(Impor ts:Goods) MI(Impor ts:Goods | Expts=150,Bal=30) (d) Left plot sho ws the join t posterior density of “imp orts” and “go ods”, where the marginal coupling is due to their common paren t in (c). Center plot sho ws the same distribution conditioned on “exp orts” =150 and “balance”=30; “imports” no w cen ters around its noiseless v alue of 120, and is decoupled from “goo ds”. Righ t plot shows the CMI for these distributions. Figure 7: CMI disco vers existence and confirms strength of predictive relationships betw een “trade” v ariables. acteristic functions [32], many of whic h capture non- linear and multiv ariate predictive relationships. Un- lik e these metho ds, how ever, our approach represents dep endence in terms of conditional mutual information and is not embedded in a frequentist decision- theo- retic framew ork. Our quantit y of in terest is a full p os- terior distribution o ver CMI, as opposed to a p -v alue to identify when the null hypothesis CMI=0 cannot b e rejected. Dep endence detection is muc h less studied in the Bay esian literature; [8] use a Poly a tree prior to compute a Bay es F actor for the relative evidence of dep endence v ersus indep endence. Their metho d is used only to quantify evidence for the existence, but not assess the strength, of a predictiv e relationship. The most similar approach to this w ork w as prop osed indep enden tly in recent work by [16], who compute a distribution ov er CMI b y estimating the joint density using an encompassing non-parametric Bay esian prior. Ho wev er, the differences are significant. First, the Mon te Carlo estimator in [16] is based on resampling empirical data. Ho w ever, real-world databases ma y b e to o sparse for resampling data to yield go o d esti- mates, esp ecially for queries given unlikely constrain ts. Instead, w e use a Monte Carlo estimator by simulat- ing the predictiv e distribution. Second, the prior in [16] is a standard Diric hlet pro cess mixture mo del, whereas this pap er prop oses a sparsity-inducing Cross- Cat prior, which permits optimized computations for upp er b ounds of p osterior probabilities as w ell as sim- plifying CMI queries with m ultiv ariate conditions. 6 Discussion This paper has shown it is p ossible to detect predic- tiv e relationships by in tegrating probabilistic program- ming, information theory , and non-parametric Bay es. Users sp ecify a broad class of conditional mutual in- formation queries using a simple SQL-like language, whic h are answered using a scalable pip eline based on appro ximate Bay esian inference. The underlying ap- proac h applies to arbitrary generative p opulation mod- els, including parametric mo dels and other classes of probabilistic programs [28]; this work has fo cused on exploiting the sparsity of CrossCat mo del structures to impro ve scalabilit y for exploratory analysis. With this foundation, one may extend the technique to domains suc h as causal structure learning. The CMI estimator can b e used as a conditional-independence test in a structure disco very algorithm such as PC [31]. It is also p ossible to use learned CMI probabilities as part of a prior o ver directed acyclic graphs in the Bay esian setting. This pap er has fo cused on detection and pre- liminary assessment of predictiv e relationships; con- firmatory analysis and descriptive summarization are left for future work, and will require an assessmen t of the robustness of join t densit y estimation when ran- dom sampling assumptions are violated. Moreo ver, new algorithmic insights will b e needed to scale the tec hnique to efficiently detect pairwise dep endencies in v ery high-dimensional databases with tens of thou- sands of v ariables. Saad and Mansinghk a A ckno wledgemen ts This research was supp orted by DARP A (PP AML pro- gram, con tract n umber F A8750-14-2-0004), IARP A (under research contract 2015-15061000003), the Of- fice of Na v al Research (under research contract N000141310333), the Army Researc h Office (under agreemen t num b er W911NF-13-1-0212), and gifts from Analog Devices and Go ogle. References [1] F rancis Bach and Michael Jordan. Kernel inde- p enden t comp onen t analysis. Journal of Machine L e arning R ese ar ch , 3:1–48, 2002. [2] T aoufik Bouezmarni, Jero en VK Rombouts, and Ab derrahim T aamouti. Nonparametric copula- based test for conditional indep endence with ap- plications to granger causality . Journal of Busi- ness & Ec onomic Statistics , 30(2):275–287, 2012. [3] Craig Boutilier, Nir F riedman, Moises Gold- szmidt, and Daphne Koller. Con text-sp ecific in- dep endence in ba yesian net works. In Pr o c e e dings of the Twelfth International Confer enc e on Un- c ertainty in A rtificial Intel ligenc e , pages 115–123. Morgan Kaufmann Publishers Inc., 1996. [4] National Reseach Council. F r ontiers in massive data analysis . The National Academies Press, 2013. [5] T.M. Cov er and J.A. Thomas. Elements of Infor- mation The ory . Wiley Series in T elecommunica- tions and Signal Pro cessing. Wiley , 2012. [6] Da vid Edwards. Intr o duction to gr aphic al mo d- el ling . Springer T exts in Statistics. Springer, 2012. [7] Mic hael Escobar and Mike W est. Bay esian densit y estimation and inference using mixtures. Journal of the Americ an Statistic al Asso ciation , 90(430): 577–588, 1995. [8] Sarah Filippi and Chris Holmes. A ba yesian non- parametric approach to testing for dep endence b et w een random v ariables. Bayesian Analysis , 2016. Adv ance publication. [9] Daniel Fink. A compendium of conjugate pri- ors. T ec hnical report, Environmen tal Statistics Group, Department of Biology , Montana State Univ ersity , 1997. [10] Kenji F ukumizu, Arthur Gretton, Xiaohai Sun, and Bernhard Sc hölkopf. Kernel measures of con- ditional dep endence. In Pr o c e e dings of the Twen- tieth International Confer enc e on Neur al Infor- mation Pr o c essing Systems , pages 489–496. Cur- ran Asso ciates Inc., 2007. [11] Subhashis Ghosal, Ja yan ta Ghosh, and R.V. Ra- mamo orthi. Posterior consistency of dirichlet mixtures in density estimation. The Annals of Statistics , 27(1):143–158, 1999. [12] Dilan Görür and Carl Edward Rasm ussen. Dirich- let pro cess gaussian mixture mo dels: Choice of the base distribution. Journal of Computer Sci- enc e and T e chnolo gy , 25(4):653–664, 2010. [13] Arth ur Gretton, Olivier Bousquet, Alex Smola, and Bernhard Schölk opf. Measuring statistical dep endence with hilb ert-sc hmidt norms. In Pr o- c e e dings of the Sixte enth International Confer- enc e Algorithmic L e arning The ory , pages 63–77. Springer, 2005. [14] Sonia Jain and Radford M Neal. A split-merge mark ov chain monte carlo procedure for the diric hlet pro cess mixture mo del. Journal of Com- putational and Gr aphic al Statistics , 13(1):158– 182, 2012. [15] Alexander Krask o v, Harald Stögbauer, and P e- ter Grassb erger. Estimating mutual information. Physic al R eview E , 69(6):066138, 2004. [16] T suyoshi Kunihama and David B Dunson. Non- parametric ba y es inference on conditional inde- p endence. Biometrika , 103(1):35–47, 2016. [17] Da vid Lopez-Paz, Philipp Hennig, and Bernhard Sc hölkopf. The randomized dep endence co effi- cien t. In Pr o c e e dings of the Twenty-Sixth Interna- tional Confer enc e on Neur al Information Pr o c ess- ing Systems , pages 1–9. Curran Asso ciates Inc., 2013. [18] Vik ash Mansinghk a, Ric hard Tibb etts, Ja y Bax- ter, Pat Shafto, and Baxter Eav es. Bay esDB: A probabilistic programming system for query- ing the probable implications of data. CoRR , abs/1512.05006, 2015. [19] Vik ash Mansinghk a, Patric k Shafto, Eric Jonas, Cap P etsc hulat, Max Gasner, and Joshua B. T enenbaum. CrossCat: A fully Bay esian nonpara- metric metho d for analyzing heterogeneous, high dimensional data. Journal of Machine L e arning R ese ar ch , 17(138):1–49, 2016. [20] Kan tilal V arichand Mardia, John T Kent, and John M Bibby . Multivariate analysis . Probabil- it y and Mathematical Statistics. Academic Press, 1980. [21] Rudy Mo ddemeijer. On estimation of entrop y and m utual information of contin uous distributions. Signal Pr o c essing , 16(3):233–248, 1989. [22] Y oung-Il Mo on, Bala ji Ra jagopalan, and Upmanu Lall. Estimation of mutual information using ker- nel densit y estimators. Physic al R eview E , 52(3): 2318, 1995. Detecting Dep endencies in Sparse, Multiv ariate Databases [23] F ritz Ob ermey er, Jonathan Glidden, and Eric Jonas. Scaling nonparametric Bay esian inference via subsample-annealing. In Pr o c e e dings of the Sevente enth International Confer enc e on A rtifi- cial Intel ligenc e and Statistics , pages 696–705. JMLR.org, 2014. [24] Liam Paninski. Estimation of entrop y and mutual information. Neur al Computation , 15(6):1191– 1253, 2003. [25] Barnabás Póczos, Zoubin Ghahramani, and Jeff Sc hneider. Copula-based k ernel dep endency mea- sures. CoRR , abs/1206.4682, 2012. [26] Christian Rob ert and George Casella. Monte Carlo Statistic al Metho ds . Springer T exts in Statistics. Springer, 2005. [27] Hans Rosling. Gapminder: Un veiling the beauty of statistics for a fact based world view. URL https://www.gapminder.org/data/ . [28] F eras Saad and Vik ash Mansinghk a. Probabilis- tic data analysis with probabilistic programming. CoRR , abs/1608.05347, 2016. [29] Dino Sejdino vic, Arthur Gretton, and Wicher Bergsma. A k ernel test for three-v ariable interac- tions. In Pr o c e e dings of the Twenty-Sixth Interna- tional Confer enc e on Neur al Information Pr o c ess- ing Systems , pages 1124–1132. Curran Associates Inc., 2013. [30] Ross D Shac hter. Ba y es-ball: Rational pastime for determining irrelev ance and requisite informa- tion in b elief netw orks and influence diagrams. In Pr o c e e dings of the F ourte enth Confer enc e on Un- c ertainty in A rtificial Intel ligenc e , pages 480–487. Morgan Kaufmann Publishers Inc., 1998. [31] P eter Spirtes, Clark Glymour, and Richard Sc heines. Causation, Pr e diction, and Se ar ch . A daptive Computation and Machine Learning. MIT Press, 2000. [32] Liang jun Su and Halbert White. A consistent c haracteristic function-based test for conditional indep endence. Journal of Ec onometrics , 141(2): 807–834, 2007. [33] Sury a T T okdar. Posterior consistency of diric h- let lo cation-scale mixture of normals in densit y estimation and regression. The Indian Journal of Statistics , 68(1):90–110, 2006. [34] Jo e Whittaker. Gr aphic al mo dels in applie d multi- variate statistics . Wiley Series in Probabilit y and Mathematical Statistics. Wiley , 1990. [35] Kun Zhang, Jonas Peters, and Dominik Janzing. Kernel-based conditional independence test and application in causal discov ery . In Pr o c e e dings of the Twenty-Seventh Confer enc e on Unc ertainty in Artificial Intel ligenc e , pages 804–813. AUAI Press, 2011. Saad and Mansinghk a A Pro of of optimizing a CMI query Pr o of of L emma 1. W e use the pro duct-sum property of the logarithm (line 3) and linearit y of exp ectation (line 4) to show that CrossCat’s v ariable partition γ induces a factorization of a CMI query . I G ( x A : x B | ˆ x C ) = E log p G ( x A : x B | ˆ x C ) p G ( x A | ˆ x C ) p G ( x B | ˆ x C ) = E log Y V ∈ γ p G V ( x A∩V , x B∩V | ˆ x C ∩V ) p G V ( x A∩V | ˆ x C ∩V ) p G V ( x B∩V | ˆ x C ∩V ) = E X V ∈ γ log p G V ( x A∩V , x B∩V | ˆ x C ∩V ) p G V ( x A∩V | ˆ x C ∩V ) p G V ( x B∩V | ˆ x C ∩V ) = X V ∈ γ E log p G V ( x A∩V , x B∩V | ˆ x C ∩V ) p G V ( x A∩V | ˆ x C ∩V ) p G V ( x B∩V | ˆ x C ∩V ) = X V ∈ γ I G V ( x A∩V : x B∩V | ˆ x C ∩V ) . B Exp erimen tal metho ds for dep endence detection baselines In this section w e outline the methodology used to pro duce the pairwise R 2 and HSIC heatmaps sho wn in Figures 6a and 6b. T o detect the strength of linear correlation (for R 2 ) and p erform a marginal indep en- dence test (for HSIC) giv en v ariables x i and x j in the Gapminder dataset, all records in which at least one of these t wo v ariables is missing w ere dropp ed. If the total n um b er of remaining observ ations was less than three, the n ull hypothesis of indep endence was not rejected due to degeneracy of these metho ds at very small sample sizes. Hyp othesis tests were p erformed at the α = 0 . 05 significance level. T o account for m ul- tiple testing (a total of 320 2 = 51040 ), a standard Bonferroni correction was applied to ensure a family- wise error rate of at most α . W e used an op en source MA TLAB implementation for HSIC (function hsicTestBoot from http://gatsby. ucl.ac.uk/~gretton/indepTestFiles/indep.htm ). 1000 p erm utations were used to appro ximate the n ull distribution, and kernel sizes were determined using median distances from the dataset. F rom Figure 6b, HSIC detects a large n umber of statistically signifi- can t dep endencies. Figures 8 and 9 rep ort spurious relationships rep orted as dep enden t by HSIC but ha ve a low dep endence probability of less than 0.15 according to p osterior CMI (Eq 7), and common-sense relationships reported as indep enden t HSIC but hav e a high dep endence probability . Figure 8: Spurious relationships detected as dep en- den t by HSIC ( p 10 − 6 ) but probably indep enden t ( P [ I G ( x i : x j ) > 0] < 0 . 15) b y the MI upp er b ound. v ariable A v ariable B bo dy mass index (men) priv ately owned forest (%) energy use (p er capita) 50+ yrs sex ratio homicide (15-29) inflation (annual %) children out of primary school male ab o ve 60 (%) income share (fourth 20%) suicide rate age 45-59 personal computers arms exports (US$) billionaires (p er 1M) mobile subscription (p er 100) residential elec. consumption smear-positive detection (%) coal consumption (p er capita) age at 1st marriage (women) coal consumption (p er capita) dead kids p er woman underweigh t children murder (p er 100K) female 0-4 years (%) 15+ literacy rate (%) broadband subscrib ers (%) dots new case detection (%) crude oil pro d. (per capita) TB incidence (p er 100K) dependency ratio p eople living with hiv 18 20 22 24 26 28 30 32 34 bod y mass inde x − 20 0 20 40 60 80 100 120 priv ate f orest − 50 0 50 100 150 200 250 300 coal consumption 0 . 0 0 . 2 0 . 4 0 . 6 0 . 8 dead kids − 10 0 10 20 30 40 50 underweight c hildren − 10 0 10 20 30 40 50 m ur der per 100k − 20 0 20 40 60 80 100 120 140 dots detection − 5 0 5 10 15 20 25 30 br oadband Figure 9: Common-sense relationships detected as in- dep enden t by HSIC ( p 10 − 6 ), but probably dep enden t ( P [ I G ( x i : x j ) > 0] > 0 . 85) b y the MI upp er b ound. v ariable A v ariable B motor vehicles p er 1k pop urban agglomerations (%) car mortality (p er 100K) road incidents 45-59 wood remov al (cubic m.) primary forest land (ha) forest pro ducts total (US$) primary forest land (ha) 15-24 yrs sex ratio 50+ yrs sex ratio gdp p er working hr (US$) urban p opulation (%) dots p op. co verage (%) dots new case detection (%) total 15-24 unemp. (%) long term unemp. (%) female self-employ ed (%) female service work ers (%) female agricult. work ers (%) total industry workers (%) female industry workers (%) male industry workers (%) road incidents age 60+ road incidents age 15-29 suicide rate age 15-29 suicide rate age 60+ 0 200 400 600 800 1000 motor vehic les − 20 0 20 40 60 80 100 120 urban pop. 0 2 4 6 8 10 12 14 car mor tality 0 5 10 15 20 25 30 r oad incidents − 1 0 1 2 3 4 5 6 w ood remo v al × 10 8 − 1 0 1 2 3 4 5 f orest land × 10 8 0 5 10 15 20 25 30 35 suicide (15-29) 0 10 20 30 40 50 60 suicide (60+) Detecting Dep endencies in Sparse, Multiv ariate Databases C Application to a database of mathematics marks mech vectors algebra analysis stats 77 82 67 67 81 23 38 36 48 15 63 78 80 70 81 55 72 63 70 68 . . . . . . . . . . . . . . . (a) Database of mathematics marks for 88 students, where rows are stu- den ts and columns are exam scores. M V G L S M 1.00 0.33 0.23 0.00 0.03 V 0.33 1.00 0.28 0.08 0.02 G 0.23 0. 28 1.00 0.43 0.36 L 0.00 0.08 0.43 1.00 0.26 S 0.02 0.02 0.36 0.26 1.00 (b) P artial correlation matrix; red en tries indicate statistically significan t conditional indep endences. vectors (V) mechanics (M) algebra (G) statistics (S) analysis (L) (c) Undirected (Gaussian) graphical mo del implied by the partial correla- tion matrix. Empirical Frequenc y vect | alg=50 vect | alg=50, anl=70 vect | alg=60 vect | alg=60, anl=70 20 30 40 50 60 70 80 V ector s Exam Score Predictive Density vect | alg=50 vect | alg=50, anl=70 20 30 40 50 60 70 80 V ector s Exam Score vect | alg=60 vect | alg=60, anl=70 (d) Histograms from the raw dataset (top); and pre- dictiv e distributions from CrossCat (bottom). 0 . 00 0 . 05 0 . 10 0 . 15 0 . 20 Conditional Mutual Inf ormation (nats) P osterior Density CMI(vect,anl | alg) CMI(vect,anl | alg=50) CMI(vect,anl | alg=60) (e) Posterior distribution of CMI( vectors , analysis ) given v arious conditions of algebra show context-specific dep endence. Figure 10: Using p osterior CMI distributions to disco ver c ontext-sp e cific predictive relationships in the math- ematics marks dataset [20, 34, 6] which are missed by partial correlations. (a) The database contains scores of 88 students on fiv e mathematics exams: mechanics , vectors , algebra , analysis , and statistics . (b) Mod- eling the v ariables as join tly Gaussian and computing the partial correlation matrix indicates that ( mechanics , vectors ) are together conditionally indep enden t of ( analysis , statistics ), given algebra . (c) A Gaussian graphical mo del which expresses the conditional independences relationships is formed b y removing edges whose inciden t no des hav e statistically-significan t partial correlations of zero. Th e graph suggests that when predicting the vectors score for a student whose algebra score is known, further conditioning on the analysis score pro vides no additional information. W e will critique this finding, by showing that the predictive strength of analysis on vectors given algebra v aries, dep ending on the conditioning v alue of algebra . (d) The left panel sho ws that when algebra = 50, conditioning on analysis = 70 app ears to hav e little effect on the prediction for vectors . The right panel shows that when algebra = 60, how ev er, conditioning on analysis = 70 results in a sizeable shift of the posterior mean of vectors from 52 to just under 70. This shift is consistent with the top right histogram, where knowing that analysis = 70 eliminates all the vectors scores in the hea vy left tail. (e) W e formalize this “context-specific” dep endence by computing the distribution of the CMI of vectors and analysis under t wo conditions: algebra = 50 (green curve), and algebra = 60 (red curve). The red curv e places great probability on higher v alues of m utual information than the green curve, which explains the shift in predictiv e density from (d). Finally , w e observ e that the CMI is w eakest when mar ginalizing ov er all v alues of algebra (blue curve), which explains why the partial correlation of vectors and analysis , which only considers marginal relationships, is near zero.
Original Paper
Loading high-quality paper...
Comments & Academic Discussion
Loading comments...
Leave a Comment