Classifying Online Dating Profiles on Tinder using FaceNet Facial Embeddings
A method to produce personalized classification models to automatically review online dating profiles on Tinder is proposed, based on the user's historical preference. The method takes advantage of a FaceNet facial classification model to extract fea…
Authors: Charles F Jekel, Raphael T. Haftka
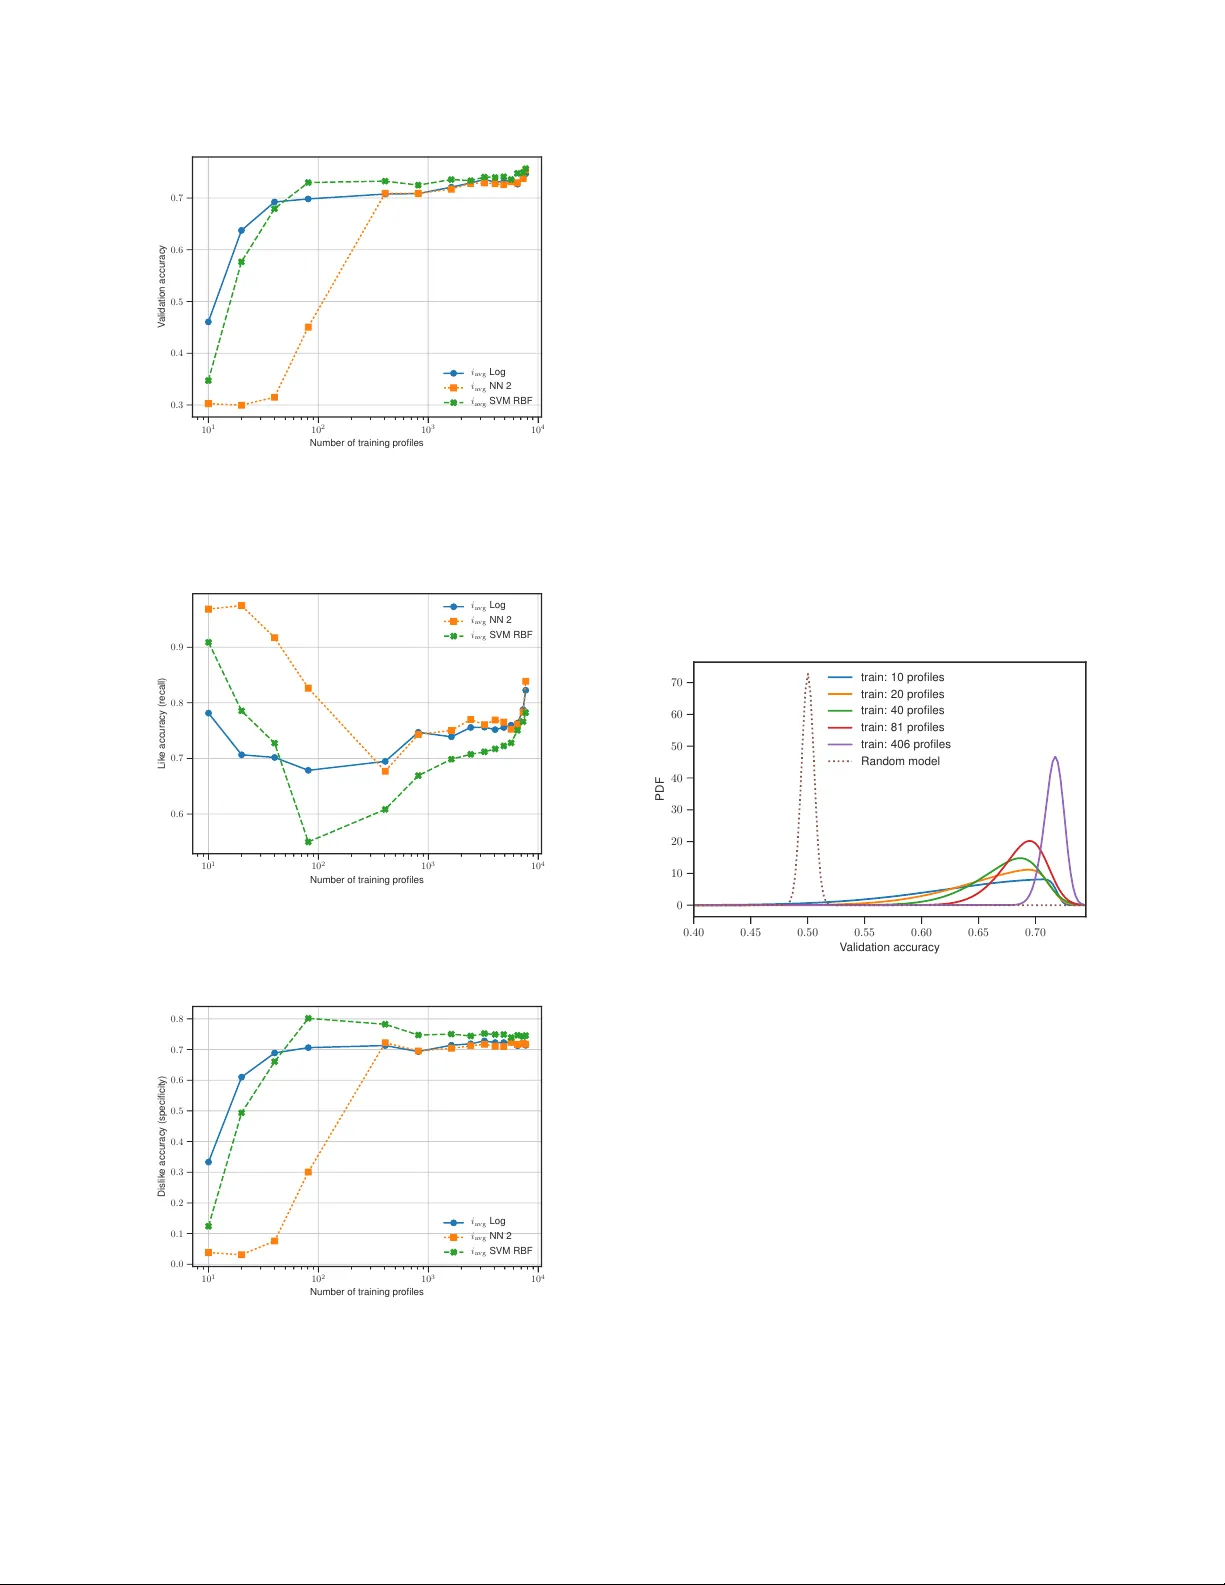
CLASSIFYING ONLINE D A TING PR OFILES ON TINDER USING F A CENET F A CIAL EMBEDDINGS Charles F . J ekel (cjekel@ufl.edu; cj@jekel.me) and Raphael T . Haftka Department of Mechanical & Aerospace Engineering - Uni versity of Florida - Gainesville, FL 32611 ABSTRA CT A method to produce personalized classification models to automatically revie w online dating profiles on Tinder , based on the user’ s historical preference, is proposed. The method takes advantage of a FaceNet facial classification model to extract features which may be related to facial attracti veness. The embeddings from a FaceNet model were used as the fea- tures to describe an individual’ s face. A user reviewed 8,545 online dating profiles. For each revie wed online dating pro- file, a feature set was constructed from the profile images which contained just one face. T wo approaches are presented to go from the set of features for each face to a set of pro- file features. A simple logistic regression trained on the em- beddings from just 20 profiles could obtain a 65% v alidation accuracy . A point of diminishing mar ginal returns was identi- fied to occur around 80 profiles, at which the model accuracy of 73% would only improv e marginally after re viewing a sig- nificant number of additional profiles. Index T erms — facial classification, facial attractiveness, online dating, classifying dating profiles 1. INTR ODUCTION Online dating has become a commonplace in today’ s soci- ety . The top grossing iOS application in September 2017 was an online dating service named Tinder . Users of online dating services are generally expected to spend a significant amount of time filtering through the profiles of potential part- ners. This study inv estigates whether a pattern in facial fea- tures can be used to filter online dating profiles on T inder . T inder was selected for this study because of the popular - ity of the application [ 1 ]. The mobile dating application al- lows users to browse dating profiles of nearby singles. Users are presented with a single profile at a time. At first glance, the user can see the profile picture, first name, and age of an individual on T inder . A user must then decide whether they like or dislike the profile on the spot. The user can view ad- ditional information such as an optional biography or extra pictures, but no new profiles can be revie wed until a decision is made. When tw o individuals ha ve liked each other , they are presented with a notification and the opportunity to message each other . A custom application was developed to interface with T in- der . The intention of the application was to allow a user to like and dislike profiles while recording everything about the profiles. The profile information contains the mandatory re- quirements from tinder , which include the profile’ s name, age, and pictures. Every Tinder profile includes at least one image. Additionally , it is optional to include a biography , current job, and current school. All of this information is stored along with the like or dislike v erdict in a database. A method for obtaining personalized classification mod- els from a user’ s historical preferences is presented. The method takes advantage of recent advancements in computer vision related to facial detection, facial classification, and fa- cial attracti veness. The results of a personalized classification model for a user’ s revie wed Tinder profiles are then presented. 2. RELA TED WORKS Related work focuses on literature regarding modeling facial attractiv eness. Attractiv eness is known to play a ke y role in online dating profiles [ 1 ], [ 2 ]. There has been substantial w ork in literature to predict f a- cial attracti veness with computer models. T raditionally , facial attractiv eness has been modeled with some sort of eigenface transformation. Eisenthal et al. [ 3 ] were able to find a correla- tion of facial attracti veness using an eigenf ace transformation on a small data set of 92 images. These eigenface transfor- mations are run through a principle component analysis to determine the important facial features [ 4 ], [ 5 ]. Con volutional neural networks (CNN) have become pop- ular for image processing in recent years. Gray et al. [ 6 ] showed that a CNN trained to predict facial attractiv eness could extract more meaningful features than an eigenface transformation. Consequently , facial features related to at- tractiv eness could be extracted automatically without identi- fying landmarks using the CNN. The recent works of Rothe et al. [ 7 ] demonstrated that a CNN can be trained on a large data set to predict facial at- tractiv eness. The training set contained the faces of women who were lik ed or disliked by male participants. Personalized predictions were made based on the historical preferences of 8,560 heterosexual male users. The model only considered the first profile image from each profile. The results of the personalized predictions were impressiv e, with a mean accu- racy of 75% for the male users. Zang et al. [ 8 ] used a pre-trained VGG-F ace CNN de- scriptor to predict the facial attractiv eness of male and female users for an online dating site. The y demonstrated that fea- tures from a facial classification model could be used to pre- dict facial attractiv eness. The model in Rothe et al. [ 7 ] was trained on a data set related to facial attractiv eness, while the model used in Zang et al. [ 8 ] was trained on f aces for the purpose of classification. These studies highlight that a large scale facial classification model is useful to predict facial at- tractiv eness. The VGG-Face CNN used was created by Parkhi et al. [ 9 ] and scores an impressive 98.95% accuracy on the La- beled Faces in the W ild (LFW) database [ 10 ]. These works focused solely on rating individual photos, but hav e not progressed to a usable model that likes or dislikes complete online dating profiles. The work presented in this paper striv es to close this gap. 3. OUR METHODOLOGY The methodology proposed here attempts to classify an on- line dating profile as either a lik e or dislik e. T wo dif ferent ap- proaches are proposed to consolidate multiple facial features from the images in a profile into a single vector of features that describes the profile. Like the related works of [ 7 ], [ 8 ], the last layer of a CNN was used as the facial features for each face. A new implementation of the FaceNet classifica- tion model first described by Schrof f et al. [ 11 ] is used with a slightly higher LFW score than used in Zang et al. [ 8 ]. The detection of profile images that contain only one f ace per image was automated using computer vision techniques. These faces were fed into a FaceNet model to extract the facial features as embeddings. A set of embeddings for re- viewed online dating profiles was used to train a personalized classification model. The major assumptions of the purposed method are as fol- lows: 1) An online dating profile can be re viewed using only the profile images; 2) The face of the indi vidual profile can be found from the profile pictures that contain only one face per image; 3) Images with more than one face in an online dat- ing profile can be ignored. Profiles that can’t be identified to a single face can be rejected; 4) A pattern exists in the faces of indi viduals who were liked or disliked by a user re view- ing online dating profiles; 5) A trained FaceNet model can be ev aluated on new faces to extract the facial features of the individuals. 3.1. FaceNet implementation A Python library called facenet was used to calculate the fa- cial embeddings of the dating profile pictures. These embed- dings are from the last layer of a CNN, and can be thought of as the unique features that describe an indi vidual’ s f ace. The facenet library was created by Sandberg as a T ensorFlo w implementation of the FaceNet paper by Schroff et al. [ 11 ], with inspirations from [ 9 , 12 , 13 ]. The library uses the MIT license and is a vailable online at https://github.com/ davidsandberg/facenet . There are pre-trained facenet models a vailable online. The models have been validated on the LFW database [ 10 ]. The current best model has a LFW accuracy of 99.2% and was trained as a classification model on a subset of the MS- Celeb-1M database [ 14 ]. The model’ s architecture follows the Inception-ResNet-v1 network as described by Szegedy et al. [ 15 ]. The facenet library includes an implementation of Multitask CNN (MTCNN) by Zhang et al. [ 16 ] to detect facial landmarks, which was used to create training faces as 182x182 pixel images from the MS-Celeb-1M database. The facenet model turns a color image of a f ace into a v ec- tor of 128 floating point numbers. These 128 embeddings can be used as features for classification or clustering [ 11 ]. The facenet library includes a script to calculate the embeddings from images of faces using a pre-trained model. 3.2. Classification methodology Classification models were determined for two different ap- proaches on the embeddings. One approach considered all of the embeddings, from the images containing just one face, in the dating profile. These embeddings were used to describe the entire profile. The other approach rather considered the av erage embedding v alues across the images. Again, only images containing exactly one face were considered. The first approach used the 128 embeddings from each image as the features of the profile. The embeddings from the images of the profiles can be described as the vectors of i 1 = [ x 1 , x 2 , · · · , x 128 ] (1) i 2 = [ y 1 , y 2 , · · · , y 128 ] (2) . . . = . . . (3) i n = [ z 1 , z 2 , · · · , z 128 ] (4) for n number of profile images. Then a single vector of em- beddings can be constructed for the profile as i p = [ i 1 , i 2 , · · · , i n ] (5) where i p is a vector containing 128 n values. The second approach considered the av erage embedding value of the facial images. Thus a profile with one facial im- age would hav e 128 unique embeddings. A profile could be described as i 1 = [ x 1 , x 2 , · · · , x 128 ] (6) i 2 = [ y 1 , y 2 , · · · , y 128 ] (7) . . . = . . . (8) i f = [ z 1 , z 2 , · · · , z 128 ] (9) where i f is the vector of embedding from the f image in the profile. Then an average embeddings could be calculated as i avg = x 1 + y 1 + ··· + z 1 f x 2 + y 2 + ··· + z 2 f . . . x 128 + y 128 + ··· + z 128 f (10) where i avg is a v ector with the same size as the number of embeddings calculated. Calculating the facial embeddings from a user’ s revie wed online dating profiles is computationally inexpensi ve, as the calculation is simply a function e valuation on a pre-trained CNN. Then, classification models were trained using either i p or i avg as the input features. Personalized classification models could be constructed based on the preference from an individual’ s historically re viewed online dating profiles. 4. EXPERIMENT AL RESUL TS A heterosexual male used the custom application with the in- tention of finding a romantic partner . The reviewing of tinder profiles went on for a month, but stopped early because the user found a girlfriend in the process. It may be important to mention that males may ha ve different online dating ten- dencies than females [ 1 , 2 ]. The user took about one hour to revie w 100 profiles. In the end, a data set was created which revie wed 8,545 tinder profiles. The user lik ed a total of 2,411 profiles. Additionally , the data set contains 38,218 images from the profiles browsed. Each image has a resolution of 640x640 pixels (px). The results were split into two categories. The first sub- section presents the results of the data set after pre-processing was performed. The data set was transitioned from complete online dating profiles to a data set of faces for each profile. The faces were then run through a FaceNet model to ex- tract the embeddings for each face. The second section then presents the results of classifying these embeddings for the two proposed input dimensions. 4.1. Data set after pre-pr ocessing The MTCNN described by [ 16 ] was used to detect and box faces from the 640x640 px profile images. Faces were se- lected with a minimum size of 60x60 px and a threshold of 0 . 8 . Profile images that contained just one face were e xtracted and re-sized. A profile that did not contain a single image with only one face, was immediately remo ved. There were 24,486 images that contained only one face in the image (accord- ing to the MTCNN). Fortunately 8,130 profiles of the 8,545 revie wed (or 95.1%) contained at least one uniquely identifi- able face. The images containing just one face were cropped to 182x182 px images with a mar gin of 44 px around the face. A face at the minimum size was enlarged, while larger faces were reduced in size. The MTCNN results were impressive, despite the sub- stantial amount of noise in the images. Noise includes ev- erything from sunglasses, hats, and scarfs to Snapchat filters. For example, a particular popular Snapchat filter applies the ears, nose, and mouth of a dog to an indi vidual’ s face. The MTCNN appeared to work well despite the noise in the data. There was a limited number of f alse positi ves, of which a fe w are presented in Fig. 1 . The false positi ves were not removed from the training set, as the noise they provide may be useful to construct a rob ust classifier . The true rate of false positi ves and false negati ves was not studied, as the locations of faces in the original 38,218 images were not recorded. Fig. 1 . Examples of false positi ves which the MTCNN iden- tified as human faces. The embeddings were calculated for the f aces from the 8,130 profiles using the FaceNet implementation described. The av erage profile re viewed had 3.01 images of a single face, with a standard deviation of 1.34. T en w as the maxi- mum number of images for a profile in the new data set. Thus i p was a vector of 128 × 10 in length. Profiles with fewer than ten images would have zeros in place of the missing images. Essentially a profile with just one f acial image would have 128 unique embeddings and 1,152 zeros, a profile with two facial images would hav e 256 unique embeddings and 1,024 zeros, and so forth. The other input feature i avg was calcu- lated for each profile. The supplementary material includes the two input dimensions ( i p and i avg ) with binary labels to show whether the profile w as either liked or disliked. 4.2. Classification models In order to build a reasonable classification model, it was im- portant to demonstrate ho w man y profiles were required to be revie wed. Classification models were trained using various fractions of the entire data, ranging from 0.125% to 95% of the 8,130 profiles. At the low end, just 10 profiles were used to train the classification model, while the remaining 8,120 profiles were used to validate the trained classification model. On the other spectrum, classification models were trained us- ing 7,723 profiles and validated on 407 profiles. The classification models were scored on accurac y , specifically the number of correctly classified labels over the number of profiles. The training accuracy refers to the accu- racy in the training set, while the v alidation accurac y refers to the accuracy in the test set. This data set suffers from a class imbalance, as only 28% of the total Tinder profiles revie wed were liked. The classi- fication models were trained assuming a balanced class. A balanced class indicates that each profile considered had the same weight, regardless of whether the profile was liked or disliked. The class weight can be user dependent, as some users would value correctly liking profiles more than incor- rectly disliking profiles. A like accuracy was introduced to represent the number of correctly labeled lik ed profiles out of the total number of liked profiles in the test set. Complementary , a dislike accuracy was used to measure the disliked profiles predicted correctly out of the total number of disliked profiles in the test set. A model that disliked every single profile, would have a 72% validation accuracy , a 100% dislike accuracy , but a 0% like accuracy . The like accuracy is the true positive rate (or recall), while the dislike accuracy is the true ne gati ve rate (or specificity). V arious classification models were fit using either i p or i avg as the input. Scikit-learn was used to fit logistic regres- sion and support vector machines (SVM) [ 17 ], while Keras and T ensorFlow were used to fit v arious neural networks [ 18 , 19 ] to the embeddings. The recei ver operating characteristic (R OC) for logistic regression (Log), neural network (NN), and SVM using radial basis function (RBF) are presented in Fig. 2 . T w o dif ferent layer configurations of neural networks are presented for each input dimension as NN 1 and NN 2. Additionally , the area under curve (A UC) for each classification model is presented. The complete input dimension feature of i p did not appear to offer any adv antages over i avg when considering A UC. A neural network had the best A UC score of 0.83, b ut it was only slightly better than a logistic regression with an A UC score of 0.82. This R OC study was performed using a random 10:1 train:test split (training on 7,317 and validation on 813 profiles). Since the A UC scores were comparable, the remaining results only consider classification models fit to i avg . Models were fit using various train-to-test ratios. The train:test split was performed at random; howe ver each model used the same random state for a giv en number of training profiles. The ratio of likes to dislikes was not preserved in the random splits. The training accuracy of the models is presented in Fig. 3 and the validation accuracy for these models is presented in Fig. 4 . The first data point represents a training size of 10 profiles and a v alidation size of 8,120 profiles. The last data point uses 7,723 training profiles and validation on 407 profiles (a 20:1 split). The logistic regression model (Log) and neural network (NN 2) conv erge to a comparable training accuracy of 0.75. Impressiv ely , a model can ha ve a validation accuracy greater than 0.5 after being trained on just 20 profiles. A rea- sonable model with a validation accuracy near 0.7 was trained 0.0 0.2 0.4 0.6 0.8 1.0 False Positive Rate 0.0 0.2 0.4 0.6 0.8 1.0 True Positive Rate i a v g L o g : A U C = 0 . 8 2 i a v g N N 1 : A U C = 0 . 8 3 i a v g N N 2 : A U C = 0 . 8 3 i a v g S V M R B F : A U C = 0 . 8 2 i p L o g : A U C = 0 . 8 2 i p N N 1 : A U C = 0 . 7 9 i p N N 2 : A U C = 0 . 8 3 i p S V M R B F : A U C = 0 . 7 9 Fig. 2 . Receiv er operating characteristic (R OC) and area un- der curve (A UC) for various classification models using a 10:1 train:test split. on just 40 profiles. 10 1 10 2 10 3 10 4 Number of training profiles 0 . 4 0 . 5 0 . 6 0 . 7 0 . 8 0 . 9 1 . 0 T raining accuracy i a vg Log i a vg NN 2 i a vg SVM RBF Fig. 3 . Accuracy of the classification models e valuated on the training data (number of correctly classified training profiles / total number of training profiles) vs the number of training profiles. The validation accuracy can be misleading because there were significantly more disliked profiles than liked profiles. Thus it is important to consider the true positi ve and true neg- ativ e rates to asses the model quality . The like accuracy (or true positi ve rate) of the models is presented in Fig. 5 , and the dislike accuracy (or true negati ve rate) is presented in Fig. 6 . It can be noted that the neural netw orks had a like bias, while the SVM has a dislike bias. The dislik e bias resulted in a slightly higher v alidation accurac y since there were more pro- files disliked than lik ed. Again, after 20 profiles, a reasonable classification model can be constructed. The logistic regres- sion model trained on 20 profiles had a like accuracy of 0.7 and a dislike accuracy of 0.6. The results presented thus far could be the result of the random split. Another study is presented to better under- 10 1 10 2 10 3 10 4 Number of training profiles 0 . 3 0 . 4 0 . 5 0 . 6 0 . 7 V alidation accuracy i a vg Log i a vg NN 2 i a vg SVM RBF Fig. 4 . V alidation accuracy of classification models (number of correctly classified test profiles / total number of test pro- files) as a function of the number of training profiles. 10 1 10 2 10 3 10 4 Number of training profiles 0 . 6 0 . 7 0 . 8 0 . 9 Lik e accuracy (recall) i a vg Log i a vg NN 2 i a vg SVM RBF Fig. 5 . Like accuracy (true positive rate) of classification models as a function of the number of training profiles. 10 1 10 2 10 3 10 4 Number of training profiles 0 . 0 0 . 1 0 . 2 0 . 3 0 . 4 0 . 5 0 . 6 0 . 7 0 . 8 Dislik e accuracy (specificity) i a vg Log i a vg NN 2 i a vg SVM RBF Fig. 6 . Dislike accuracy (true neg ative rate) of classification models as a function of the number of training profiles. stand how the number of revie wed profiles may influence the personalized classification model. Random splits were per- formed 10,000 times for training sizes of 10, 20, 40, 81, and 406 profiles. The random split required at least one profile from each class (like and dislike) in order to construct a clas- sification model. A unique logistic regression model was fit for each split and validated on the remaining test data. Again, the training of 10 profiles was v alidated on 8,120 profiles, and so forth for the other training sizes. The resulting val- idation accuracies followed a ske w-normal distribution, and probability density functions (PDF) were calculated for each training size. The resulting PDFs are presented in Fig. 7 and compared to the PDF of a completely random classifier . The validation accuracy for a completely random classifier was simulated 10,000 times and followed a normal distrib ution. The results demonstrate that training on just 10 dating pro- files offers a significant adv antage ov er a random classifier . The variance associated with a model’ s validation accuracy is shown to reduce with the number of trained profiles. This reduction of variance is significant when going from training on 81 profiles to 406 profiles. 0 . 40 0 . 45 0 . 50 0 . 55 0 . 60 0 . 65 0 . 70 V alidation accuracy 0 10 20 30 40 50 60 70 PDF train: 10 profiles train: 20 profiles train: 40 profiles train: 81 profiles train: 406 profiles Random model Fig. 7 . Probability density functions (PDF) for validation accuracy of classifiers trained on either 10, 20, 40, 81, and 406 profiles. The PDF from a completely random classifier is shown as a baseline comparison. A Python script is included in the supplementary material to calculate the the results presented here for the logistic re- gression model using either i p or i avg as the input dimension. 5. CONCLUSION A method was presented to build personalized classification models for online dating profiles based on a user’ s historical preference. The method could be used to impro ve the user ex- perience of online dating by reducing the time required to fil- ter profiles. A custom data set was collected which revie wed ov er 8,000 T inder profiles. Profile images containing just one face were run through a FaceNet model to extract the unique features as embeddings. T wo different approaches were pre- sented to combine these features from f aces in a profile, to a unique vector representing the features of that profile. A classification model was then constructed either considering a 128 or 1280 input dimension. A simple logistic regression model was sho wn to find an accuracy greater than 60% after being trained on just 20 profiles. The classification methodol- ogy continuously improv es as more online dating profiles are revie wed. Additionally it was demonstrated that a classifica- tion model trained on just 10 profiles would, on av erage, ha ve a much higher validation accurac y than a random classifier . A Python command line application called tindetheus has been released to reproduce the methodology presented in this paper . The application has three major functions: 1) Build a data set as a user browses Tinder . 2) T rain a classification model to the data set. 3) Use the trained model to automati- cally like new Tinder profiles. Tindetheus is av ailable online at https://github.com/cjekel/tindetheus/ or https://pypi.python.org/pypi/tindetheus . Refer ences [1] G. T yson, V . C. Perta, H. Haddadi, and M. C. Seto, “A first look at user activity on tinder , ” in 2016 IEEE/ACM Interna- tional Confer ence on Advances in Social Networks Analysis and Mining (ASONAM) , aug 2016, pp. 461–466. [2] O. Abramova, A. Baumann, H. Krasnova, and P . Buxmann, “Gender dif ferences in online dating: What do we know so far? A systematic literature revie w , ” in Proceedings of the An- nual Hawaii International Confer ence on System Sciences , vol. 2016-March, jan 2016, pp. 3858–3867. [3] Y . Eisenthal, G. Dror, and E. Ruppin, “Facial attractiveness: Beauty and the machine, ” Neural Computation , vol. 18, no. 1, pp. 119–142, Jan 2006. [4] Y . Mu, “Computational facial attractiveness prediction by aesthetics-aware features, ” Neur ocomputing , v ol. 99, no. Sup- plement C, pp. 59 – 64, 2013. [Online]. A v ailable: http://www . sciencedirect.com/science/article/pii/S092523121200495X [5] M. Chua, Y . Akimoto, H. Aguirre, and K. T anaka, “ Asian fe- male face classification incorporating personal attractive pref- erence, ” in 2013 International Symposium on Intellig ent Signal Pr ocessing and Communication Systems , Nov 2013, pp. 413– 418. [6] D. Gray , K. Y u, W . Xu, and Y . Gong, Predicting F acial Beauty without Landmarks . Berlin, Heidelberg: Springer Berlin Heidelberg, 2010, pp. 434–447. [Online]. A vailable: https://doi.org/10.1007/978- 3- 642- 15567- 3 32 [7] R. Rothe, R. T imofte, and L. V . Gool, “Some like it hot!; vi- sual guidance for preference prediction, ” in 2016 IEEE Con- fer ence on Computer V ision and P attern Recognition (CVPR) , June 2016, pp. 5553–5561. [8] X. Zang, T . Y amasaki, K. Aizawa, T . Nakamoto, E. K uwabara, S. Egami, and Y . Fuchida, “Prediction of users’ facial attrac- tiv eness on an online dating website, ” in 2017 IEEE Interna- tional Confer ence on Multimedia Expo W orkshops (ICMEW) , jul 2017, pp. 255–260. [9] O. M. Parkhi, A. V edaldi, and A. Zisserman, “Deep Face Recognition, ” in British Machine V ision Confer ence , 2015. [10] G. B. Huang, M. Ramesh, T . Berg, and E. Learned-Miller , “La- beled faces in the wild: A database for studying face recog- nition in unconstrained en vironments, ” Uni versity of Mas- sachusetts, Amherst, T ech. Rep. 07-49, oct 2007. [11] F . Schroff, D. Kalenichenko, and J. Philbin, “FaceNet: A Uni- fied Embedding for Face Recognition and Clustering, ” in The IEEE Conference on Computer V ision and P attern Recognition (CVPR) , jun 2015. [12] Y . W en, K. Zhang, Z. Li, and Y . Qiao, “A Dis- criminativ e Feature Learning Approach for Deep Face Recognition, ” in Computer V ision – ECCV 2016: 14th Eur opean Confer ence, Amster dam, The Netherlands, October 11–14, 2016, Pr oceedings, P art VII , B. Leibe, J. Matas, N. Sebe, and M. W elling, Eds. Cham: Springer Interna- tional Publishing, 2016, pp. 499–515. [Online]. A vailable: https://doi.org/10.1007/978- 3- 319- 46478- 7 31 [13] B. Amos, B. Ludwiczuk, and M. Satyanarayanan, “OpenFace: A general-purpose face recognition library with mobile ap- plications, ” CMU-CS-16-118, CMU School of Computer Sci- ence, T ech. Rep., 2016. [14] Y . Guo, L. Zhang, Y . Hu, X. He, and J. Gao, “MS-Celeb-1M: A dataset and benchmark for large scale face recognition, ” in Eur opean Confer ence on Computer V ision . Springer, 2016. [15] C. Szegedy , S. Ioffe, V . V anhoucke, and A. Alemi, “Inception- v4, inception-resnet and the impact of residual connections on learning, ” in Pr oceedings of the Thirty-First AAAI Conference on Artificial Intelligence, F ebruary 4-9, 2017, San F rancisco, California, USA. , S. P . Singh and S. Marko vitch, Eds. AAAI Press, 2016, pp. 4278–4284. [Online]. A v ailable: http://arxiv .or g/abs/1602.07261 [16] K. Zhang, Z. Zhang, Z. Li, and Y . Qiao, “Joint Face Detection and Alignment Using Multitask Cascaded Con volutional Net- works, ” IEEE Signal Processing Letters , vol. 23, no. 10, pp. 1499–1503, oct 2016. [17] F . Pedregosa, G. V aroquaux, A. Gramfort, V . Michel, B. Thirion, O. Grisel, M. Blondel, P . Prettenhofer, R. W eiss, V . Dubourg, J. V anderplas, A. Passos, D. Cournapeau, M. Brucher, M. Perrot, and E. Duchesnay , “Scikit-learn: Ma- chine Learning in Python, ” Journal of Machine Learning Re- sear ch , vol. 12, pp. 2825–2830, 2011. [18] F . Chollet and Others, “Keras, ” https://github .com/fchollet/ keras , 2015. [19] M. Abadi and et al., “T ensorFlow: Large-scale ma- chine learning on heterogeneous systems, ” 2015, soft- ware a vailable from tensorflo w .org. [Online]. A vailable: https://www .tensorflow .org/
Original Paper
Loading high-quality paper...
Comments & Academic Discussion
Loading comments...
Leave a Comment