Automatic measurement of vowel duration via structured prediction
A key barrier to making phonetic studies scalable and replicable is the need to rely on subjective, manual annotation. To help meet this challenge, a machine learning algorithm was developed for automatic measurement of a widely used phonetic measure…
Authors: Yossi Adi, Joseph Keshet, Emily Cibelli
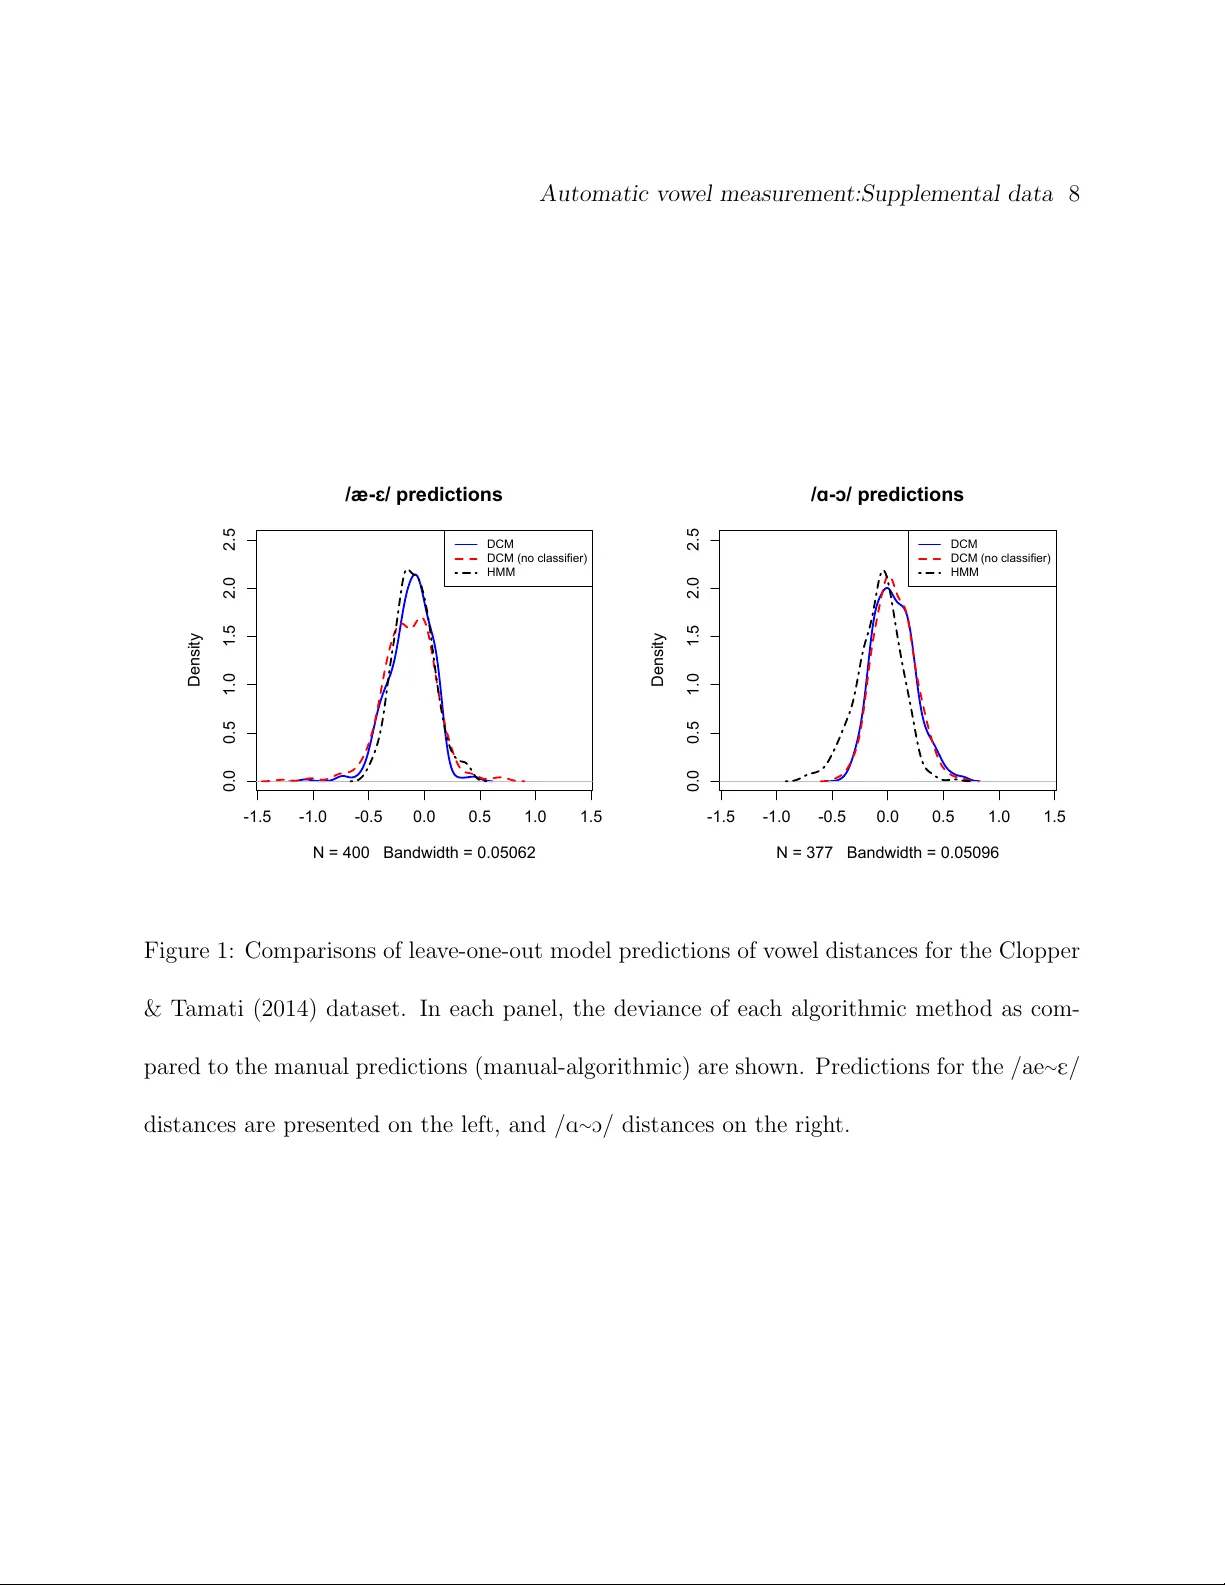
Automatic measuremen t of v o w el duration via structured prediction Y ossi Adi, Joseph Keshet Departmen t of Computer Science, Bar-Ilan Univ ersit y , Ramat-Gan, Israel, 52900 Emily Cib elli, Erin Gustafson Departmen t of Linguistics, North w estern Universit y , Ev anston, IL, 60208 Cyn thia Clopp er Departmen t of Linguistics, Ohio State Univ ersit y , Columbus, OH, 43210 Matthew Goldrick a) Departmen t of Linguistics, North w estern Universit y , Ev anston, IL, 60208 a) e-mail: matt-goldric k@northw estern.edu Abstract A k ey barrier to making phonetic studies scalable and replicable is the need to rely on sub- jectiv e, man ual annotation. T o help meet this challenge, a mac hine learning algorithm w as dev elop ed for automatic measurement of a widely used phonetic measure: v o wel duration. Man ually-annotated data were used to train a mo del that tak es as input an arbitrary length segmen t of the acoustic signal con taining a single vo w el that is preceded and follow ed b y consonan ts and outputs the duration of the vo w el. The mo del is based on the structured prediction framework. The input signal and a hypothesized set of a vo w el’s onset and offset are mapp ed to an abstract v ector space by a set of acoustic feature functions. The learning algorithm is trained in this space to minimize the difference in exp ectations betw een pre- dicted and man ually-measured vo w el durations. The trained mo del can then automatically estimate v o w el durations without phonetic or orthographic transcription. Results comparing the model to three sets of man ually annotated data suggest it out-p erformed the curren t gold standard for duration measuremen t, an HMM-based forced aligner (whic h requires ortho- graphic or phonetic transcription as an input). P A CS Num b ers: 43.70.Jt, 43.72.Ar, 43.72.Lc, 43.70.Fq Automatic measurement of vo w el duration 3 I INTR ODUCTION Understanding the factors that mo dulate v ow el duration has b een a long-standing fo cus of lab oratory research in acoustic phonetics (P eterson and Lehiste, 1960). The v ast ma jorit y of suc h research–from the mid-20th century to the start of the 21st–has relied on man ual annotation to determine v ow el duration. There are t w o k ey issues with such an approach. Giv en the labor intensiv e nature of suc h annotation, there are substantial limitations on the amoun t of data that can b e practically analyzed; this limits the statistical p o w er and types of issues that phonetic studies can address. F urthermore, giv en the fundamental reliance on sub jective annotator judgmen ts, analyses cannot b e directly replicated by other researc hers. An alternativ e to this approac h is to pursue algorithms for automatic alignmen t of v o w el b oundaries. The current standard approac h for v o w els is to utilize forced alignmen t algo- rithms (Y uan et al., 2013). Ho w ev er, this approac h suffers from tw o imp ortant limitations: it requires an orthographic transcription, and frequen tly requires substan tial prepro cessing of the data to insure adequate p erformance (Ev anini, 2009). In this paper w e prop ose a metho d for automatic measurement of the duration of single vo w els using structured prediction techniques whic h ha v e provided excellent results in analyzing other phonetic measures (Keshet et al., 2007; Sonderegger and Keshet, 2012). The algorithm was trained at the segmen t lev el on man ually annotated data to extract the vo w el Automatic measurement of vo w el duration 4 start and end times; this provides a straigh tforward w a y to compute the duration of the v o wel. F ollo wing the structure of the v ast ma jority of lab oratory studies of v o w el duration, w e assume the input signal contains a single vo w el, pro ceeded and follo wed by a consonant (CV C)–no additional detailed information about the phonetic transcription is required to pro cess the sp eech. This to ol will allow lab oratory studies to rapidly and reliably examine ho w the duration of vo w els in monosyllabic words v aries across participan ts and elicitation con texts. W e ev aluated our metho d on data from three phonetic studies: one fo cusing on vo w el duration (Heller and Goldric k, 2014), the second using v o w el segmentation to automatically determine p oints for forman t analysis (Clopp er and T amati, 2014), and the third a standard set of v o w el pro duction norms (Hillenbrand et al., 1995). W e compared results with our mo del to the state-of-the-art in vo w el duration measuremen t, HMM-based forced alignmen t (Rosenfelder et al., 2014). W e also assessed whether inferential statistical models fit to data from our mo del and HMM-based forced alignmen t replicated the patterns obtained from man ual data. The results suggest that our algorithm is sup erior to the curren t gold standard at matching the manual measuremen ts of vo w el duration, b oth in terms of deviation and in replicating inferential statistical results. The paper is organized as follo ws. In Section II w e state the problem definition for- mally . W e then presen t the learning framew ork (Section I I I), algorithm (Section IV), and the Automatic measurement of vo w el duration 5 acoustic features and feature functions (Section V). In Section VI we describ e the datasets w e use to train the mo dels and ev aluate the performance of the algorithm. In Section VI I w e detail the particular methods used to implemen t our algorithm here, along with the standard approac h to vo w el duration measuremen t. Exp erimental results are detailed in tw o sections: the first fo cusing on measurement deviation (Section VII I) and the second on the repro duc- tion of results from inferential statistical mo dels (Section IX). W e conclude the pap er with p ossible applications and extensions in Section X. I I PR OBLEM SETTING In the context of a typical lab oratory study of sp eech, the goal of automatic vo w el duration measuremen t is to accurately predict the time difference betw een the v o wel onset and offset, giv en a segmen t of the acoustic signal in which the v o w el is preceded b y a consonant and follo w ed by a consonant. The acoustic sample can b e of an y length, but should include only one vo w el. W e assume there is a small p ortion of silence before and after the uttered sp eec h, but do not require the b eginning of the sp eech signal or the vo w el onset to b e synchronized with the onset or offset of the acoustic sample. W e turn to describing the problem formally . Throughout the pap er w e write scalars using low er case Latin letters, e.g., x , and vectors using b old face letters, e.g., x . A sequence of elements is denoted with a bar ¯ x and its length is written as | ¯ x | . Similarly a sequence of Automatic measurement of vo w el duration 6 v ectors is denoted as ¯ x and its length by | ¯ x | . The acoustic sample is represen ted by a sequence of acoustic feature v ectors denoted b y ¯ x = ( x 1 , x 2 , ..., x T ), where each x t (1 ≤ t ≤ T ) is a d -dimensional vector that represents the acoustic con ten t of the t -th frame. The domain of the feature vectors is denoted as X ⊂ R d . The input acoustic sample can b e of an arbitrary length, thus T is not fixed. W e denote by X ∗ the set of all finite length segments of acoustic signal o v er X . In addition, w e denote b y t b ∈ T and t e ∈ T the vo w el onset and offset times in frame units, resp ectiv ely , where T = { 1 , ..., T } , and the total duration of the input acoustic sample is T frames. F or brevity w e denote this pair b y t = ( t b , t e ), and refer to it as an onset-offset p air . Practically there are constraints on t b and t e and they cannot tak e an y v alue in T , e.g., the v o w el onset t b cannot b e T or T − 1. Our notation is depicted in Figure 1. Our goal is to find a function f from the domain of segments of acoustic signal, X ∗ , to the domain of all onset-offset pairs, T 2 . Given a segmen t of the acoustic signal ¯ x , let ˆ t = f ( ¯ x ) b e the predicted onset-offset pair, where ˆ t = ( ˆ t b , ˆ t e ). The qualit y of the prediction i s assessed using a loss function , denote by γ ( t , ˆ t ), that measures the magnitude of the p enalt y when predicting the pair ˆ t rather than the target pair t . F ormally , γ : T 2 × T 2 → R + is a function that receives as input t w o ordered pairs, and returns a p ositive scalar. W e assume that if b oth the predicted and the target pairs are the same, then the loss is zero, γ ( t , t ) = 0. Automatic measurement of vo wel duration 7 t b t e x 1 x T Figure 1: An example of our notation. The top panel presen ts the signal in the time domain, and the middle panel presen ts the sp ectrogram of the signal. The vertical solid lines present the annotated v o wel’s onset t b and offset t e . The sp eech signal is represented b y a sequence of acoustic feature vectors as depicted in the lo wer panel. F or the t -th frame, the acoustic feature vector is denoted by x t . I I I LEARNING FRAMEW ORK W e assume that an input acoustic sample and a target onset-offset pair are drawn from a fixed but unkno wn distribution ρ o v er the domain of the segments of acoustic signal and the v o wel onset-offset pairs, X ∗ × T 2 . W e define the risk of f as the exp ected loss when using f to predict the onset-offset pair of the acoustic sample ¯ x , that is, R ( f ) = E ( ¯ x , t ) ∼ ρ [ γ ( t , f ( ¯ x ))] , (1) Automatic measurement of vo wel duration 8 where the exp ectation is taken with resp ect to the input acoustic sample ¯ x and the annotated onset-offset pair t drawn from ρ . Our goal is to find f that minimizes the risk. Unfortu- nately , this cannot b e done directly since ρ is unknown. Instead, w e use a training set of examples that served as a restricted window through whic h we can estimate the quality of the prediction function according to the distribution of unseen examples in the real world. The examples are assumed to be identically and indep endently distributed (i.i.d.) according to the distribution ρ . Eac h example in the training set is comp osed of a segmen t of the acoustic signal and a man ually annotated v o wel onset and offset pair. The manual annotations are not exact, and naturally dep end b oth on human errors as w ell as ob jective difficulties in placing the vo wel b oundaries, e.g., b et ween the vo wel and a sonorant. Hence in this w ork we fo cus on a loss function that inherently takes in to account the discrepancy in the annotations. That is, γ ( t , ˆ t ) = | ˆ t b − t b | − τ b + + | ˆ t e − t e | − τ e + , (2) where [ π ] + = max { 0 , π } , and τ b , τ e are pre-defined parameters. The ab o ve function measures the absolute differences b etw een the predicted and the target v o wel onsets and offsets. It allo ws a mistake of τ b and τ e frames at the onset and offset of the vo wel resp ectiv ely , and only p enalizes predictions that are greater than τ b or τ e frames. Our learning mo del b elongs to the structured prediction framew ork. In this framework it is assumed that the output prediction is complex and has some in ternal structure. In our Automatic measurement of vo wel duration 9 case, the v o wel onset and vo w el offset times are related and dep enden t, e.g., the v ow el has a t ypical duration that dep ends on the v o wel onset and offset. In the structured prediction mo del, the function f is based on a fixed mapping φ : X ∗ × T 2 → R n from the set of segments of acoustic signal and target onset-offset pairs to a real v ector of length n ; we call the elemen ts of this mapping fe atur e functions or fe atur e maps . Intuitiv ely , the feature functions represent our kno wledge regarding goo d lo cations of the onset or the offset of the vo wel within the acoustic signal. F or example, consider Figure 1. It can b e seen that the sp ectral c hange is high at the areas of t b and t e . Based on this, we can adopt a feature function based on the distance b etw een the sp ectrum a frame b efore and a frame after the presumed t b . This function is going to b e high if the presumed t b is in the vicinit y of the actual target vo w el onset and is going to b e lo w at a random place in the acoustic signal. Our prediction function is a linear deco der with a vector of parameters w ∈ R n that is defined as follows: f w ( ¯ x ) = arg max ˆ t ∈T 2 w > φ ( ¯ x , ˆ t ) . (3) The subscript w is added to the function f to stress that it dep ends on the w eigh t vector w . Ideally , w e w ould lik e our learning algorithm to find w suc h that the prediction min- imizes the loss on unseen data. Recall, we assume there exists some unknown probabilit y distribution ρ ov er pairs ( ¯ x , t ). W e would lik e to set w so as to minimize the exp ected loss, Automatic measurement of vo wel duration 10 or the risk , for predicting f w ( ¯ x ), w ∗ = arg min w E ( ¯ x , t ) ∼ ρ [ γ ( t , f w ( ¯ x ))] . (4) It is hard to directly minimize this ob jective function since ρ is unknown and the loss γ is often a combinatorial non-con v ex function (Keshet, 2014). In the next section we describ e the learning algorithm that aims at minimizing the risk, and then w e describ e the set of feature functions in Section V. IV DIRECT LOSS MINIMIZA TION (DLM) ALGORITHM Recall that our goal is to directly optimize the ob jective in Eq. (4). Unfortunately , if the output space is discrete w e can not use direct gradien t decen t since the loss γ ( t , f w ( ¯ x )) is not a differen tiable function of w (Keshet, 2014). McAllester et al. (2010) sho wed that if the input space X ∗ is con tinuous, w e can compute the gradient of the exp ected loss, i.e., the risk, in Eq. (4) ev en when the output space is discrete in terms of the feature functions. Sp ecifically the gradien t can b e expressed in a closed form solution as follows: ∇ w E h γ ( t , f w ( ¯ x ) i = lim → 0 E h φ ( ¯ x , f w ( ¯ x )) − φ ( ¯ x , f w ( ¯ x )) i , (5) where the exp ectation on b oth sides is with resp ect to the tuple ( ¯ x , t ) dra wn from ρ , and f w is defined as follows: f w ( ¯ x ) = arg max ˆ t ∈T 2 w > φ ( ¯ x , ˆ t ) + γ ( t , ˆ t ) . (6) Automatic measurement of vo wel duration 11 Using sto c hastic gradien t decen t we get the follo wing up date rule: w t +1 = w t + η t ( φ ( ¯ x , f w ( ¯ x )) − φ ( ¯ x , f w ( ¯ x ))) , (7) where η t is the learning rate. At training time, we set η t = η 0 / √ t , where η 0 is a parameter and t is the iteration num b er, and we set as a fixed small parameter, whic h is selected from a held-out dev elopmen t set. The actual v alues of the parameters are detailed in Section VII I. Since the ob jective in Eq. (5) is not a con vex function in the mo del parameters w , gradien t descen t is not guaran teed to find the optimal parameter settings; it ma y con v erge to a lo cal minimum. W e initialize the mo del parameters with a weigh t v ector of parameters that w as pre-trained using the structured prediction passiv e-aggressive (P A) algorithm (Crammer et al., 2006). The v ector of parameters that was obtained from the P A training is denoted b y w P A . A pseudo co de of the training algorithm is given in Figure 2. V FEA TURES AND FEA TURE FUNCTIONS In this section w e describe the acoustic features x ∈ X and the feature functions φ ( ¯ x , t ), whic h w ere designed sp ecifically for the problem of v ow el duration measurement. These features are primarily motiv ated b y the desire to reflect the workflo w of the annotators (Pe- terson and Lehiste, 1960). F or example, in P eterson and Lehiste (1960) the b eginning of the final voiced plosiv es w as determined b y comparing narrow-band and broad-band sp ectro- grams and lo ok for the moment in time when the energy in the higher harmonics is greatly Automatic measurement of vo wel duration 12 Input: training set S = { ( ¯ x i , t i ) } m i =1 ; parameters η 0 , Initializa tion: w 1 = w P A F or t = 1 , 2 , . . . , T Pic k example ( ¯ x i , t i ) from S uniformly at random Predict ˆ t = arg max ˆ t w > t φ ( ¯ x i , ˆ t ) Predict ˆ t = arg max ˆ t w > t φ ( ¯ x i , ˆ t ) + γ ( t i , ˆ t ) Set w t +1 = w t + η 0 √ t ( φ ( ¯ x i , ˆ t ) − φ ( ¯ x j , ˆ t ) Output: the av erage weigh t vector w ∗ = 1 T P t w t Figure 2: Direct loss minimization training pro cedure. diminished. In a similar fashion, we hav e acoustic features of narro w-band and broad-band energies, and a set of feature functions that allo w the mac hine learning algorithm to compare and weigh t them, resp ectively . Moreo v er, after an empirical ev aluation of the p erformance, and analyzing the source of v arious errors, w e added features whic h related to the predictions of the phoneme classifiers (e.g., vo wel, nasal, etc.). Automatic measurement of vo wel duration 13 A Acoustic F eatures The main function of the acoustic features representation is to preserve the crucial information- b earing elemen ts of the speech signal and to suppress irrelev an t details. W e extracted d = 16 acoustic features every 5 ms, in a similar wa y to the feature set used in Sonderegger and Keshet (2012), but with differen t time spans. The first 5 features are based on the short-time F ourier transform (STFT) tak en with a 25 ms Hamming windo w. The features are short-term energy , E short-term ; the log of the total sp ectral energy , E total ; the log of the energy b et ween 20 and 300 Hz, E low ; the log of the energy ab o v e 3000 Hz, E high ; and the Wiener en tropy , H wiener , a measure of sp ectral flatness (Sonderegger and Keshet, 2012). The sixth feature, S max , is the maxim um of the p o w er sp ectrum calculated in a region from 6 ms b efore to 18 ms after the frame center. The sev enth feature, ˆ F 0 , is the normalized fundamental frequency estimator, extracted using the algorithm of Sha et al. (2004) ev ery 5 ms, and smo othed with a Hamming window. The eighth feature is the binary output of a v oicing detector based on the RAPT pitch track er (T alkin, 1995), smo othed with a Hamming window - denoted as V RAPT . The ninth feature is the num b er of zero crossings in a 5 ms window — denoted as N ZC . The next set of acoustic features are based on a pre-trained phoneme classifier’s predic- tions and scores as in Dekel et al. (2004). This phoneme classifier was trained on the TIMIT Automatic measurement of vo wel duration 14 dataset (Garofolo et al., 1993), using the standard MF CC features with a passiv e aggressiv e classifier (Crammer et al., 2006). The ten th acoustic feature is an estimated probability of whether a v ow el is uttered at the input frame. The feature is a smo othed v ersion of an indicator function that states if the phoneme predicted b y the classifier at the current frame is a v o w el: 1 [ ˆ y t ∈ vo w els ], where ˆ y t is the phoneme predicted by the phoneme classifier at time t and vo w els is the set of all vo wels. The eleven th feature is defined to b e the same as the tenth feature, but is for nasal phonemes. These features are denoted as G vo wel and G nasal , resp ectiv ely . The t welfth feature is the lik eliho o d of a v o wel at the curren t time frame, L vo wel . The lik eliho o d is computed as the Gibbs measure of the phoneme classifier’s scores for all the vo wel phonemes normalized by the total score for all phonemes. The last four features are based on the sp ectral c hanges b et w een adjacen t frames, using Mel-frequency cepstral coefficients (MFCCs) to represen t the sp ectral prop erties of the frames. Define by D j = d ( a t − j , a t + j ) the Euclidean distance betw een the MF CC feature v ectors a t − j and a t + j , where a t ∈ R 39 for 1 ≤ t ≤ T . The features are denoted by D j , for j ∈ { 1 , 2 , 3 , 4 } . Figure 3 sho ws the tra jectories of the features for a typical v ow el in a CVC con text (the w ord “got”). Automatic measurement of vo wel duration 15 Figure 3: V alues of acoustic features for an example acoustic sample (the word “got”). The v ertical dashed lines indicate the annotated onset and offset of the vo wel (color online). Automatic measurement of vo wel duration 16 B F eature F unctions W e turn no w to describe the feature functions. Recall that the feature functions are designed to b e correlated with a go o d positioning of the onset-offset pair, t , in the acoustic signal, ¯ x . While generally each feature function φ i ( ¯ x , t ), for 1 ≤ i ≤ n , gets as input a sequence of acoustic features, ¯ x , and a presumed onset-offset pair t , they can practically use only a subset of the acoustic features (e.g., only a sequence ov er the sixth feature, as opp osed to a sequence ov er any features). Some of the feature functions are based on the av erage of an acoustic feature x from frame t 1 to frame t 2 defined as µ ( ¯ x, t 1 , t 2 ) = 1 t 2 − t 1 + 1 t 2 X t = t 1 x t . (8) The functions that we iden tified as being correlated with a goo d positioning of the onset- offset pair can b e divided into four groups based on the structure of the functions; eac h group w as implemen ted o v er a set of the ab ov e acoustic features (n.b.: a given acoustic feature migh t b e asso ciated with m ultiple feature functions): T yp e 1: This t yp e of feature function gets as input a sequence of one of the features, ¯ x , and a time t . The time t can represent the onset or the offset of the vo wel. F ormally , the features of this type are of the form φ ( ¯ x, t ) = x t (9) Automatic measurement of vo wel duration 17 F eature functions from this t yp e are computed for the acoustic features E total , E low , E high , and S max at the presumed vo wel onset time t b . It is also computed for the acoustic feature D j , j = 1 , 2 , 3 , 4 for b oth v ow el onset t b and offset times t e . It can b e seen from Figure 3 that these acoustic features hav e a high v alue exactly at t b or t e or b oth, resp ectiv ely . T yp e 2: The second set of feature functions is a coarse estimation of the deriv ative around a time frame of interest. Giv en a sequence of acoustic feature v alues ¯ x and a sp ecific time frame t , the feature functions of this type compute the difference in the mean of ∆ frames b efore t and the mean of ∆ frames after t . That is φ ( ¯ x, t, ∆) = µ ( ¯ x, t − ∆ , t − 1) − µ ( ¯ x, t, t + ∆ − 1) . (10) T able 1 describes all the feature functions of this t yp e, for the v alues of the n um b er of frames pro cessed, ∆, and the acoustic features. F or some acoustic features we w an ted to take into accoun t the p ossibility that they might not b e coincident with v ow el b oundary , but o ccur at an adjacent p oin t in the acoustic signal. W e did that by considering the p oin t of interest to b e an offset version of the presumed onset or offset. F or example, t b − 2 means the feature computes av erages b efore and after the time frame t b with an offset of 2 frames. It can b e seen from Figure 3 that indeed the acoustic features describ ed in T able 1 ha v e abrupt c hanges at the sp ecified time frame t . T yp e 3: The third type of feature function is an extension of the second t yp e. Rather than Automatic measurement of vo wel duration 18 T able 1: The feature functions of Type 2, φ ( ¯ x, t 1 , ∆). V alues in the tables are the time frame t 1 used for eac h acoustic feature (columns) and for eac h window length (ro ws). Windo w lengths 8 and 10 are rep eated to indicate cases where the p oint of interest is offset (see text for details). ∆ E short-term E low E high E total H wiener S max ˆ F 0 V RAPT N ZC G vo wel G nasal L vo wel D 1 D 2 D 3 D 4 1 t b 2 t b 3 t b , t e t b t b , t e t b , t e t b , t e t b , t e 4 t b , t e t b 5 t b t b 6 t b t b , t e t b , t e 8 t b , t e t b , t e t b , t e t b , t e t b , t e t b , t e t b , t e t b , t e t e t b , t e 8 t b − 2 t b − 2 t b − 2 10 t b , t e t b , t e t b , t e t b , t e t b , t e t b , t e t b , t e t b , t e t e t b , t e t b , t e t b , t e t b , t e t b , t e 10 t b − 4 t b − 4 t b − 4 Automatic measurement of vo wel duration 19 considering the av erage of an acoustic feature b efore and after a single time frame, w e refer to the av erage b et w een the presumed onset and offset times. F eature functions of this type return t w o v alues: (i) the av erage b et ween the presumed onset and offset times min us the a v erage of ∆ frames b efore t b ; and (ii) the a v erage b et ween the presumed onset and offset times min us the a v erage of ∆ frames after the offset time t e . Those t w o v alues corresp ond to tw o elements in the vector φ ( ¯ x, t b , t e , ∆) = µ ( x , t b , t e ) − µ ( x , t b − ∆ , t b − 1) µ ( x , t b , t e ) − µ ( x , t e + 1 , t e + ∆) . (11) This type of feature function is computed for the acoustic features E short-term , E low , E high , E total , V RAPT , N ZC , and L vo wel . Again, it can b e see from Figure 3 that these features ha v e high (or low) mean v alues b etw een the time frames of in terest. T yp e 4: The fourth type of feature function is oblivious to the acoustic signal and returns a probabilit y score for the presumed vo wel duration, t e − t b . W e ha v e tw o feature functions of this type. The first one is based on the Normal distribution with parameters ˆ µ , ˆ σ 2 that are estimated from the training data: φ ( t b , t e ) = N ( t e − t b ; ˆ µ, ˆ σ 2 ) . (12) Similarly , the second feature function of this form is based on the Gamma distribution with parameters ˆ k and ˆ θ , that are estimated from the training set: φ ( t b , t e ) = Γ( t e − t b ; ˆ k , ˆ θ ) . (13) Automatic measurement of vo wel duration 20 While the Gamma distribution is an appropriate distribution to describ e the v ow el duration alone, we found empirically that adding the Normal distribution improv es p erformance. VI D A T ASETS In order to get reliable results we used three different datasets to ev aluate the p erformance of our system. In this section we will giv e a short description of eac h dataset. A Heller and Goldric k, 2014 (HG) This corpus (Heller and Goldrick, 2014) is drawn from a study in v estigating how grammat- ical class constrain ts influence the activ ation of phonological neigh b ors. The influence of neigh b ors on phonetic pro cessing was indexed b y vo wel durations. It contains segments of acoustic signal from 64 nativ e English sp eak ers (55 female) aged 18-34 with no history of sp eec h or language deficits. P articipants w ere first familiarized to a set of pictures along with their intended lab els. They were then asked to name aloud the noun depicted b y a picture in tw o con texts: when the picture w as presented alone, and when the picture o ccurred at the end of a non-predictive sentence. Participan ts were instructed to pro duce the name as quic kly and accurately as p ossible. T rials with errors or disfluencies w ere excluded, along with tw o items with high error rates. In addition, data from three sub jects rep orted in the original pap er were excluded from the presen t analysis, as they did not consen t to public use Automatic measurement of vo wel duration 21 of their data. The remaining 2395 recorded segmen ts of acoustic signal con tain one English CV C noun with v o wels /i, E , ae , A , o U , u/. B Clopp er and T amati, 2014 (CT) The second dataset (Clopp er and T amati, 2014) con tains segmen ts of acoustic signal from 20 female nativ e English sp eakers aged 18-22 with no history of sp eec h or language deficits. The participan ts were ev enly split b etw een t wo American English dialects (Northern and Midland). As part of a larger study (Clopp er et al., 2002), participants read aloud a list of 991 CV C words. This study fo cused on 39 target w ords (777 tokens) which did or did not ha v e a lexical contrast b etw een either / E / vs. / ae / (e.g., dead-dad vs. deaf-*daff ) or / A / vs. / O / (e.g., cot-caught vs. dock-*da wk). W ords with a lexical contrast are referred to as c omp etitor items and those without are referred to as no c omp etitor items. C Hillen brand, Gett y , Clark, and Wheeler, 1995 (HGCW) The third dataset consists of data from a lab oratory study conducted by Hillenbrand et al. (1995). It contains segmen ts of acoustic signal from 45 men, 48 w omen, and 46 ten-to 12- y ear-old children (27 b oys and 19 girls). 87% of the participants w ere raised in Michigan, primarily in the southeastern and southw estern parts of the state. The audio recordings con tain 12 different vo wels (/ i, I, E, ae, A, O, U, u, 2, 3~, e, o /) from the w ords: heed, hid, Automatic measurement of vo wel duration 22 head, had, ho d, haw ed, ho o d, who’d, hud, heard, hay ed, ho ed. VI I METHODS Co de implementing this algorithm is publicly a v ailable at https://github.com/adiyoss/ AutoVowelDuration . Segments of acoustic signal for the HG dataset along with algorithmic and manual annotations, are av ailable in the Online Sp eec h/Corp ora Arc hiv e and Analysis Resource ( https://oscaar.ci.northwestern.edu/ ; dataset ‘Within Category Neigh b or- ho o d Densit y’). F or the HGCW dataset, segmen ts of acoustic signal and man ual annotations are av ailable at: http://homepages.wmich.edu/ ~ hillenbr/voweldata.html . A DLM The direct loss minimization (DLM) algorithm describ ed ab o v e w as trained and tested on b oth HG and CT datasets. F or the CT corpus, the training set w as a set of 4049 tokens from the original corpus (Clopp er et al., 2002), and the test set w as the same 777 tokens rep orted in Clopp er and T amati (2014). The mo del parameters w ere tuned on a dedicated dev elopmen t set ( ∼ 10% of the training set). The parameters that yielded the low est error rate w ere η = 0 . 1 and = − 1 . 36. W e used τ b = 1 frame and τ e = 2 frames for the loss during training. The initial weigh t vector was set to b e the av eraged weigh t vector from the P assiv e-Aggressive (P A) algorithm (Crammer et al., 2006) with C = 0 . 5 and 100 epo chs. Automatic measurement of vo wel duration 23 When trained and tested on the HG corpus, we used 10-fold cross v alidation (the rep orted results are the av erage error ov er all 10 folds) with the same settings and parameters as describ ed ab o v e. In order to better comprehend the influence of the phoneme classifier, the only language dep enden t feature in our system, w e also trained and tested the direct loss algorithm without the acoustic features related to the phoneme classifier G vo wel , G nasal , or L vo wel , and their corresp onding feature functions. In the case when the phoneme classifier w as used, w e trained multiclass P A as describ ed in (Dekel et al., 2004) on the TIMIT corpus of read sp eec h. B HMM T o v alidate the effectiv eness of the prop osed approac h, w e compared it to the most common approac h curren tly used in automatic phonetic measuremen t of speech: forced alignmen t. This is an algorithm whic h, given a speech utterance and its phonetic con tent, finds the start time of eac h phoneme in the sp eech utterance. Often the orthographic conten t of the sp eec h utterance is giv en, and it is con verted to its phonetic con tent using a lexicon. This procedure ma y not b e accurate as often the surface pron unciation uttered in sp ontaneous sp eech is not the same as the canonical pronunciation that app ears in the lexicon. Con v entionally , the forced alignmen t is implemen ted b y forcing the deco der of an HMM Automatic measurement of vo wel duration 24 phoneme recognizer to pass through the states corresponding to the giv en phoneme sequence. So far, automatic vo w el extraction has b een done using suc h forced alignment pro cedures (Reddy and Stanford, 2015). While there are sev eral op en source implementations of HMMs, all the publicly av ailable forced aligner pac k ages (Goldman, 2011; Gorman et al., 2011; Rosenfelder et al., 2014; Y uan and Lib erman, 2008) are based on the HTK to olkit (Y oung and Y oung, 1994). Since this is the case, w e chose to compare our results with the most recen t one, namely the F A VE aligner (Rosenfelder et al., 2014), based on the Penn Phonetics L ab F or c e d Aligner (P2F A) (Y uan and Lib erman, 2008). In our analyses b elo w, we refer to this system as the HMM aligner. Note that in con trast to the DLM the forced aligner requires a phonetic or orthographic transcription as input. Since neither CT nor HG hav e enough data to train an HMM forced alignment system, in this work w e use a pre-trained mo del which was trained on differen t corpus (see details in Rosenfelder et al. (2014)). In order to make a fair comparison b et ween the prop osed mo del and the HMM system, w e ev aluate the mo dels on tw o different settings: (i) a dataset whic h w as not used during training an y of the mo dels (HGCW), and (ii) on mismatched training and test datasets. More details ab out the exp erimen ts can b e found later in the experimental results. Automatic measurement of vo wel duration 25 VI I I RESUL TS: MEASUREMENT DEVIA TION W e first examine results on the HG and CT datasets when the DLM is algorithm is trained and tested on the same corpus. The difference b etw een the automatic and man ual mea- suremen ts of vo wel duration are given in T able 2, where the ev aluation metric is the loss in Eq. (2) with both τ b and τ e equal to 0, and in T able 3, where the error is given in terms of the p ercen tage of predictions that do not fall within the b oundaries of 20 ms from the man ual onset and 50 ms from the man ual offset. (W e allow for greater deviations in vo wel offset, where manual annotators often show greater disagreemen t.) These rev eal that when trained and tested on the same corpus, the DLM generally out-p erforms the standard HMM approac h, particularly when the phoneme classifier is incorp orated into the algorithm. An exception is seen in the HG offset data, where the p ercentage of predictions outside of 50 ms is smallest for the HMM. It is p ossible that the accuracy of the algorithms ma y differ by consonantal context. T o assess this, we classified the consonan t preceding or follo wing the v o wel of eac h w ord as b elonging to one of four categories: voiceless stops, v oiced stops, fricatives/affricates, and sonoran ts. W e then calculated the ov erall measuremen t error for each algorithm within eac h category , as rep orted in table 4. The con text-sp ecific HG data sho ws that the general adv antage for the DLM with the Automatic measurement of vo wel duration 26 DLM DLM (no classifier) HMM onset offset onset offset onset offset HG 5.21 22.80 5.84 28.98 16.67 24.72 CT 9.42 16.76 9.24 23.18 35.90 30.61 T able 2: R esults of DLM (with and without phoneme classifier, tr aine d and teste d on the same c orpus) and HMM r elative to manual annotation. Aver age deviation of onset and offset [in mse c]. Bold indic ates minimum deviation for e ach dataset within e ach c ontext. phoneme classifier holds, but there are some exceptions. The p erformance of the HMM is comparable to the DLM with classifier when a v ow el is follo w ed by a v oiceless stop, and app ears to outp erform the DLM when v oiceless stops or fricatives precede the vo wel. In the CT data, there is a clear DLM adv antage across all con texts. A Mismatc hed training and test datasets The comparison ab ov e may b e biased in fav or of the DLM, as the algorithm’s parameters ma y b e tuned to specific features of the annotators that work ed with the HG and CT corp ora. T o pro vide a more ev en comparison, the DLM was trained and tested on different corp ora– training on HG and testing on CT and vice versa. W e also presen t the result of our algorithm trained on CT (the manual dataset with the highest man ual inter-annotator reliabilit y; see Automatic measurement of vo wel duration 27 DLM DLM (no classifier) HMM onset offset onset offset onset offset HG 6.15% 13.15% 8.05% 18.44% 31.90% 10.94% CT 9.46% 8.31% 9.59% 9.34% 41.50% 13.14% T able 3: The p er c entage of pr e dictions that do not fal l within the b oundaries of 20 ms at the onset and 50 ms at the offset fr om the manual annotation when the DLM is tr aine d and teste d on the same c orpus. Bold indic ates minimum deviation for e ach dataset within e ach c ontext. b elo w) and tested on the third dataset, HGCW. As b efore, the difference b etw een the automatic and man ual measurements of v ow el duration are giv en in T able 5, and the error in terms of the p ercen tage of predictions that do not fall within the b oundaries of 20 ms from the manual onset and 50 ms from the man ual offset is given in T able 6. These results again show that for the onset data, the DLM out-p erforms the HMM, even when the training and testing sets for the algorithm are mismatc hed. In vo wel offsets, the HMM meets or outp erforms the DLM for the HG and CT data, but the DLM adv antage is maintained for the HGCW offset data. Automatic measurement of vo wel duration 28 DLM DLM (no classifier) HMM Onset HG CT HG CT HG CT V oic eless stops 25.67 17.07 30.65 16.96 21.95 97.45 V oic e d stops 27.81 18.62 31.23 20.27 31.66 53.90 F ric atives/affric ates 25.03 16.74 32.40 16.28 18.01 32.86 Sonor ants 24.12 26.97 36.32 27.95 42.35 40.52 DLM DLM (no classifier) HMM Co da HG CT HG CT HG CT V oic eless stops 25.72 18.06 28.76 17.78 25.91 43.22 V oic e d stops 16.16 23.08 20.10 27.22 19.04 45.19 F ric atives/affric ates 15.00 20.42 27.25 20.41 27.92 1 72.82 Sonor ants 32.51 - 39.04 - 35.36 - T able 4: R esults of DLM (with and without phoneme classifier, tr aine d and teste d on the same c orpus) and HMM r elative to manual annotation, br oken down by c onsonant c ontext. Onset c onsonant c ontext is shown in the first, fol lowe d by c o da c onsonant c ontext. Aver age deviation of ful l vowel dur ation [in mse c]. F ric atives ar e al l voic eless, with the exc eption of [d Z ] in CT c o da c onsonants. Ther e wer e no sonor ants in CT c o das. Bold indic ates minimum deviation within e ach c ontext for e ach dataset. Automatic measurement of vo wel duration 29 DLM DLM (no classifier) HMM onset offset onset offset onset offset HG ( CT mo del) 14.44 38.66 14.92 43.95 16.67 24.72 CT ( HG mo del) 9.84 30.85 10.17 29.94 35.90 30.61 HGCW ( CT mo del) 12.91 9.28 15.86 23.89 19.95 27.30 T able 5: R esults of DLM (with and without phoneme classifier) and HMM under mismatche d tr aining and test datasets. Aver age deviation of onset and offset [in mse c]. Bold indic ates minimum deviation for e ach dataset within e ach c ontext. B Measuremen t Correlation Ab o v e, w e examined the degree to whic h eac h algorithm agreed with man ual annotators based on the amoun t of deviation betw een measures. Another measure of agreemen t con- v en tionally rep orted in phonetic studies is the correlation betw een measuremen ts of v o wel durations. This is t ypically done by assigning a random subset of the data to a second an- notator. F or the HG dataset, the second annotator’s correlation with the original annotator w as r(627) = 0.84. W e p erformed a similar analysis, treating the algorithm as a second anno- tator relative to the man ual lab els. F or the same subset of the data (with the DLM trained and tested on the same corpus), the correlations b etw een eac h algorithm and the original man ual annotator are DLM=0.79, DLM (no classifier)=0.64, and HMM=0.73. While using Automatic measurement of vo wel duration 30 DLM DLM (no classifier) HMM onset offset onset offset onset offset HG ( CT mo del) 11.55% 23.99% 12.25% 28.80% 31.90% 10.94% CT ( HG mo del) 8.36% 14.92% 8.36% 10.94% 41.50% 13.14% HGCW ( CT mo del) 19.18% 2.16% 27.58% 6.54% 28.54% 11.69% T able 6: The p er c entage of pr e dictions that do not fal l within the b oundaries of 20 ms at the onset and 50 ms at the offset fr om the manual annotation (with mismatche d tr aining and test datasets for the DLM). Bold indic ates minimum deviation for e ach dataset within e ach c ontext. the mo dels that w ere trained on mismatched data the correlations are DLM=0.67, DLM (no classifier)=0.55. Similarly , for the CT dataset, the second annotator’s correlation with the original annotator was r(398) = 0.95. F or the same subset of the data, eac h algorithm’s cor- relations are: DLM=0.93, DLM (no classifier)=0.93, and HMM=0.57. How ever, when using the mo dels that w ere trained on mismatched data the correlations are DLM=0.54, DLM (no classifier)=0.53. Th us, when training the mo dels on mismatched datasets, correlations of the HMM mo del and DLM mo del with human annotators are equiv alen t; the DLM only outp erforms HMM when using the same training and testing set. Automatic measurement of vo wel duration 31 C Discussion Analysis of measuremen t deviation suggests our mo del generally outp erforms the HMM- forced alignment algorithm, ev en when training and testing sets are mismatched. Incorp o- rating the phoneme classifier imp rov ed performance, but ev en without the classifier the DLM t ypically outp erforms the HMM. How ever, with resp ect to measurement correlation, there w as no clear adv an tage; DLM and HMM exhibited equiv alen t p erformance when trained on mismatc hed training and test sets. IX RESUL TS: REPRODUCING REGRESSION MODEL FINDINGS Empirical studies of speech and language pro cessing use acoustic prop erties such as v ow el duration as b eha vioral measures of the effects of v arious t yp es of v ariables that influence sp eec h and language. Canonical examples of v ariables of study include the phonetic context of vo w els (e.g. preceding voiced vs. voiceless stops), properties of sp eak ers who pro duce those v o wels (e.g. nativ e vs. non-nativ e sp eakers) and the linguistic (lexical, syn tactic, etc.) con text in whic h the v o wels app ear (e.g. predictable vs. unpredictable). The effects of these v ariables on acoustic prop erties are typically examined using inferential statistical mo dels. The second ev aluation metric of our algorithms therefore examined the similarit y of inferen tial statistical mo del fits based on measuremen ts generated b y algorithms vs. manual Automatic measurement of vo wel duration 32 measuremen ts. Out of the three datasets, only HG constructed mo dels based on duration data; our analysis therefore fo cused on this dataset. (In supplemen tal materials, w e examined the CT dataset, pro viding the vo wel duration measurements of our algorithm as w ell as the HMM as inputs to a formant estimator.) Heller and Goldric k (2014) examined whether pro cesses in v olved in sentence planning influence the pro cessing of sound. Sp eakers named pictures in a con text that strongly em- phasized sentence planning (following a sen tence fragmen t) as well as a context that did not require substantial planning (pro ducing the picture name in isolation). The order of these con texts w as counterbalanced across sp eakers. T o index effects of sound structure pro cess- ing, this study also manipulated the num b er of words phonologically similar to the target that share its grammatical category (category-sp ecific lexical density). T o analyze the effect of this v ariables, HG used linear mixed effects regression mo dels (Baa y en et al., 2008), an approac h that has b ecome dominant in the analysis of sp eec h and psyc holinguistic data. These regression mo dels predict dep endent measures based on a linear combination of predictors, including b oth fixed and randomly distributed predictors capturing v ariation in effects b y b oth participan ts and items. This allows researchers to examine the effects of in terest while controlling for other prop erties of the w ords and sp eakers. Analysis of the full data set show ed that lexical densit y and v ow el category had no effect on vo wel durations (Heller and Goldrick, 2014, 2015); how ever, these effects were not Automatic measurement of vo wel duration 33 stable when the subset of data used here w as examined. Therefore, the mo dels used here w ere simplified from those rep orted in the original pap er, including tw o contrast-coded fixed effect factors: pro duction con text (isolation vs. sentence) and blo c k (first vs. second). T o con trol for con tributions from the random sample of participan ts and items used in this exp erimen t (compared to all English sp eakers and all w ords of English), w e included t wo sets of random effects. Random intercepts for b oth sp eakers and w ords w ere included, along with uncorrelated slop es for context by b oth sp eaker and w ord. A Significance of fixed effects in mo dels of the HG dataset W e first examine the primary interest of man y phonetic studies–the binary distinction b e- t w een significan t vs. insignifican t effects of fixed-effect predictors (e.g., the effect of ex- p erimen tal condition). T o con trol for sk ew, v o wel durations w ere log-transformed prior to analysis. Given that outliers can hav e an outsized influence on parameter estimates, all regressions mo dels w ere refit after excluding observ ations with standardized residuals ex- ceeding 2.5 (Baay en, 2008). The significance of fixed-effects predictors w as assessed by using the lik eliho o d ratio test to compare mo dels with and without the predictor of in terest (Barr et al., 2013). T able 7 compares the estimates for the tw o fixed effects parameters for the man ual mo del and eac h algorithmic mo del. Although there was some v ariation in the mo del estimates of the fixed effects for each algorithm compared to the manual annotations, eac h Automatic measurement of vo wel duration 34 Con text t Blo c k t Man ual -0.057 (0.017) -3.29 0.012 (0.016) 0.72 DLM -0.072 (0.019) -3.82 0.016 (0.018) 0.91 DLM (no classifier) -0.059 (0.018) -3.34 0.015 (0.017) 0.90 HMM -0.058 (0.018) -3.13 0.008 (0.014) 0.55 T able 7: Estimates and t -v alues for fixed effects in regression mo del, Heller & Goldric k dataset (standard error of estimate in paren theses). Significan t effects ( p < = 0.05, as assessed b y lik eliho o d ratio tests) are b olded. algorithm recov ered the ov erall pattern of a significant effect of con text but not blo ck. A.1 Comparison of predictions of mo dels of the HG dataset An alternative, more global, assessmen t of mo del similarity is to compare model predictions. This w as assessed b y lea v e-one-out v alidation. F or eac h observ ation, we excluded it from the dataset and re-fit the regression to the remaining observ ations. After residual-based outlier trimming (and re-fitting), w e examined the predictions of this re-fitted model for the excluded observ ation. Figure 4 shows distributions of the deviation of eac h algorithm’s predicted fit to the predicted mo del fit to the manual data. Automatic measurement of vo wel duration 35 −0.5 0.0 0.5 0 1 2 3 4 5 6 N = 2395 Bandwidth = 0.01303 Density DLM DLM (no classifier) HMM Figure 4: Comparisons of leav e-one-out mo del predictions of vo wel durations for the Heller & Goldric k (2014) dataset. Deviance of eac h algorithmic metho d as compared to the man ual predictions (manual-algorithmic) are plotted as individual lines. The DLM algorithm out-p erformed the other algorithms. The mean squared error rel- ativ e to the predictions of the mo del fit to the man ually annotated data w as low est for the DLM algorithm (0.479 msec 2 ), higher for HMM (0.835 msec 2 ), and larger still for DLM (no classifier) (0.935 msec 2 ). Bo otstrap confidence interv als of the differences across algorithms sho w ed that DLM outp erformed the other t wo algor ithms (95% CI of differences from HMM: [0.00039, 0.00043] msec 2 ; DLM (no classifier): [0.00037, 0.00055] msec 2 ). The HMM algo- Automatic measurement of vo wel duration 36 rithm did not significan tly differ from DLM (no classifier) (95% CI [-0.000200, 0.000002] msec 2 ). P arallel to the analysis of measurement deviation, these analyses suggest our model outp erforms the HMM-forced aligner. Incorp orating the phoneme classifier improv ed p er- formance, but ev en without the classifier the p erformance of the DLM meets or exceeds that of the HMM. X GENERAL DISCUSSION W e presen ted an algorithm for automatically estimating the durations of v o wels based on the structured prediction framework, relying on a set of acoustic features and feature functions finely tuned to reflect the prop erties of vo wel acoustics relev ant to vo wel segmentation. The DLM algorithm, when including a phoneme classifier, clearly succeeds at matching man ual measuremen ts of vo wel duration. With resp ect to b oth measurement deviation and repro duction of regression mo del results, the DLM algorithm out-p erforms or matches a commonly-used forced alignmen t system while not requiring a phonetic transcription. This approac h can allo w lab oratory exp eriments to address muc h larger samples of data in a w ay that is replicable and reliable. Ha ving ac hieved some success with monosyllabic, lab oratory stimuli, future dev elop- men t of this algorithm should extend this approac h to more naturalistic pro duction. In Automatic measurement of vo wel duration 37 curren t work, we are extending this approach to v o w el durations in m ultisyllabic words. W e b elieve that mo ving outside the lab oratory will b e facilitated b y the structure of our approac h; in contrast with existing systems, our algorithm has the additional b enefit of not requiring a transcript of the desired sp eech prior to analysis. Extending the capability of the system to analyze untranscribed speech will support the analysis of more naturalistic, connected sp eec h, including sp eech st yles or dialects that ma y b e difficult to robustly sample in a lab oratory context (Lab ov, 1972; Risc hel, 1992). With respect to the algorithms utilized in future w ork, w e aim to apply new adv ances in deep learning to automatic estimation of vo wel duration. In preliminary work, w e used this approac h to train a binary classifier to detect for eac h frame whether it con tains a vo wel or not (Adi et al., 2015). Ho w ever, since this approach do es not take into account the relationships b et w een adjacent frames, it requires an additional algorithm to yield durations. In future w ork, we plan to fo cus on com bining new adv ances in sequence deep learning (Elman, 1990; Gra v es et al., 2013; Grav es and Jaitly, 2014) with our curren t structured prediction scheme. Ac kno wledgemen ts Researc h supp orted b y NIH gran t 1R21HD077140 and NSF grant BCS1056409. Automatic measurement of vo wel duration 38 References Adi, Y., Keshet, J., and Goldric k, M. (2015). V ow el duration measuremen t using deep neural net w orks. In Pr o c e e dings of the IEEE International Workshop on Machine L e arning for Signal Pr o c essing , pages 1–6. Baa y en, R. H. (2008). Analyzing linguistic data: A pr actic al intr o duction to statistics using R . Cam bridge: Cambri dge Universit y Press. Baa y en, R. H., Da vidson, D. J., and Bates, D. M. (2008). Mixed-effects mo deling with crossed random effects for sub jects and items. Journal of Memory and L anguage , 59(4):390–412. Barr, D. J., Levy , R., Scheepers, C., and Tily , H. J. (2013). Random effects structure for confirmatory h yp othesis testing: Keep it maximal. Journal of Memory and L anguage , 68(3):255–278. Clopp er, C. G., Carter, A. K., Dillon, C. M., Hernandez, L. R., Pisoni, D. B., Clark e, C. M., Harnsb erger, J. D., and Herman, R. (2002). The indiana sp eec h pro ject: An o v erview of the developmen t of a m ulti-talk er m ulti-dialect speech corpus. Indiana University Sp e e ch R ese ar ch L ab or atory R ese ar ch on Sp e e ch Per c eption Pr o gr ess R ep ort , 25:367–380. Clopp er, C. G. and T amati, T. N. (2014). Effects of lo cal lexical comp etition and regional dialect on vo wel pro duction. Journal of the A c oustic al So ciety of Americ a , 136(1):1–4. Automatic measurement of vo wel duration 39 Crammer, K., Dek el, O., Keshet, J., Shalev-Shw artz, S., and Singer, Y. (2006). Online passiv e aggressiv e algorithms. Journal of Machine L e arning R ese ar ch , 7:551–585. Dek el, O., Keshet, J., and Singer, Y. (2004). An online algorithm for hierarc hical phoneme classification. In Workshop on Multimo dal Inter action and R elate d Machine L e arning A lgorithms; L e ctur e Notes in Computer Scienc e , volume 3361/2005, pages 146–159. Berlin: Springer-V erlag. Elman, J. L. (1990). Finding structure in time. Co gnitive scienc e , 14(2):179–211. Ev anini, K. (2009). The p erme ability of diale ct b oundaries: A c ase study of the r e gion surr ounding Erie . PhD thesis, Universit y of Pennsylv ania. Goldman, J.-P . (2011). Easy align: an automatic phonetic alignment to ol under Praat. In Pr o c e e dings of Intersp e e ch . Gorman, K., Ho w ell, J., and W agner, M. (2011). Proso dylab-aligner: A to ol for forced alignmen t of lab oratory sp eec h. Canadian A c oustics , 39(3):192–193. Gra v es, A. and Jaitly , N. (2014). T ow ards end-to-end sp eech recognition with recurrent neu- ral net works. In Pr o c e e dings of the 31st International Confer enc e on Machine L e arning (ICML-14) , pages 1764–1772. Gra v es, A., Mohamed, A.-r., and Hinton, G. (2013). Speech recognition with deep recurrent Automatic measurement of vo wel duration 40 neural netw orks. In Pr o c esdings of 2013 IEEE International Confer enc e onA c oustics, Sp e e ch and Signal Pr o c essing (ICASSP) , pages 6645–6649. Heller, J. R. and Goldric k, M. (2014). Grammatical constrain ts on phonological enco ding in sp eec h pro duction. Psychonomic Bul letin & R eview , 21(6):1576–1582. Heller, J. R. and Goldrick, M. (2015). Erratum to: ’grammatical constrain ts on phonological enco ding in sp eec h pro duction’. Psychonomic Bul letin & R eview , 22(5):1475. Hillen brand, J., Gett y , L. A., Clark, M. J., and Wheeler, K. (1995). Acoustic c haracter- istics of american english v ow els. The Journal of the A c oustic al So ciety of Americ a , 97(5):3099–3111. Keshet, J. (2014). Optimizing the measure of p erformance in structured prediction. In No w ozin, S., Gehler, P . V., Jancsary , J., and Lamp ert, C. H., editors, A dvanc e d Struc- tur e d Pr e diction . Cambridge, MA: MIT Press. Keshet, J., Shalev-Sh w artz, S., Singer, Y., and Chazan, D. (2007). A large margin algorithm for sp eech and audio segmen tation. IEEE T r ansactions on Audio, Sp e e ch and L anguage Pr o c essing . Lab o v, W. (1972). So ciolinguistic p atterns . Philadelphia, P A: Universit y of P ennsylv ania Press. Automatic measurement of vo wel duration 41 McAllester, D., Hazan, T., and Keshet, J. (2010). Direct loss minimization for structured prediction. In A dvanc es in Neur al Information Pr o c essing Systems , pages 1594–1602. P eterson, G. E. and Lehiste, I. (1960). Duration of syllable nuclei in english. The Journal of the A c oustic al So ciety of Americ a , 32(6):693–703. Reddy , S. and Stanford, J. N. (2015). T ow ard completely automated vo wel extraction: In tro ducing D ARLA. Linguistics V anguar d , 1:15–28. Risc hel, J. (1992). F ormal linguistics and real sp eech. Sp e e ch Communic ation , 11(4):379–392. Rosenfelder, I., F rueh w ald, J., Ev anini, K., Seyfarth, S., Gorman, K., Prichard, H., and Y uan, J. (2014). F av e (forced alignment and v ow el extraction). Program suite v1.2.2 10.5281/zeno do.22281. Sha, F., Burgo yne, J. A., and Saul, L. K. (2004). Multiband statistical learning for f0 estimation in sp eec h. In Pr o c e e ding of IEEE International Confer enc e on A c oustics, Sp e e ch, and Signal Pr o c essing (ICASSP) , volume 5, pages 661–664. Sonderegger, M. and Keshet, J. (2012). Automatic discriminativ e measurement of v oice onset time. Journal of the A c oustic al So ciety of Americ a , 132(6):3965–3979. T alkin, D. (1995). A robust algorithm for pitch tracking. Sp e e ch c o ding and synthesis , 495:518. Automatic measurement of vo wel duration 42 Y oung, S. and Y oung, S. (1994). The h tk hidden marko v mo del to olkit: Design and philos- oph y . Entr opic Cambridge R ese ar ch L ab or atory, Ltd , 2:2–44. Y uan, J. and Lib erman, M. (2008). Sp eak er identification on the SCOTUS corpus. Journal of the A c oustic al So ciety of Americ a , 123(5):3878. Y uan, J., Ryan t, N., Lib erman, M., Stolck e, A., Mitra, V., and W ang, W. (2013). Automatic phonetic segmen tation using b oundary mo dels. In Pr o c e e dings of Intersp e e ch , pages 2306–2310. Garofolo, J. S., Lamel, L. F., Fisher, W. M., Fiscus, J. G., Pallett, D. S., Dahlgren, N. L., and Zue, V. (1993). TIMIT acoustic-phonetic con tinuous sp eech corpus. In Linguistic data c onsortium , Philadelphia 33. Supplemen tal Materials: Automatic measuremen t of v o w el duration via structured prediction Y ossi Adi a) , Joseph Keshet b) Departmen t of Computer Science, Bar-Ilan Univ ersit y , Ramat-Gan, Israel, 52900 Emily Cib elli c) , Erin Gustafson d) Departmen t of Linguistics, North w estern Universit y , Ev anston, IL, 60208 Cyn thia Clopp er e) Departmen t of Linguistics, Ohio State Univ ersit y , Columbus, OH, 43210 Matthew Goldrick f ) Departmen t of Linguistics, North w estern Universit y , Ev anston, IL, 60208 a) e-mail: adiyoss@cs.biu.ac.il b) e-mail: joseph.keshet@biu.ac.il c) e-mail: emily .cib elli@north western.edu d) e-mail:egustafson@u.north western.edu e) e-mail:clopp er.1@osu.edu f ) e-mail: matt-goldrick@north western.edu Automatic vo wel measurement:Supplemen tal data 2 1 RESUL TS: REPR ODUCING REGRESSION MODEL FINDINGS USING A F ORMANT ESTIMA TOR In the main text, w e rep ort analyses of v o w el duration, whic h the DLM and HMM algorithms are designed to directly estimate. In these materials, w e examine the similarit y of inferential statistical mo del fits based on measurements generated b y a standard forman t estimator using as input vo wel durations from algorithms vs. man ual measuremen ts. ? examined ho w degree of v ow el con trast w as influenced b y t wo factors: lexical con trast (the presence vs. absence of a word in English with the other mem b er of the v o w el); and dialect (Northern sp eakers hav e a smaller con trast than Midland speakers for / E ∼ ae /, whereas the pattern is reversed for / A ∼ O /). V o w el con trast was quantified b y the distance in Bark ( ? ) b et w een the first and second forman ts (F1/F2) of vo wels from con trasting categories. These were estimated at vo wel midp oin t using Praat ( ? ). V ow el distance was defined as the median of the Euclidean distances in the F1-F2 Bark space from a giv en v ow el to each corresp onding vo wel in the same competitor condition. F or example, if the target word w as de ad , the relev ant set of distances w ould b e to / ae / target words with lexical comp etitors (e.g., dad ). The effect of lexical comp etitor and dialect on these distance v alues was mo deled via treatmen t-co ded fixed effects in a mixed-effects regression mo del b y ?? . Lexical neighborho o d densit y and Automatic vo wel measurement:Supplemen tal data 3 log w ord frequency were included as con trol factors. Random in tercepts for word and talker w ere included, along with uncorrelated random slop es for density and frequency by talk er. Our analysis follow ed that of the original pap er, except that all fixed-effect factors w ere cen tered (resulting in contrast-coded categorical factors), the exclusion of outliers with large mo del residuals, and the assessmen t of significance via mo del comparison (see b elow). Using eac h algorithm’s segmentation of the vo wel, Praat was used to calculate F1 and F2 v alues. T okens with F1 or F2 v alues more than 3 standard deviations from the mean of eac h vo wel w ere considered to b e outliers. As the authors in the original pap er replaced outlier tok ens with manual measurements, w e employ ed a similar approach; for each token iden tified as an outlier (5.7% of tok ens), the distance measurements were replaced with the man ual measuremen ts corresp onding to those tok ens. 2 Significance of fixed effects F ollo wing the HG analyses, mo dels were refit after excluding observ ations with standardized residuals exceeding 2.5 ( ? ) and the significance of fixed-effects predictors was assessed via the likelihoo d ratio test ( ? ). The parameter estimates for mo del fit to the subset of the v ow el distance data con trast- ing / ae ∼ E / are shown in T able 1. The manual mo del had a significant effect of dialect ( χ 2 = 5.05, p = 0.025) but no effect of lexical comp etitor ( χ 2 = 0.11, p = 0.074). The in teraction Automatic vo wel measurement:Supplemen tal data 4 of dialect and comp etitor was not significant ( χ 2 = 0.09, p = 0.7631). The algorithms largely recov ered the same effects as found in the man ual data. The DLM mo del reco vered the significant main effect of dialect ( χ 2 = 5.04, p = 0.025); this parameter w as marginal in the DLM (no classifier) mo del ( χ 2 = 3.09, p = 0.079) and the HMM mo del ( χ 2 = 3.66, p = 0.056). The interaction did not reach significance for any of the algorithmic mo dels, but w as marginal in the DLM mo del ( χ 2 = 2,83, p = 0.093). As in the manual mo del, all algorithmic mo dels found no significan t or marginal effects for the lexical comp etitor factor or either control v ariable ( p > 0.10). The parameter estimates for mo del fit to the subset of the data contrasting / A ∼ O / are sho wn in T able 2. The man ual mo del had a significant effect of lexical comp etitor ( χ 2 (1) = 12.40, p < 0.0001), but the effect of dialect was not significan t ( χ 2 (1) = 2.48, p = 0.115). The interaction of dialect and comp etitor just missed reaching significance ( χ 2 (1) = 3.65, p = 0.056). Mo dels from all algorithmic metho ds pro duced a similar, but not iden tical, pattern of fixed effects as those found in the man ual mo del. The effect of lexical competitor was significan t for all metho ds (all χ 2 (1) > 7, p < 0.05). The effect of dialect did not reac h significance in the HMM mo del ( χ 2 (1) = 1.14, p = 0.285) but was significan t in the DLM mo del ( χ 2 (1) = 5.07, p = 0.024) and marginal in the DLM (no classifier) mo del ( χ 2 (1) = 3.54, p = 0.060). While the interaction of dialect and competitor just missed reaching Automatic vo wel measurement:Supplemen tal data 5 F requency t Densit y t Dialect t Lexical Comp etitor t Dialect * Comp etitor t Manual 0.026 (0.085) 0.302 -0.001 (0.007) -0.115 -0.345 (0.144) -2.390 0.039 (0.114) 0.338 0.114 (0.078) 1.462 DLM 0.0357 (0.119) 0.301 0.001 (0.011) 0.054 -0.355 (0.148) -2.396 0.091 (0.175) 0.519 0.138 (0.0818) 1.687 DLM (no classifier) 0.014 (0.123) 0.113 0.001 (0.011) 0.112 -0.277 (0.151) -1.828 0.111 (0.182) 0.60 0.131 (0.083) 1.586 HMM 0.1345 (0.102) 1.322 -0.003 (0.009) -0.298 -0.257 (0.128) -2.003 -0.121 (0.144) -0.839 -0.007 (0.089) -0.074 T able 1: Estimates and t -v alues for fixed effects in regression mo del, Clopp er & T amati dataset (standard error of estimate in paren theses), / ae ∼ E / data. Significant effects ( p < = 0.05, as assessed by lik eliho o d ratio tests) are b olded; marginal effects (0.05 > p < 0.10) are italicized. Automatic vo wel measurement:Supplemen tal data 6 significance in the man ual mo del it was significan t in the models of all three algorithmic metho ds (all χ 2 (1) > 3.9, p < 0.04). 3 Comparison of mo del predictions W e performed lea ve-one-out v alidation on the / ae ∼ E / and / A ∼ O / models. Comparisons of the predictions of eac h algorithmic mo del fit to the man ual data predictions are sho wn in Figure 1. F or the / ae ∼ E / data predictions, the mean squared error relativ e to the man ual data predictions w as lo w est for the HMM mo del (0.045 Bark 2 ), follo w ed b y the DLM mo del (0.047 Bark 2 ) and the DLM mo del without classifier (0.069 Bark 2 ). Bo otstrap confidence interv als of the differences b et w een each system’s predictions found that the HMM system had a smaller mean squared error than the DLM system without classifier (95% CI, [-0.033, -0.015] Bark 2 ); the DLM predictions also had a smaller mean squared error than the DLM without classifier predictions (95% CI, [-0.027, -0.017] Bark 2 ). There was no difference b etw een the HMM and DLM predictions (95% CI, [-0.010, 0.005] Bark 2 ). T urning to the / A ∼ O / data predictions, the mean squared error relative to the predictions of the man ually annotated data w as similar across all metho ds. The b o otstrap confidence in terv als of the differences betw een eac h algorithm’s predicted v alues found no differences b et w een the predictions of any of the algorithmic metho ds; all confidence interv als contained Automatic vo wel measurement:Supplemen tal data 7 F requency t Density t Dialect t Lexical Competitor t Dialect * Competitor t Manual -0.056 (0.071) -0.791 -0.009 (0.009) -0.943 -0.218 (0.134) -1.627 0.555 (0.132) 4.194 0.160 (0.083) 1.925 DLM -0.059 (0.070) -0.841 -0.007 (0.010) -0.714 -0.256 (0.107) -2.404 0.385 (0.129) 2.977 0.190 (0.089) 2.147 DLM (no classifier) -0.065 (0.067) -0.963 -0.009 (0.009) -0.941 -0.220 (0.112)) -1.969 0.481 (0.125) 3.842 0.180 (0.090) 2.003 HMM -0.025 (0.064) -0.387 -0.007 (0.008) -0.807 -0.156 (0.144) -1.083 0.377 (0.117) 3.223 0.215 (0.096) 2.249 T able 2: Estimates and t -v alues for fixed effects in regression mo del, Clopp er & T amati dataset (standard error of estimate in parentheses), / A ∼ O / data. Significant effects ( p < = 0.05, as assessed b y likelihoo d ratio tests) are b olded; marginal effects (0.05 > p < 0.10) are italicized. Automatic v o w el measuremen t:Supplemen tal data 8 -1.5 -1.0 -0.5 0.0 0.5 1.0 1.5 0.0 0.5 1.0 1.5 2.0 2.5 /æ-ɛ/ predictions N = 400 Bandwidth = 0.05062 Density DCM DCM (no classifier) HMM -1.5 -1.0 -0.5 0.0 0.5 1.0 1.5 0.0 0.5 1.0 1.5 2.0 2.5 /ɑ-ɔ/ predictions N = 377 Bandwidth = 0.05096 Density DCM DCM (no classifier) HMM Figure 1: Comparisons of lea v e-one-out mo del predictions of v o w el distances for the Clopp er & T amati (2014) dataset. In eac h panel, the deviance of eac h a lgorithmic meth o d as com- pared to the man ual predictions (man ual-algorit hmic) ar e sho wn. Predictions for the / ae ∼ E / distances are presen ted on the left, and / A ∼ O / distances on the righ t. Automatic vo wel measurement:Supplemen tal data 9 0 (DLM vs. HMM 95% CI: [-0.019, 0.004] Bark 2 ; DLM no classifier vs. HMM 95% CI: [-0.018, 0.008] Bark 2 ; DLM vs. DLM no classifier 95% CI: [-0.002, 0.006] Bark 2 ). 4 DISCUSSION The formant estimator used here returns relativ ely similar results for input based on manual vs. algorithmic measurements. How ever, there is some degree of v ariance across metho ds, whic h is somewhat unexp ected given that vo wel measuremen ts are targeted at the steady- state midp oint of eac h v ow el. Use of more robust and reliable formant estimators might pro vide a b etter comparison across differen t analysis metho ds. Ac kno wledgemen ts Researc h supp orted b y NIH gran t 1R21HD077140 and NSF grant BCS1056409.
Original Paper
Loading high-quality paper...
Comments & Academic Discussion
Loading comments...
Leave a Comment