Prediction of Video Popularity in the Absence of Reliable Data from Video Hosting Services: Utility of Traces Left by Users on the Web
With the growth of user-generated content, we observe the constant rise of the number of companies, such as search engines, content aggregators, etc., that operate with tremendous amounts of web content not being the services hosting it. Thus, aiming…
Authors: Alexey Drutsa (Y, ex, Moscow
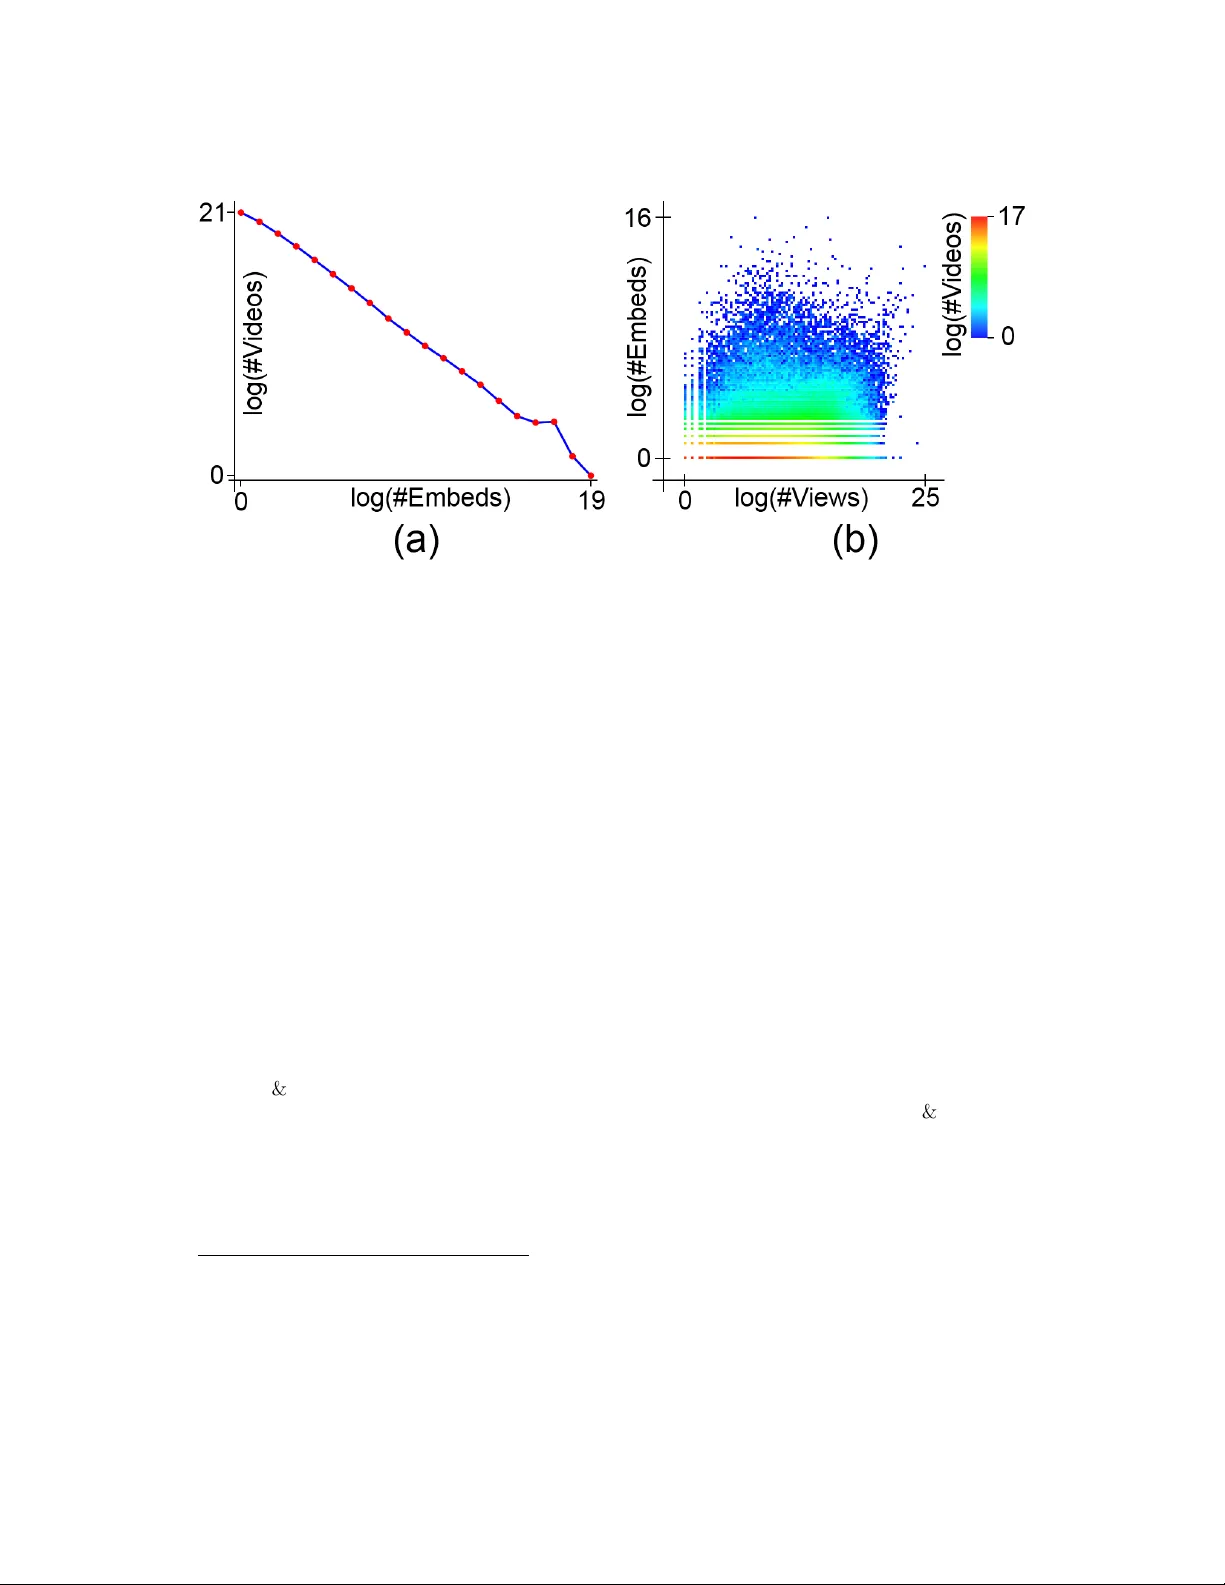
Prediction of Video P opularit y in the Absence of Reliable Data from Video Hosting Services: Utilit y of T races Left b y Users on the W eb Alexey Drutsa Y andex ∗ adrutsa@yandex.ru Gleb Gusev Y andex ∗ gleb57@yandex-team.ru P a vel Serdyuk o v Y andex ∗ pavser@yandex-team.ru No vem ber 28, 2016 Abstract With the gro wth of user-generated con tent, w e observ e the constan t rise of the n um b er of companies, such as searc h engines, con tent aggregators, etc., that op erate with tremendous amoun ts of web conten t not being the services hosting it. Thus, aiming to locate the most imp ortan t conten t and promote it to the users, they face the need of estimating the curren t and predicting the future conten t popularity . In this paper, we approac h the problem of video p opularit y prediction not from the side of a video hosting service, as done in all previous studies, but from the side of an op erating company , which provides a p opular video search service that aggregates con tent from different video hosting w ebsites. W e in vestigate video p opularity prediction based on features from three primary sources av ailable for a typical op erating company: first, the con tent hosting provider may deliv er its data via its API; second, the operating company mak es use of its own searc h and browsing logs; third, the company cra wls information ab out em b eds of a video and links to a video page from publicly av ailable resources on the W eb. W e show that video p opularit y prediction based on the embed and link data coupled with the internal searc h and bro wsing data significantly improv es video p opularit y prediction based only on the data provided by the video hosting and can even adequately replace the API data in the cases when it is partly or completely una v ailable. Keyw ords: video; p opularit y prediction; em b ed; API data; cra wled data; search logs; bro wsing logs; hosting provider; op erating company 1 In tro duction With the stunning growth of user-generated con tent, w e observe the constan t rise of the num b er of companies that op erate with web con tent not b eing services hosting it. In this respect, we can distinguish tw o types of companies. The first ones are the organizations that provide a hosting service for user con tent ( hosting pr oviders , or HPs ). F or instance, they are video hostings like Y outub e, music sharing services like Soundcloud, etc. The second ones ( op er ating c omp anies , or OCs ) are the organizations that operate with user conten t which is hosted externally at HPs or other OCs. Examples of op erating companies are web searc h engine companies (e.g., ∗ 16, Leo T olstoy St., Moscow, Russia (www.y andex.com) 1 A. Drutsa et al., “Prediction of Video P opularity in the Absence of Reliable Data from Video Hosting Services: Utilit y ...” Figure 1: (a) A Hosting Pro vider (HP), an Operating Compan y (OC), and sev eral public w eb pages that accommo date user activit y about conten t items from the HP; (b) all a v ailable sources of evidence ab out curren t or future video p opularit y that could b e split into the following three groups: API data pro vided b y the HP , in ternal logs of the OP , and crawled data from publicly a v ailable web pages. Go ogle, Bing), conten t aggregators (e.g., Digg, Reddit), conten t recommendation systems (e.g., Stum bleUp on, Pinterest), etc. Of course, one compan y ma y act b oth as HP and OC. F or example, large social net works like F aceb o ok and Twitter store billions of user messages and, at the same time, they pro vide the ability to embed external videos and images directly in to the messages. Since op erating companies usually deal with tremendous amounts of external conten t, the c hallenge of estimating the current and the future p opularity (e.g., the num ber of views, the n umber of commen ts received, etc.) of the conten t is inevitable for them. It is considered that the predicted curren t and future v alues of conten t p opularit y can serve as strong features for con- ten t ranking and con ten t analysis problems in general [Gon¸ calv es et al., 2010, T atar et al., 2012, Yin et al., 2012, Ahmed et al., 2013]. So, a high quality p opularity prediction is a vitally im- p ortan t component of any OC, which strongly influences the usefulness of the service to its end users and, consequently , the company’s profits. In some situations, the p opularit y of the conten t is disclosed b y the hosting pro vider through an application programming interface (API); in other circumstances it could not b e retrieved from the HP at all (the API could b e simply absen t, as, for instance, for the video hosting services coub.com and break.com). Meanwhile, even if the API pro vides the information on p opularit y , the API could b e perio dically or p ermanen tly una v ailable, or could set a limit on the num ber of allo wed requests p er time p eriod, which can be insufficient for the OC’s needs. Besides, the pro vided data could b e noisy and could b e delivered with a delay as we demonstrate further with an example. In our work, we prop ose a metho dology that could b e used to comp ensate for the ab o ve limitations faced by op erating companies. In the current pap er, we solve the p opularity prediction problem and we restrict our inv esti- gation to the needs of a compan y which provides a p opular video search service and aggregates con tent from different video hosting websites. Moreov er, without a loss of generality , we will only consider the video data serv ed b y the video hosting w ebsite Y outub e. 2 A. Drutsa et al., “Prediction of Video P opularity in the Absence of Reliable Data from Video Hosting Services: Utilit y ...” On the one hand, it is w ell kno wn that the video popularity (the total num b er of views during a considered p erio d) in v ast ma jorit y of cases dep ends on or, at least, highly correlated with its p opularit y in the first days of its existence [Szab o and Hub erman, 2010, Figueiredo et al., 2011, Pin to et al., 2013, Broxton et al., 2013]. Th us, the long-term p opularity could be efficien tly predicted using information ab out p opularity dynamics in the first weeks of the video existence. On the other hand, it is known that Y outube can freeze the views count in the first days of video existence. It is officially confirmed by Y outube represen tatives 1 and is also frequently observ ed in the scop e of the video search service of the p opular search engine compan y under study . Th us, we face the problem of p opularit y prediction of a new video in the first days of its existence without kno wing its previous p opularit y , b ecause the information from Y outub e is not alwa ys av ailable. In this paper, we prop ose to consider the case when an op erating compan y decides not to sta y completely dep endent from video hosting providers and relies not on a single, but on all a v ailable sources of evidence ab out current or future video p opularity that could b e split into the following three groups (see Fig. 1): • the data provided by the con tent hosting provider, generally , via its API or its publicly a v ailable web pages (API data); • the in ternal data of the conten t op erating company , generally , its user access data stored in logs (Log data); • the publicly av ailable resources of the W eb, where the conten t could lea ve its traces (W eb data). The future p opularit y of ob jects of different kinds and videos in particular has b een in vestigated and predicted from the point of view and using the data from con tent hosting providers only [Crane and Sornette, 2008, Szab o and Hub erman, 2010, Lerman and Hogg, 2010, Tsagkias et al., 2010, Gon¸ calv es et al., 2010, Lai and W ang, 2010, Hong et al., 2011, Borghol et al., 2012, Kupa vskii et al., 2012, Kim et al., 2012, Radinsky et al., 2012, Pin to et al., 2013, Figueiredo, 2013, Ahmed et al., 2013, Bro xton et al., 2013, Pinto et al., 2013, Ding et al., 2015, F ontanini et al., 2016, Li et al., 2016] and using in ternal data of so cial netw orks, suc h as F aceb ook and Twitter [Li et al., 2013, Soysa et al., 2013b, Soysa et al., 2013a, Abishev a et al., 2014]. A comprehensive o verview of v arious research questions, methodologies and approaches in the field of prediction of web con tent (not only video) p opularit y can be found in [T atar et al., 2014]. T o the b est of our knowledge, no existing study inv estigated the utilit y of publicly a v ailable traces of videos on web pages for the task of video p opularity prediction. In the current paper, em b eds of videos and links to video pages on publicly av ailable resources of the W eb are considered and used as features to predict video p opularity . W e also conduct a detailed inv estigation of the features extracted from all three groups of sources, where we use (the first to our knowledge) w eb search logs and bro wsing logs collected b y Y andex (www.yandex.com) as internal data. The in vestigation of b oth sources and a series of exp erimen ts demonstrating to what extent b oth sources are capable to supplemen t or, more imp ortan tly , replace the API data in the task of video p opularit y prediction, r epr esent the first major c ontribution of this study . W e are also the first who thoroughly inv estigated the prediction of p opularity of a new video in the first days of its existence and the first who addressed the problem of the curr ent video 1 “W e wan t to make sure that all views are v alidated so during this process the views update less frequently and might o ccasionally freeze ab ov e 300 views to assure qualit y view count. This is the normal op eration in Y ouT ube videos.” stated on the official Y outub e site support.google.com/youtube/troubleshooter/2991876 3 A. Drutsa et al., “Prediction of Video P opularity in the Absence of Reliable Data from Video Hosting Services: Utilit y ...” p opularit y prediction, in the absence of the information on p opularity from the video hosting service. We r e gar d this as the se c ond major c ontribution of this study. The rest of the pap er is organized as follo ws. In Section 2, the related work is presented. In Section 3, w e in tro duce our notations and the framework. In Section 4, prediction task is describ ed in detail and the researc h questions are stated. W e describ e our data sets in Section 5, list the set of features in Section 6, and describe the mo dels used for the p opularity prediction in Section 7. In Sections 8 and 9, we presen t our exp eriments and discuss their results. In Section 10, the study’s conclusions and future work are presented. 2 Related w ork W e compare our research with other studies in three asp ects. The first one relates to the video p opularit y analysis, the second one concerns the future video p opularit y prediction, and the last asp ect refers to p opularity prediction studies in general. 2.1 Video p opularit y analysis The video hosting conten t and its p opularit y were widely in vestigated in recent years. In one of the most cited studies on the topic [Crane and Sornette, 2008], researc hers fo cused on the analysis of video views dynamics decay after its p eak. Both [Szab o and Hub erman, 2010] and [Figueiredo et al., 2011] examined ho w quickly a video can b ecome popular. They found that the most p opular and viral videos receiv e the ma jor part of their views in the first weeks of their existence. Another study [Broxton et al., 2013] also found that, in general, viral videos are mostly viewed in the first week after their upload. All the mentioned studies confirm the imp ortance of studying and predicting video popularity in the first days of its existence. 2.2 F uture video p opularity prediction The authors of [Szab o and Hub erman, 2010] studied Y outub e conten t p opularity and established linear dep endence b et ween the logarithmic views counts measured at the 10-th da y and at the 30- th day after the day of the video upload. The authors of [Ahmed et al., 2013] used the same data, but proposed to predict the future p opularity by using a mo del of conten t propagation through an implicit graph induced by patterns of temp oral evolution of video p opularit y . Prediction of the popularity p eak da y of a video w as studied in [Jiang et al., 2014]. All describ ed approaches are not applicable in our case, b ecause, in order to predict future p opularit y , they exploit curren tly or/and previously observ ed p opularit y that is not alwa ys av ailable by the statement of our problem. The research describ ed in [Li et al., 2013] was devoted to prediction of future video popular- it y in terms of the shares of a video in online so cial net w orks like F aceb ook. The analogous work w as made in [Soysa et al., 2013b, So ysa et al., 2013a]: they collected the share data not b eing inside the so cial netw ork company , but by receiving them from end users. Similar study of shar- ing behavior were carried out for Twitter [Abishev a et al., 2014]. F urther studies concen trated on more sophisticated mo dels and features like sen timents extracted from video frames and user commen ts [Ding et al., 2015, F ontanini et al., 2016]. The describ ed metho ds could not b e used in our work b ecause they use either the data that is not publicly av ailable for third parties, or the APIs of those so cial platforms. It means that a search engine which would decide to rely on that data would need to at least use the APIs of those services, while the goal of this study is to show to what extent an op erating compan y can b e indep endent from any APIs, even from seemingly more imp ortant APIs of video hosting services. 4 A. Drutsa et al., “Prediction of Video P opularity in the Absence of Reliable Data from Video Hosting Services: Utilit y ...” In T ables 1 and 2 we listed all features that we used to predict videos’ p opularity . The con tents of the table will b e discussed in detail further in Section 6, but, at the moment, we are in terested in the column named “Description (previously used or new)”, where we p oin ted out for each feature whether it has b een used elsewhere in the literature, or it is a nov el one. A reference is written in italic style , if the corresp onding feature has b een analyzed for a different purp ose or has b een used as a feature to predict the p opularit y of an y ob ject other than a video, but has not been used to predict videos’ p opularit y . Otherwise the reference is written in normal style. The most comprehensive study of the features that could be retriev ed via the Y outub e API has b een conducted in [Borghol et al., 2012] devoted to the conten t agnostic factors. Some of the features were also examined in [Figueiredo, 2013, Li et al., 2016]. Most of them are in T able 1, but not all: the researchers hav e used the num b er of keyw ords assigned to a video, the n umber of times the video w as “fav ourited”, and the b est qualit y the video is a v ailable in. All these features are still provided by Y outub e API for old videos, but they seem to be deprecated for new videos: their v alues for all videos that were uploaded since 2013 are constan t (zero, for instance). The reason is that Y outub e do es not allow its users to assign keyw ords and fav orite videos an ymore. In addition, the results of [Borghol et al., 2012] state that these features hav e no significan t correlation with video p opularit y and the “fa vourited” feature has a strong correlation with other user feedbac k features (num b ers of comments, ratings, lik es). Therefore, we do not use them in our analysis. Ne v ertheless, these circumstances serve as an additional confirmation of any API inconsistency and indicate the high c hance that the provided data could b ecome obsolete or unav ailable at an y time. Note that all ab o ve-men tioned studies and their corresp onding features were used to predict future video p opularity only , while our study also fo cuses on the prediction of current video p opularit y . Therefore, we reproduced all the features av ailable through Y outub e API and used them for our baseline mo dels. 2.3 P opularit y prediction of other ob jects Prediction of web conten t (not only video) p opularit y is a w ell known and widely inv estigated problem [T atar et al., 2014]. Prediction methods similar to the ones describ ed in the previous subsection w ere applied to predict p opularit y of web pages in general [Szabo and Hub erman, 2010, Lerman and Hogg, 2010, Hogg and Lerman, 2012] and for popularity of news measured in com- men ts count [Tsagkias et al., 2010]. The p opularit y of t weets in terms of the n umber of retw eets and shows w ere studied in [Hong et al., 2011, Kupa vskii et al., 2012, Kupavskii et al., 2013]. Some studies consider p opularity prediction mo dels that utilize data in non-aggregated form (lik e news articles [Y ang and Lesko vec, 2010] and user comments [He et al., 2014]). The authors of [Y ang and Lesk ov ec, 2010] in tro duced the linear influence model in order to predict p opularit y of hash tags ov er Twitter netw ork and p opularit y of memes ov er news articles and blog p osts in terms of affected no des of an implicit net work. In our w ork, w e use this mo del in order to take in to accoun t hosts with embeds and links to videos in non-aggregated form. The usefulness of conten t p opularit y prediction for search engines w as discussed in [T atar et al., 2012, Yin et al., 2012, T atar et al., 2014] where the prediction qualit y w as esti- mated with ranking metrics for popularity of news articles and published jok es. Hence, in our study , w e also ev aluate the p erformance of our predictors by means of NDCG (one of the most p opular ranking metrics [J¨ arv elin and Kek¨ al¨ ainen, 2002]). 5 A. Drutsa et al., “Prediction of Video P opularity in the Absence of Reliable Data from Video Hosting Services: Utilit y ...” 3 Notations and framew ork Let [0 , T ) , T > 0 , b e a known time in terv al, and τ b e a fixed time step (e.g., one day in our exp erimen ts). Then τ induces the finite time grid T = { t m } M m =0 ⊂ [0 , T ), where t m = mτ , m = 0 , .., M . The mesh without the starting point (e.g., the starting day) is denoted b y T = T \ { 0 } . Let V be a set of ob jects. Each ob ject v ∈ V is created at some time moment t ◦ ( v ) and exists at all times t ≥ t ◦ ( v ). F rom here on in the pap er we assume that for each ob ject v ∈ V , there is chosen the ob ject-sp ecific time scale measured in da ys and cen tered in suc h a wa y that t ◦ ( v ) ∈ [0 , τ ), i.e. the ob ject is created on the starting day of the scale. F or instance, a video published at 18:00 7th May has t ◦ ( v ) = 0 . 75 τ for τ = 1 day . These ob ject-fo cused timelines allo w to consider examples of ob jects created at different days in the scop e of the same prediction tasks we described further. Eac h ob ject can b e represented by the features from some set Φ during its life (for instance, video duration, num b er of commen ts, etc.). Eac h feature ϕ ∈ Φ takes its v alues in a set D ϕ . Generally , D ϕ is the set of real num b ers R (e.g., for a verage rating), the set of in tegers Z (e.g., for n umber of views), a finite se t (e.g., for video category), their Cartesian pro duct, or their subset. Besides, features could take differen t v alues at differen t time moments T , b eing dynamic in nature. Although, there are static features that are known either at or b efore the ob ject creation time (such as video upload hour). Thus, each feature ϕ ∈ Φ is formally a map from ob ject set V and the time mesh T to the feature v alue set D ϕ , that is ϕ : V × T → D ϕ , ϕ ∈ Φ . It is common that some data are known for the observer and some other are not. Usually , the observer w ants to use some part of the known data to estimate or predict the unkno wn data. The set of features used to predict unknown data is denoted b y Ψ ⊂ Φ . The features that the observ er wan ts to estimate or predict are referred to as tar gets and their set is denoted b y Θ ⊂ Φ . Let the v alues of features Ψ be known for the observer at the time moments T ∩ [0 , t c ]. Then the time moment t c ∈ T is referred to as the curr ent time moment . Consider that the observer has to estimate or predict the v alue of a target θ ∈ Θ at the time moment t t ∈ T . Then the time moment t t is called the tar get time moment . Note that, if t c = t t , then w e are dealing with curr ent pr e diction ; if t c < t t , then we are dealing with futur e pr e diction 2 . Th us, for a fixed target θ ∈ Θ , a fixed feature set Ψ 0 ⊂ Ψ , fixed current and target time momen ts t c , t t ∈ T , and a fixed prediction m odel m there is a class of functions P m ( Ψ 0 , θ ) that predict the target θ based on the features Ψ 0 . Then, the problem of prediction in terms of mac hine learning could b e stated as follows. Giv en a training set of examples V 0 ⊂ V and a pr e diction p erformanc e metric ρ θ on the function space {V 0 → D θ } , one should find the optimal predictor P m , opt( Ψ 0 ,t c ; θ,t t ) , namely P m , opt( Ψ 0 ,t c ; θ,t t ) = argmin P ∈ P m ( Ψ 0 ,θ ) ρ θ P t = t c , θ t = t t . (1) 4 Problem statemen t In this section we presen t the research questions that w e answer in our study , and we sp ecify the prediction task by defining current and target days, target v alues that we aim to predict and the metrics that we optimize on the training data and measure on the test data. 2 The current prediction task usually rises when the v alues of the target θ could not be retrieved (e.g., the current number of views from Y outub e API), while the future prediction task could b e stated for any feature. 6 A. Drutsa et al., “Prediction of Video P opularity in the Absence of Reliable Data from Video Hosting Services: Utilit y ...” 4.1 Researc h Questions The main goal of our study is to iden tify the benefit of non-API d ata for the task of prediction of video p opularit y . Thereupon, we translate this ob jectiv e into the following researc h questions: • [R Q1] Could the prediction quality b e improv ed by using the W eb and the Log data in addition to the data from the video hosting? • [R Q2] Could the W eb and the Log data b e effectively used in the case of absence of any reliable hosting data? • [R Q3] Could the W eb and the Log data replace a part of the hosting service data without a significant loss in prediction qualit y? 4.2 Sp ecification of prediction task In the pap er, in accordance with the notations in tro duced in Section 3, our inv estigation ob ject is a video uploaded to Y outub e video hosting, and, thus, the set V is a set of such videos. The fixed time in terv al τ is equal to one day , and from here on in the pap er we assume, for notation simplicit y , that a unit of a time line is one da y , i.e., τ = 1. W e in vestigate video p opularit y in terms of the num b er of views received by the video. This target could b e defined in differen t w ays, but w e will consider the tw o most practical definitions of the target: • cumulative p opularity Views [ c ]: the total num b er of views received since the video creation, that is, in the time perio d [0 , t ); • daily p opularity Views [ d ]: the total num b er of views receiv ed during the last da y , that is, in the time p eriod [ t − 1 , t ). In addition, b oth cumulativ e and daily views counts are logarithmically transformed 3 in order to b etter catch the differences b et ween v alues of differen t magnitudes. Th us, the complete set of targets in our study is Θ = { Views [ c ] , Views [ d ] , log ( Views [ c ]) , log ( Views [ d ]) } . (2) In our work, w e mainly focus on the task of the curren t p opularit y prediction ( t c = t t ), giv en that the API do es not pro vide us with this particular information (e.g., by dela ying it) or giv en that the API is entirely or partly una v ailable. Ho wev er, we apply the framew ork to the prediction of the future p opularit y as w ell. F or instance, for the 1-3 da ys forecast, t t = t c + δ, δ ∈ { 1 , 2 , 3 } . W e will consider target da ys of the tw o first weeks of video existence, that is, t t ∈ T ∗ def = { 1 , .., 14 } . The prediction in these target da ys is muc h more complicated than the prediction in the more distant time momen ts, b ecause for large v alues of t c , t t (10 da y → 30 day), the linear dependence of log ( Views [ c ])( t t ) and log ( Views [ c ])( t c ) was established [Szab o and Hub erman, 2010, Pinto et al., 2013], which mak es the prediction straightforw ard. W e use the r o ot me an squar e d err or ( RMSE ) as the minimization metric. RMSE for given maps P 1 , P 2 : V 0 → D θ is defined on a set V 0 ⊂ V by (RMSE( P 1 , P 2 )) 2 = |V 0 | − 1 P v ∈V 0 ( P 1 ( v ) − P 2 ( v )) 2 . The v alues of RMSE of the b est predictor P m , opt( Ψ ,t c ; θ,t t ) on the test set are denoted b y RMSE( Ψ , t c ; θ, t t ) = RMSE( P m , opt( Ψ ,t c ; θ,t t ) , θ ) . (3) 3 F rom here on in the paper we use log( x ) def = log 2 ( x + 1), and, for each ϕ ∈ Φ , we denote the logarithmic feature b y log ( ϕ ). 7 A. Drutsa et al., “Prediction of Video P opularity in the Absence of Reliable Data from Video Hosting Services: Utilit y ...” W e also analyze the p erformance of different predictors using a task-specific v ariant of ranking qualit y measure NDCG describ ed in Section 8.3. So, to finish the specification of prediction task one needs to specify the set of all in vestigated features Ψ and the used mo del m . They will b e sp ecified in Sections 6 and 7 following the data sets description given in the next section. 5 Data sets As we previously men tioned, we analyze three ma jor data sources av ailable for a typical OC. In our case, we used the follo wing datasets: (a) conten t hosting provider (in our case, Y outub e); (b) the internal logs of Y andex; (c) the traces that are left b y the conten t on the W eb. The data from the hosting provider was split into tw o parts. The first part is the data ab out each video and its author provided through the Y outub e API. The second part is the historical information on a video that is shown on the tab “Statistics” of the video web page (cum ulative/daily views/shares/subscrib ers coun ts and total w atc h time) 4 . Ab out 25% of videos are priv ate or hav e no publicly av ailable historical information. W e collected only those videos for which the access was publicly av ailable. The data from Y andex could b e also split into differen t parts corresp onding to the logs of differen t services/products of the compan y . In our work, we inv estigate the logs of tw o services/pro ducts: the searc h service and the browser. The third ma jor data source is provided b y the web crawler of Y andex that supplies the tw o t yp es of data ab out created videos: embeds of the videos and links to the videos’ pages. So, our metho dology for collecting data is as follows. First, we define a harvest time p erio d . Then, at each da y in this p erio d we go to the database of the cra wler (which also regularly cra wls Y outub e’s RSS feeds of the most p opular and new videos 5 ), and retriev e all av ailable Y outub e videos that are created in the defined time p erio d. At the end of each day , w e retrieve the data for these videos a v ailable via Y outub e API. Thus, we obtain API information for each video for each day from the defined perio d. When the harvest p erio d is o ver, we retrieve the history of actual view counts p er day for eac h known video. After that, we utilize search and browsing logs of Y andex and retrieve all a v ailable information ab out the kno wn videos. Finally , w e retriev e embeds of the videos and links to the videos from the crawler database. Dataset#1. F or the first dataset w e selected the harvest time p eriod from 23rd December, 2013 to 18th January , 2014 (27 days p erio d). In that p erio d w e collected more than 2 . 4 · 10 6 videos. The dataset has more than 5 . 3 · 10 6 em b eds of the videos (more than 2 . 4 · 10 5 videos ha ve at least one embed). The joint distribution of videos by the n umber of views and the num b er of embeds is presented in Fig. 2 (b). Dataset#2. F or the second dataset w e selected the harvest time p eriod from the 1st Marc h, 2013 to the 31st May , 2013 (92 days p eriod). Here we did not retrieve the API data for each da y unlike for the previous dataset, b ecause Dataset#2 is not used in the exp eriments with the API data. W e collected it in order to train the linear influence model (see Section 7), and hence 4 The data are pro vided with a delay of 2-3 da ys. The authors of [Figueiredo, 2013] and [Figueiredo et al., 2011] used the same metho dology to extract views history . 5 http://www.youtube.com/t/rss_feeds 8 A. Drutsa et al., “Prediction of Video P opularity in the Absence of Reliable Data from Video Hosting Services: Utilit y ...” Figure 2: (a) The distribution of videos by the num b er of embeds ob eys the p o wer law (Dataset#2); (b) The joint distribution (heat map) of videos b y the num b er of views (axis X ) and the n umber of embeds (axis Y ) for Dataset#1. w e also collected all em b eds and links of the discov ered videos that w ere published in the first 120 da ys after each video’s creation da y . Ov erall, we collected more than 8 . 5 · 10 6 videos. The data set has more than 58 · 10 6 em b eds of the videos (more than 3 . 3 · 10 6 videos has at least one em b ed). The distribution of videos by the n umber of em b eds ob eys the p o wer law, see Fig. 2 (a). 6 F eatures W e summarized and describ ed all features used in our work in T ables 1 and 2. The sets Ψ that the feature b elongs to are sp ecified in the column “F eature set”. The feature v alue space D ψ is describ ed in the column “V alues” 6 . F or eac h in teger or real v alued feature that has 1 v alues, w e consider both its actual v alue and its lo garithmic transformation (in terms of log( x ) def = log 2 ( x + 1)). The logarithmic transformation of the feature ϕ ∈ Φ , D ϕ ⊂ R , we denote by log( ϕ ) . F or instance, TitleLen is the actual n umber of c haracters in the title of a video, and log(TitleLen) is the logarithm of that num b er. The presence of the mark “ n/l ” in T ables 1 & 2, column “Mo des”, means that the marked feature is used in p opularit y prediction b oth in transformed and non-transformed forms. The column “Mo des” of T ables 1 & 2 contains also marks “ c/d ”. The presence of the mark means that the corresp onding feature p ossesses the integral prop ert y . It means that the feature v alue at a time moment t ∈ T is equal to the sum of elementary features ov er some time p eriod. In our work, we use tw o options: the v alue calculated during the en tire p erio d [0 , t ) ( cumulative ) and the v alue calculated during the last da y [ t − 1 , t )( daily ) 7 . In order to distinguish cum ulative and daily feature v alues, we add to 6 W e remind the standard number set notations: N is the set of natural n umbers, i.e. { 1 , 2 , .. } ; Z + is the set of non-negative integer num b ers, i.e. { 0 , 1 , 2 , .. } ; R + , is the set of non-negative real num b ers, i.e. [0 , + ∞ ), Z p , p ∈ N , is the finite set of num b ers { 0 , 1 , .., p − 1 } . 7 It is possible to derive many other com binations lik e v alues calculated during the tw o previous da ys [ t − 2 , t ) and so on. It is not the goal of our research, so w e took just 2 different v ariants. A deep er investigation of other combinations could b e regarded as future work. 9 A. Drutsa et al., “Prediction of Video P opularity in the Absence of Reliable Data from Video Hosting Services: Utilit y ...” T able 1: List of all features from API that are used to predict video p opularit y . F eature set Name V alues Description (previously used or new) Mo des Ψ ψ D ψ API S 1. Static fe atur es fr om the vide o hosting servic e API API Sv 1.a. Static fe atur es ab out the vide o fr om vide o hosting servic e API Dur N Video duration in seconds ([Figueiredo, 2013, Li et al., 2016]) n/l Cat ( Z 2 ) c Video category , where c ∈ N is the num b er of dif- ferent categories ([Figueiredo, 2013, Li et al., 2016], [Y ang and L eskove c, 2010, Bor ghol et al., 2012, Pinto et al., 2013] ) - TitleLen N Video title length in num ber of characters ([Li et al., 2016]) n/l DescLen Z + Video description length in num b er of characters ([Li et al., 2016]) n/l UplDOW ( Z 2 ) 7 Day of the week of the video upload date ( new ) - UplHour [0 , 24) The hour of the video upload time ( new ) - API Sa 1.b. Static fe atur es fr om the vide o hosting servic e API ab out the vide o author AuthAge Z + The author’s age in number of da ys from her reg- istration date ([Borghol et al., 2012, Li et al., 2016], [Kup avskii et al., 2013]) n/l AUplCnt N The num ber of videos uploaded by the au- thor ([Borghol et al., 2012], [Hong et al., 2011, Kup avskii et al., 2013] ) n/l AViewSum Z + The total time in seconds that viewers w atched all the author’s videos ([Borghol et al., 2012]) n/l FrndCnt Z + The num ber of the author’s friends ([Borghol et al., 2012, Li et al., 2016], [Kup avskii et al., 2013] ) n/l SubsCnt Z + The n umber of the author’s subscrib ers ([Borghol et al., 2012, Li et al., 2016], [Kup avskii et al., 2013] ) n/l API D 2. Dynamic fe atur es fr om the vide o hosting servic e API CommCnt Z + The num b er of all comments on the video ([Borghol et al., 2012], [Figueiredo, 2013]) n/l,c/d LikeCnt Z + The num b er of likes of the video ([Borghol et al., 2012]) n/l,c/d DislCnt Z + The num ber of dislikes of the video ([Borghol et al., 2012]) n/l,c/d MinRat Z 5 The minim um rating assigned to the video ([Borghol et al., 2012]) - MaxRat Z 5 The maxim um rating assigned to the video ([Borghol et al., 2012]) - AvgRat [1 , 5] The av erage rating assigned to the video ([Borghol et al., 2012]) - RatCnt Z + The num ber of ratings assigned to the video ([Borghol et al., 2012]) n/l,c/d Update Z + The num b er of days passed from the last update date ([Borghol et al., 2012]) n/l 10 A. Drutsa et al., “Prediction of Video P opularity in the Absence of Reliable Data from Video Hosting Services: Utilit y ...” T able 2: List of features from LOG and WEB that are used to predict video p opularity ( all of them are nov el in the context of video p opularit y prediction ). F eature set Name V alues Description (all of them are new ) Mo des Ψ ψ D ψ LOG 3. Dynamic fe atur es fr om lo gs of Y andex LOG S 3.a. Dynamic fe atur es fr om se ar ch lo gs of Y andex ShowURL Z + The num b er of shows of the video URLs on SERP n/l,c/d ClickURL Z + The num b er of clicks on the video URLs on SERP n/l,c/d CTR [0 , 1] The clic k–through rate of the video URLs on SERP c/d LOG B 3.b. Dynamic fe atur es fr om br owsing lo gs of Y andex BrowVisit Z + The num b er of visits of the video URLs registered in browsing logs n/l,c/d WEB 4. Dynamic fe atur es fr om the Web WEB ag 4.a. Dynamic aggr e gate d fe atur es fr om the Web EmbCnt Z + The num b er of all embeds of the video n/l,c/d EmbHCnt Z + The num b er of all hosts with embeds of the video n/l,c/d MaxEPerH Z + The maximum number of embeds of the video p er host n/l,c/d AvgEPerH R + The average num ber of embeds of the video p er host n/l,c/d MaxEPerP Z + The maximum num b er of embeds of videos per page n/l,c/d AvgEPerP R + The av erage num b er of embeds of videos per page n/l,c/d FirstEmb Z + The num b er of da ys passed since the first embed of the video n/l LastEmb Z + The number of days passed since the last embed of the video n/l AvgEmb R + The a verage number of days passed since any embed of the video n/l LinkCnt Z + The num b er of all links to the video n/l,c/d LinkHCnt Z + The num b er of all hosts with links to the video n/l,c/d MaxLPerH Z + The maximum num b er of links to the video p er host n/l,c/d AvgLPerH R + The av erage num b er of links to the video p er host n/l,c/d FirstLink Z + The n umber of days passed since the day of the first link n/l LastLink Z + The num ber of days passed since the video w as linked last time n/l AvgLink R + The av erage num ber of days passed since there w as any link to the video n/l WEB nag 4.b. Dynamic non-aggr e gate d fe atur es fr om the Web EmbedHost E The host list with embed timestamps of the video (preprocessed into the outcomes of the LIM) n/l,c/d LinkHost L The host list with link timestamps of the video (pre- processed into the outcomes of the LIM) n/l,c/d 11 A. Drutsa et al., “Prediction of Video P opularity in the Absence of Reliable Data from Video Hosting Services: Utilit y ...” the feature name suffixes “ [c] ” and “ [d] ”, correspondingly . F or instance, EmbCnt[c] is the n umber of embeds that a video received during its existence up to the current time moment t c , whereas EmbCnt[d] is the num b er of embeds that the video received during the last day before the current time moment t c , that is [ t c − 1 , t c ). W e split the features from the hosting pro vider into the dynamic feature set API D and the static feature set API S . The static feature set consists of the set API Sv of features ab out the video and the set API Sa of features about the author of the video. The features from the sets LOG and WEB are dynamic. The feature set LOG extracted from the logs of Y andex, w e split into the features from the search logs LOG S and the features from the browsing logs LOG B . The feature set WEB extracted from the publicly av ailable web resources are based on monitoring b oth embeds of and links to the videos. W e split them in to aggregated features WEB ag and non-aggregated features WEB nag . Non-aggregated features are introduced only to use them within the linear influence model describ ed in Section 7. The difference b et ween aggregated and non-aggregated features consists in the following. An aggregated feature is a feature that aggregates the information ab out a n umber of elementary features, that are called non-aggr e gate d fe atur es . F or instance, the fact of the video’s em b ed(s) at a sp ecific web site (host) can b e represen ted by an elementary non- aggregated feature. Usually , because of their large num b er, such features are aggregated in a small n umber of features with each of them represen ting some asp ect (e.g., the total num b er of hosts that hav e at least one embed of or a link to the video). In our pap er, for a non-aggregated em b ed feature, we hav e feature v alue space E that has the form E = (2 T × N ) c e , where c e = |H 0 | is the num b er of used hosts and each element ( t, n ) ∈ T × N corresp onds to the even t that a particular host embeds a video n times at its n pages at the t -th day since the video creation. The feature v alue space L in the case of links is of the same form as E . Finally , the table provides the information about which features were previously in vestigated in the literature devoted to video p opularity (column “Description (previously used or new)” 8 ). F rom that one can learn that feature sets API Sa and API D are entirely previously in vestigated, while the feature set API Sv con tains features that are not previously in vestigated. W e unite previously inv estigated features of the set API Sv in the set denoted by API Svb = { Dur, Cat, TitleLen, DescLen } . Then all previously in vestigated features are united in the set denoted b y BASE . lit = API Svb ∪ API Sa ∪ API D . So, the set BASE.lit is our first baseline feature set ( r elate d work b ase d b aseline ). At the same time, we will consider all features that w e could extract from the data acquired from the hosting pro vider’s API (as of January 2014) as our second baseline feature set ( API b aseline ), that is the set API = API S ∪ API D . At last, w e define a short synonymous notation for the set of all features ALL = API ∪ WEB ∪ LOG . 7 Mo dels 7.1 General mo del Since our main goal is to compare differen t features, we use the same prediction mo del for all features. W e considered a state-of-the-art F rie dman ’s gr adient b o osting de cision tr e e mo del [F riedman, 2001] and a traditional line ar r e gr ession mo del . The mo del’s characteristics are de- scrib ed more precisely at the beginning of Section 8. F or non-aggregated features we implemen t the linear influence mo del , which is describ ed further in this subsection. The predictions of the linear influence model are com bined with other aggregated features, that is, we use them as additional features of decision tree models. 8 The italic style of the reference means that the feature was just inv estigated for some other task, but was not used to predict p opularity . 12 A. Drutsa et al., “Prediction of Video P opularity in the Absence of Reliable Data from Video Hosting Services: Utilit y ...” 7.2 Linear influence mo del The line ar influenc e mo del ( LIM ) w as introduced in [Y ang and Lesko vec, 2010], where it was used to predict diffusion of hashtags o ver Twitter net work and diffusion of memes (short textual phrases) ov er news articles and blog p osts. The mo del’s implementation asp ects and mo difi- cations were discussed later in [W ang et al., 2013]. The main adv antage of the mo del consists in that it does not require any kno wledge of the netw ork structure where the information is spreading. In our work, w e consider a video v ∈ V as some infection. It diffuses through implicit net w ork of users and web sites (or hosts ). A video infects users when they watc h it and it infects hosts if they contain web pages with an em b ed of the video or a link to the video web page. So, the diffusion netw ork could b e represented as a bipartite graph, where the first lay er of no des is a set of users U and the second la yer of no des is a set of web sites (hosts) H . Then, the linear influence mo del states that eac h no de h ∈ H p ossesses a particular influence function I h : { 0 , .., ( L − 1) } → R + , where L is the size of the function domain . The v alue I h ( t ) is equal to the n umber of no des from U that will b e infected by the node h during the t -th da y after the node h was infected, that is, during the time p erio d [ t h + t − 1 , t h + t ), where t h ∈ T is the time momen t when the no de h w as infected. Then the num b er of views of a video in a particular da y equals to the outcomes of a sum of the influence functions of previously infected hosts (see [Y ang and Lesko vec, 2010] for details). Th us, on the one hand, the n umber of views of a video v ∈ V is exactly the num b er of times when the nodes from the set U were infected. On the other hand, the op erating compan y cannot observ e particular user infections, but can observe a subset of web sites H 0 ⊂ H and fix the time when some of them embed the video (or create a link to the video web page), and hence b ecome infected. T o the best of our knowledge, we are the first who introduced the application of the linear influence model to a bipartite graph, where eac h part has its own criteria for infection and where a prediction of infection spread of the one part is made based on the infection spread observ ed in the other. Since we in vestigated the case when negativ e v alues of influence functions are allow ed (sometimes, the fact of an embed at a particular highly sp ecialized host may indicate that the video will not b e p opular), hence the LIM prediction problem is reduced to the least squares problem with a sparse matrix. Thus, the LIM allows us to use video features in non-aggregated forms. The outcomes predicted by LIM are used as features of our general model (see Section 8). 8 Exp erimen tal setup 8.1 Mo del settings As it was stated ab ov e, the main ob jective of our study is an inv estigation of the wide range of a v ailable data for the task of video p opularit y prediction. Th us, we use the same machine learn- ing algorithm for all exp eriments conducted in our w ork, except for the case of non-aggregated features WEB nag , where we use the LIM (see Section 7). In all describ ed exp erimen ts of our w ork, we used a proprietary implementation of the gradient b o osted decision tree-based ma- c hine learning algorithm [F riedman, 2001] with 1000 iterations and 1000 trees, which app eared to b e the b est settings on the v alidation data. During our exp erimen tation, we also utilized the traditional line ar r e gr ession mo del , how ever, this mo del demonstrated a considerably worse p er- formance with resp ect to the decision trees (by a minimum margin of 10% in our exp eriments). As it was stated in Section 7, the linear influence model has the following parameters: the size L of the influence function domain, the size | T | of the learning time p erio d, the learning set H 0 of hosts, the training set V 0 of videos (infections). Since prediction of video p opularit y with 13 A. Drutsa et al., “Prediction of Video P opularity in the Absence of Reliable Data from Video Hosting Services: Utilit y ...” T able 3: Baseline comparison in terms of the av erage normalized RMSE ov er first 14 days since video creation (in % with respect to API ). F eatures T argets ( θ ∈ Θ ) log -transformed non-transformed cum ulative daily cum ulative daily API 0 . 356 0 . 435 0 . 822 0 . 91 BASE.lit + 0 . 79 % +3 . 02% + 0 . 81 % +3 . 92% API Sv +154 . 96% +112 . 91% +21 . 68% +9 . 85% API Sa +38 . 44% +33 . 08% +11 . 82% +6 . 78% API D +53 . 54% +26 . 99% +2 . 26% +1 . 73% API Sa ∪ API D +4 . 03% +2 . 95% − 0 . 3 % − 0 . 63 % API Sv ∪ API D +33 . 75% +16 . 45% +2 . 67% +1 . 62% API Sv ∪ API Sa +33 . 93% +29 . 53% +12 . 62% +6 . 64% LIM model is computationally exp ensiv e (though the problem matrix is sparse, what seriously decreases the n umber of elementary operations), we implemen ted the LIM solver on a distributed cluster system with the proprietary MapReduce technology [Dean and Ghemaw at, 2008] that allo wed to train the mo del using more than 8 · 10 6 training videos in acceptable time. W e conducted a series of exp erimen ts in order to determine how the LIM parameters affect the prediction quality . W e found that for different zones of the set of target days T the mo del has different optimal parameters L and | T | . Th us, w e learn 12 LIMs on the Dataset#2 with differen t v alues of the parameters b oth for embed data and for link data. As a result, we obtained 6 influence functions p er host (with the top-1280 hosts ranked b y total num b er of em b eds ( |H 0 | = 1280), the domain size L ∈ { 1 , 10 , 20 } , and the sizes | T | were chosen equal to optimal v alues p er each L ). The outcome of each of these functions is a quadruple (non- /log-transformed cumulativ e/daily p opularit y). Thus, 12 LIM functions contributed 48 features studied in the exp erimen ts describ ed further in Section 9. 8.2 T arget and target days In accordance with our problem statement (Section 4), we run our mo dels for each of the target da ys t t ∈ T ∗ , i.e., for 1 , . . . , 14 days since video creation time, and for all targets from Θ , see Eq. (2). W e address b oth types of prediction tasks: • the curren t p opularit y prediction, i.e., where the current time momen t equals to the target one: t c = t t ; • the future popularity prediction with forecast days 1 , . . . , 13, i.e., where the current time momen t is low e r than the target one by an increment δ : t c = t t − δ , δ = 1 , 2 , . . . , t t − 1. 8.3 P erformance measures Since, the v alues of RMSE are not normalized, they v ary considerably dep ending on the target time t t 9 and that could make it difficult to interpret results. Therefore, in the ma jor part of the results we will normalize the RMSE v alues b y the RMSE v alues of the baseline BASE . avg (see 9 It is caused by a large difference in the n umber of views for differen t days. The v ariation of non-normalized RMSE could be seen in Figure 3 at the next exp eriment discussions. 14 A. Drutsa et al., “Prediction of Video P opularity in the Absence of Reliable Data from Video Hosting Services: Utilit y ...” Section 9.1 for its description) for each set of features Ψ and for eac h t t ∈ T ∗ and t c = t t − δ , δ = 1 , 2 , . . . , t t − 1: nRMSE( Ψ , t c ; θ, t t ) = RMSE( Ψ , t c ; θ, t t ) RMSE( BASE . avg , t c ; θ, t t ) . After normalization one could obtain the a verage normalized RMSE (AnRMSE) ov er all target da ys T ∗ , e.g., for the current p opularit y prediction case t c = t t : AnRMSE( Ψ ; θ ) = | T ∗ | − 1 · X t t ∈ T ∗ nRMSE( Ψ , t t ; θ, t t ) . As the second p erformance measure, we will use normalize d disc ounte d cumulative gain [J¨ arvelin and Kek¨ al¨ ainen, 2002] ( NDCG@100 ) ov er the top-100 results predicted as the most p opular by our methods. W e consider this measure as the most relev ant to our study as it directly reflects the profit that an operating compan y (and, especially , a search engine) may receiv e from a high qualit y p opularit y prediction mechanism. In our w ork, the gain of a ranked video equals to 1 / (p os + 1) (where pos is the p osition of the video in the (ideal) list, in which videos are ranked by the actual target v alue) by the target v alue for the first 100 most p opular videos, and equals to 0, if the ranked video do es not b elong the the top-100 videos of that ideal ranking. 8.4 T est and training data sets split W e split the Dataset#1 randomly in to three equal parts as it is done in [Szab o and Hub erman, 2010, Pin to et al., 2013, Ahmed et al., 2013] for video popularity prediction. The first part is used as the test data, the second one serv es as the training data and the third part is used as the v alidation set. W e rep eated this procedure 20 times in order to apply the p air e d two-sample t-test and measure the significance level of the obtained results. All differences in the presented results hav e p-v alue < 0 . 05. 9 Exp erimen t Results Our results for forecasting (i.e., t c < t t ) are very similar to the results for current p opularity prediction (i.e., t c = t t ). Hence, in the subsections where w e compare feature sets and models (i.e., in Sections 9.1, 9.2, 9.3, and 9.5), w e describ e only the results for the latter one, which we consider a no vel and more relev an t task for our study . On the contrary , the analysis of the p er- formance of future p opularit y prediction with different forecasting horizons and its comparison with the one of current p opularit y prediction are done in Section 9.4. 9.1 Baselines Before the start of our inv estigation of the web and internal log data utility , we describe our baseline metho ds. W e hav e implemented the following baselines: • the predictions based on all API features ( API ); • the predictions based on the API features used previously in the related studies ( BASE . lit ) (see Sections 2 and 6); 15 A. Drutsa et al., “Prediction of Video P opularity in the Absence of Reliable Data from Video Hosting Services: Utilit y ...” T able 4: Comparison of API, W eb and Log feature sets in terms of the a verage normalized RMSE ov er first 14 days since video creation (in % with resp ect to API ). F eatures T argets ( θ ∈ Θ ) log -transformed non-transformed cum ulative daily cum ulative daily API 0 . 356(0%) 0 . 435(0%) 0 . 822(0%) 0 . 91(0%) API ∪ LOG − 1 . 4% − 1 . 53% − 2 . 61% − 0 . 27% API ∪ WEB − 1 . 19% − 0 . 8% − 10 . 15% − 4 . 36% ALL − 2 . 37 % − 2 . 11 % − 10 . 7 % − 4 . 28% ALL \ WEB nag − 2 . 35 % − 2 . 09 % − 10 . 72 % − 4 . 75% API ∪ WEB ag − 1 . 17% − 0 . 8% − 10 . 11% − 5 . 29 % LOG +156% +106 . 94% +18 . 29% +8 . 49% WEB +142 . 21% +98 . 12% +8 . 59% +3 . 74% WEB ∪ LOG +132 . 74% +89 . 07% +4 . 64% +3 . 75% WEB ag ∪ LOG +132 . 74% +89 . 07% +4 . 46% +3 . 92% WEB nag +143 . 01% +99 . 72% +9 . 18% +6 . 05% WEB ag +142 . 21% +98 . 12% +9 . 13% +4 . 89% • the naive a verage prediction mo del, whic h, for eac h video from the test data set, predicts the target v alue as the av erage of the corresp onding target v alues on the training data set for all videos. This baseline is denoted by BASE . avg . The a verage normalized RMSE v alues for the baseline metho ds are presented in T able 3 (except for BASE . avg whose AnRMSE is equal to 1). In the table, w e compare the strength of feature sets BASE . lit , API Sv , API Sa , API D , API Sa ∪ API D , API Sv ∪ API D , and API Sv ∪ API Sa b y lo oking at the relativ e change of the metric against the full API feature set API . On the one hand, one could see that the set API outp erforms the set BASE . lit for all targets and mainly in daily views, b oth transformed and not. On the other hand, the set API Sa ∪ API D mak es the ma jor contribution to the qualit y of prediction of the API set: it has no noticeable difference for non-transformed targets and loses a little bit on the log -targets. Th us, further in the paper w e will use only the b est baseline using all API features. 9.2 W eb and logs vs API The feature set All outperforms the API features. Thus, the web and log data notably impro ve the video p opularity prediction qualit y in terms of all targets. This result could b e seen in T able 4 and serves as the answ er to the RQ1 . In the same table, w e compare all other feature sets with the API baseline and with each other. One could see that the absence of API data has the most dramatic effect for l og -transformed targets and only sligh tly reduces the video p opularity prediction quality for non-transformed targets ( API vs WEB ∪ LOG ). W e conclude that the W eb and the Log data could not completely replace API data for the purp oses of the video p opularity prediction in terms of exact v alues aggregated for 14 days. A completely different picture is observed for sp ecific days (see further) and for ranking measures (see Section 9.5). At the same time one can see that the embed and link data ( WEB ) impro ve the qualit y b etter than the in ternal log data ( LOG ) of the op erating compan y b oth indep enden tly ( WEB vs LOG ) and together with other features ( API vs API ∪ WEB vs API ∪ LOG ), ( ALL vs API ∪ WEB vs API ∪ LOG ). One could also see that the non-aggregated w eb features ( WEB nag ) used noticeably improv e prediction quality of the aggregated ( WEB ag ) for 16 A. Drutsa et al., “Prediction of Video P opularity in the Absence of Reliable Data from Video Hosting Services: Utilit y ...” Figure 3: Comparison of API, W eb and Log feature sets in terms of the RMSE (on the left) and the normalized RMSE (on the right) for each of the first 14 days since video creation for the target Views [ c ]. non-transformed targets: by 1.14% for daily and by 0.54% for cum ulative views ( WEB vs WEB ag ). It is an imp ortan t result given that w e study the p otential of an op erating company to work in the absence of access to APIs. In Figure 3, w e demonstrate the v alues of the RMSE and the normalized RMSE measures p er each da y for the non-transformed cumulativ e target for the feature sets API , ALL , LOG , WEB , and WEB ∪ LOG . Wherein, on the one hand, one c ould see that the API features lose qualit y with the gro wth of the n umber of the days passed since the video upload. The same situation is observ ed with the whole feature set ALL (which includes API features). On the other hand, the W eb and Log data improv e the quality of prediction of exact v alues of views with the growth of t t at least to the end of the first w eek of the video existence, and ar e able to c omp ensate for the absenc e of API starting fr om the 8th day . It is the partial answer to the R Q2 (Section 9.5 has an extended and more definitive answ er to RQ2 ). 9.3 Replacing parts of API with W eb/Log data W e split the API feature set into the following groups (see the notations in T able 1): • temp oral con text, tc = { UplHour, Update, UplDOW } ; • static video properties, sv= { Cat, Dur, TitleLen, DescLen } ; • user feedback, uf = { Min/Max/AvgRat, Like/DislCnt, RatCnt, CommCnt } ; • author rating, ar = { AuthAge, AUplCnt, AViewSum } ; • so cial en vironment, se = { FrndCnt, SubsCnt } . W e measure the quality for the feature sets ( API \ group ) and ( ALL \ group ) by removing each group ∈ { tc , sv , uf , ar , se } from API and ALL feature sets resp ectiv ely . The obtained results for cumulativ e views 10 are presented in T able 5, where the columns “ API \ group ” sho w ho w m uch the prediction quality falls when a particular group b ecomes una v ailable via API, and the columns “ ALL \ group ” sho w how muc h the prediction qualit y restores when we replace this group b y the W eb and the Log features. It is seen from the 10 the results for daily views are similar 17 A. Drutsa et al., “Prediction of Video P opularity in the Absence of Reliable Data from Video Hosting Services: Utilit y ...” T able 5: Ablation of feature groups from API set with their further replacement by the W eb and Log features. All results are in terms of the av erage normalized RMSE ov er first 14 days since video creation (in % with resp ect to the feature set API ). group Cum ulative n umber of views ( θ ∈ Θ ) log -transformed non-transformed API \ group ALL \ group API \ group ALL \ group tc +0 . 43% − 1 . 97 % +0 . 02% − 10 . 8 % sv +3 . 95% + 1 . 28 % − 0 . 8% − 10 . 81 % uf +27 . 6% +20 . 27% +12 . 11% − 2 . 87 % ar +18 . 6% +14 . 59% +1 . 14% − 9 . 91 % se +3 . 73% + 0 . 82 % +1 . 56% − 9 . 53 % table that the absence of the user fe e db ack feature group has the most dramatic effect for b oth targets. The absence of the temp or al c ontext , static vide o pr op erties , and so cial envir onment feature groups has no significant consequences and could b e easily replaced by the W eb and the Log feature sets without any loss in the prediction qualit y . Finally , we conclude that the Web and L o g data c ould c omp ensate for the absenc e of any of the studie d p arts of r eliable API data without any loss in the quality and even with a solid profit, in fact. It is the answer to the RQ3 . 9.4 Dela y in data cra wling The prediction quality is also affected b y the dela y in data crawling. In order to study this influence, we fix the target da y t t and measure the quality for the feature set ALL , considering eac h day from the first day since video creation to this target day t t as the current da y t c , i.e., t c = t t − δ , δ = 0 , .., 13. In other words, we predict the current video p opularit y at the day t t , as if we are in the past with data collected at the day t c . The relativ e v alues of nRMSE (in terms of % with resp ect to the one for t c = 1) are presen ted in Fig. 4 for t t = 7 and 14, for eac h target θ ∈ Θ. W e see that the shorter the crawling dela y δ the better the prediction p erformance. How ever, for the target da y t t = 7, ev en a delay in one da y leads to a noticeable quality drop (up to 2 . 5% for daily views), while, for the target da y t t = 14, such delay leads to a less dramatic qualit y drop (up to 1% for daily views). W e conclude that the sp e e d of cr aw ling (b oth of API, and of WEB data) has a str ong influenc e on the p opularity pr e diction p erformanc e, and the closer the pr e diction tar get day to the vide o cr e ation moment, the mor e critic al this influenc e is . 9.5 Ranking metric qualit y One of the main applications of video p opularity prediction is the prop er ranking of the videos by their p opularit y . F or instance, it allows the op erating compan y to show the most p opular videos on the main page, which alwa ys attracts a large share of user traffic 11 . Th us, we inv estigate ho w the qualit y measured in ranking metrics c hanges ov er predictions based on different feature sets. In T able 6, we presen t the a verage NDCG@100 ov er first 14 da ys for 7 main feature sets: API , ALL \ WEB nag , ALL , LOG , WEB ag , WEB , and WEB ∪ LOG . As one could see, the feature set ALL clearly outp erforms the feature set API for all listed targets, and esp ecially when w e optimize prediction of non-transformed targets. Moreov e r, one could see that WEB and WEB ∪ LOG notably outperform the baseline for cumulativ e targets, and 11 e.g., Bing shows “most w atched” videos at its main Video searc h page: http://www.bing.com/videos/bro wse 18 A. Drutsa et al., “Prediction of Video P opularity in the Absence of Reliable Data from Video Hosting Services: Utilit y ...” Figure 4: Prediction quality change of the feature set ALL with resp ect to different v alues of the curren t da y t c : from the first day since video creation to the target day t t (7 or 14) (in % with resp ect to nRMSE of the data observ ed in the first da y). T able 6: Comparison of API, W eb and Log feature sets in terms of a verage NDCG@100 o ver first 14 days since video creation for targets optimized b y minimizing RMSE (in % of NDCG@100 with resp ect to API p erformance). F eatures Cum ulative targets ( θ ∈ Θ ) Daily targets ( θ ∈ Θ ) log -transformed non-transformed log -transformed non-transformed API 0 . 391 0% 0 . 334 0% 0 . 37 0% 0 . 361 0% All \ WEB nag 0 . 466 + 19 . 25 % 0 . 506 +51 . 62% 0 . 398 +7 . 45% 0 . 495 +37 . 13% All 0 . 426 +8 . 86% 0 . 511 + 53 . 06 % 0 . 398 + 7 . 5 % 0 . 499 + 38 . 2 % LOG 0 . 235 − 39 . 86% 0 . 136 − 59 . 24% 0 . 236 − 36 . 16% 0 . 137 − 62 . 01% WEB ag 0 . 435 +11 . 20% 0 . 406 +21 . 59% 0 . 337 − 8 . 89% 0 . 332 − 7 . 97% WEB 0 . 442 +12 . 85% 0 . 405 +21 . 28% 0 . 34 − 8 . 16% 0 . 337 − 6 . 75% WEB ∪ LOG 0 . 464 +18 . 48% 0 . 455 +36 . 4% 0 . 37 0% 0 . 378 +4 . 74% WEB ∪ LOG sligh tly outp erforms the baseline or at least has the same v alue as the baseline for daily targets. Thus, one c ould c onclude that for purp oses of r anking tasks the Web and L o g data c ould c ompletely r eplac e the API data (if a company does not ha ve its o wn logs, then still W eb data outp erforms API data for cumulativ e views). It is the answer to the RQ1 and RQ2 . That means that if the task of an op erating company is to presen t the lists of the most p opular videos for the OC’s users, then: (a) it can b e done indep enden tly from video service hostings, and (b) its costs on crawling and pro cessing of embed and link data are justified. T able 6 sho ws that implemen tation of the non-aggregated web features has a solid profit: their usage impro ves the prediction qualit y of aggregated features with respect to b oth the W eb features only ( WEB vs WEB ag : by 1.65% for cumulativ e, 0.73% for daily log-transformed views, and 1.22% for daily views without transformation) and all features ( ALL vs ALL \ WEB nag : b y 1.44% for cumulativ e and 1.07% for daily views without transformation). F rom T able 6 one could also learn another lesson. Since the logarithmic transformation is monotonic, the original ranks of videos b oth in terms of the l og -transformed and non- transformed target v alues are the same. Th us, the difference in a verage NDCG@100 v alues for the log -transformed and non-transformed targets giv es the answer to the question: Does the log-transformation of views in the optimization of RMSE improv e the ranking results? W e underlined the b est result b etw een them for each feature set, indep enden tly b oth for cumulativ e and for daily views. One can conclude that the tr ansformation gives signific ant impr ovement for 19 A. Drutsa et al., “Prediction of Video P opularity in the Absence of Reliable Data from Video Hosting Services: Utilit y ...” some, but not al l sets of fe atur es. The improv ement is more visible for cumulativ e views than for the daily ones. 10 Conclusions W e inv estigated the utility of newly prop osed data sources (the embeds of and the links to videos publicly av ailable on the W eb and internal logs of Y andex) for the task of video popu- larit y prediction and compared them with the data provided b y the video hosting via its API. W e prepared more than 100 features collected from all a v ailable data sources and to answer to a n umber of related research questions. W e used both simple feature models, and more com- plicated feature mo dels (the linear influence mo del that utilizes the features in non-aggregated form). W e found that the new data sources allo w to impro v e the video p opularit y prediction qualit y , and they are able to comp ensate for the absence of API starting from the 8th day since the da y of the video upload, if a company is in terested in prediction of exact v alues of the current p opularit y . The new data could also comp ensate for an y of the missing groups of API features that we considered in our study . W e also examined the case with a p opular search engine, which predicts p opularit y of videos in order to presen t them in a prop er order to its users. In that case we compared the relative p erformance b etw een feature sets in terms of the ranking measure NDCG@100. W e found that the web and log data could replace and even outp erform the API data. As future w ork we can, first, extend the set of feature source groups b y in vestigating the data obtained from the API of another con tent op erating compan y . Second, we can train differen t predictors for differen t topical categories of videos. Third, we can also experiment with training not the regression function and optimizing for RMSE, but a classifier to predict if the video b elongs to the set of the most or the least popular ones. Finally , it would be interesting to study ho w to use online user feedback received on a list of the most p opular videos presented on the main page in order to correct the prediction in real-time. References [Abishev a et al., 2014] Abishev a, A., Garimella, V. R. K., Garcia, D., and W eb er, I. (2014). Who watc hes (and shares) what on youtube? and when?: using twitter to understand y outub e view ership. In Pr o c e e dings of the 7th ACM international c onfer enc e on Web se ar ch and data mining , pages 593–602. ACM. [Ahmed et al., 2013] Ahmed, M., Spagna, S., Huici, F., and Niccolini, S. (2013). A p eek in to the future: predicting the evolution of popularity in user generated con tent. In Pr o c e e dings of the sixth ACM international c onfer enc e on Web se ar ch and data mining , pages 607–616. A CM. [Borghol et al., 2012] Borghol, Y., Ardon, S., Carlsson, N., Eager, D., and Mahanti, A. (2012). The un told story of the clones: con tent-agnostic factors that impact y outub e video p opularit y . In Pr o c e e dings of the 18th ACM SIGKDD international c onfer enc e on Know le dge disc overy and data mining , pages 1186–1194. ACM. [Bro xton et al., 2013] Broxton, T., In terian, Y., V av er, J., and W attenhofer, M. (2013). Catch- ing a viral video. Journal of Intel ligent Information Systems , 40(2):241–259. 20 A. Drutsa et al., “Prediction of Video P opularity in the Absence of Reliable Data from Video Hosting Services: Utilit y ...” [Crane and Sornette, 2008] Crane, R. and Sornette, D. (2008). Robust dynamic classes rev ealed b y measuring the resp onse function of a so cial system. Pr o c e e dings of the National A c ademy of Scienc es , 105(41):15649–15653. [Dean and Ghemaw at, 2008] Dean, J. and Ghemaw at, S. (2008). Mapreduce: simplified data pro cessing on large clusters. Communic ations of the ACM , 51(1):107–113. [Ding et al., 2015] Ding, W., Shang, Y., Guo, L., Hu, X., Y an, R., and He, T. (2015). Video p opularit y prediction by sen timent propagation via implicit netw ork. In Pr o c e e dings of the 24th ACM International on Confer enc e on Information and Know le dge Management , pages 1621–1630. ACM. [Figueiredo, 2013] Figueiredo, F. (2013). On the prediction of p opularit y of trends and hits for user generated videos. In Pr o c e e dings of the sixth ACM international c onfer enc e on Web se ar ch and data mining , pages 741–746. A CM. [Figueiredo et al., 2011] Figueiredo, F., Benev enuto, F., and Almeida, J. M. (2011). The tub e o ver time: c haracterizing p opularit y growth of youtube videos. In Pr o c e e dings of the fourth A CM international c onfer enc e on Web se ar ch and data mining , pages 745–754. ACM. [F ontanini et al., 2016] F ontanini, G., Bertini, M., and Del Bimbo, A. (2016). W eb video p opu- larit y prediction using sentimen t and conten t visual features. In Pr o c e e dings of the 2016 ACM on International Confer enc e on Multime dia R etrieval , pages 289–292. ACM. [F riedman, 2001] F riedman, J. H. (2001). Greedy function approximation: a gradient bo osting mac hine. Annals of statistics , pages 1189–1232. [Gon¸ calv es et al., 2010] Gon¸ calv es, M. A., Almeida, J. M., dos Santos, L. G., Laender, A. H., and Almeida, V. (2010). On p opularit y in the blogosphere. IEEE Internet Computing , 14(3):42–49. [He et al., 2014] He, X., Gao, M., Kan, M.-Y., Liu, Y., and Sugiyama, K. (2014). Predicting the p opularit y of w eb 2.0 items based on user comments. In Pr o c e e dings of the 37th international A CM SIGIR c onfer enc e on R ese ar ch & development in information r etrieval , pages 233–242. A CM. [Hogg and Lerman, 2012] Hogg, T. and Lerman, K. (2012). So cial dynamics of digg. EPJ Data Scienc e , 1(1):1–26. [Hong et al., 2011] Hong, L., Dan, O., and Davison, B. D. (2011). Predicting p opular messages in twitter. In Pr o c e e dings of the 20th international c onfer enc e c omp anion on World wide web , pages 57–58. ACM. [J¨ arvelin and Kek¨ al¨ ainen, 2002] J¨ arv elin, K. and Kek¨ al¨ ainen, J. (2002). Cumulated gain-based ev aluation of ir techniques. ACM T r ansactions on Information Systems (TOIS) , 20(4):422– 446. [Jiang et al., 2014] Jiang, L., Miao, Y., Y ang, Y., Lan, Z., and Hauptmann, A. G. (2014). Viral video style: a closer lo ok at viral videos on y outub e. In Pr o c e e dings of International Confer enc e on Multime dia R etrieval , page 193. ACM. [Kim et al., 2012] Kim, G., F ei-F ei, L., and Xing, E. P . (2012). W eb image prediction using m ul- tiv ariate p oint pro cesses. In Pr o c e e dings of the 18th ACM SIGKDD international c onfer enc e on Know le dge disc overy and data mining , pages 1068–1076. ACM. 21 A. Drutsa et al., “Prediction of Video P opularity in the Absence of Reliable Data from Video Hosting Services: Utilit y ...” [Kupa vskii et al., 2012] Kupavskii, A., Ostroumov a, L., Umnov, A., Usac hev, S., Serdyuko v, P ., Gusev, G., and Kustarev, A. (2012). Prediction of retw eet cascade size o ver time. In Pr o c e e d- ings of the 21st ACM international c onfer enc e on Information and know le dge management , pages 2335–2338. ACM. [Kupa vskii et al., 2013] Kupavskii, A., Umnov, A., Gusev, G., and Serdyuko v, P . (2013). Pre- dicting the audience size of a tw ee t. In ICWSM . [Lai and W ang, 2010] Lai, K. and W ang, D. (2010). T o wards understanding the external links of video sharing sites: measurement and analysis. In Pr o c e e dings of the 20th international workshop on Network and op er ating systems supp ort for digital audio and vide o , pages 69–74. A CM. [Lerman and Hogg, 2010] Lerman, K. and Hogg, T. (2010). Using a mo del of so cial dynamics to predict p opularit y of news. In Pr o c e e dings of the 19th international c onfer enc e on World wide web , pages 621–630. ACM. [Li et al., 2016] Li, C., Liu, J., and Ouyang, S. (2016). Characterizing and predicting the p op- ularit y of online videos. IEEE A c c ess , 4:1630–1641. [Li et al., 2013] Li, H., Ma, X., W ang, F., Liu, J., and Xu, K. (2013). On p opularit y prediction of videos shared in online so cial netw orks. In Pr o c e e dings of the 22nd ACM international c onfer enc e on Information & Know le dge Management , pages 169–178. A CM. [Pin to et al., 2013] Pinto, H., Almeida, J. M., and Gon¸ calv es, M. A. (2013). Using early view patterns to predict the p opularit y of youtube videos. In Pr o c e e dings of the sixth ACM inter- national c onfer enc e on Web se ar ch and data mining , pages 365–374. A CM. [Radinsky et al., 2012] Radinsky , K., Svore, K., Dumais, S., T eev an, J., Bo c harov, A., and Horvitz, E. (2012). Mo deling and predicting behavioral dynamics on the web. In Pr o c e e dings of the 21st international c onfer enc e on World Wide Web , pages 599–608. ACM. [So ysa et al., 2013a] Soysa, D. A., Au, O. C., Sun, L., Xu, L., Li, J., and Chen, D. G. (2013a). Adv anced indep endent cascade mo del for y outub e conten t propagation in faceb o ok. In Signal and Information Pr o c essing (ChinaSIP), 2013 IEEE China Summit & International Confer- enc e on , pages 481–485. IEEE. [So ysa et al., 2013b] Soysa, D. A., Chen, D. G., Au, O. C., and Bermak, A. (2013b). Predict- ing youtube con tent p opularit y via faceb ook data: A netw ork spread mo del for optimizing m ultimedia delivery . In Computational Intel ligenc e and Data Mining (CIDM), 2013 IEEE Symp osium on , pages 214–221. IEEE. [Szab o and Hub erman, 2010] Szab o, G. and Hub erman, B. A. (2010). Predicting the popularity of online conten t. Communic ations of the ACM , 53(8):80–88. [T atar et al., 2012] T atar, A., Antoniadis, P ., De Amorim, M. D., and Fdida, S. (2012). Rank- ing news articles based on p opularity prediction. In Pr o c e e dings of the 2012 International Confer enc e on A dvanc es in So cial Networks Analysis and Mining (ASONAM 2012) , pages 106–110. IEEE Computer So ciet y . [T atar et al., 2014] T atar, A., An toniadis, P ., De Amorim, M. D., and Fdida, S. (2014). F rom p opularit y prediction to ranking online news. So cial Network Analysis and Mining , 4(1):1–12. 22 A. Drutsa et al., “Prediction of Video P opularity in the Absence of Reliable Data from Video Hosting Services: Utilit y ...” [Tsagkias et al., 2010] Tsagkias, M., W eerk amp, W., and De Rijke, M. (2010). News commen ts: Exploring, mo deling, and online prediction. In Eur op e an Confer enc e on Information R etrieval , pages 191–203. Springer. [W ang et al., 2013] W ang, Y., Xiang, G., and Chang, S.-K. (2013). Sparse multi-task learning for detecting influential no des in an implicit diffusion netw ork. In AAAI . [Y ang and Lesko vec, 2010] Y ang, J. and Lesk ov ec, J. (2010). Mo deling information diffusion in implicit netw orks. In 2010 IEEE International Confer enc e on Data Mining , pages 599–608. IEEE. [Yin et al., 2012] Yin, P ., Luo, P ., W ang, M., and Lee, W.-C. (2012). A straw shows which wa y the wind blows: ranking p oten tially p opular items from early votes. In Pr o c e e dings of the fifth ACM international c onfer enc e on Web se ar ch and data mining , pages 623–632. ACM. 23
Original Paper
Loading high-quality paper...
Comments & Academic Discussion
Loading comments...
Leave a Comment