Modeling the Infectiousness of Twitter Hashtags
This study applies dynamical and statistical modeling techniques to quantify the proliferation and popularity of trending hashtags on Twitter. Using time-series data reflecting actual tweets in New York City and San Francisco, we present estimates fo…
Authors: Jonathan Skaza, Brian Blais
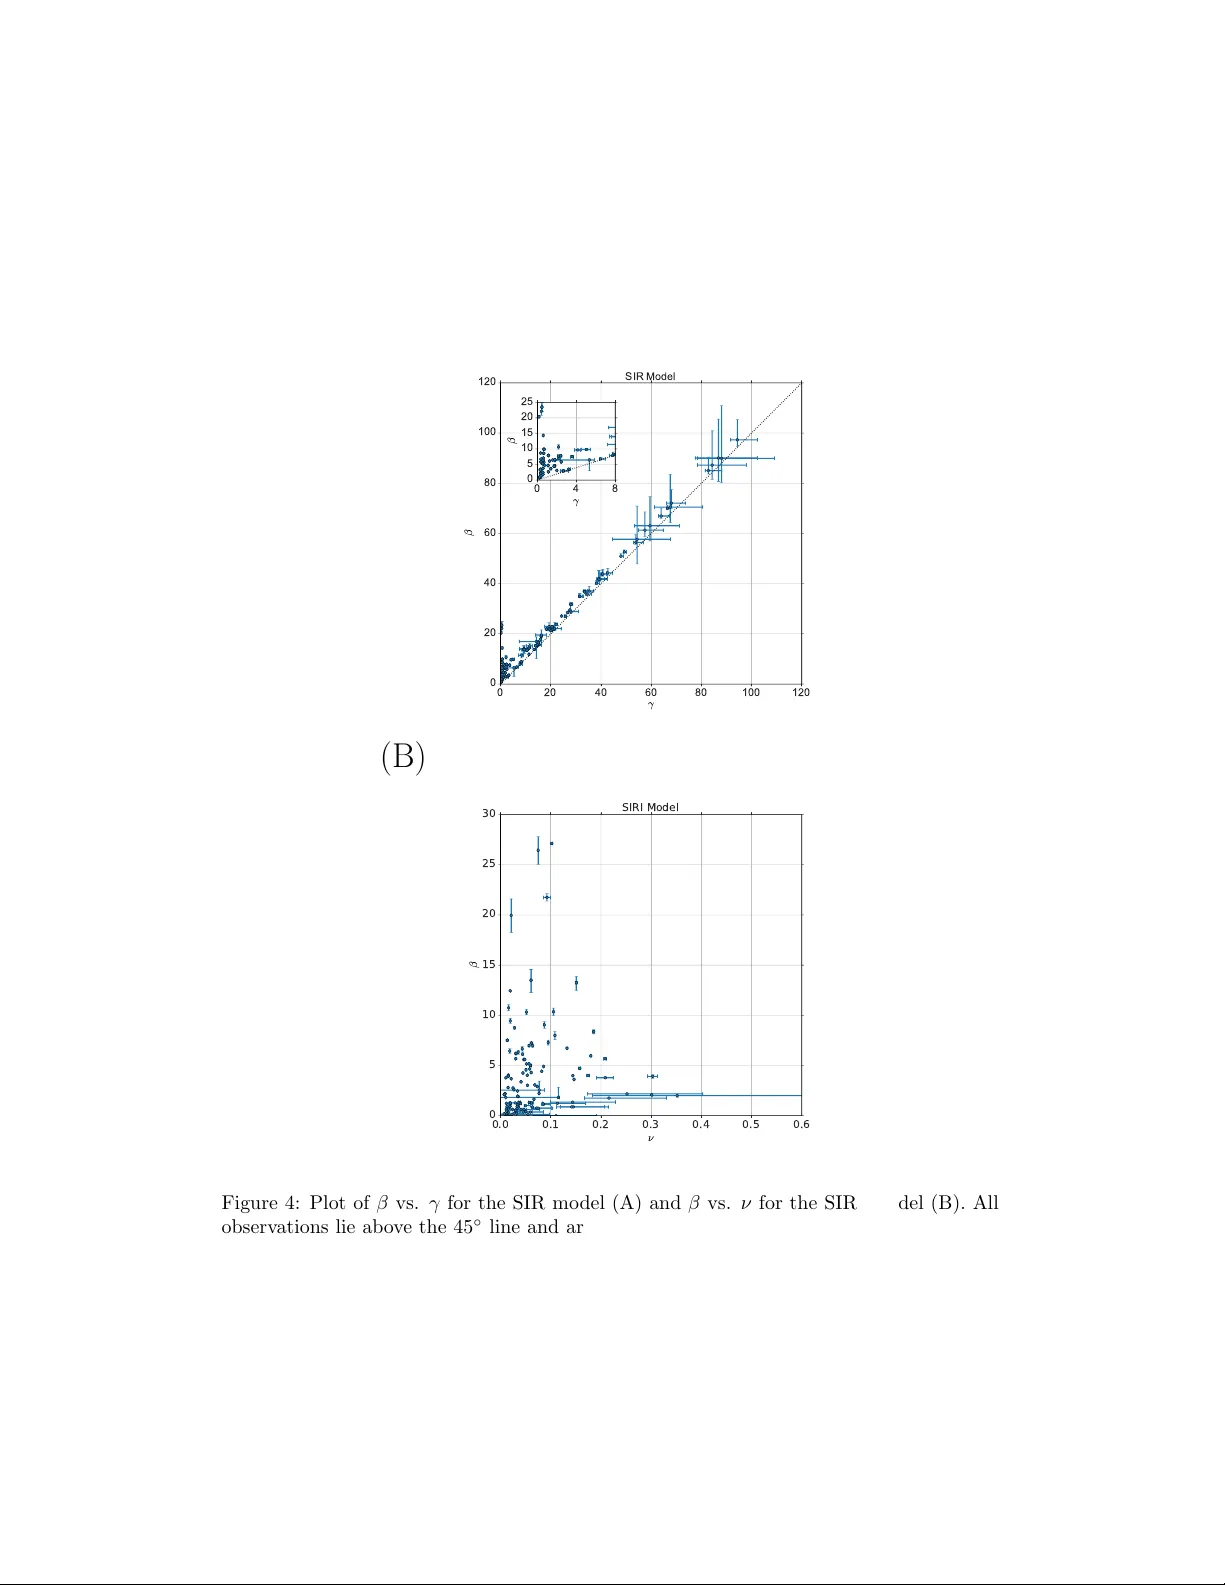
Mo deling the Infectiousness of Twitter Hash tags Jonathan Sk aza a, ∗ , Brian Blais b,c a Dep artment of Biostatistics, University of Michigan, Unite d States b Dep artment of Scienc e and T e chnolo gy, Bryant University, Unite d States c Institute for Br ain and Neur al Systems, Br own University, Unite d States Abstract This study applies dynamical and statistical mo deling tec hniques to quantify the proliferation and popularity of trending hash tags on Twitter. Using time- series data reflecting actual t weets in New Y ork City and San F rancisco, w e presen t estimates for the dynamics (i.e., rates of infection and reco v ery) of sev eral h undred trending hash tags using an epidemic mo deling framework coupled with Ba yesian Marko v Chain Monte Carlo (MCMC) metho ds. This metho dological strategy is an extension of techniques traditionally used to mo del the spread of infectious disease. W e demonstrate that in some models, hash tags can b e group ed b y infectiousness, p ossibly pro viding a metho d for quan tifying the trendiness of a topic. Keywor ds: Twitter dynamics, trending, SIR, SIRI, MCMC, information diffusion 1. In tro duction Twitter ( http://twitter.com ) is a p opular so cial net working website that allows users to both send and read messages kno wn as t weets. The so cial net working site has appro ximately 320 million monthly active users that pro duce an av erage of about 500 million tw eets per da y [1]. Twitter serves as a place for users to share anything and everything on their minds—news stories, ideas, quotes, lyrics, etc. Users are able to em b ed hash tags within their tw eets by using the hash character (i.e., # ). Hash tags are metadata tags which allow tw eets containing the text following the hash character to b e group ed together. F rom there, it is p ossible for users to query certain ∗ Corresp onding author at jskaza@umich.edu Pr eprint submitte d to Physic a A Mar ch 2, 2016 hash tags to see what is b eing discussed throughout the site. The Twitter site ev en con tains a panel of trending topics—hashtags and topics that hav e b ecome very p opular in a short p erio d of time. Hash tags can also prov e useful for researchers in need of categorizing or grouping t w eets. While it is also possible to filter t weets by w ords or phrases, suc h an approac h can b e problematic. F or instance, a researc her interested in exploring the degree of happiness on Twitter ma y searc h for t weets con- taining the w ord “happ y”. While this strategy will return tw eets from people expressing sentimen ts suc h as “I am happy ”, it will also return messages in the category of “I am not happy ”. Sentimen t analysis tec hniques are needed to rectify this issue [2]. Using hashtags to filter tw eets hedges against the need to address such concerns; a p erson who inserts #happy in to his/her t weet is lik ely happy . Ho wev er, the volume of t w eets meeting the sp ecific search criteria will be reduced b ecause not every “happ y” tw eet, for example, will include #happy . Nev ertheless, to a void problems with con tradicting senti- men ts, the present study uses hash tags as a pro xy to study the prev alence and p opularit y of topics on Twitter. This study attempts to quan tify the spread of certain trending hashtags on Twitter. Using the metho ds describ ed b elo w, one can estimate the rates of infection and reco very for a particular trending topic. F urthermore, with sligh t data pro cessing, the same metho dology can b e used in a predictive con text. This study pro vides a brief ov erview of the existing literature con- cerning epidemic modeling and its use describing information dynamics on Twitter. Subsequen tly , we describ e the metho ds that w e used to quantify the propagation of trending topics on Twitter. In the pro cess w e find tw o main categories of hash tag dynamics—marginally infectious and v ery infectious, without m uch in b et ween. 1.1. Pr evious Work Mathematical models hav e b een used in the prediction, con trol, and anal- ysis of epidemic phenomena—most notably , the spread of infectious disease throughout a p opulation—since the adven t of the susceptible, infected, and reco vered (SIR) model [3]. These t yp es of epidemic models are featured in studies concerning measles [4, 5, 6, 7] and influenza [6, 8, 9, 10], among others. The basic SIR mo del describ es the dynamical pro cess of disease by categorizing mem b ers of the p opulation of in terest as either susceptible (S), infected (I), or reco v ered (R), while incorp orating rates of infectiousness ( β ) and reco very ( γ ). Figure 1A illustrates a mo del diagram. 2 (A) S I R S I R ⌫ (B) S I R S I R ⌫ Figure 1: Infection compartmental mo dels. Sho wn are the simple SIR mo del (A) and the more complex SIRI mo del (B). Mem b ers of the p opulation transition to and from differen t compartmen ts based on the system of differen tial equations presented in Equation 1. dS dt = − β S I / N dI dt = + β S I / N − γ I dR dt = + γ I (1) Although p ossibly useful for describing the dynamics of Twitter, it may b e that the infe ction of ideas do esn’t follo w the same structure. P erhaps, as in [11], the “reco very” from infection isn’t a passive time-decay but dep ends on ho w man y hav e recov ered already . In that case, referred to here as the SIRI mo del, we hav e a sligh tly mo dified set of equations which can lead to a more rapid decrease in the reco very phase as evidenced in Equation 2. dS dt = − β I S / N dI dt = + β I S / N − ν I R / N dR dt = + ν I R (2) A relativ ely new strategy in the field of epidemic mo deling is to develop a statistical mo del for the parameters of the dynamical mo del. Sp ecifically , w e 3 use Mark ov Chain Mon te Carlo (MCMC) simulation to estimate the posterior probabilities of the epidemic mo del’s parameters (e.g., β , γ , and ν ) [10, 12]. As mentioned ab o ve, m uch of the previous work featuring epidemic mo d- eling techniques concerns the transmission of an infectious disease. How ever, epidemic mo dels ma y just as w ell b e applied to capture the transmission of some other trait from individual to individual or group to group. A trait ma y take the form of a genetic c haracteristic, a cultural phenomenon, an addictiv e activity , the gain or loss of information, etc. [13]. In this regard, sev eral ha ve applied SIR-type tec hniques to the spread of information on Twitter and other net works [14, 15, 16, 17]. It is imp ortan t to note that the presen t study concerns the dynamics of hashtag p opularity on Twitter. W e define a hashtag’s p opularity by how man y users are tw eeting ab out a topic at a giv en time. Modeling p opularit y is differen t from other Twitter studies that address netw ork phenomena [18, 19, 20, 21, 22] or sp e- cific b eha viors suc h as information-sharing [23]. The use of p opularit y as a measure greatly simplifies b oth the data-taking pro cedure and the analysis, while at the same time pro viding a quan titative framew ork for discussing the infectiousness of ideas. 2. Metho ds T o apply the SIR mo del to real data requires a dataset that measures hash tag prev alence throughout Twitter ov er time. Therefore, the first stage of the presen t study’s analysis of Twitter consists of dev eloping a database of hashtag s v ersus time. W e dev elop suc h a database using one of Twitter’s application programming interfaces (APIs) and the Python programming language. Twitter has a num b er of different APIs; ho w ever, the class of streaming APIs is most applicable to this study , as tw eets are collected in near real-time [24]. Hence, by accessing the streaming API and p erforming a filter, we collect a sample of time-stamp ed t weets, each of whic h contains the hash character. The streaming API is also used to collect a geo-co ded trending topics list. This is done for New Y ork City and San F rancisco, for con v enience. Giv en a sample of time-stamp ed tw eets, in the form of single sto c hastic even ts, the time series is then smo othed using a time-windo wed a verage. Sev eral time- windo ws are explored, and the results follow, but the ma jorit y of the a veraged time-series p erform best with an a verage of one hour. W e ha ve observ ed that this is the time-scale o ver which most Twitter activit y happ ens. 4 0 2 4 6 8 10 12 14 hours 0 50 100 150 200 250 tweets per hour t 1 t 2 #USAvJPN Figure 2: Sample discrete tw eet time series (gray) to smoothed con tinuous time series (blac k) for a hashtag, #USAvJPN . The automatically extracted subseries is betw een times t 1 and t 2 sho wn. The smo othed time-scale is 1 hour. Although a few series are selected by hand for examples, to automate the pro cess we automatically scan the date and extract p e aks in activity , which represen t an infectious occurrence. One such o ccurrence is defined in a time series with the follo wing pro cedure: 1. find the maximum p oin t in the time series 2. from that maxim um, mo ving b ackwar ds in time, find the p oin t where the series is 1/100 of the maxim um - call this time t 1 3. from that maximum, moving forwar ds in time, find the p oin t where the series is 1/100 of the maxim um - call this time t 2 The infectious o ccurrence is defined to b e the time-series b et w een t 1 and t 2 , as sho wn in Figure 2. F or eac h of these time-series, the infection mo del analysis is performed. W e describ e this analysis presen tly . 2.1. Dynamic al Mo del In the present study , eac h dynamical mo del presen ted is either of the SIR (Equation 1) or SIRI (Equation 2) type, as describ ed ab o ve. Other forms could b e explored but w e feel they w ould not lead to an ything more informativ e than these. The SIR and SIRI simulations w ere implemented 5 using a wrapp er, called pyndamics , around the odeint function in Python’s SciPy library [25]. 2.2. R epr o duction Numb er The repro duction num b er for the SIR mo del, traditionally and confus- ingly denoted by R , is a threshold num b er related to the dynamical param- eters of the SIR mo del ab o ve which the infection will grow. W e will refer to this num b er as R so that it is not confused with the reco v ered population, R . It is easily derived from the dynamical equations, dS dt = − β I S/ N dI dt = + β I S/ N − γ I dR dt = + γ I (3) The condition for infectious gro wth is then dI /dt > 0 or, + β I S/ N − γ I > 0 β γ > N S (4) A t the b eginning of the simulation, the condition for infectious growth b ecomes R ≡ β S o γ N > 1 (5) whic h simplifies to R ∼ β /γ for large initial susceptible p opulation, S o . The same can b e done for the SIRI model with little mo dification [11]. dS dt = − β I S/ N dI dt = + β I S/ N − ν I R / N dR dt = + ν I R (6) 6 The condition for infectious gro wth is then dI /dt > 0 or, + β I S/ N − ν I R / N > 0 β S ν > R (7) A t the start of the sim ulation, R = 1, so w e hav e a mo dified repro duction n umber and condition for infectious growth, R ≡ β S o ν (8) 2.3. Statistic al Mo del A statistical mo del of the infectious parameters, β and γ (or ν ), as well as the initial v alues for the infectious ( I o ) and susceptible ( S o ) p opulations, is attac hed to the dynamical SIR mo del. Uniform prior probabilities are as- sumed for the parameters and a Python implementation of the affine in v ariant MCMC ensem ble sampler [26] is used to obtain p osterior probabilities for the parameter v alues as well as the correlation b etw een parameters [27, 28]. The MCMC simulation is run for appro ximately 500000 iterations with a burn-in of 50%. F ollowing the MCMC iterations, histograms of the parameter traces are used to estimate the p osterior probabilities for the parameter v alues, the uncertain ty in those v alues, and the correlation betw een parameters in the mo dels. Calculation of the basic repro duction num b er [29], defined in Equa- tions 5 and 8, follows from the estimates of the individual parameters, β and γ (or ν ). R > 1 denotes an infectious pro cess. 3. Results The results fall into three main categories: the dynamics of individual time-series, the collective pattern of the v alues of β and γ (or ν for the SIRI mo del), and the distribution of the basic repro ductiv e n umber, R . 3.1. Individual tr ac es Sho wn in Figure 3, w e ha ve a num b er of sample individual traces of the dynamical model. F or eac h plot, w e show the original data (smo othed o ver a one-hour time p eriod) and the b est-fit dynamical curve dra wn from the posterior distribution discov ered through the MCMC analysis. W e can immediately see that the SIR mo del is go o d at summarizing man y of the 7 series, and the dynamics make an approximate sense even in those cases where the data is not smo oth (e.g., #TeenChoice ). In multi-peak cases, the mo del typically picks out either the first peak (e.g., #USWNT ) or smo oths the en tire dynamics ov er a few p eaks (e.g., #ESPYS ). 3.2. Pattern of Par ameters Because h undreds of hash tags were analyzed, w e visualize the resulting fits by plotting β vs γ . Since the basic repro duction num b er for the SIR mo del is appro ximately the ratio of β to γ , as sho wn in Equation 5, and R > 1 denotes an infectious disease, then a plot of the p oin ts ( β , γ ) for eac h hash tag should result in a scatter where the infectious topics fall ab o ve the 45 ◦ line. The farther a wa y from that line, the more infectious the topic is. F or our analysis of the dynamics of the hashtags collected, the result is sho wn in Figure 4. Two observ ations are immediately clear. First, the scatter falls primarily along a single line, implying a v ery consisten t repro duction n umber for man y of the hash tags, slightly ab o v e 1. Second, there is a subp opulation (in the lo wer left, expanded in the inset) falling well ab o ve the 45 ◦ line, and are thus quite infectious. This represents ab out 20% of all the tw eets analyzed. 8 Figure 3: Individual traces for selected Twitter hashtags. Shown are the hash tag counts (gra y), smo othed ov er a one hour time perio d, and the b est fit SIR mo del (blac k) for 6 differen t Twitter hashtags. 9 (A) 0 20 40 60 80 100 120 γ 0 20 40 60 80 100 120 β SIR Model 0 4 8 γ 0 5 10 15 20 25 β (B) 0.0 0.1 0.2 0.3 0.4 0.5 0.6 ν 0 5 10 15 20 25 30 β SIRI Model Figure 4: Plot of β vs. γ for the SIR mo del (A) and β vs. ν for the SIRI mo del (B). All observ ations lie ab ov e the 45 ◦ line and are thus represent epidemics to some extent. The inset on the SIR mo del expands the low er left-hand corner, where extremely infectious hash tags exist. The SIRI mo del (B) consistently results in more infectious hashtags. 10 3.3. R epr o duction Numb er Sho wn in Figure 5 is the histogram of measured repro duction num b ers across all of the trending hashtags. The range of observ ed num b ers is large, with v alues consistent with other studies of Twitter hashtag dynamics [17]. There are man y with repro duction n umbers falling just abov e R ∼ 1, rep- resen ting only slightly infectious ideas. The SIRI mo del, with the added feedbac k in the decay of the pro cess, yields parameters with very high infec- tious rates for the same data as the SIR mo del. 4. Discussion The results presen ted here are the first systematic lo ok at hash tag dynam- ics in a Twitter dataset. Here w e demonstrate that the Twitter hash tags fall in to t wo groups: slightly infectious (from an SIR mo del p ersp ectiv e) with a subset of very infectious topics. Dep ending on mo del assumptions, suc h as a feedbac k with “reco vered” individuals affecting the decay of the topic in terest (i.e. the “infected” individuals), the b est fit can lead to very high infectious conditions. No significant differences w ere observ ed in these conclusions de- p ending on the geograph y of the hash tags—coming from New Y ork or San F rancisco. F urther work on this area is needed to explore the details of these re- sults. One interesting study would lo ok at the global distribution of the b est-fit parameter v alues, to explore the differences and similarit y of topic infectiousness across the glob e. Another would explore the sensitivit y of this approac h to mo del assumptions, and to p erform a full mo del comparison in order to confirm the nature of the interactions b et ween the subp opulations of the mo del. In the long run, it ma y b e p ossible to use this approach in order to impro ve the lab eling of “trending” topics. 11 (A) NY SF 0 20 40 60 80 100 120 140 160 Reproduction Number SIR Model (B) NY SF 0 200 400 600 800 1000 1200 Reproduction Number SIRI Model Figure 5: Distribution of R for different geo-lo cations and dynamical mo dels. Shown are the v alues of the reproduction num b er for the SIR model (A) and the SIRI mo del (B) for New Y ork tw eets and San F rancisco tw eets. There is no qualitative difference b et ween the t wo lo cations. 12 References [1] Twitter, https://about.twitter.com/company , 2016. Accessed: 2016- 01-20. [2] A. Agarwal, B. Xie, I. V ovsha, O. Ram b o w, R. Passonneau, Sentimen t analysis of Twitter data, in: LSM ’11 Pro ceedings of the W orkshop on Languages in So cial Media, Asso ciation for Computational Linguistics, 2011. [3] W. O. Kermac k, A. G. McKendric k, A contribution to the mathematical theory of epidemics, Pro ceedings of the Roy al So ciet y of London 115 (1927) 700–721. [4] C. A. McGilchrist, L. F. McDonnell, L. R. Jorm, M. S. P atel, Loglin- ear mo dels using capture - recapture metho ds to estimate the size of a measles epidemic, Journal of Clinical Epidemiology 49 (1996) 293–296. [5] R. F. Grais, M. J. F errari, C. Dubray , O. N. Bjornstad, B. T. Grenfell, A. Djibo, F. F ermon, P . J. Guerin, Estimating transmission in tensity for a measles epidemic in Niamey , Niger: lessons for in terv ention, T ransac- tions of the Roy al Society of T ropical Medicine and Hygiene 100 (2006) 867–873. [6] H. C. T uckw ell, R. J. Williams, Some prop erties of a simple sto c hastic epidemic mo del of SIR type, Mathematical Biosciences 208 (2007) 76– 97. [7] T. Kuniy a, Global stability analysis with a discretization approach for an age-structured multigroup SIR epidemic mo del, Nonlinear Analysis: Real W orld Applications 12 (2006) 2640–2655. [8] X. Z. Li, W. S. Li, M. Ghosh, Stabilit y and bifurication of an SIR epidemic mo del with nonlinear incidence and treatmen t, Applied Math- ematics and Computation 210 (2009) 141–150. [9] M. B. Ho oten, J. Anderson, L. A. W aller, Assessing North American influenza dynamics with a statistical SIRS mo del, Spatial and Spatio- temp oral Epidemiology 1 (2010) 177–185. [10] F. C. Co elho, C. T. Co deco, M. G. M. Gomes, A Bay esian framew ork for parameter estimation in dynamical mo dels, PLoS ONE 6 (2011). 13 [11] J. Cannarella, J. A. Sp ec hler, Epidemiological mo deling of online so cial net work dynamics, CoRR abs/1401.4208 (2014). [12] C. Witko wski, B. S. Blais, Ba yesian analysis of epidemics - zombies, in- fluenza, and other diseases (2013). http://web.bryant.edu/ ~ bblais/ pages/publications.html . [13] F. Brauer, C. Castillo-Chav ez, Mathematical mo dels in population bi- ology and epidemiology , Springer-V erlag New Y ork, Inc, 2001. [14] L. M. Bettencourt, A. Cin tron-Arias, D. I. Kaiser, C. Castillo-Cha vez, The p o w er of a go o d idea: quantitativ e mo deling of the spread of ideas from epidemiological mo dels, Physica A 364 (2006) 513–536. [15] F. Jin, E. Doughert y , P . Saraf, N. Ramakrishnan, Epidemiological mo d- eling of news and rumors on Twitter, in: SNAKDD ’13, A CM, 2013. [16] L. Zhao, J. W ang, Y. Chen, Q. W ang, J. Cheng, H. Cui, SIHR rumor spreading mo del in so cial netw orks, Ph ysica A: Statistical Mec hanics and its Applications 391 (2012) 2444–2453. [17] E. Eager, M. Eberle, J. P eirce, How infectious was #deflategate?, CoRR abs/1506.03104 (2015). [18] E. Baksh y , J. Hofman, W. Mason, D. W atts, Every one’s an influencer: quan tifying influence on Twitter, in: Pro ceedings of the fourth A CM in ternational conference on W eb searc h and data mining, ACM, 2011, pp. 65–74. [19] K. Lerman, R. Ghosh, Information con tagion: an empirical study of the spread of news on Digg and Twitter so cial net works, in: Pro ceedings of 4 th In ternational Conference on W eblogs and So cial Media. [20] L. W eng, A. Flammini, A. V espignani, F. Menczer, Comp etition among memes in a w orld with limited attention, Scientific Rep orts 2 (2012). [21] L. W eng, F. Menczer, Y. Ahn, Viralit y prediction and communit y struc- ture in so cial net w orks, Scientific Rep orts 3 (2013). [22] S. W u, J. Hofman, W. Mason, D. W atts, Who says what to whom on Twitter, in: Pro ceedings of the 20 th in ternational conference on W orld wide w eb, ACM, 2011, pp. 705–714. 14 [23] J. Ko, H. Kw on, H. Kim, K. Lee, M. Choi, Model for Twitter dynamics: Public attention and time series of tw eeting, Ph ysica A 404 (2014) 142– 149. [24] https://dev.twitter.com/streaming/overview , 2016. Accessed: 2016-01-20. [25] E. Jones, T. Oliphan t, P . P eterson, et al., SciPy: Op en source scien tific to ols for Python, 2001–. [Online; accessed 2016-01-11]. [26] J. Go o dman, J. W eare, Ensem ble samplers with affine inv ariance, Comm unications in Applied Mathematics and Computational Science 5 (2010). [27] D. F oreman-Mac key , D. W. Hogg, D. Lang, J. Go o dman, emcee: The MCMC Hammer, Publications of the Astronomical So ciet y of the Pacific 125 (2013). http://adsabs.harvard.edu/abs/2013PASP..125..306F . [28] A. Gelman, Bay esian data analysis, CRC press, 2004. [29] P . Holme, N. Masuda, The basic repro duction n umber as a predictor for epidemic outbreaks in temp oral netw orks., PloS one 10 (2015) e0120567. 15
Original Paper
Loading high-quality paper...
Comments & Academic Discussion
Loading comments...
Leave a Comment