Quantifying alternative splicing from paired-end RNA-sequencing data
RNA-sequencing has revolutionized biomedical research and, in particular, our ability to study gene alternative splicing. The problem has important implications for human health, as alternative splicing may be involved in malfunctions at the cellular…
Authors: David Rossell, Camille Stephan-Otto Attolini, Manuel Kroiss
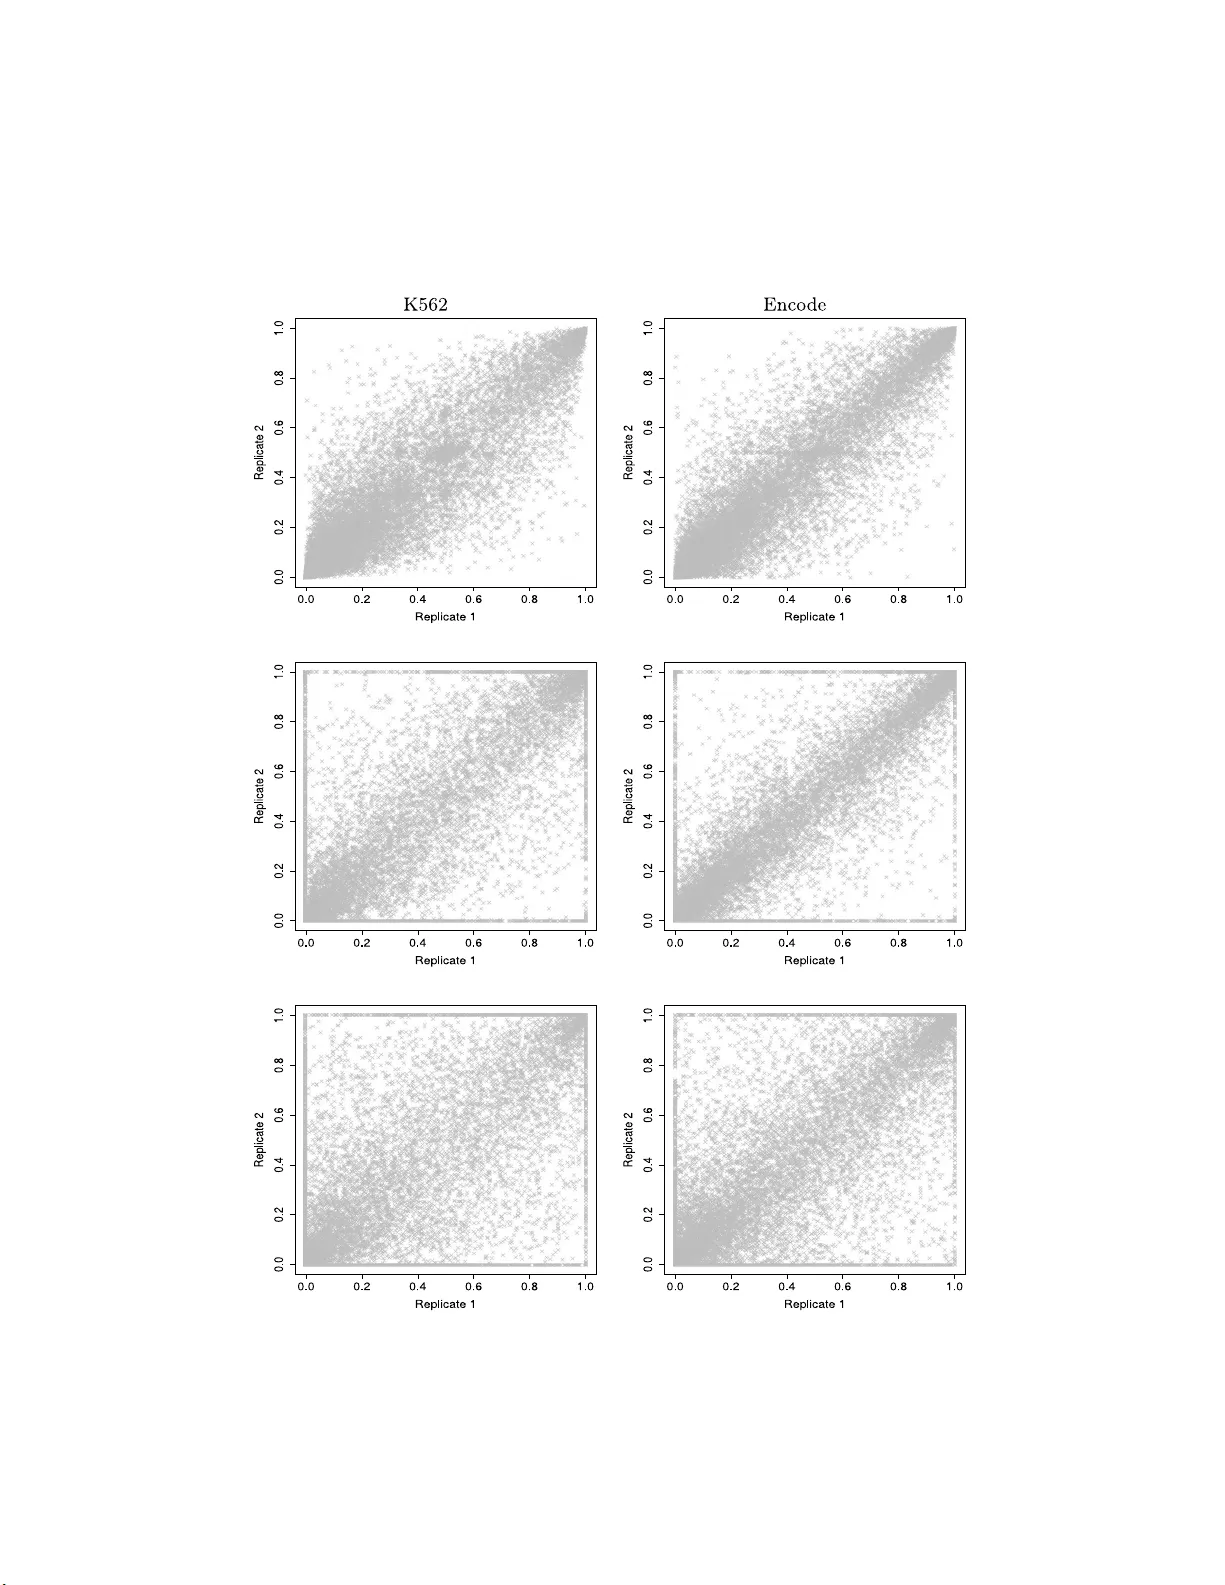
The Annals of Applie d Statistics 2014, V ol. 8, No. 1, 309–330 DOI: 10.1214 /13-A OAS687 c Institute of Mathematical Statistics , 2 014 QUANTIFYING AL TERNA TIVE SPLICING FR OM P AIRED-END RNA-SEQUENCING DA T A By D a vid Rossell 1 , ∗ Camille Steph an-Otto A ttolini 2 , † Manuel Kroiss ‡ , § , 3 and Almond St ¨ ocker ‡ , 3 University of Warwick ∗ , Institute for R ese ar ch in Biome dici ne of Bar c elona † , LMU Mu nich ‡ and TU Munich § RNA-sequ encing has rev olutionized biomedical resea rc h and , in particular, our abilit y to study gene alternative splicing. The problem has imp ortant implications for human health, as alternative splici ng ma y b e invo lved in malfunctions at the cellular level and multiple diseases. How ever, the high-d imensional nature of the data and th e existence of exp erimental biases p ose serious data analysis challenges. W e find that t he standard d ata summaries u sed to study alternative splicing are severely limited, as they ignore a substantial amount of v aluable information. Current data analysis metho ds are based on such summaries and are hence suboptimal. F urt her, th ey have lim- ited flexibilit y in accounting for technical biases . W e prop ose nov el data summaries and a Bay esian mo deling framew ork t hat o verco me these limitations and determine biases in a nonparametric, highly flexible manner. These summaries adapt naturally t o th e rapid im- prov ements in sequencing technolog y . W e provide efficien t p oint esti- mates an d uncertain ty assessmen ts. The approach allow s to study al- ternative splicing patterns for indiv id u al samples and can also b e th e basis for d o wnstream analyses. W e found a severa lfold improv ement in estimation mean square erro r compared p opular approac h es in sim u lations, and substantial ly higher consistency b etw een replicates in exp erimental data. Ou r fin dings indicate th e need for adjusting the routine summarization and analysis of alternativ e splicing RNA- seq studies. W e provide a softw are implementation in the R pac ka ge casper . 4 Received Sep tember 2012; revised Ma y 2013. 1 Supp orted in part b y Grants R 01 CA158113-01 from the NIH (USA) and MTM2012- 38337 from the Ministerio de Econom ´ ıa y Competitividad ( Spain). 2 Supp orted in part by AGAUR Beatriu de Pin´ os fello wship BP-B 00068 (Spain). 3 Supp orted in p art by a Ba yerisc hes Arb eitsministerium foreign trainee fello wship (Ger- many). Key wor ds and phr ases. Alternative splicing, RNA-Seq , Ba yesian mod eling, estimation. This is an electronic reprint of the or iginal a r ticle published by the Institute o f Mathematical Statis tics in The A nn als of Appli e d Statistics , 2014, V ol. 8, No. 1, 309–33 0 . This r e print differs from the original in pa gination and typog raphic detail. 4 http://w ww.bioconductor.org/pac k ages/release/ bio c/html/casper.html . 1 2 ROSSELL, S TEPHAN-OTTO A TTOLIN I , KROISS AND ST ¨ OCKER Fig. 1. Thr e e splic e variants for a hyp othetic al gene and their r elative abundanc es. Exon 1 i s lo c ate d at p ositions 101–4 00. Exon 2 at 1001–1100. Exon 3 at 2001–2500. 1. In tro d uction. RNA-sequencing (RNA-seq) pr o duces an o ve rwhelm- ing amount of genomic d ata in a single exp erimen t, p ro vid ing an unp rece- den ted resolution to address biological prob lems. W e fo cus on gene expres- sion exp eriments where the goal is to study alternative sp licing (AS), which w e briefly in tro d uce. AS is an imp ortan t biological pro cess b y whic h cells are able to express several v arian ts, also kno wn as isoforms , of a sin gle gene. Eac h splicing v arian t giv es rise t o a d ifferent p r otein with a u nique stru c- ture that can p er f orm differen t functions an d resp ond to in ternal and envi- ronment al n eeds. AS is b eliev ed to con trib ute to the c omplexit y of h igher organisms, and is in fact particularly common in humans [Bl enco we ( 2006 )]. Additionally , it is kno wn to b e in v olved in m ultiple diseases such as cancer and malfunctions at th e cellular lev el. Despite its imp ortance, due to limita- tions in earlier tec h nologies, most gene exp r ession stud ies ha ve ignored AS and focused on ov erall gene expression. Consider the hyp othetical example of a g en e with three splice v arian ts sho w n in Figure 1 . Th e gene is encod ed in the DNA in three exons, sho wn as b oxe s in Figure 1 . When the gene is transcrib ed as messenger RNA (mRNA), it can giv e r ise to three isoforms . V arian t 1 is formed by all three exons, whereas v arian t 2 skip s the second exon and v arian t 3 the third exon. Usually , m u ltiple v arian ts are expressed sim ultaneously at an y giv en time. In our example, v ariant 1 mak es up for 60% of th e o verall exp r ession of the gene, v arian t 2 for 30% and v ariant 3 for 10%. In practice, these pr op ortions are unknown and our goal is to estimate them as acc urately as p ossib le. W e fo cus on p aired-end RNA-seq e xp eriments, as they are the current standard and provide higher resolution for measuring isoform expression than co mp eting tec hnologies, for example, microarrays [Pe pk e, W old and Mortaza vi ( 2009 )]. RNA-seq sequ ences tens or ev en hundreds of millions of mRNA fr agmen ts, whic h ca n th en be aligned to a reference genome us in g AL TERNA TIVE S PLICING FROM R NA-S EQ DA T A 3 T able 1 Thr e e p air e d-end RNA-se q f r agments. Aligne d chr omosome and b ase p airs ar e i ndic ate d for b oth ends, al lowing f or gapp e d alignments. The exon p ath indic ates the se quenc e of exons visite d by e ach end. A typic al exp eriment c ontains tens of mil lions of fr agments Chromosome Left read Right read Exon path F ragment 1 chr1 110–185 200–274 { 1 } , { 1 } F ragment 2 chr1 361– 400; 1001–1035 2011–20 85 { 1, 2 } , { 3 } F ragment 3 chr1 301–375 1021–10 95 { 1 } , { 2 } · · · a v ariet y of s oftw are, f or example, T op Hat [T r apnell, Pac hter and Salzb er g ( 2009 )], SO AP [Li et al. ( 20 09 )] or BW A [Li and Durbin ( 20 09 )]. Through- out, w e assu me th at the softw are can hand le gapp ed alignmen ts (we used T opHat in all our examples). E arly RNA-seq studies used single-end se- quencing, where only the left or right en d of a fragmen t is sequen ced. In con trast, paired-end RNA-seq sequences b oth fragmen t ends . T able 1 sho w s three hyp othetical sequenced fr agments corresp ond in g to the gene in Fig- ure 1 . 75 base p airs (bp) w ere sequenced from eac h end. F or instance, b oth ends of fragmen t 1 align to exon 1. As the three v arian ts con tain exon 1, in principle, this f r agmen t could ha v e b een generated by an y v arian t. F or frag- men t 2 the left read aligned to exons 1 and 2 (i.e., it spanned the jun ction b et w een b oth exons), and th e right read to exon 3. Hence, fragmen t 2 can only ha v e b een generated from v ariant 1. Finally , fragmen t 3 visits exons 1 and 2 and, hen ce, it could ha ve b een generated either by v arian ts 1 or 3. The example is simply mean t to pr o vide s ome intuitio n. In pr actice, most genes are substantial ly longer and ha v e m ore complicated splicing p atterns. Precise probability calc ulations are required to ensur e that the conclusions are sound. Ideally , one wo uld wan t to sequence the wh ole v arian t, so that eac h fr ag- men t can b e uniqu ely assigned to a v ariant. Unfortu nately , current tec hnolo- gies sequence hundreds of base pairs, whic h are ord ers of magnitude shorter than t ypical v ariant le ngths. Curr en t statistical approac hes are based o n the observ ation that, while most sequenced fragmen ts cannot b e uniqu ely assigned to a v arian t, it is p ossible to mak e probabilit y statemen ts. F or in- stance, fragmen t 3 in T able 1 ma y ha ve originate d either from v ariant 1 or 3, but the probabilit y that ea c h v arian t generates suc h a fragmen t is differ- en t. As we sh all see b elo w, this obs er v ation pr ompts a direct use of Bay es theorem. In principle, one could formulat e a pr obabilit y mo del that uses the full data, that is, t he exact b ase pairs co vered by eac h fr agmen t such as pro- vided in T able 1 , for example, Glaus, Honk ela and Rattra y ( 2012 ). Ho we v er, our findings indicate that such strategies can b e compu tationally prohibitive 4 ROSSELL, S TEPHAN-OTTO A TTOLIN I , KROISS AND ST ¨ OCKER and deliv er no ob vious impr o vemen t (Section 4 ). F urther , data storage and transfer requirements imp ose a need for reducing the size of the data. Sev- eral auth ors p rop osed su mmarizing the data by count ing the num b er of fragmen ts either co v ering eac h exon or eac h exon jun ction [e.g ., Xing et al. ( 2006 ), Mortaza vi et al. ( 2008 ), Jiang and W ong ( 2009 )]. I n fact, large-scal e genomic databases r ep ort pr ecisely these summ aries, for example, The Can- cer Genome A tlas pro ject. 5 One can t hen p ose a probabilit y mo del that uses coun t data from a few cat egories as ra w data, whic h greatly simplifies computation. While useful, this app roac h is seriously limited to considerin g pairwise jun ctions, whic h discards r elev ant information. F or instance, sup- p ose that a fragmen t visits exons 1, 2 and 3. Simply adding 1 to the coun t of fragmen ts sp anning exons 1–2 and 2– 3 ignores the join t information that a single fragmen t visited 3 exons and decreases the confidence wh en infer r ing the v ariant that generated th e f r agmen t. Our results su ggest that ignoring this in formation can r esult in a serious loss of precision. I t is n ot un com- mon that a fragmen t spans m ore than 2 exons. Holt and Jones ( 2008 ) found a sub stan tial p r op ortion of fragments bridging sev eral exons in paired-end RNA-seq exp eriments. In the 2009 RGA SP exp erimental data set (Section 4 ) 38.0% and 40.9% of fragmen ts sp anned ≥ 3 exons in r eplicate 1 and 2, re- sp ectiv ely (w e sub d ivided exons so th at th ey a re fully sh ared /not shared b y all v arian ts in a gene). In the 2012 ENCODE data set we found 64.7% and 65.2% in eac h rep licate. T h e 2012 data had substantial ly longer reads and fr agmen ts, w hic h illustrates the r apid adv ancements in tec hnology . As sequencing ev olv es, these p er centag es are exp ected to increase f urther. W e prop ose nov el data summaries that preserv e m ost information relev an t to alternativ e s plicing, while main taining the computational b u rden at a manageable level . W e record the sequence of exons visited b y eac h fr agmen t end, whic h w e refer to as exon p ath , and then coun t the n umb er of fragmen ts follo wing eac h exon path. Th e left end of F ragmen t 2 in T able 1 v isits exons 1 and 2 and the righ t en d exon 3, whic h we denote as { 1 , 2 } , { 3 } . Notice that a fragmen t follo wing the path { 1 } , { 2 , 3 } visits the same exons, so one could be tempted to simp ly record { 1 , 2 , 3 } in b oth cases. Ho w ever, the p r obabilit y of observing { 1 , 2 } , { 3 } for a giv en v ariant differs from { 1 } , { 2 , 3 } and, hence, com binin g the t w o paths w ould resu lt in a p oten tial loss of information. T able 2 cont ains hypothetical exon path counts for our example gene. W e use these count s as the basic input for our pr ob ab ility mo d el. P aired-end RNA-se q is critical f or AS studies. Intuitiv ely , compared to single-end sequencing, it in cr eases the probabilit y of observing frag men ts that conn ect exo n j unctions. La croix et al. ( 2008 ) sho w ed that, a lth ou gh neither pr oto col guarantee s the existence of a u nique s olution, in practice, 5 http://ca ncergenome.nih.go v . AL TERNA TIVE S PLICING FROM R NA-S EQ DA T A 5 paired-end (b u t not single-end) can p ro vid e asymptotically corr ect estimate s for 99.7% of the human ge nes. In con trast, for single-end d ata the figure is 1.14%. Unfortun ately , muc h of the current methodology has b een designed with single-end d ata in mind. Xing et al. ( 2006 ) formulat e the p roblem as that of tra versing a directed acyclic graph and formulate a laten t v ariable based approac h to estimate splice v arian t exp ression. Jiang and W ong ( 2009 ) prop ose a similar approac h within the Bay esian framework. Both approac hes w ere designed for single-end RNA-seq d ata. Ameur et al. ( 2010 ) prop osed strategies to detect splicing junctions, and Katz et al. ( 2010 ) and W u et al. ( 2011 ) in tro duced m o dels to estimate the p ercen tage of isoforms skipping individual exons. Ho wev er, these approac hes do n ot estimate expression at the v ariant lev el. Sev eral authors prop ose strategies that use paired-ends. Mortaz a vi et al. ( 2008 ), Mon tgomery et al. ( 2010 ), T rapn ell et al. ( 2010 ) and Salzman, Jiang and W ong ( 2011 ) mod el the num b er of fragmen ts spanning exon ju nctions. These app roac hes fo cus on pairwise exon conn ections, ignoring v aluable higher-order inf orm ation, and ha ve limitations in incorp orating imp ortant tec hnical biases. First, the sample preparation pr oto cols u sually ind uce an enric h m en t to wa rd the 3’ end of th e transcrip t, that is, fragmen ts are n ot uniformly distribu ted along the gene. Rob erts et al. ( 2011a ), W u, W ang and Zhang ( 2011 ) or Glaus, Honkela and Rattra y ( 2012 ) relax the uniformit y as- sumption. F urther, the fragmen t length distribu tion pla ys an imp ortan t role in the pr ob ab ility calculations and needs to b e estimated accurate ly . While the approac h es ab ov e ac k n o wledge this issue, they either use sequencing fa- cilit y rep orts (i.e., th ey d o not estimate the d istribution from the data) or they imp ose s tr ong parametric assumptions. O ur examples illus tr ate that facilit y rep orts can b e inaccurate and that parametric f orm s d o not captur e the observ ed asymmetries, h eavy tails or multi-mod alities. F urther, all p r e- vious app roac hes assume th at f r agmen t start and length distributions are T able 2 Exon p ath c ounts f or hyp othetic al gene Exon path Count { 1 } , { 1 } 2824 { 2 } , { 2 } 105 { 3 } , { 3 } 5042 { 1 } , { 2 } 27 { 1 } , { 1, 2 } 423 { 1 } , { 3 } 127 { 2, 3 } , { 3 } 394 { 1, 2 } , { 3 } 2 { 1 } , { 2, 3 } 13 6 ROSSELL, S TEPHAN-OTTO A TTOLIN I , KROISS AND ST ¨ OCKER constan t across all genes. W e pro vide empirical evidence that this assump - tion ca n b e fla w ed and suggest a strategy to relax the assumption. A concern with current ge nome annotations is that they ma y miss some splicing v ariants. Our appr oac h can b e com bin ed w ith metho ds that pr edict new v ariants s uc h as Cufflin ks RABT mo d u le [T rapnell et al. ( 2010 ), Rob erts et al. ( 2011b )], Scripture [Guttman et al. ( 2010 )] or S pliceGrapher [Rogers et al. ( 2012 )]. This option is implement ed in our R pac k age an d illustrated in Secti on 4.3 . In summary , w e prop ose a fl exible framewo rk to estimate alternativ e splic- ing from RNA-seq studies, b y using nov el data summaries and accoun ting for exp erimenta l biases. In Section 2 we formulate a probabilit y mod el that goes b eyo nd pairwise connections b y considering exon paths. W e mo del the read start and fragmen t size distrib u tions n onparametrically and allo w for sepa- rate estimation w ithin subsets of ge nes with similar characte ristics. Sectio n 3 discusses mo del fitting and provides algorithms to obtain p oint estimates, asymptotic cred ibilit y in terv als and p osterior samp les. W e sho w some resu lts in Secti on 4 and pro v id e concluding remarks in S ection 5 . 2. Probabilit y mo del. W e form ulate th e mo del at the gene lev el and p er- form inference separately for eac h gene. In some cases, exons fr om d ifferen t genes ov erlap w ith eac h other. When this o ccurs we group the ov erlapping genes and consider all their isoforms simultaneously . It is also p ossible that t wo v arian ts share on ly a part of an exon. W e sub divide suc h exons into the shared part and the part that is sp ecific to eac h v arian t. F or simplicit y , from here on we refer to gene group s simp ly as genes and to s u b d ivided exons simply as exons. Consider a gene with E exons starting at base pairs s 1 , . . . , s E and ending at e 1 , . . . , e E . Denote the set of splicing v ariant s und er consideration b y ν (assumed to b e kno wn) and its cardinalit y b y | ν | . Eac h v arian t is c haracter- ized b y an increasing sequ en ce of natural n um b ers i 1 , i 2 , . . . that indicates the exons con tained th er ein. 2.1. Likeliho o d and prior. As discuss ed ab ov e, w e formulate a mo del for exon p aths. Let k b e the num b er of exons visited b y the left read, and k ′ b e that for the righ t r ead (i.e., k = k ′ = 1 when b oth reads o verla p a single exon). W e denote an exon path by ι = ( ι l , ι r ), wh ere ι l = ( i j , . . . , i j + k ) are the exons visited b y the left-end and ι r = ( i j ′ , . . . , i j ′ + k ′ ) those b y th e righ t- end. Let P ∗ b e the set of all p ossible exon paths and P b e the subset of observ ed paths, that is, the p aths follo w ed by at least 1 sequenced fragmen t. The observed data is a realization of the r andom v ariable Y = ( Y 1 , . . . , Y N ), where N is the num b er of paired-end reads and Y i ∈ { 1 , . . . , P ∗ } indicates the exon p ath follo wed by read p air i . F ormally , Y i arises from a mixtu re of | ν | discrete probabilit y distributions, eac h co m p onent corresp ond ing to AL TERNA TIVE S PLICING FROM R NA-S EQ DA T A 7 a differen t sp licing v ariant. The mixture weig h ts π = ( π 1 , . . . , π | ν | ) giv e the prop ortion of reads generated by eac h v arian t, that is, its relativ e expression. That is, P ( Y i = y i | π , ν ) = | ν | X d =1 p y i d π d , where p k d = P ( Y i = k | δ i = d ) i s the probabilit y of p ath k und er v arian t d and δ i is a laten t v ariable ind icating the v arian t that originated Y i . Let S i and L i denote the relat iv e start and length (resp .) of fr agment i . The exon path Y i is complete ly determined giv en S i , L i and the v arian t δ i . Hence, p k d = Z Z I ( Y i = k | S i = s i , L i = l i , δ i = d ) dP L ( l i | δ i ) dP S ( s i | δ i , L i ) , (1) where P L is the fr agmen t distribution and P S is the r ead start distrib ution conditional on L . As d iscussed in Section 2.2 , by assu ming th at P S and P L are shared across sets of genes with s im ilar c haracteristics, it is p ossible to estimate th em with high precision. Hence, f or practical pur p oses we can treat p k d as kno wn and pre-compute them b efore mo del fitting. F ull deriv ations for p k d are pro vided in App endix A . Assuming that ea ch fr agmen t is ob s erv ed indep endentl y , the likel iho o d function ca n b e written as P ( Y | π , ν ) = N Y i =1 | ν | X d =1 p y i d π d = |P | Y k =1 | ν | X d =1 p k d π d ! x k , (2) where x k = P N i =1 I( y i = k ) is th e n u m b er of reads follo win g exon path k . Equation ( 2 ) is log-conca ve, wh ich guaran tees the existence of a single max- im u m . Log-co nca vit y is giv en by (i) the log fun ction b eing conca ve and monotone increasing, (ii) P | ν | d =1 p k d π d b eing linear and therefore conca v e, and (iii) the fact that a comp osition g ◦ f where g is conca ve and monotone increasing and f is conca v e is again conca v e. T o see (iii), notice that g ◦ f ( t z 1 + (1 − t ) z 2 ) ≥ g ( tf ( z 1 ) + (1 − t ) f ( z 2 )) ≥ t g ◦ f ( z 1 ) + (1 − t ) g ◦ f ( z 2 ) , where the first inequalit y is giv en b y g b eing increasing and f conca ve, an d the second inequalit y is giv en by g b eing conca v e. W e complete the p robabilit y mo d el with a Diric hlet prior on π : π | ν ∼ Dir( q 1 , . . . , q | ν | ) . (3) In Section 4 w e assess sev eral choic es for q d . By default we set th e fa irly uninformative v alues q d = 2, as these in duce negligible b ias and stabilize the 8 ROSSELL, S TEPHAN-OTTO A TTOLIN I , KROISS AND ST ¨ OCKER p osterior mo de b y p o oling it aw a y from the b oundaries 0 and 1. It is easy to s ee that ( 3 ) is log-conca v e when q d ≥ 1 f or all d . Giv en that ( 2 ) is also log-co nca ve , this c hoice of q guaran tees the p osterior to b e log-conca ve , and therefore the u niqueness of the p osterior mo de. 2.2. F r agment length and r e ad start dist ribution estimates. Ev aluating the exon path probabilities in ( 1 ) that app ear in the likelihoo d ( 2 ) requires the fragment start d istribution P S and f ragmen t length distrib u tion P L . Giv en th at it is not p ossible to estimate ( P L , P S ) with p r ecision f or eac h in- dividual gene, we assume they are shared ac ross m ultiple genes (restricting fragmen ts to b e no longer than the v ariant they originated from). By default w e assume that ( P L , P S ) a re c ommon ac ross al l g enes, but w e also stud- ied p osing separate d istributions according to gene length. Su pplementa r y Section 1 s ho ws exp erimen tal evidence that, while P L remains essent ially constan t, P S can dep end on ge ne length and the experimental setup. While this option is imp lemen ted in our R pac k age, to allo w a d irect comparison with previous appr oac hes here, w e assumed a common ( P L , P S ). Denoting b y T the lengt h of v arian t δ i (in bp), w e let P L ( l | δ ) = P L ( l | T ) = P ( L = l )I( l ≤ T ) /P ( l ≤ T ). That is, the conditional distrib ution of L giv en δ is simply a truncated v ersion of the marginal distribution. F u rther, we assume a common fragmen t start distribution relativ e to the v arian t length T . Con d itional on L and T , P S is truncated so that the fragmen t ends b efore the end of the v ariant. Sp ecifically , P S ( S ≤ s | δ i , L = l ) = P S T ≤ z | T , L = l (4) = ϕ (min { z , ( T − l + 1) /T } ) ϕ (( T − l + 1) /T ) , where z = s/T and ϕ ( z ) = P ( S T ≤ z ) is the d istribution of the r elativ e read start S T . T o estimate P L note that the fragmen t length is un k n o wn for f r agmen ts that sp an multi ple exons, but it is known exactly when b oth ends fall in the same exon. Therefore, we select all su c h fr agmen ts and estimate P L with the empir ical p r obabilit y mass function of the observe d f ragmen t lengths. In order to prev ent short exons from in ducing a selec tion bias, we only use exons that are sub stan tially longer than the exp ected maxim u m f ragmen t length (b y default > 1000 bp). Estimating the fragmen t start distribution P S is more challe nging, as w e do not kno w th e v arian t that generate d eac h fr agmen t and therefore its relativ e start p osition cannot b e determined. W e address this issue by selecting genes that ha v e a sin gle annotat ed v arian t, as, in principle, for these genes all fragments should ha v e b een generated by that v ariant. Of AL TERNA TIVE S PLICING FROM R NA-S EQ DA T A 9 course, the annotated genome d o es not con tain all v ariants and , therefore, a pr op ortion of the selected fragmen ts ma y not ha v e b een ge nerated by the assumed v arian t. Ho wev er, the annotati ons are exp ected to c on tain most common v arian ts (i.e., with highest expression) and, hence, most of the selected f ragmen ts should corresp ond to the annotated v arian t. Under this assumption, w e can determine the exact start S i and length L i for all selected fragmen ts. A difficult y in estimating the read start d istribution is that the observ ed ( S i , L i ) pairs are truncated so that S i + L i < T , whereas w e require the untruncated cumulativ e distribution function ρ ( · ) in ( 4 ). F ortun ately , th e truncation p oin t for eac h ( S i , L i ) is known and, therefore, one can sim p ly obtain a Kaplan–Me ier estimate of ρ ( · ) [Kaplan and Meier ( 1958 )]. W e use the fu nction sur vfit in the R su rvival pack age [Th erneau and Lumley ( 2011 )]. 3. Mod el fi tting. W e pr o vide algorithms to obtain a p oint estimate for π , asymp totic credibilit y in terv als and p osterior samples. F ollo w ing a 0–1 loss, as a p oin t estimate we rep ort the p osterior mo de, whic h is obtained b y maximizing the pro du ct of ( 2 ) and ( 3 ), sub ject to the constrain t P | ν | d =1 π d = 1 . W e note that maximum likel iho o d estimates are ob- tained by simply setting q d = 1 in ( 3 ). This constrained optimization can b e p erform ed with man y numerical optimization algo rithms. Here we used the EM algorithm [Dempster, Laird and Rubin ( 1977 )], as it is compu tationally efficien t ev en when th e num b er of v arian ts | ν | is large. F or a detailed deriv a- tion see App endix B . As noted ab o ve , for q d > 1 the log-p osterior is conca ve and, therefore, the algorithm con verge s to the single maxim u m. T he steps required for the algorithm are as follo w s: 1. Initialize π (0) d = q d / P | ν | d =1 q d . 2. A t iteration j , up d ate π ( j + 1) d = q d − 1 + P |P | k =1 x k p kd π ( j ) d P | ν | i =1 p ki π ( j ) i . Step 2 is rep eated un til the estimates stabilize. In our examples w e r equired | π ( j + 1) d − π j d | < 10 − 5 for all d . Notice th at p k d and x k remain constant thr ough all iteratio n s and, h ence, they need to b e co mputed only once. W e c h aracterize the p osterior un certain ty asymptoticall y us in g a nor- mal appr oximati on in the re-parameterized space θ d = log( π d +1 /π 1 ), d = 1 , . . . , | ν | − 1 and the delta metho d [Casella and Berger ( 2001 )]. Denote b y µ the p osterior mo d e for θ = ( θ 1 , . . . , θ | ν |− 1 ) and by S the Hessian of th e log- p osterior ev aluated at θ = µ . F u rther, let π ( θ ) b e the in verse tr an s formation and G ( θ ) the matrix with ( d, l ) element G dl = ∂ ∂ θ l π d ( θ ) . Detailed expressions for S , π ( θ ) and G ( θ ) are p ro vid ed in App endix C . The p osterior for θ can b e asymptotically appro ximated b y N ( µ , Σ), where Σ = S − 1 . Hence, the delta metho d appro ximates the p osterior for π with N ( π ( µ ) , G ( µ ) ′ S G ( µ )). 10 ROSSELL, S TEPHAN-OTTO A TTOLIN I , KROISS AND ST ¨ OCKER The asymptotic appr o ximation is also us eful for the follo win g in d ep end en t prop osal Metrop olis–Hastings sc heme. In itialize θ (0) ∼ T 3 ( µ , Σ) and notice that a pr ior P π ( π ) on π induces a p rior P θ ( θ ) = P π ( π ( θ )) × | G ( θ ) | on θ , where G ( θ ) is as ab o v e. A t iterat ion j , p er f orm the follo wing steps: 1. Prop ose θ ∗ ∼ T 3 ( µ , Σ) and let π ∗ = π ( θ ∗ ). 2. Set θ ( j ) = θ ∗ with probabilit y min { 1 , λ } , w here λ = P ( Y | π ∗ , ν ) P π ( π ∗ ) | G ( θ ∗ ) | P ( Y | π ( j − 1) , ν ) P π ( π ( j − 1) ) | G ( θ ( j − 1) ) | T 3 ( θ ( j − 1) ; µ , Σ ) T 3 ( θ ∗ ; µ , Σ ) . (5) Otherwise, set θ ( j ) = θ ( j − 1) . P osterior samples can b e obtained b y discarding some burn -in samples and rep eating the p r o cess until p ractical con v ergence is ac hiev ed. By default w e suggest 10,0 00 samples with a 1000 bu rn-in, as it p ro vid ed sufficien tly high n u merical accuracy when comparing tw o indep enden t chains (Supp lemen- tary Sectio n 2). 4. Results. W e a ssess th e p erf orm ance of our app roac h in simulations and t wo exp erimenta l data sets. W e obtained the tw o human samp le K562 replicates 6 from the R GASP pro ject ( www.gencodegenes.org/rgasp ) and t wo ENCODE P ro ject Consortium ( 2004 ) replicated samples obtained from A549 cells (acce s sion n umber wgEncodeEH002625 7 ). W e compare our re- sults with Cufflinks [T rapnell et al. ( 2012 )], Flux C apacitor [Mon tgomery et al. ( 2010 )] and BitSeq [Glaus, Honke la and Rattra y ( 2012 )]. Cu fflinks is based on a probabilistic mod el akin to C asp er, but uses exon and exon junc- tion coun ts instea d of full exon paths, assum es that fragmen t lengths are normally d istributed and estimates the read start distr ibution in an itera- tiv e manner. FluxCapacitor is also based on exon and exon junction counts, but uses a metho d of m omen ts t yp e estimator. BitSeq uses a fu ll Ba y esian mo del at the base-pair resolution (i.e., d ata is n ot summarized as counts) and estima tes the read start distribution with a t w o-step p ro cedur e. Regarding sequence alignmen t, for Casp er, Cuffl inks and FluxCapacitor w e used T opHat [T rapnell, Pac h ter and S alzb erg ( 2009 )] with the human genome hg19, u s ing the default parameters and a 200 bp a verage insert size. BitSeq r equ ired aligning to the transcriptome with Bo wtie [Langmead et al. ( 2009 )]. 6 ftp://ftp.sanger.a c.uk/pub/genco de/rgasp/R GASP1/inputdata/human fa stq/ . 7 genome.ucsc.edu/ENCODE . AL TERNA TIVE S PLICING FROM R NA-S EQ DA T A 11 Fig. 2. Estimate d fr agment length (top) and start (b ottom) distributions in K562 data (left) and A549 data (right). Black dotte d line: di ffer enc e in √ P S b etwe en r eplic ates (values in se c ondary y-ax is). 4.1. Simulation study. W e generated h u man genome-wide R NA-seq data, setting th e simulatio ns to resem ble the K562 R GASP data in ord er to k eep them as realistic as p ossible. Figure 2 (left) sho ws our estimates ˆ P S and ˆ P L . W e s et P S and π for eac h gene with 2 or more v ariants to their estimates in the K562 data. F or ea c h gene we sim ulated a n u m b er of fragmen ts equal to that observ ed in th e K562 sample. W e consid ered a Casp er-based and a Cufflinks-based s im u lation scenario. In the former w e set π and P L to the C asp er estimates ( q d = 2 ). The second scenario w as designed to fav or Cufflink s b y usin g its π estimates and setting P L to its assumed Normal distribution (mean = 200, standard deviation = 20). W e indicated the data-generating P L to C ufflinks, wh er eas the remaining metho ds estimated it from the data. An im p ortan t difference b et w een scenarios is that C asp er estimates with q d = 2 are p o oled a wa y from 12 ROSSELL, S TEPHAN-OTTO A TTOLIN I , KROISS AND ST ¨ OCKER T able 3 Me an absolute and squar e err ors, bi as and varianc e for simulation study for Casp er (top) and Cuffl inks estimates (b ottom) MAE MSE Bias sq rt V ariance Casper-based simula tions Casper ( q d = 1) 0.094 0.028 0.004 0.024 Casper ( q d = 2) 0.055 0.004 0.004 0.004 Cufflinks 0.141 0.050 0. 028 0.022 FluxCapacitor 0.151 0.054 0. 022 0.032 Cufflinks-based simulatio ns Casper ( q d = 1) 0.100 0.055 0.021 0.034 Casper ( q d = 2) 0.111 0.035 0.032 0.003 Cufflinks 0.127 0.073 0. 045 0.028 FluxCapacitor 0.138 0.078 0. 036 0.042 the b oun dary , hence, π d is nev er exactly 0 or 1, whereas the Cuffl inks es- timates were often in the b oun dary (Supplemen tary Figure 4). Genes with less than 10 reads p er kilobase p er millio n (RPKM) w ere excluded fr om all calculatio ns to reduce biases du e to lo w expression. W e estimated π from the sim u lated d ata u sing our app roac h with p rior parameters q d = 1 and q d = 2, Cufflinks and FluxCapacitor. T ab le 3 rep orts the absolute and square errors ( | π d − ˆ π d | and ( π d − ˆ π d ) 2 ) a v eraged a cross all 18,909 isoforms and 100 simulated data sets for b oth simulat ion settings. W e also rep ort the a verage squared bias and v ariance. Th e Cu ffl inks and FluxCapacitor MAE are ov er 2.5 and 2.7 folds greater th an that for Casp er with q d = 2 (1.5 and 1.6 for q d = 1 , resp.) in the Casp er-based scenario. In the Cufflinks-b ased simulatio n the redu ctions w ere 1.14 and 1.24 fold (1. 27 and 1.38 for q d = 1 ). Th e improv emen ts in MSE are eve n more pronoun ced, with an o ver 2 fold impro vemen t for q d = 2 ev en in the Cufflinks -b ased sim u lation. Casp er also sho ws a mark ed impr o veme n t in bias for q d = 1 and v ariance for q d = 2 . See Sup plemen tary Figure 4 for corresp onding plots. Figure 3 (top) sho ws the MAE for eac h transcrip t as a function of RPKM, a m easure of o verall gene expression. Casp er improv es the estimates for essen tially all RPKM v alues in b oth sim ulation settings. Figur e 3 (b ottom) assesses t he MAE vs. the mean pairwise d ifference b et wee n v arian ts in a gene (n um b er of b ase p airs not shared). When v ariants in a gene share m ost exons this difference is small, that is, v ariant s are hard er to distinguish. Casp er estimates are the most accurate at all similarit y lev els, with the MAE decreasing as v arian ts b ecome more differentia ted. In terestingly , Cufflinks and FluxCapacitor sho w lo w er MAE as similarit y increases from lo w to medium, but then MAE b ecomes higher and more v ariable in genes with medium-highly d ifferen tiated v ariants. These results illustr ate the adv an tage AL TERNA TIVE S PLICING FROM R NA-S EQ DA T A 13 Fig. 3. Sim ulation study. Me an absolute err or vs. RPKM for Casp er estimates (a) and Cufflink estimates (b) and the me an b ase p air differ enc e b etwe en variants in a gene for Casp er (c) and Cufflinks-b ase d simulations (d) . of usin g fu ll exon paths, whic h provide more resolution in assignin g reads to splicing v ariant s. Finally , we assessed the fr equen tist co verage probabilities for the asymp- totic 95 % cred ibilit y in terv als (Section 3 ), fi nding that in 95.04% of the cases they con tained the tru e v alue. 4.2. Exp erimental data fr om RGASP pr oje ct. The t wo K562 rep licates w ere sequenced in 2009 with Solexa sequ en cing. The read length w as 75 bp and the mean fragment length ind icated in the d o cumenta tion is 200 bp for b oth replicat es. Figure 2 (top, left) sho ws t he est imated f ragmen t length distributions. W e observ e that the mean length differs significan tly from 200 bp and that there are imp ortan t differences b et w een replicates. Replicate 2 sh o ws a hea vy left tail that indicates a sub set of f ragmen ts sub stan tially 14 ROSSELL, S TEPHAN-OTTO A TTOLIN I , KROISS AND ST ¨ OCKER shorter than a verag e. This distr ib utional shap e cannot b e captured with the usual paramet ric distrib utions. Figure 2 (left, bottom) s ho ws the relativ e start distrib ution. W e obs erv e m ore sequences lo cated n ear the transcript end in r eplicate 1, that is, a h igher 3’ bias. Th e differences b et w een replicates illustrate the n eed of flexibly mo deling these distr ibutions for eac h sample separately . In fact, we found th at ˆ P S differed across genes with v arying length (Sup plemen tary Sectio n 1 and Sup plemen tary Fig ure 1), the 3’ bias b eing stronger in genes shorter than 3 k ilo-bases. W e estimated the expression of h u man splicing v ariants in the UCSC genome v ersion hg19 for the tw o replicated s amp les separately . Figure 4 (left) and T able 4 compare the estimates obtained in the tw o samples. The Mean Absolute Difference (MAD) b et wee n replicates w as 0.06 4 for Casp er, 0.126 for Cufflinks (97% increase), 16.2 for FluxCapacitor (253% in crease) and 8.5 for BitSeq (31% increase). Figure 4 shows a r oughly lin ear corre- lation for Ca sp er, Cufflinks a nd FluxCapacitor, the latter t wo frequen tly pro v id ing ˆ π d = 0 in one replicate and ˆ π d = 1 in the other. Bit Seq a voids these b oundaries b u t exhibits a s trongly nonlinear asso ciation. In terms of computational time, all metho d s requir ed roughly 10–20 min on 4 pro ces- sors. Because BitSeq mo d els the data at the base-pair resolution, it required substanti ally longer time to run on 12 cores. These r esults su ggest that Casp er p ro vides clea r adv anta ges ev en with earlier sequencing tec h nologies. 4.3. Exp erimental data fr om E NCODE pr oje ct. The tw o A549 r eplicated samples were sequenced in 2012 using Illumina HiSeq 2000. The r ead length w as 101 b p and the a v er age f r agmen t length was rou gh ly 300 bp (Figure 2 , top right) . T h ese are su bstant ially longer than th e 2009 samples from Sec- tion 4.2 , and r eflect the imp ro vemen t in sequencing tec hnologies. Similar to Section 4.2 , Figure 2 reve als i mp ortant d ifferences in the fragment length (top, righ t) and start (bottom, right) distributions b etw een samples. S ee also Supp lemen tary Section 1 and Supp lemen tary Figure 2, wh ere ˆ P S exhibits a stronger 3’ bias for genes longer than 5 kilo-bases. Figure 4 (left) and T able 4 compare the estimates obtained in the tw o replicates. Similar to the RGASP study (Section 4.2 ), Casp er sho ws a roughly linear asso ciation and substan tially higher consistency b et we en r eplicates. The MAD b et wee n replicates w as 0.057 for C asp er, 9.0 for Cufflinks (58% in - crease), 12.7 for FluxC apacitor (223% increase) an d 0.098 for BitSeq (72% increase). The computational time for Casp er w as c omparable t o that of Cufflinks, higher than FluxCapacitor and sub stan tially lo we r than BitSeq. The findings sh ow that the a d v an tage of mo d eling exon path counts o v er pairwise exon connections remains p ronounced as tec hnology ev olve s to se- quence longer fr agmen ts. AL TERNA TIVE S PLICING FROM R NA-S EQ DA T A 15 (a) (b) (c) Fig. 4. Comp arison of estimate d isoform expr ession π d b etwe en two r eplic ates in K562 and ENCODE studies. (a) Casp er with q d = 2 ; (b) Cufflinks; (c) FluxCap acitor; (d) Bit- Se q. 16 ROSSELL, S TEPHAN-OTTO A TTOLIN I , KROISS AND ST ¨ OCKER (d) Fig. 4. (Continue d). W e no w consider the p ossibilit y that some expr essed transcripts may n ot b e present in the UCS C genome annotations. W e u sed a Cufflink s RABT mo dule to iden tify no vel transcripts, and then ru n Casp er to joint ly estimate their expr ession with UCSC transcripts. C ufflinks-RABT foun d 12,512 gene islands with no n ew transcripts, 6229 with some new transcr ip ts and 1527 completely new genes in sample 1. F or sample 2 the figur es w ere 11,912, 6983 and 1378 completely new genes. While new transcripts had negligible influence on genes with no new transcripts, in th e remainin g genes ˆ π d de- creased so that a prop ortion of the exp ression could b e assigned to the new v arian ts. F or further details see Supplement ary Sect ion 4. T hese findings suggest that curren t genome annotatio n s may miss a nonnegligible n umb er of expressed v ariants. F or a careful assessment we recommend follo wing a strategy akin to ours h ere, that is, co m b in ing our approac h w ith a de novo transcript disco ve ry metho d . T able 4 K562 and Enc o de studies. Me an absolute differ enc e (MAD) i n ˆ π d b etwe en r eplic ates and CPU time on 2.8 GHz , 32 Gb OS X c omputer ( + : 4 c or es; ∗ : 12 c or es) K562 Encod e MAD CPU MAD CPU Casper + 6 . 4 × 10 − 2 11.1 min 5 . 7 × 10 − 2 2 h 11 min Cufflinks + 12 . 6 × 10 − 2 21.4 min 9 . 0 × 10 − 2 2h 13 min Flux + 16 . 2 × 10 − 2 9.0 min 12 . 7 × 10 − 2 1 h 17 min BitSeq ∗ 8 . 5 × 10 − 2 1 day 13 h 9 . 8 × 10 − 2 8 h 40 min AL TERNA TIVE S PLICING FROM R NA-S EQ DA T A 17 5. Discussion. W e prop osed a model to estimat e the expression of a set of kno wn alternativ ely sp liced v arian ts from RNA-se q data. T he model im- pro ves up on previous prop osals b y using exon paths, whic h are more in- formativ e than single or p airwise exon counts, and by fl exibly estimating the fr agmen t start and length distribu tions. W e provided compu tationally efficien t algorithms f or obtaining p oin t estimate s, asymptotic credibilit y in- terv als and p osterior samples. W e found that a fairly un informativ e p rior with q d = 2 impro v es precision relativ e to the t ypical q d = 1 equiv alen t to maxim um like liho o d estimation. The adv an tages stem from the usu al shrin k age argument: q d = 2 p o ols the estimates a w ay f rom th e b oun daries and reduces v ariance. Compared to comp eting approac hes, we observ ed s ubstanti al MSE reductions in simula- tions and increased correlation b et ween exp erimen tal replicates. In mo d ern studies we found that roughly 2 sequences out of 3 visited > 2 exon regions distinguishing v arian ts, s uggesting that the curr en t standard of r ep orting pairwise exon ju nctions adopted by most pu blic d atabases is far from op- timal. Rep orting exon paths w ould allo w researc hers to estimate isoform expression at a m uc h h igher precision. Give n that the metho d ology is im- plemen ted in the R pac k age ca sper , we b elieve that it sh ould b e of great v alue to practitioners. APPENDIX A: DERIV A TION OF EX ON P A TH PR OBABILITIE S Here w e describ e how to compu te the probab ility p k d of obs erving exon path k for an y sp licing v arian t d . Equ iv alen tly , we denote d by δ = ( i 1 , . . . , i | δ | ), where i j indicates the j th exon within d . Consider v arian t δ after splicing, that is, after remo ving th e introns. The new exon start p ositions are giv en b y s ∗ 1 = 1 and s ∗ k +1 = s ∗ k + e i k − s i k + 1 for k = 1 , . . . , | δ | − 1. The end of exon k is s ∗ k +1 − 1. Denote by S the read start position, L the fragmen t length, r the read length, and let T = s ∗ | δ | − 1 b e the transcript length of δ . The goal is to compute P ( ι l = ( i j , . . . , i j + k ) , ι r = ( i j ′ , . . . , i j ′ + k ′ ) | δ ) . W e note that b oth i j , . . . , i j + k and i j ′ , . . . , i j ′ + k ′ m u st b e consecutiv e exons un der v arian t δ , otherwise the probabilit y of the p ath is zero. The left read f ollo ws the exon p ath ι l = ( i j , . . . , i j + k ) if and only if the read: 1. Starts in exon j , that is, s ∗ j ≤ S ≤ s ∗ j +1 − 1. 2. Ends in exon j + k , that is, s ∗ j + k ≤ S + r − 1 ≤ s ∗ j + k +1 − 1. Similarly , the righ t read follo ws ι r = ( i j ′ , . . . , i j ′ + k ′ ) if and only if s ∗ j ′ ≤ S + L − r ≤ s j ′ +1 − 1 and s ∗ j ′ + k ′ ≤ S + L − 1 ≤ s ∗ j ′ + k ′ +1 − 1 . This implies that the desired p r obabilit y can b e w ritten as P ( a 1 ≤ S ≤ b 1 , a 2 ≤ S + L ≤ b 2 | δ ), where a 1 = max { s ∗ j , s ∗ j + k − r + 1 } , 18 ROSSELL, S TEPHAN-OTTO A TTOLIN I , KROISS AND ST ¨ OCKER b 1 = min { s ∗ j +1 − 1 , s ∗ j + k +1 − r } , (6) a 2 = max { s ∗ j ′ + r , s ∗ j ′ + k ′ + 1 } , b 2 = min { s ∗ j ′ +1 + r − 1 , s ∗ j ′ + k ′ +1 } . Assuming that the distrib ution of ( S, L ) dep ends on δ only throu gh its transcript length T , w e can write P ( a 1 ≤ S ≤ b 1 , a 2 ≤ S + L ≤ b 2 | T ) = X l P ( a 1 ≤ S ≤ b 1 , a 2 ≤ S + L ≤ b 2 | T , L = l ) P ( L = l | T ) (7) = X l P (max { a 1 , a 2 − L } ≤ S ≤ min { b 1 , b 2 − L }| T , L = l ) P ( L = l | T ) . In order to ev aluate ( 7 ), w e need to estimate the fragmen t length distribu tion P ( L = l | T ) and the distribu tion of the read s tart p osition S giv en L . W e assume that P ( L | T ) = P ( L = l )I( l ≤ T ) /P ( L ≤ T ) , that is, the conditional distribution of L giv en T is simp ly a truncated v ersion of the m arginal distribution. F urther , notice that the fragmen t end must h app en b efore the end of the t ranscript, that is, S + L − 1 ≤ T or, equ iv alen tly , the relativ e start p osition is t runcated S /T ≤ S T = ( T − L + 1) /T . T he relativ e start distribution is therefore truncated, that is, P ( S T ≤ z | T , L = l ) = ϕ (min { z ,S T } ) ϕ ( S T ) , where ϕ ( z ) = P ( S T ≤ z ) is the d istr ibution of the r elativ e read start S T . Under these assumptions, the pr obabilit y of observing th e exon path ι l = ( i j , . . . , i j + k ), ι r = ( i j ′ , . . . , i j ′ + k ′ ) under v arian t δ is equal to X l [( ϕ (min { b 1 /T , ( b 2 − l ) /T , S T } ) − ϕ (min { max { ( a 1 − 1) /T , ( a 2 − l − 1) /T } , S T } )) /ϕ ( S T )] + P ( L = l | T ) , where a 1 , b 1 , a 2 and b 2 are give n in ( 6 ). Giv en th at h ighly precise estimates of P ( L = l ) and ϕ ( · ) are t ypically a v ailable, for computational simplicit y we treat them as kno wn and p lug th em in to ( 8 ). APPENDIX B: EM ALGORITHM DERIV A TION 1. E-step . Let δ i ∈ { 1 , . . . , | ν |} b e laten t v ariables in d icating the v ariant that r eads i = 1 , . . . , N come from. The augmente d log-posterior is prop ortional to l 0 ( π | y , δ ) = log P ( π | ν ) + log P ( y , δ | π ) (8) = | ν | X d =1 ( q d − 1) lo g ( π d ) + N X i =1 | ν | X d =1 I( δ i = d )[ log( p y i d ) + log ( π d )] . AL TERNA TIVE S PLICING FROM R NA-S EQ DA T A 19 Considering δ i as a rand om v ariable, the exp ected v alue of ( 8 ) giv en y and π = π ( j ) is equal to E ( l 0 ( π ′ | y , δ ) | y , π ( j ) ) = | ν | X d =1 ( q d − 1) log ( π d ) (9) + N X i =1 | ν | X d =1 P ( δ i = d | y i , π ( j ) )(log( p y i d ) + log ( π ′ d )) . 2. M-step . The go al is to maximize ( 9 ) with r esp ect to π ′ . Let γ id = P ( δ i = d | y i , π ( j ) ) and re-parameteriz e π | ν | = 1 − P | ν |− 1 d =1 π d . Setting the partial deriv ative s with resp ect to π ′ d to zero giv es the system of equations π ′ d 1 − P | ν |− 1 d =1 π ′ d = q d − 1 + P N i =1 γ id q | ν | − 1 + P N i =1 γ i | ν | , whic h has the trivial solution π ′ d ∝ q d − 1 + P N i =1 γ id . By plu gging in γ id = p y i d π ( j ) d / P | ν | d =1 p y i d π ( j ) d , w e obtain π ′ d ∝ q d − 1 + N X i =1 p y i d π ( j ) d P | ν | d =1 p y i d π ( j ) d . Finally , sin ce x k = P N i =1 I( y i = k ), w e can group a ll y i ’s taking t he same v alue and find the maximum as π ′ d ∝ q d − 1 + |P | X k =1 x k p k d π ( j ) d P | ν | d =1 p k d π ( j ) d , (10) re-normalizing π ′ so that P | ν | d =1 π ′ d = 1 . APPENDIX C: ASYMPTO TIC PO STERIOR APPRO XIMA TION Here w e deriv e an asymptotic app ro ximation to P ( π | ν , Y ), the p osterior distribution of the splici ng v ariants expression π conditional on a mo del ν and the obs er ved d ata Y . Giv en that π = ( π 1 , . . . , π | ν | ) ∈ [0 , 1] | ν | with P | ν | i =1 π i = 1, we re-parameterize to θ = ( θ 1 , . . . , θ | ν |− 1 ) ∈ ℜ | ν |− 1 , w here θ d = log( π d +1 π 1 ) for d = 1 , . . . , | ν | − 1. The goal is to appro ximate P ( θ | ν , Y ) ∼ N ( µ , Σ ). F or n otational simplicit y , in the remainder of th e section w e d r op the conditioning on ν . 20 ROSSELL, S TEPHAN-OTTO A TTOLIN I , KROISS AND ST ¨ OCKER A prior P π ( π ) in d uces a prior P θ ( θ ) = P π ( π ( θ )) × | G ( θ ) | on θ , where G ( θ ) is the matrix with ( d, l ) elemen t G dl = ∂ ∂ θ l π d ( θ ) and inv erse tran s form π 1 ( θ ) = (1 + P | ν |− 1 j =1 e θ j ) − 1 , π d ( θ ) = π 1 ( θ ) exp { θ d − 1 } for d > 1. Define f ( θ ) = log ( P ( Y | θ )) + log( P θ ( θ )). Up to an additive constant, f ( θ ) is equal to th e target log-p osterior distribution of θ giv en Y . W e center the appro ximating Normal at the p osterior m o de, that is, µ = argmax θ ∈ℜ | ν |− 1 f ( θ ). W e set Σ = S − 1 , where S is th e Hessian of f ( θ ) ev aluated at θ = µ w ith ( l, m ) elemen t S lm = ∂ 2 ∂ θ l ∂ θ m f ( θ ). W e appro x im ate µ d = log ( π ∗ d +1 π d ), where π ∗ is the p osterior mo de for π provided by the EM algorithm. Under a π ∼ Diric h let( q ) prior, simple algebra giv es σ lm = ∂ 2 ∂ θ l ∂ θ m f ( θ ) = |P | X k =1 x k ( P | ν | d =1 p k d H dlm )( P | ν | d =1 p k d π d ( θ )) − ( P | ν | d =1 p k d G dl )( P | ν | d =1 p k d G dm ) ( P | ν | d =1 p k d π d ( θ )) 2 (11) + | ν | X d =1 ( q d − 1) H dlm π d ( θ ) − G dl G dm π d ( θ ) 2 , where x k = P N i =1 I( y i = k ) is th e n u m b er of reads follo win g exon path k , p k d = P ( Y i = k | δ = d ) is the probability of observin g path k under v arian t d , th e gradient for π d ( θ ) is G dl = ∂ ∂ θ l π d ( θ ) as b efore and the Hessian is H dlm = ∂ 2 ∂ θ l ∂ θ m π d ( θ ). W e complete the d eriv ation by pro viding exp ressions for G dl and H dlm . Let s ( θ ) = 1 + P | ν |− 1 j =1 e θ j , then G dl = − e θ l s ( θ ) 2 if d = 1 , (12) − e θ d − 1 + θ l s ( θ ) 2 + I( l = d − 1) e θ l s ( θ ) if d ≥ 2 and H dlm = 2 e θ l + θ m s ( θ ) 3 − I( l = m ) e θ l s ( θ ) 2 if d = 1 , (13) 2 e θ d − 1 + θ l + θ m s ( θ ) 3 − I( l = d − 1) e θ l + θ m s ( θ ) if d ≥ 2 , m 6 = l , m 6 = d − 1 , − 2 e 2 θ m s ( θ ) 2 + 2 e 3 θ m s ( θ ) 3 + e θ m s ( θ ) − 2 e 2 θ m s ( θ ) 2 if d ≥ 2 , m = l , m = d − 1 , − e θ d − 1 + θ l s ( θ ) 2 + 2 e θ d − 1 + θ l + θ m s ( θ ) 3 otherwise. AL TERNA TIVE S PLICING FROM R NA-S EQ DA T A 21 Ac kn owledgmen ts. D. Rossell and C. Stephan-Otto A ttolini con tr ib uted equally to this w ork. The authors wish to thank Mod esto Orozco for useful discussions. SUPPLEMENT AR Y MA TERIAL Supp lemen tary resu lts (DOI: 10.1214/1 3-A O AS687SUPP ; .p df ). In Rossell et al. ( 2014 ) we assess th e dep en dence of fragment start and length distri- butions on gene length, sh ow add itional sim ulation results, assess MCMC con verge n ce and apply th e approac h to transcripts foun d de novo . REFERENCES Ameur, A. , We tterbom, A . , Feuk, L. and Gyllensten, U. (2010). Global and unbi- ased detection of splice junctions from RNA -seq data. Gen ome Biol. 11 R34. Blencow e, B. J. (2006). Alternative splicing: New insights from global analyses. Cel l 126 37–47. Casella, G. and Ber ge r, R. L. (2001). Statistic al I nfer enc e , 2nd ed. Duxbu ry , N. Scit- uate. Dempster, A. P. , Laird, N. M . and Rubin, D. B . ( 1977). Maxim um likel ihoo d from incomplete data via the EM algo rithm. J. R. Stat. So c. Ser. B Stat. Metho dol. 39 1–38. MR0501537 ENCODE Pro ject Co nsortium (2004). The EN CODE (ENCyclop edia Of DNA Elements) Pro ject. Scienc e 306 636–640 . Glaus, P. , Honkela, A. and Ra ttra y, M. (2012). Identi fying differentiall y expressed transcripts from RN A-seq data with biologica l v ariation. Bioinformatics 28 1721–1728. Guttman, M. , G arber, M. , Levi n, J. Z. , Donaghey, J. , Robinson, J. , Adiconis, X. , F an, L. , Koziol, M. J. , Gnirke, A. , N usbaum, C. , Rinn, J. L. , La nder, E. S. and Regev, A . (2010). Ab initio reconstruction of cell type- sp ecific transcriptomes in mouse rev eals the conserved multi-exonic structure of lincRNAs. Natur e Biote chnoly 28 503–510 . Hol t, R. A. and Jones, S. J. M. (2008). The new p aradigm of flow cell sequ encing. Genome R ese ar ch 18 839–846. Jiang, H. and Wong, W . H. (2009). Statistical inferences for isoform expression in RNA- Seq. Bioinformatics 25 1026–10 32. Kaplan, E. L. and Meier, P. (195 8). Nonparametric estimation from in complete obser- v ations. J. Amer. Statist. Asso c. 53 457–4 81. MR 0093867 Ka tz, Y. , W an g, E. T. , Airoldi, E. M. and Bu rge, C. B. (2010). Analysis and d esign of RNA sequencing exp eriments for iden tifying isofor m regulation. Nat. M etho ds 7 1009– 1015. Lacr oix, V. , Sam meth, M. , Guigo, R. and Berger on, A. (2008). Ex act T ranscriptome Reconstruction from Short Sequ ence Reads. In Pr o c e e dings of the 8th International Workshop on Algorithms in Bioinformatics . 50–63. Sp ringer, Berlin. Langmead, B. , Trapnell, C . , Pop, M. and Salzberg, S. L. (2009 ). Ultrafast and memory-efficient alignmen t of short DN A sequences t o t h e human genome. Genome Biol. 10 R25. Li, H. and Durbin, R. (2009). F ast and accurate short read alignmen t with Burrows– Wheeler transform. Bioinformatics 25 1754–176 0. 22 ROSSELL, S TEPHAN-OTTO A TTOLIN I , KROISS AND ST ¨ OCKER Li, R. , Yu, C. , Li, Y . , Lam, T. W . , Yiu, S. M. , Kristi ansen, K. and W ang, J. (2009). SOAP2: An improv ed ultrafast to ol for short read alignment. Bioinformatics 25 1966– 1967. Montgomer y, S. B. , Sammeth, M. , Gutie rrez-Arcelus, M. , Lach, R. P. , Ingle, C . , Nisbett, J. , Guigo, R. and Derm itzakis, E. T. (2010). T ranscriptome genetics using second generation sequencing in a Caucasian p opulation. Natur e 464 773–77 7. Mor t aza vi, A . , W illiams, B. A. , M cCue, K. , S chaeffer, L. and B ., W. (2008). Mapping and quantifying mammalian transcriptomes by R NA-Seq . Natur e M etho ds 5 621–628 . Pepke, S. , W old, B. and Mor t aza vi, A. (2009). Comput ation for ChI P-seq and R NA- seq studies. Nat. Metho ds 6 S22–S32. Ro ber ts, A. , Trapnell, C. , Donaghey, J. , R inn, J. L. and P achter, L. (2011a). Improving R NA-S eq ex pression estimates by correcting for fragment bias. Genome Biol. 12 R22. Ro ber ts, A. , Pimentel, H. , Trapnell, C. and P achter, L. (2011b). Identification of nov el transcripts in annotated genomes using RNA-Seq. Bioinformatics 27 2325–2 329. Ro gers, M. F. , Thomas, J. , Red dy, A. S. and Ben-Hur, A. (2012). SpliceGrapher: Detecting patterns of alternativ e splicing from RNA-S eq data in the context of gene mod els and EST data. Genome Bi ol. 13 R4. Ro ssell, D. , Stephan-Otto A ttolini, C. , Kr oiss, M. and St ¨ ocker, A. (2014). S up- plement to “Qu antifying alternative splicing from paired-end RNA-sequencing data.” DOI: 10.1214 /13-A OAS687SUPP . Salzman, J. , Jiang, H. and Wong, W. H. (2011). Statistical mo deling of RN A-Seq d ata. Statist. Sci. 26 62–8 3. MR2849910 Therneau, T. and Lumley, T. (2011). Surviv al: Surviva l analysis, including p en alised lik elihoo d. R pack age version 2.36-10. Trapnell, C. , P achter, L. and Salz berg, S. L. (2009). T op H at: Discov ering splice junctions with RNA- S eq. Bioinformatics 25 110 5–1111. Trapnell, C. , William s, B. A. , Per tea, G. , Mor t aza vi, A . , Kw an, G. , v an Baren, M. J. , Salzberg, S. L. , W old, B. J. and P a ch ter, L. ( 2010). T ranscript assem bly and quantification b y RNA- S eq rev eals unannotated transcripts and isoform switc hin g during cell differentiation. Nat . Biote chnol. 28 511–515. Trapnell, C. , Rober ts, A. , Goff, L. , Per tea, G . , Ki m, D. , Ke lley, D. R. , Pi- mentel, H . , S alzberg, S. L. , Rinn, J. L. and P achter, L. (2012). Differen tial gene and transcript exp ression analysis of R NA-seq exp eriments with T opH at and Cufflinks. Natur e Pr oto c ols 7 562–57 8. Wu, Z. , W ang, X . and Zhang, X. (2011). Using non-u niform read distribution mo dels to impro ve is oform expression inference in RNA-S eq. Bioinformatics 27 502–508 . Wu, J. , Akerman, M. , Sun, S . , McCombie, W. R. , Krai ner, A. R. and Zhang, M. Q. (2011). Sp liceT rap: A method t o quantify alternative splicing under single cellular con- ditions. Bioinf ormatics 27 3010–3016 . Xing, Y . , Yu, T. , Wu, Y. N. , Ro y, M. , Kim, J. and Lee , C. (2006). An exp ectation– maximization algorithm for probabilistic reconstructions of full-length isoforms from splice graphs. Nucleic. A cids R es. 34 3150–31 60. D. R ossell Dep ar tment of St a tistics University of W ar wick Gibbel Hill Rd. Coventr y CV4 7 AL United Kingdom E-mail: D.Rossell@warwic k.ac.uk C. Stephan-Otto A ttolini Institute for Research in Biom edicine of Barcelona Baldiri Reixac 10 Barcelona 08028 Sp ain E-mail: camille.stephan@irbbarcelona.org AL TERNA TIVE S PLICING FROM R NA-S EQ DA T A 23 M. Krois s LMU Munich Geschwister-Scholl-Pla tz 1 M ¨ unchen 089 2180-0 Germany E-mail: kroissm@in.tum.de A. St ¨ ocker TU Munich Geschwister-Scholl-Pla tz 1 M ¨ unchen 089 2 180-0 Germany E-mail: al.st@web.de The Annals of Applie d Statistics 2015, V ol. 9, No. 3, 1706–170 7 DOI: 10.1214 /15-A OAS855 c Institute of Mathematical Statistics , 2 015 CORRIGENDUM QUANTIFYING AL TERNA TIVE SPLICING FR OM P A IRED-END RNA-SEQ DA T A By D a vid Rossell ∗ , Camille Ste phan-Otto A ttolini † , Manuel Kroiss ‡ , § and Al mond St ¨ ocker ‡ University of Warwick ∗ , Institute for R ese ar ch in Biome dici ne of Bar c elona † , LMU Mu nich ‡ and TU Munich § In Figure 4(d) of Rossell et al. ( 2014 ) (Section 4.3), we follo w ed the stan- dard pip eline for BitSeq and u sed the b o wtie aligner (v ersus T ophat for th e other metho ds, casp er, Cuffl in ks and BitSeq). The BitSeq authors noted that w e u s ed the b owtie 1 v ersion, wh ic h ga ve v ery low mapping rates ( < 2% aligned r eads in b oth samples). Figure 1 b elo w u ses b o w tie2, whic h gives mapping rates > 70% (the MAD b etw een replicates also drops, fr om 0.098 to 0.062). W e thank the Bitseq authors for alerting u s to b o wtie2. Fig. 1. Corr e cte d Figur e 4d , right p anel. Received March 2015; revised June 2015. This is an electronic reprint of the or iginal a r ticle published by the Institute o f Mathematical Statis tics in The A nn als of Appli e d Statistics , 2015, V ol. 9, No. 3, 1706–1 707 . This r e print differs from the original in pa g ination and typog raphic detail. 1 2 ROSSELL, S TEPHAN-OTTO A TTOLIN I, KROISS AND ST ¨ OCKER REFERENCE Ro ssell, D. , S tephan-Otto A ttolini, C. , Kroiss, M. and St ¨ ocker, A . ( 2014). Quan- tifying alternative splicing from p aired-end RN A-sequen cing data. A nn. Appl. Stat. 8 309–330 . MR3191992 D. R ossell Dep ar tment of St a tistics University of W ar wick Gibbel Hill Rd. Coventr y CV4 7 AL United Kingdom E-mail: D.Rossell@warwic k.ac.uk C. Stephan-Otto A ttolini Institute for Research in Biom edicine of Barcelona Baldiri Reixac 10 Barcelona 08028 Sp ain E-mail: camille.stephan@irbbarcelona.org M. Krois s LMU Munich Geschwister-Scholl-Pla tz 1 M ¨ unchen 089 2180-0 Germany E-mail: kroissm@in.tum.de A. St ¨ ocker TU Munich Geschwister-Scholl-Pla tz 1 M ¨ unchen 089 2 180-0 Germany E-mail: al.st@web.de
Original Paper
Loading high-quality paper...
Comments & Academic Discussion
Loading comments...
Leave a Comment