Time Series Clustering via Community Detection in Networks
In this paper, we propose a technique for time series clustering using community detection in complex networks. Firstly, we present a method to transform a set of time series into a network using different distance functions, where each time series i…
Authors: Leonardo N. Ferreira, Liang Zhao
Time Series Clustering via Comm unit y Detection in Net w orks I Leonardo N. F erreira a, ∗ , Liang Zhao b a Institute of Mathematics and Computer Scienc e, University of S˜ ao Paulo Av. T r ab alhador S˜ ao-c arlense, 400 CEP: 13566-590 - Centr o, S˜ ao Carlos - SP, Br azil. b Dep artment of Computing and Mathematics, University of S˜ ao Paulo Av. Bandeir antes, 3900 - CEP: 14040-901 - Monte A le gr e - R ib eir˜ ao Pr eto - SP, Br azil. Abstract In this pap er, w e prop ose a technique for time series clustering using communit y detection in complex netw orks. Firstly , we presen t a metho d to transform a set of time series into a net w ork using different distance functions, where each time series is represented by a vertex and the most similar ones are connected. Then, we apply comm unit y detection algorithms to identify groups of strongly connected vertices (called a comm unity) and, consequently , iden tify time series clusters. Still in this pap er, w e mak e a comprehensive analysis on the influence of v arious combinations of time series distance functions, net w ork generation methods and comm unit y detection tec hniques on clustering results. Exp erimental study shows that the prop osed netw ork-based approach ac hiev es b etter results than v arious classic or up-to-date clustering techniques under consideration. Statis- tical tests confirm that the prop osed method outp erforms some classic clustering algorithms, such as k -medoids, diana, median-link age and cen troid-link age in v arious data sets. In terestingly , the prop osed metho d can effectiv ely detect shap e patterns presented in time series due to the top olog- ical structure of the underlying netw ork constructed in the clustering process. A t the same time, other tec hniques fail to identify suc h patterns. Moreov er, the prop osed metho d is robust enough to group time series presen ting similar pattern but with time shifts and/or amplitude v ariations. In summary , the main p oin t of the prop osed method is the transformation of time series from time-space domain to top ological domain. Therefore, we hop e that our approac h con tributes not only for time series clustering, but also for general time series analysis tasks. Keywor ds: Time series data mining, Time series clustering, Complex net works, Communit y detection. 1. In tro duction Time series data mining has received a lot of atten tion in the last y ears due to the ubiquity of this kind of data. One sp ecific task is clustering with the goal to divide a set of time series in to groups, where similar ones are put in the same cluster [ 12 ]. Such kind of problem has been observ ed in man y application domains lik e climatology , geology , health sciences, energy consumption, failure detection, among others [ 35 ]. I This man uscript v ersion is made a v ailable under the Creative Commons BY-NC-ND 4.0 license . ∗ Corresp onding author Email addr esses: leonardo@icmc.usp.br (Leonardo N. F erreira), zhao@usp.br (Liang Zhao) Pr eprint submitte d to Information Scienc es August 20, 2015 The tw o desired asp ects when performing time series clustering are effectiv eness and efficiency [ 34 ]. Effectiv eness can b e ac hieved b y represen tation metho ds that should b e capable of dealing with high dimensional data. Efficiency is obtained b y using distance functions and clustering algorithms that can prop erly distinguish differen t time series in an efficient wa y . Keeping these t wo features in mind, man y clustering algorithms hav e b een prop osed and those can b e broadly classified in to t wo approac hes: data-adaptation and algorithm-adaptation [ 35 ]. The former extracts features arra ys from each time series and then applies a clustering algorithm in its original form. The latter uses sp ecially designed clustering algorithms to directly handle time series. In this case, the ma jor mo dification is the distance function, whic h should b e capable of distinguishing time series. Complex netw orks form a recent and in teresting research area. Here, a complex netw ork refers to a large scale net work with non trivial connection pattern [ 4 ]. Many real-world systems can be mo deled by netw orks. One of the salien t features in many netw orks is the presence of comm unit y structure, whic h is represented b y groups of densely connected vertices and, at the same time, with sparse connections betw een groups. Detecting such structures is in teresting in man y real applications. F or this reason, many comm unity detection algorithms ha ve b een developed [ 14 ] and suc h algorithms presen t a pow erful mechanism for general data mining tasks. A brief review of comm unity detection techniques will b e given in the next section. In the original form of time series, only the lo cal relationship among neigh b or data samples can b e easily identified, while long distance global relationship remains unkno wn in general. On the other hand, time series analysis, such as time series clustering, classification or prediction, requires not only lo cal information, but also global kno wledge to capture the pattern formation of a given time series. Netw ork (graph) is a p o werful mec hanism, whic h is able to characterize the relationship b et ween an y pair or any groups of data samples. Therefore, the transformation from time series to net work represen tation is hop efully to present an alternativ e wa y for time series analysis. F rom the tec hnical view p oint, netw ork-based clustering techniques also present attractive adv antage. Up to no w, the ma jorit y of existing time series clustering techniques in literature use k -means, k -medoids or hierarchical clustering algorithms in their original forms or modified v ersions. The common feature of these algorithms is that they try to break data samples in to clusters in suc h a wa y that the partition optimizes a criterion defined b y a given distance function. As a consequence, these tec hniques can just find clusters of a sp ecific shap e already determined b y the distance function. F or example, k -means with the Euclidean distance function can only pro duce Gaussian distributed clusters. On the other hand, it has b een sho wn that netw ork-based clustering techniques can capture arbitrary cluster shap es. This is b ecause net work-based tec hniques iden tify connectivit y patterns of the input data and such patterns can b e any shap e in the Euclidean space. Finally , man y communit y detection techniques ha ve been prop osed and some of them hav e even linear time complexit y when the constructed netw ork is sparse [ 31 ]. This feature also mak es them attractiv e to time series data clustering. In this pap er, w e aim to apply netw ork science to temp oral data mining. W e in tend to verify the b enefits of using communit y detection algorithms in time series data clustering. More sp ecifically , w e prop ose an algorithm including 4 steps of pro cessing: (1) data normalization; (2) distance func- tion calculation; (3) netw ork construction, where every v ertex represents a time series connected to its most similar ones using a distance function; (4) comm unity detection, where each communit y represen ts a time series cluster. In summary , this pap er presents the following con tributions: • The main con tribution is the prop osal of using communit y detection in complex netw orks for 2 time series clustering. F or this purp ose, we transform time series from time-space domain to top ological domain. Since net work is a general representation, whic h has abilit y to charac- terize b oth lo cal and global relationship among no des (representing data samples), therefore, our approac h is useful not only for time series clustering but also for other kinds of time series analysis tasks. T o our knowledge, applying communit y detection tec hniques for time series clustering has not b een rep orted in the literature; • Extensiv e numerical study has b een conducted in this pap er. Sp ecifically , we study , in the time series clustering con text, combinations of time series data sets, time series distance func- tions, netw ork construction metho ds and communit y detection algorithms. In comparison to other time series clustering algorithms, exp erimental results and statistical tests show that the net work-based approach present b etter results. • Last but not least, the prop osed metho d presen ts some desired features when applied to real clustering problems. It can effectively detect shape patterns presen ted in time series due to the top ological structure of the underlying netw ork constructed in the clustering pro cess. A t the same time, other tec hniques studied in this pap er fail to iden tify suc h patterns. Moreo ver, the prop osed metho d is robust enough to group time series presenting similar pattern but with time shifts and/or amplitude v ariations. The remainder of this pap er is organized as follo ws. Firstly , we present in Section 2 some bac kground concepts and related works to this pap er. In Sections 3 and 4 w e present our approach and the exp erimen tal results, resp ectiv ely . Finally , we p oint some final remarks and future w orks in Section 5 . 2. Bac kground and related w orks In this section, we review the three main components of time series clustering used in this pap er: time series distance measures, clustering algorithms and communit y detection in net w orks. 2.1. Time series distanc e me asur es W e start b y presenting the basic concept: time series. F or simplicity and without los s of generalit y , we assume that time is discrete. Definition 1 (Time Series) . A time series X is an or der e d se quenc e of t r e al values X = { x 1 , . . . , x t } , x i ∈ R , i ∈ N . The main idea of clustering is to group similar ob jects. In order to discov er whic h data are similar, several distance (or dissimilarity) measures were defined in the literature. In this pap er, w e use the terms “similarit y” and “distance” in in v erse concepts. In the case of time series distance measures, the distance measures can be classified in to four categories [ 12 ]: shap e-based, edit-based, feature-based, and structure-based. 3 2.1.1. Shap e d b ase d distanc e me asur es The first category of time series distance measures is based on the shape of the time series. Suc h measures compare directly the raw data of a pair of time series. The most common measures are the L p norms that ha ve the following form: d L p ( X , Y ) = t X i =1 ( x i − y i ) p ! 1 p , (1) where p is a p ositive integer [ 38 ]. When p = 2, w e ha v e the so-called Euclidean distance (ED). The L p norms ha ve the adv antage of b eing intuitiv e, parameter-free, and linear complexity to the length of the series for computing. The shortcoming is that these measures are sensitive to noise and misalignmen t in time because a fixed pairs of data points are compared. F or this reason, these type of measures are called lo c k-step measures. In order to solve this problem, some elastic measures ha ve b een dev elop ed to allow time warping and, consequently , provide robust comparison results. Figure 1 illustrates a time series comparison made by lo c k-step and elastic measures, resp ectively . 0 50 100 150 200 250 −1.0 0.0 0.5 1.0 −2.5 −1.5 −0.5 0 0.5 (a) 0 50 100 150 200 250 −1.0 0.0 0.5 1.0 −2.5 −1.5 −0.5 0 0.5 (b) Figure 1: Time series comparison using lo c k-step and elastic measures, respectively . The total distance is proportional to the length of the gra y lines. (a) Lock-step measures compare fixed (one-to-one) pairs of elements. (b) Elastic measures p erform the alignment of the series and allow one-to-many comparisons of elements. The most famous elastic measures is the Dynamic Time W arping (DTW) that align t w o time series using the shortest warping path in a distance matrix [ 2 ]. A warping path W defines a mapping consisting of a sequence of adjacent matrix. There is a high n umber of path com binations and the optimal path is the one that minimizes the global w arping cost. The Short Time Series (STS) [ 26 ] and DISSIM [ 15 ] distances are designed to deal with time series collected in different sampling rates. The Complexity Inv ariant Distance (CID) [ 1 ] calculates the Euclidean distance corrected by a complexit y estimation of the series. 2.1.2. Edit Base d distanc e me asur es Edit-based distances compute the distance b etw een t wo series based on the minim um num b er of op erations needed to transform one time series into another. This kind of measures is based on the string edit distance (lev ensh tein) that coun ts the n um b er of c haracter insertions, deletions and substitutions needed to transform one string in to another. The Longest Common Subsequence (LCSS) [ 33 ] is one of the b est kno wn edit based measures. It allows not only time w arping, as DTW, but also gaps in comparison. Therefore, LCSS p ossesses t wo threshold parameters, ε and δ , for p oint matching and warping, respectively . 4 2.1.3. F e atur e b ase d distanc e me asur es This kind of measures has fo cus on extracting a num b er of features from the time series and comparing the extracted features instead of the raw data. Such features can b e selected b y v arious tec hniques, for example, using co efficients of a W av elet T ransform (DWT) as features [ 40 ]. In this category , the INTPER measure computes the distance based on the integrated p erio dogram from eac h series [ 10 ] and, then, it uses the Pearson correlation (COR) [ 19 ] to calculate the distance b et ween time series. 2.1.4. Structur e b ase d distanc e me asur es Differen t from feature based measures, structure based measures try to iden tify higher-level structures in the series. Some structure based measures use parametric mo dels to represen t the series, for example, Hidden Mark ov Mo dels (HMM) [ 32 ] or ARMA [ 37 ]. In these cases, the similarity is measured b y the probabilit y of one mo delled series pro duced b y the underlying model of another. There are other measures, whic h use the concept of compression (CDM) [ 22 ]. The idea is that when concatenating and compressing t wo similar series, the compression ratio should b e higher than the simple concatenation of them. 2.2. Time series clustering Clustering is one of the most common tasks in data mining. The goal is to divide dat a items into groups according a pre-defined similarity or distance measure. More sp ecifically , clusters should maximize the in tra-cluster similarit y and minimize the in ter-cluster similarit y . In the context of time series data mining, the same idea applies. Considering a set of time series, the goal is to find groups of time series that are similar inside the cluster but are relatively different from times series of other clusters. Time series clustering algorithms can b e broadly classified into tw o approac hes: data adaptation and algorithm adaptation [ 35 ]. The former extracts features arrays from eac h time series data and, then, applies a con ven tional clustering algorithm. The latter mo difies the traditional clustering algorithms in such a wa y that they can handle time series directly . Next, we review represen tative clustering metho ds follo wing the ab ov e classification. • Time series clustering b ase d on data adaptation : This class of algorithms extracts some features of input time series and, then, apply traditional clustering algorithms without any c hange. The adv an tage of such an approac h is that the feature extraction pro cess can even- tually reduce the amount of data and, consequen tly , reduce the pro cessing time. Moreo ver, b etter results can be obtained if the characterization pro cess is able to remo v e noise and filter out other kinds of irrelev ant information. One shortcoming of this approach is the high n umber of parameters that the algorithms should handle. Guo et. al. [ 20 ] present a tech- nique that conv erts the ra w data in to a low dimensional arra y using indep endent comp onent analysis and, then, apply k -means for clustering. Zak aria et al. [ 39 ] prop ose an algorithm that firstly extracts sub-sequences called shap elets, whic h are lo cal patterns in a time series and are highly predictive of a group. Then, the authors use the k -means algorithm to cluster shap elets. Brandmaier [ 5 ] in tro duces a metho d called Perm utation Distribution Clustering (PDC) that makes an em b edding of eac h time series into an m -dimensional space. The p erm utation distribution is obtained b y counting the frequency of distinct order patterns in an m -embedding of the original time series. The em b edding dimension m is automatically c hosen by PDC making it a parameter-free algorithm. The difference b etw een time series is 5 measured b y the differences b et ween their p erm utation distribution. After calculating this difference for each pair of time series, a hierarchical clustering algorithm, lik e single-link age or complete-link age, is applied to group similar series. • Time series clustering b ase d on algorithm adaptation : This class of algorithms adapts tradi- tional clustering algorithms to deal with time series. The ma jor mo dification is the distance function that should be capable of distinguishing time series. F or this purp ose, v arious time series similarit y measures can b e used in distance-based clustering algorithms. The problem of this kind of algorithms is that the similarity measures usually consider all of the v alues, ev en outliers and noise, in the series. Since all the data p oin ts are inv olv ed in the similarit y calculating, this approac h demands muc h pro cessing time and, th us, becomes infeasible to larger datasets. Golay et al. [ 19 ] applied the fuzzy c-means algorithm to group time series extracted from functional MRI data. Mahara j [ 24 ] prop osed a method based on hypotheses testing. It considers that tw o time series are different if they hav e significan tly differen t gener- ating pro cesses. Instead of building a distance matrix D , this metho d constructs a P matrix where p ij corresp onds to p -v alue obtained by testing if X i and X j w ere generated b y the same mo del. The clustering algorithm groups together time series that ha ve p -v alues greater than a significance lev el α previously sp ecified b y the user. Other adapted algorithms in- clude Self-Organizing Maps (SOM) [ 6 ], Hidden Marko v Mo dels (HMM) [ 32 ] and Exp ectation Maximization (EM) [ 36 ]. T o our knowledge, there isn’t work in the literature, which uses netw ork comm unity detection algorithms for time series clustering. The idea of using net work theory to cluster time series was first presen ted by Zhang et al. [ 41 ]. The metho d consists of the construction of a netw ork where eac h time series is represented b y a v ertex and each vertex is connected to its most similar one using DTW. Rather than clustering all v ertices, this metho d selects some candidates (vertices with high degree) and considers that their neigh b ors belong to the same cluster. The authors prop osed a hierarchical clustering that uses an DTW-based function that measures the similarity b et ween clusters and iterativ ely merge the most similar ones. As having been mentioned in the Introduction section, net work represen tation has definite adv an tage for c haracterizing global relationship among data samples and suc h an attractiv e feature is far from well explored in time series analysis. F or this reason, we here conduct a comprehensive study on time series clustering using netw ork representation. Sp ecifically , w e apply comm unity detection algorithms to produce time series clusters. Computer sim ulations show that our approach has go o d p erformance. Moreov er, it has the ability to iden tify arbitrary shap e of clusters. 2.3. Community dete ction in networks Net work (or graph) is one of the most pow erful mechanisms to represen t ob jects and their in teractions or relations. F ormally , a netw ork is defined as follo ws. Definition 2 (Netw ork) . A network (or a gr aph) G ( V , E ) is c omp ose d by a set of n vertic es V = { v 1 , . . . , v n } and a set of m e dges E = { ( v i , v j ) | v i , v j ∈ V } wher e ( v i , v j ) is an e dge that c onne cts two vertic es v i and v j . Man y real w orld systems are naturally represented as netw orks. Examples include so cial net- w orks, protein in teraction netw orks, neural net w orks and man y others [ 4 ]. In data analysis domain, net works can b e artificially constructed from the vector-based data format. One of the common 6 w ays to construct a netw ork requires only a distance measure b etw een the data samples in their original dataset. In this case, each sample is represented as a vertex and it is connected to its k most similar ones. Suc h netw orks are called k -nearest neighbor netw orks ( k -NN). In a similar w ay , net work can b e also constructed considering a threshold v alue ε . In this case, eac h pair of no des is connected if the similarity b etw een them is higher than ε . The netw orks constructed in this manner are called ε -nearest neigh b or netw orks ( ε -NN). Comm unities are groups of highly connected v ertices, while the connections b et ween groups are sparse (Fig. 2 ). Such structures are commonly observed in real world net works [ 18 ]. Communit y detection is a task that inv olves searc hing for the cluster structure of v ertices in a given net work. It is not a trivial task, since ev aluating all clustering (partitions) p ossibilities is NP-hard problem [ 14 ]. Because of this difficult y , many algorithms ha ve been prop osed to find out reasonable net work partitions in an efficien t wa y . Sev eral algorithms ha v e b een dev elop ed based on a netw ork measure called mo dularity score, whic h measures ho w goo d is a particular partition of a netw ork. In the F ast Greedy (FG) algorithm [ 8 ], firstly , all edges are remov ed and each no de itself is considered as a comm unity . A t eac h iteration, the algorithm determines which of the original edge, if it is added to this netw ork, w ould generate the highest increase of the modularity . Then, this edge is inserted into the netw ork and the t wo v ertices (or comm unities) are merged. This pro cess con tinues un til all comm unities are merged resulting in just one comm unity . Each iteration of the algorithm generates a p ossible solution but the b est partition is that one with the highest modularity . The Multilev el (ML) algorithm [ 3 ] p erforms in the same w ay as F G, except that it do es not stop when the highest mo dularity is found. After that, each communit y is abstracted to a single vertex and the pro cess starts again with the merged comm unities. The pro cess stops when there is just one vertex in the netw ork. Man y other algorithms hav e b een prop osed using random walks to find communities. The idea is that short random walks in the netw ork tend to stay in the same communit y . The W alktrap (WT) algorithm [ 28 ] uses the same greedy strategy as F G and ML; how ever, it chooses the communities to b e merged using a distance b et ween vertices instead of using modularity . The distance is based on the probabilit y distribution of a sp ecific vertex reaches each of the other ones in a random walk of length t . If tw o vertices are in the same communit y , their probability distributions should b e similar and their distance tends to b e 0. The authors also make a generalization of the distance to comm unities and, at each iteration, the algorithm merges those tw o communities, whic h minimize the mean of the squared distances b et ween each vertex and its communit y . Besides of the ab ov e mentioned algorithms, other strategies ha v e also b een considered to p er- form comm unity detection. F or example, the Lab el Propagation (LP) [ 29 ] algorithm uses the concept of information diffusion in the net work. It starts by giving a unique lab el to eac h vertex. A t eac h iteration, all vertices are visited in a random sequence and each one receives the lab el with the highest o ccurrence of its neigh b ors. During the pro cess, some lab els disappear and oth- ers dominate. The algorithm conv erges when the lab el of each vertex of the net w ork is the lab el of the ma jorit y of its neighbors. Finally , the comm unities are formed b y vertices that share the same lab el. The Infomap (IM) algorithm [ 30 ] use the concept of random w alks and information diffusion. The idea is compressing the description of information flows in the net work describ ed b y the tra jectory of random walk. The result is a map that is a simplification of the netw ork and highlight imp ortan t structures (comm unities) of the netw ork. F or a full review on communit y detection algorithms, w e refer the interested reader to [ 14 ]. 7 3. Description of the prop osed metho d The intuition b ehind our algorithm is simple. Eac h time series from a database is represented b y a v ertex and a distance measure is used to determine the similarit y among time series and connect the most similar ones. As exp ected, similar time series tend to connect to eac h other and form communities. Th us, we can apply communit y detection algorithms to detect time series clusters. The idea of this algorithm is illustrated b y Figure 2 and the whole pro cess will b e detailed in the follo wing. Figure 2: Time series clustering using communit y detection in netw orks. First, we construct a netw ork where every v ertex represen ts a time series connected to its most similar time series using a distance function. Then we apply comm unity detection algorithms in order to cluster time series. The communities are represen ted by vertices with differen t colors. More sp ecifically , the prop osed method is p erformed in 4 steps: 1) data normalization, 2) time series distance calculation, 3) netw ork construction and 4) comm unity detection. Eac h step is describ ed as follo ws: 1. Normalization : The first step is a pre-pro cessing stage that intends to scale the dataset. As observ ed in [ 34 ], normalization impro v es the search of similar time series when they hav e similar shap es but ha ve different scales. 2. Distanc e me asur es : The second step consists of calculating the distance for each pair of time series in the data set and construct a distance matrix D , where d ij is the distance b et ween series X i and X J . A go o d c hoice of distance measure has strong influence on the netw ork construction and clustering result. 3. Network c onstruction : This steps intends to transform the matrix D into a net work. In general, the t wo most used metho ds for net work construction from a dataset are the k -NN and ε -NN. The w ay how the netw ork is constructed highly affects the clustering result. 4. Community dete ction : After the net w ork is constructed, w e apply communit y detection al- gorithms in order to search for groups of densely connected vertices to form communities. There are plen ty of comm unity detection algorithms that use different strategies and the correct c ho osing again affects the clustering result. All these steps are presen ted in Algorithm 1 . The time complexity is defined as the sum of the complexities of each step of the metho d and it dep ends on the chosen algorithms and measures. Considering a dataset comp osed by n time series all of length t , the z-score normalization of the dataset can be performed in O( nt ). Also considering that a time series measure can be calculated in a linear time (T able 1 ), the netw ork construction 8 Algorithm 1: Time series clustering input : dataset, k or ε 1 b egin 2 normalization( dataset ) ; 3 D ← distanceMatrix( dataset ) ; 4 G ← netConstruction( D , k or ε ) ; 5 C ← communityDetection( G ) ; 6 end needs O( n 2 t ) computations. The time complexities for the communit y detection algorithms (T able 2 ) are usually low er than quadratic and even can b e linear [ 31 ]; therefore, the complexit y order of the prop osed metho d is O( n 2 t ). Notice that the most time-consuming pro cess is calculating the distances b etw een all pais of data p oin ts, which is O( n 2 t ). Therefore, any improv ement of the nearest neighbor metho ds can b e implemen ted in our metho d to reduce the computation time. F or example, in Ref. [ 7 ], the authors prop oses a divide and conquer metho d based on Lanczos Bisection for constructing a k NN graph with complexity bounded by O( nt ). Using this improv ement, the complexity order of the prop osed time series clustering algorithm is reduced to O( nt ). 4. Exp erimen tal ev aluation In this section, we presen t exp erimen tal results using the prop osed metho ds. In order to make repro ducibilit y easier, w e provide a w eb page containing the source co de of our algorithm [ 13 ]. The exp eriments in tend to find out the influence of the distance functions, net work construction metho ds and comm unit y detection algorithms on time series data clustering. Finally , we compare our metho d to riv al ones. 4.1. Exp eriment settings F or the exp eriments p erformed in this paper, we use 45 time series data sets from the UCR rep ository [ 23 ]. These data sets are describ ed in App endix A . The exp eriments has ob jective to c heck the performance of eac h combination of time series distance measures (T ab. 1 ), net works construction metho ds ( ε -NN or k -NN) and communit y detection algorithms (T ab. 2 ) to each data sets. T o compare the results, w e use the Rand Index (RI) [ 21 ] that measures the p ercen tage of correct decisions made b y the algorithms. The RI is defined as: RI = T P + T N n ( n − 1) / 2 , (2) where T P (true p ositive) is the num b ers of pairs of time series that are correctly put in the same cluster, T N (true negativ e) is the n um b er of pairs that are correctly put in differen t clusters and n is size of the data set. The RI for eac h clustering metho d is calculated comparing its result to the correct clustering (lab els) pro vided by the UCR. W e will v ary the parameters to find out the best clustering result, characterized b y the RI index, for each data set. In the metho ds using k -NN, the b est RI is achiev ed by v arying parameter k from 1 to n − 1. In the metho ds using ε -NN, the b est RI is achiev ed by v arying ε from min ( D ) 9 to max ( D ) in 100 steps of ( max ( D ) − min ( D )) / 100, where D is the distance matrix. F or a fair comparison, the same pro cedure is considered in the riv al metho ds. The results are presented using b o x plots that use rectangles to represent the middle half of the data divided by the median, represented b y a black horizon tal line. The vertical lines represent the max and min v alues. Black dots inside the b oxes represen t the mean v alues. Black dots outside the b oxes represent the outlier v alues. F or comparison purp ose, we use non-parametric h yp othesis tests according to [ 11 ] and provide the p -v alues for the reader interpretation. In all the cases, we consider a significance lev el of .05, i.e., p -v alues ≤ . 05 indicates a strong evidence that one metho d statistically b etter (or w orse) than another. On the other hand, p -v alues close to 1 indicates that the algorithms under comparison are statistically equiv alent. T able 1: Time series distance functions used in the exp eriments Distance Cost Ref. Manhattan ( L 1 ) O( t ) [ 38 ] Euclidean (ED) O( t ) [ 38 ] Infinite Norm ( L ∞ ) O( t ) [ 38 ] Dynamic Time W arp (DTW) O( t 2 ) [ 2 ] Short Time Series (STS) O( t ) [ 26 ] DISSIM O( t 2 ) [ 15 ] Complexit y-Inv ariant (CID) O( t ) [ 1 ] W a velet T ransform (DWT) O( t ) [ 40 ] P earson Correlation (COR) O( t ) [ 19 ] In tegrated Periodogram (INTPER) O( t ) [ 10 ] t is the length of the series; T able 2: Communit y detection algorithms used in the exp erimen ts Algorithm Cost Ref. F ast Greedy (F G) O( n. log 2 n ) [ 8 ] Multilev el (ML) O( m ) [ 3 ] W alktrap (WT) a O( n 2 . log n ) [ 28 ] Infomap (IM) b O( m ) [ 30 ] Lab el Propagation (LP) O( m + n ) [ 29 ] a W alk length = 4; b Num. of trials to partition the netw ork nb.tr ials = 10. 4.2. Network c onstruction influenc e The first experiment consists of ev aluating the influence of the net work construction on the comm unity detection process. W e v erify how the parameters k and ε from the k -NN and ε - NN methods influence the netw ork construction in order to provide a go o d strategy for correctly c ho osing these parameter and therefore get go o d clustering results. W e start by running our metho d for all com binations of data sets, time series distance measures and comm unity detection algorithms for v arious v alues of k and ε . The results are shown in Figure 3 . 10 (a) (b) Figure 3: Influence of the parameters (a) k and (b) ε on the resulting n umber of communities. W eak (gray) lines represen t the normalized real v ariation of the parameter for each combination of data sets, time series measures and communit y detection algorithms. The strongest line (blue) is a interpolation of all results, sho wing the av erage b eha vior. The k -NN construction metho d just allows discrete v alues of k while the ε -NN metho d accepts contin uous v alues. This difference explains why the k -NN interpolation presents the sharp est decrease. In small datasets, k can assume just a few v alues and it makes that small v ariations of k can result in a densely connected netw ork. When k and ε are small, vertices tend to mak e just few connections, which, in turn, generate man y netw ork comp onents (a comp onent is a connected subgraphs). As a result, communit y detection algorithms will pro duce a high num b er of clusters. On the other hand, if k and ε are high enough, all pairs of v ertices tend to be connected, leading to a fully-connected net w ork. In this case, all vertices are considered in one big communit y . Examples of these b ehaviors are depicted in Fig. 4 . So the b est clustering are usually achiev ed when intermediate v alues of k and ε are c hosen. (a) (b) (c) Figure 4: Example of the influence of the netw ork construction method on the clustering result for the coffee data set (28 time series divided in 2 classes). In this case, we constructed three k -NN net works with the INTPER measure. V ertices colors represent the communities found with the fast greedy algorithm. (a) k = 1 results in a disconnected netw ork where every comp onent is a communit y (RI=0.64). (b) k = 7 creates a connected netw ork with 2 communities that correctly clustered all the time series (RI=1). (c) k = 27 creates a fully connected netw ork where the whole netw ork form just one big communit y (RI=0.48). W e also w ould like to chec k which metho d is b etter b et ween k -NN and ε -NN. In the follo wing exp erimen t, w e compare the b est rand results achiev ed with b oth metho ds for each com bination of datasets, distance measures and communit y detection algorithms. T ab. 3 shows some statistics 11 of the clustering results using the t wo differen t metho ds. Using the Wilco xon signed-rank test (one-tailed) [ 11 ], we conclude that, at a significance level of .05, the ε -NN metho d presents larger rand indexes ( p -v alue ≤ . 0001), indicating that it is a b etter metho d. T able 3: Performance of the tw o netw ork con- struction metho ds. Net work Rand Index Metho d Median Mean Std ε -NN 0.8436 0.8133 0.1284 k -NN 0.8256 0.8012 0.1335 4.3. Time series distanc e function influenc e Another factor, which ma y influence the p erformance of our metho d, is the time series distance function. Thus, w e conduct studies to v erify whic h one is the b est for the clustering tec hnique presen ted in this pap er. F or this purpose, we group the results by distance measures and plotted a b o xplot. The results are shown in Figure 5 . Figure 5: Box plot with the best rand distribution divided by measures and net w orks construction method. Measures with different letters (A, B, C or D) mean that they presented significant difference using the Nemenyi test and a significance level of .05. According to the F riedman test, for b oth netw ork construction metho ds, clustering results using differen t distance measures are significantly differen t ( p -v alue ≤ . 0001). Hence, w e pro ceed to the 12 Nemen yi test to search for groups of similar measures. The real p -v alues are av ailable in [ 13 ]. According to the results, DTW measure presents the b est results for b oth netw ork construction metho ds. How ever, we cannot statistically affirm that it is a b etter measure. According to the Nemen yi test, we can affirm that, at a significance lev el of .05, L ∞ , STS and INTPER present w orse results than other distance measures for b oth metho ds of netw ork construction. 4.4. Community dete ction algorithm influenc e The third influence factor to our method is related to the communit y detection algorithm. Cho osing a righ t algorithm can lead to b etter clustering results. So, we here verify whic h communit y detection algorithm is b etter for time series data clustering. F or each combination of datasets and distance measures, we calculate the b est rand index for eac h algorithm and plot a b ox plot, sho wn in Figure 6 . The results are divided in to t w o parts regarding the tw o net work construction methods ( k and ε ) and, apparen tly , seems to b e similar for b oth metho ds. Figure 6: Box plot with the b est rand distribution divided by communit y detection algorithms and netw orks con- struction metho d. Algorithms with different letters (A, B or C) mean that they presented significan t difference using the Nemenyi test and a significance level of .05. T o c heck whether the algorithms really ha v e similar p erformance, w e use the F riedman test [ 11 ] to compare the 5 algorithms and chec k whether there is a significant difference in the results. W e conclude that, at a significance level of .05, for b oth netw ork construction metho ds, the algorithms do not present similar results ( p -v alue ≤ . 0001). Thus, the next step of our analysis consists of making a p ost-ho c analysis to chec k the difference b et ween the algorithms. In this case, w e use the Nemen yi test [ 11 ] to compare pairs of algorithms. The real p -v alues are av ailable in [ 13 ]. F or the k -NN metho d, w e find that the W alktrap algorithm is, at a significance level of .05, better than the others. F or the ε -NN metho d, the results show that the F ast Greedy and m ultilevel algorithms presen t statistically similar results and these are b etter than the Infomap, lab el propagation and W alktrap algorithm. 13 4.5. Comp arison to rival Metho ds No w we present a comparison of our approach to other time series clustering metho ds. F or this comparison, w e c hose the combination of net work construction metho d, the distance function and the communit y detection algorithm , whic h leads to the b est exp erimental results so far. The first step consists of ev aluating which algorithm achiev es the b est median v alue. W e opt to compare the median instead of av erage because it is less sensitive to outliers [ 11 ]. The result is presen ted in T ab. 4 . T able 4: P erformance of differen t combinations of netw orks construction metho ds, distance functions and communit y detection algorithms. Net work Dist Comm unity Rand Index Metho d F unc. Detect. Alg. Median Mean Std ε -NN DTW multilev el 0.8671 0.8309 0.1309 k -NN DTW fastgreedy 0.8644 0.8207 0.1381 k -NN DTW walktrap 0.8644 0.8283 0.1297 k -NN DTW infomap 0.8642 0.8191 0.1431 ε -NN DTW infomap 0.8642 0.8225 0.1360 ε -NN DTW walktrap 0.8642 0.8281 0.1283 . . . . . . . . . . . . . . . . . . k -NN L ∞ lab el prop. 0.8163 0.7831 0.1408 k -NN ED fastgreedy 0.8127 0.7958 0.1310 k -NN STS infomap 0.8073 0.7812 0.1415 k -NN STS fastgreedy 0.8016 0.7822 0.1294 k -NN STS m ultilevel 0.8016 0.7802 0.1307 k -NN STS lab el prop. 0.7980 0.7751 0.1388 Results were sorted by the median v alues According to T ab. 4 , the b est results for the comm unit y detection approach is ac hieved by using the m ultilevel algorithm with the ε -NN construction metho d and the DTW distance function. This result confirms to all the studies of influences previously presen ted in this pap er. F or comparison purp ose, w e firstly consider some classic clustering algorithms: k -medoids, complete-link age, single-link age, a verage-link age, median-link age, centroid-link age and diana [ 16 ]. F or a fair comparison, w e firstly find out whic h distance function leads to the b etter results for eac h riv al method. Once again, w e use the median to rank the results, that are presen ted in T ab. 5 . Besides of those classic clustering algorithms, we also consider three up-to-date ones: Zhang’s metho d [ 41 ], Mahara j’s metho d [ 24 ] and PDC [ 5 ] (briefly describ ed in Sec. 2.2 ). F or Zhang’s metho d, we v ary the num b er of clustering candidates from 1 to the size of eac h dataset and rep ort the b est RI. In Mahara j’s metho d, we search for the b est RI v arying the significance level α from 0 to 1 in steps of 0.5. F or PDC, w e use the complete link age clustering algorithm and rep ort the b est RI from the hierarch y . T ables 6 and 7 sho w the b est rand index for each algorithm and the corresp onding data set. Figure 7 summarizes this information in a b ox plot. W e use the Wilco xon paired test to compare our metho d to all other ones. T o comp ensate the m ultiple pairwise comparison, w e use the Holm-Bonferroni adjusting method [ 11 ]. At a significance lev el of .05, w e conclude that the comm unity detection approach presents b etter results ( p -v alues 14 T able 5: Best time series measures for each of the riv al metho ds Clustering Dist Rand index Algorithm F unc. Median Mean Std Diana DTW 0.8596 0.8167 0.1369 Cen troid Link age DTW 0.8593 0.8075 0.1306 Single Link age DTW 0.8593 0.8164 0.1320 Median Link age DTW 0.8591 0.8075 0.1294 Av erage Link age CID 0.8575 0.8138 0.1375 k -medoids (P AM) COR 0.8534 0.8113 0.1310 Complete Link age DTW 0.8501 0.8214 0.1249 0.5 0.6 0.7 0.8 0.9 1.0 m u l t i l e v e l ε − N N (DTW) K−medoids (COR) diana (DTW) complete link. (DTW) single link. (DTW) av erage link. (CID) median link. (DTW) centroid link. (DTW) zhang maharaj pdc rand inde x Figure 7: Box plot with the comparison of different time series clustering algorithms. ≤ . 02) than k -medoids (P AM), diana, median-link age, centroid-link age, Zhang’s metho d [ 41 ], Ma- hara j’s method [ 24 ] and PDC [ 5 ]. Even though our approac h has presented higher median and mean v alues, w e cannot conclude that it is statistically b etter than complete-link age, single-link age and a verage-link age ( p -v alues ≤ . 32) yet. 4.6. Dete cting time series clusters with time-shifts Clustering algorithms should b e capable of detecting groups of time series that hav e similar v ariations in time. T o exemplify the efficiency of our method in detecting similarity with time shifts, w e consider the Cylinder-Bell-F unnel (CBF) data set, that is formed b y 30 time series of length 128 divided into 3 groups [ 17 ]. Each group is defined by a sp ecific pattern. The cylinder group of series is characterized b y a plateau, the b ell group by an increasing linear ramp follo w ed by a sharp decrease and the funnel group b y a sharp increase follow ed by a decreasing ramp. Ev en comp osed b y a small n umber of time series, this data set presen ts characteristics that mak e difficult the detection of similarit y . In this data set, the starting time, the duration and the amplitude patterns among the time series of the same group are different. A random Gaussian noise is also added to the series to repro duce the natural b eha vior. Figure 8 shows the CBF data set. 15 T able 6: Best rand index for each clustering algorithm I Multilevel k -Medoids Diana Complete Single Av erage ε -NN (COR) (DTW) Link age Link age Link age (DTW) (DTW) (DTW) (CID) adiac 0.97 0.97 0.97 0.97 0.97 0.97 beef 0.83 0.83 0.83 0.83 0.83 0.83 car 0.78 0.77 0.77 0.77 0.76 0.77 cbf 0.96 0.73 0.88 0.92 0.82 0.85 chlorine concentration 0.59 0.59 0.59 0.59 0.59 0.59 cinc ecg torso 0.75 0.83 0.76 0.76 0.75 0.82 coffee 0.60 0.86 0.58 0.58 0.62 0.58 crick et x 0.92 0.92 0.92 0.92 0.92 0.92 crick et y 0.92 0.92 0.92 0.92 0.92 0.92 crick et z 0.92 0.92 0.92 0.92 0.92 0.92 diatom size reduction 0.97 0.96 0.93 0.85 0.93 1.00 ecg five days 0.63 0.55 0.63 0.68 0.60 0.55 ecg 0.61 0.66 0.57 0.68 0.57 0.70 face all 0.96 0.94 0.95 0.95 0.94 0.94 face four 0.90 0.78 0.83 0.91 0.79 0.79 faces ucr 0.94 0.92 0.94 0.95 0.92 0.92 fish 0.87 0.87 0.87 0.87 0.87 0.88 gun 0.60 0.60 0.57 0.59 0.60 0.63 haptics 0.80 0.80 0.80 0.80 0.80 0.80 inlinesk ate 0.86 0.86 0.86 0.86 0.86 0.86 italy p o wer demand 0.71 0.88 0.69 0.70 0.68 0.71 lighting2 0.64 0.55 0.57 0.70 0.61 0.55 lighting7 0.85 0.85 0.85 0.85 0.85 0.86 mallat 0.94 0.95 0.97 0.97 0.91 0.94 medical images 0.69 0.69 0.69 0.69 0.69 0.69 mote strain 0.78 0.66 0.65 0.64 0.61 0.58 oliveoil 0.88 0.91 0.86 0.82 0.87 0.90 osuleaf 0.83 0.82 0.83 0.83 0.82 0.83 plane 1.00 0.97 0.99 0.99 0.97 0.98 sony AIBO Rob ot surface ii 0.83 0.74 0.77 0.74 0.82 0.74 sony AIBO Rob ot surface 0.85 0.69 0.86 0.73 0.92 0.94 starlightcurv es 0.83 0.82 0.83 0.83 0.83 0.83 swedishleaf 0.94 0.94 0.94 0.94 0.94 0.94 symbols 0.97 0.95 0.97 0.97 0.97 0.96 synthetic control 0.95 0.89 0.94 0.92 0.87 0.89 trace 0.87 0.76 0.86 0.86 0.91 0.86 tw o lead ecg 0.61 0.56 0.59 0.68 0.62 0.57 tw o patterns 1.00 0.75 0.94 0.94 0.98 0.75 uw av egesturelibrary x 0.89 0.88 0.88 0.88 0.89 0.89 uw av egesturelibrary y 0.88 0.88 0.88 0.88 0.88 0.88 uw av egesturelibrary z 0.88 0.88 0.88 0.88 0.89 0.89 wafer 0.82 0.82 0.82 0.82 0.82 0.82 word synonyms 0.91 0.91 0.92 0.91 0.92 0.92 words50 0.96 0.96 0.96 0.96 0.96 0.96 yoga 0.51 0.51 0.51 0.51 0.52 0.51 Median 0.87 0.85 0.86 0.85 0.86 0.86 Mean 0.83 0.81 0.82 0.82 0.82 0.81 St.D. 0.13 0.13 0.14 0.12 0.13 0.14 Using our approac h, we build a ε -NN ( ε = 58 . 87) with DTW and then apply the multilev el comm unity detection algorithm. The result (Fig. 9 ) is a net w ork with 3 comm unities, eac h one represen ting an original cluster of the data set. Our approach correctly finds out all the time series clusters, except the one with label “3” in Fig. 9 . In this simulation, we get R I = 0 . 96 for our metho d. The riv al metho d (T ab. 5 ) that achiev es the best clustering result for this data set is the complete link age with DTW: RI = 0 . 91. 16 T able 7: Best rand index for each clustering algorithm I I Median Cen troid Zhang Mahara j PDC Link age Link age [ 41 ] [ 24 ] Comp. Link. (DTW) (DTW) [ 5 ] adiac 0.97 0.97 0.97 0.97 0.97 beef 0.83 0.83 0.80 0.83 0.83 car 0.77 0.78 0.76 0.76 0.76 cbf 0.74 0.74 0.92 0.68 0.69 chlorine concentration 0.59 0.59 0.59 0.59 0.59 cinc ecg torso 0.75 0.75 0.75 0.75 0.89 coffee 0.59 0.61 0.58 0.52 0.52 crick et x 0.92 0.92 0.92 0.92 0.92 crick et y 0.92 0.92 0.92 0.92 0.92 crick et z 0.92 0.92 0.92 0.92 0.92 diatom size reduction 0.87 0.87 0.95 0.74 0.76 ecg five days 0.64 0.63 0.60 0.59 0.57 ecg 0.57 0.60 0.56 0.68 0.57 face all 0.93 0.93 0.95 0.93 0.93 face four 0.79 0.78 0.82 0.75 0.76 faces ucr 0.93 0.93 0.94 0.91 0.91 fish 0.87 0.87 0.87 0.86 0.86 gun 0.62 0.58 0.59 0.51 0.54 haptics 0.80 0.80 0.79 0.80 0.80 inlinesk ate 0.86 0.86 0.85 0.86 0.86 italy p o wer demand 0.64 0.62 0.70 0.53 0.52 lighting2 0.65 0.62 0.62 0.55 0.55 lighting7 0.85 0.85 0.86 0.84 0.84 mallat 0.92 0.91 0.94 0.87 0.89 medical images 0.69 0.69 0.69 0.69 0.68 mote strain 0.63 0.63 0.62 0.53 0.66 oliveoil 0.87 0.88 0.83 0.73 0.72 osuleaf 0.82 0.83 0.82 0.82 0.82 plane 0.95 0.95 1.00 0.86 0.86 sony AIBO Rob ot surface ii 0.73 0.73 0.79 0.71 0.51 sony AIBO Rob ot surface 0.92 0.92 0.73 0.72 0.86 starlightcurv es 0.81 0.83 0.81 0.57 0.62 swedishleaf 0.94 0.94 0.94 0.93 0.94 symbols 0.97 0.97 0.99 0.83 0.94 synthetic control 0.86 0.86 0.94 0.84 0.84 trace 0.86 0.87 0.87 0.84 0.75 tw o lead ecg 0.58 0.58 0.58 0.52 0.55 tw o patterns 0.90 0.92 0.98 0.75 0.75 uw av egesturelibrary x 0.88 0.89 0.89 0.88 0.88 uw av egesturelibrary y 0.88 0.88 0.88 0.88 0.88 uw av egesturelibrary z 0.88 0.88 0.88 0.88 0.88 wafer 0.83 0.82 0.82 0.82 1.00 word synonyms 0.92 0.92 0.91 0.91 0.91 words50 0.96 0.97 0.96 0.96 0.96 yoga 0.51 0.51 0.51 0.50 0.52 Median 0.86 0.86 0.85 0.82 0.83 Mean 0.81 0.81 0.81 0.77 0.77 St.D. 0.13 0.13 0.14 0.14 0.15 4.7. Efficiency to dete ct shap e p atterns In some cases, the similarit y of time series is defined by rep eating patterns that should be efficien tly detected b y clustering algorithms. W e exemplify the efficiency of our metho d to detect differen t shap e patterns in time series considering the tw o patterns data set [ 17 ]. It is comp osed b y 1000 time series of length 128 divided in to four groups. These groups are characterized b y the o ccurrence of tw o different patterns in a defined order: an up ward step (whic h goes from -5 to 17 (a) (b) (c) Figure 8: The Cylinder-Bell-F unnel (CBF) data set is comp osed by three groups of series: (a) the cylinder group of series is c haracterized by a plateau, (b) the b ell group by an increasing linear ramp follow ed by a sharp decrease and (c) the funnel group by a sharp increase follow ed by a decreasing ramp. Figure 9: Netw ork representation of the CBF data set using the ε -NN construction metho d ( ε = 58 . 87) with DTW. V ertices colors indicate the 3 communities that represent each group of time series illustrated in Fig. 8 . All the 30 time series were correctly clustered, except one ( R I = 0 . 96). The time series with lab el “3” belongs to comm unity of color blue (b ottom). 18 (a) (b) (c) (d) Figure 10: The tw o patterns data set is comp osed b y the sequence of tw o patterns: an upw ard (U) step, which go es from − 5 to 5, and a down ward (D) step, which go es from 5 to − 5. The order which these patterns o ccur define each group: (a) UU, (b) UD, (c) DU and (d) DD. 5) and a do wn ward step (which go es from 5 to -5). Using these tw o patterns, it is p ossible to define 4 groups: UU, UD, DU and DD. The group UU is defined by t w o upw ard steps, UD is defined b y an up w ard step follo w ed by a do wnw ard step, and the same logic defines DD and DU groups. According to these definition, clustering algorithms should b e capable of detecting the order of patterns to correctly distinguish UD and DU. T o make the problem harder, the p osition and duration of the patterns are randomized in such a wa y that there is no ov erlap. Around patterns, the series is characterized by an indep enden t Gaussian noise. Figure 10 illustrates the 4 groups of the data set. Figure 11: Netw ork representation of the tw o patterns data set using the ε -NN construction metho d ( ε = 44 . 91) with DTW. V ertices colors indicate the 4 communities that represent each group of time series illustrated in Fig. 10 . All the 1000 time series were correctly clustered ( RI = 1). 19 Using the ε -NN construction method ( ε = 44 . 91) with DTW, it is p ossible to construct a net work as sho wn in Fig. 11 , whic h represen ts the t wo patterns data set. After applying the m ultilevel communit y detection algorithm to this net work, w e get 4 communities, representing eac h group of time series. All the 1000 time series are correctly clustered ( R I = 1). The riv al metho d (T ab. 5 ) that achiev es the b est clustering result for this data set is the single link age with DTW: RI = 0 . 97. 5. Conclusion In this pap er w e presen t benefits of using comm unit y detection algorithms to p erform time series clustering. According to the e xp erimen tal results, we conclude that the b est results are ac hieved using the ε -NN construction metho d with the DTW distance function and the multilev el comm unity detection algorithm among the combinations under study . W e hav e observed that in termediate v alues of k and ε lead to b etter clustering results (Sec. 4.2 ). F or a fair comparison, w e ha v e also verified whic h distance function works better with eac h of the riv al algorithms (T ab. 5 ). W e compare those algorithms to our metho d using different data sets and we confirm that our metho d outp erformed in most of the tested datasets. W e ha v e observ ed that our metho d has ability to detect groups of series even presen ting time shifts and amplitude v ariations. All the facts indicate that using communit y detection algorithms for time series data clustering is an in teresting approach. Another adv antage of the prop osed approach is that it can b e easily fit to sp ecific clustering problems b y c hanging the net w ork construction metho d, the distance function or the communit y detection algorithm. Another adv antage is that general impro vemen ts on these subroutines are applicable to our metho d. The prop osed metho d has b een developed considering only on univ ariate time series. How ever, the same idea can b e extended to m ultiv ariate time series clustering at least in the following wa ys: 1) c hanging the time series distance function. In this case, we just need to use a new distance function designed for multiv ariate time series. The netw ork construction metho d and the clustering metho d remain the same. 2) Changing the clustering metho d. In this case, a new clustering metho d has to b e developed to deal with every series v ariables. One p ossible w a y is to apply our metho d to eac h v ariable and then use some criteria to merge the clustering results. As a future work, we plan to address this problem. In this pap er, we hav e made statistical comparisons of clustering accuracy based on the rand index. Although it is a go o d measure and presents goo d results, it would b e interesting to ev aluate the sim ulation results using different indexes. Another p oin t is that w e ha ve compared the b est rand indexes searc hing from a v ariation of k and ε . In many real datasets, it would b e infeasible to do such a searching due to the time consuming. As future w orks, we plan to prop ose automatic strategies for c ho osing the best num b er of neighbors ( k and ε ) and sp eeding up the net w ork construction method, instead of using the naive metho d. W e also plan to apply the idea to solve other kinds of problems in time series analysis, suc h as time series prediction. Ac kno wledgmen ts W e w ould lik e to thank CNPq, CAPES and F APESP for supp orting this researc h. W e thank the Univ ersity of S˜ ao Paulo for providing the computational infrastructure of the cloud computing that allo wed the exp eriments. W e would lik e to thank Prof. Eamonn Keogh for pro viding the 20 datasets [ 23 ]. W e also wan t to thank the developers from igraph [ 9 ], TSdist [ 27 ] and TSclust [ 25 ] R libraries for making easier the dev elopment of this pap er. References [1] G. E. A. P . A. Batista, E. J. Keogh, O. M. T ataw, V. M. A. de Souza, Cid: an efficient complexity-in v ariant distance for time series, Data Mining and Knowledge Discov ery 28 (3) (2014) 634–669. [2] D. J. Berndt, J. Clifford, Using Dynamic Time W arping to Find Patterns in Time Series, in: KDD W orkshop, 1994, pp. 359–370. [3] V. D. Blondel, J.-L. Guillaume, R. Lambiotte, E. Lefeb vre, F ast unfolding of comm unities in large net works, Journal of Statistical Mechanics: Theory and Exp erimen t 2008 (10) (2008) P10008. [4] S. Boccaletti, V. Latora, Y. Moreno, M. Chav ez, D.-U. Hw ang, Complex netw orks: Structure and dynamics, Ph ysics Rep orts 424 (4–5) (2006) 175 – 308. [5] A. M. Brandmaier, Perm utation distribution clustering and structural equation mo del trees, Ph.D. thesis, Univ ersit¨ at des Saarlandes (2011). [6] J. Chapp elier, A. Grumbac h, A kohonen map for temp oral sequences, in: In Pro ceedings of the Conference on Neural Netw orks and Their Applications, 1996, pp. 104–110. [7] J. Chen, H.-r. F ang, Y. Saad, F ast appro ximate knn graph construction for high dimensional data via recursive lanczos bisection, J. Mach. Learn. Res. 10 (2009) 1989–2012. [8] A. Clauset, M. E. J. Newman, C. Mo ore, Finding communit y structure in very large netw orks, Phys. Rev. E 70 (2004) 066111. [9] G. Csardi, T. Nepusz, The igraph soft ware pack age for complex net work research, In terJournal Complex Systems (2006) 1695. [10] D. C. de Lucas, Classification techniques for time series and functional data, Ph.D. thesis, Universidad Carlos I II de Madrid (2003). [11] J. Dem ˇ sar, Statistical comparisons of classifiers ov er multiple data sets, J. Mach. Learn. Res. 7 (2006) 1–30. [12] P . Esling, C. Agon, Time-series data mining, ACM Computing Surveys 45 (1) (2012) 1–34. [13] L. N. F erreira, L. Zhao, Co de and extra information for the paper: Time series clustering via communit y detection in netw orks, http://lnferreira.gith ub.io/time series clustering via communit y detection, accessed F ev- 2015 (F ev 2015). [14] S. F ortunato, Communit y detection in graphs, Physics Rep orts 486 (3–5) (2010) 75–174. [15] E. F rentzos, K. Gratsias, Y. Theo doridis, Index-based most similar tra jectory searc h, in: Data Engineering, 2007. ICDE 2007. IEEE 23rd International Conference on, 2007, pp. 816–825. [16] G. Gan, C. Ma, J. W u, Data Clustering: Theory , Algorithms, and Applications, So ciety for Industrial and Applied Mathematics, 2007. [17] P . Geurts, Contributions to decision tree induction: Bias/v ariance tradeoff and time series classification, Ph.D. thesis, Department of Electrical Engineering, Universit y of Liege, Belgium (2002). [18] M. Girv an, M. E. J. Newman, Comm unity structure in so cial and biological netw orks, Proceedings of the National Academy of Sciences 99 (12) (2002) 7821–7826. [19] X. Gola y , S. Kollias, G. Stoll, D. Meier, A. V alav anis, P . Boesiger, A new correlation-based fuzzy logic clustering algorithm for fmri, Magnetic Resonance in Medicine 40 (2) (1998) 249–260. [20] C. Guo, H. Jia, N. Zhang, Time series clustering based on ica for sto ck data analysis, in: Wireless Commu- nications, Netw orking and Mobile Computing, 2008. WiCOM ’08. 4th International Conference on, 2008, pp. 1–4. [21] M. Halkidi, Y. Batistakis, M. V azirgiannis, On clustering v alidation techniques, J. Intell. Inf. Syst. 17 (2-3) (2001) 107–145. [22] E. Keogh, S. Lonardi, C. A. Ratanamahatana, T ow ards parameter-free data mining, in: Proceedings of the T enth ACM SIGKDD International Conference on Kno wledge Disco very and Data Mining, KDD ’04, ACM, New Y ork, NY, USA, 2004, pp. 206–215. [23] E. Keogh, Q. Zhu, B. Hu, Y. Hao., X. Xi, L. W ei, C. A. Ratanamahatana, The UCR time series dataset, http://www.cs.ucr.edu/ ~ eamonn/time_series_data/ , [Online; accessed Sep-2014] (2008). [24] E. Mahara j, Cluster of time series, Journal of Classification 17 (2) (2000) 297–314. [25] P . M. Manso, J. A. Vilar, TSclust: Time series clustering utilities, r pack age v ersion 1.2.1 (2014). [26] C. M¨ oller-Lev et, F. Klaw onn, K.-H. Cho, O. W olk enhauer, F uzzy clustering of short time-series and unevenly distributed sampling points, in: Adv ances in In telligent Data Analysis V, v ol. 2810 of Lecture Notes in Computer Science, Springer Berlin Heidelb erg, 2003, pp. 330–340. 21 [27] U. Mori, A. Mendiburu, J. Lozano, TSdist: Distance Measures for Time Series data., r pack age v ersion 1.2 (2014). [28] P . Pons, M. Latapy , Computing communities in large net w orks using random walks, in: Computer and Informa- tion Sciences - ISCIS 2005, vol. 3733 of Lecture Notes in Computer Science, Springer Berlin Heidelb erg, 2005, pp. 284–293. [29] U. N. Raghav an, R. Albert, S. Kumara, Near linear time algorithm to detect comm unity structures in large-scale net works, Phys. Rev. E 76 (2007) 036106. [30] M. Rosv all, C. T. Bergstrom, Maps of random w alks on complex netw orks reveal communit y structure, Pro- ceedings of the National Academy of Sciences 105 (4) (2008) 1118–1123. [31] T. C. Silv a, L. Zhao, Sto chastic comp etitive learning in complex netw orks, IEEE T rans. Neural Netw orks and Learning Systems 23 (2012) 385–397. [32] P . Sm yth, Clustering sequences with hidden marko v mo dels, in: Adv ances in Neural Information Processing Systems, MIT Press, 1997, pp. 648–654. [33] M. Vlachos, G. Kollios, D. Gunopulos, Discov ering similar multidimensional tra jectories, in: Data Engineering, 2002. Pro ceedings. 18th International Conference on, 2002, pp. 673–684. [34] X. W ang, A. Mueen, H. Ding, G. T ra jcevski, P . Scheuermann, E. Keogh, Exp erimental comparison of repre- sen tation metho ds and distance measures for time series data, Data Mining and Knowledge Discov ery 26 (2) (2013) 275–309. [35] T. W arren Liao, Clustering of time series data-a survey , Pattern Recogn. 38 (11) (2005) 1857–1874. [36] Y. Xiong, D.-Y. Y eung, Mixtures of arma mo dels for mo del-based time series clustering, in: Data Mining, 2002. ICDM 2003. Pro ceedings. 2002 IEEE International Conference on, 2002, pp. 717–720. [37] Y. Xiong, D.-Y. Y eung, Time series clustering with arma mixtures, Pattern Recognition 37 (8) (2004) 1675 – 1689. [38] B.-K. Yi, C. F aloutsos, F ast time sequence indexing for arbitrary lp norms, in: Pro ceedings of the 26th Inter- national Conference on V ery Large Data Bases, VLDB ’00, Morgan Kaufmann Publishers Inc., San F rancisco, CA, USA, 2000, pp. 385–394. [39] J. Zak aria, A. Mueen, E. Keogh, Clustering time series using unsup ervised-shapelets, in: Pro ceedings of the 2012 IEEE 12th In ternational Conference on Data Mining, ICDM ’12, IEEE Computer Society , W ashington, DC, USA, 2012, pp. 785–794. [40] H. Zhang, T. B. Ho, Y. Zhang, M. S. Lin, Unsupervised feature extraction for time series clustering using orthogonal wa velet transform, Informatica (Slov enia) 30 (3) (2006) 305–319. [41] X. Zhang, J. Liu, Y. Du, T. Lv, A nov el clustering metho d on time series data, Exp ert Syst. Appl. 38 (9) (2011) 11891–11900. App endix A. Data Set Description In the simulations of this pap er, w e hav e used 45 time series data sets taken from the UCR rep ository [ 23 ]. This rep ository is comp osed of real and syn thetic data sets divided in training and test sets. F or our exp eriments, w e consider only the training set and the test sets are discarded. These datasets ha ve be en generated b y v arious authors and donated to the UCR rep ository . The lab els of eac h dataset are not defined b y the UCR, but are defined by the authors themselv es according to the sp ecific dataset domain. Therefore, we ha ve to assume that the lab els are correct. T able A.8 describ es eac h data set used in this pap er. 22 T able A.8: The UCR time series data sets used in the ex- p erimen ts Data set Num. Time seri es Num. ob jects length classes Adiac 390 176 37 Beef 30 470 5 Car 60 577 4 CBF 30 128 3 ChlorineConcentration 467 166 3 CinC ECG torso 40 1639 4 Coffee 28 286 2 Crick et X 390 300 12 Crick et Y 390 300 12 Crick et Z 390 300 12 DiatomSizeReduction 16 345 4 ECG 100 96 2 ECGFiveDa ys 23 136 2 F ace (all) 560 131 14 F ace (four) 24 350 4 F acesUCR 200 131 14 Fish 175 463 7 Gun-Poin t 50 150 2 Haptics 155 1092 5 InlineSk ate 100 1882 7 ItalyPo werDemand 67 24 2 Lightning-2 60 637 2 Lightning-7 70 319 7 MALLA T 55 1024 8 MedicalImages 381 99 10 MoteStrain 20 84 2 OliveOil 30 570 4 OSU Leaf 200 427 6 Plane 105 144 7 SonyAIBORobot Surface 20 70 2 SonyAIBORobot SurfaceI I 27 65 2 StarLightCurv es 1000 1024 3 Swedish Leaf 500 128 15 Symbols 25 398 6 Synthetic Control 300 60 6 T race 100 275 4 Two Patterns 1000 128 4 TwoLeadECG 23 82 2 uW av eGestureLibrary X 896 315 8 uW av eGestureLibrary Y 896 315 8 uW av eGestureLibrary Z 896 315 8 W afer 1000 152 2 W ordsSynonyms 267 270 25 W ords 50 450 270 50 Y oga 300 426 2 23
Original Paper
Loading high-quality paper...
Comments & Academic Discussion
Loading comments...
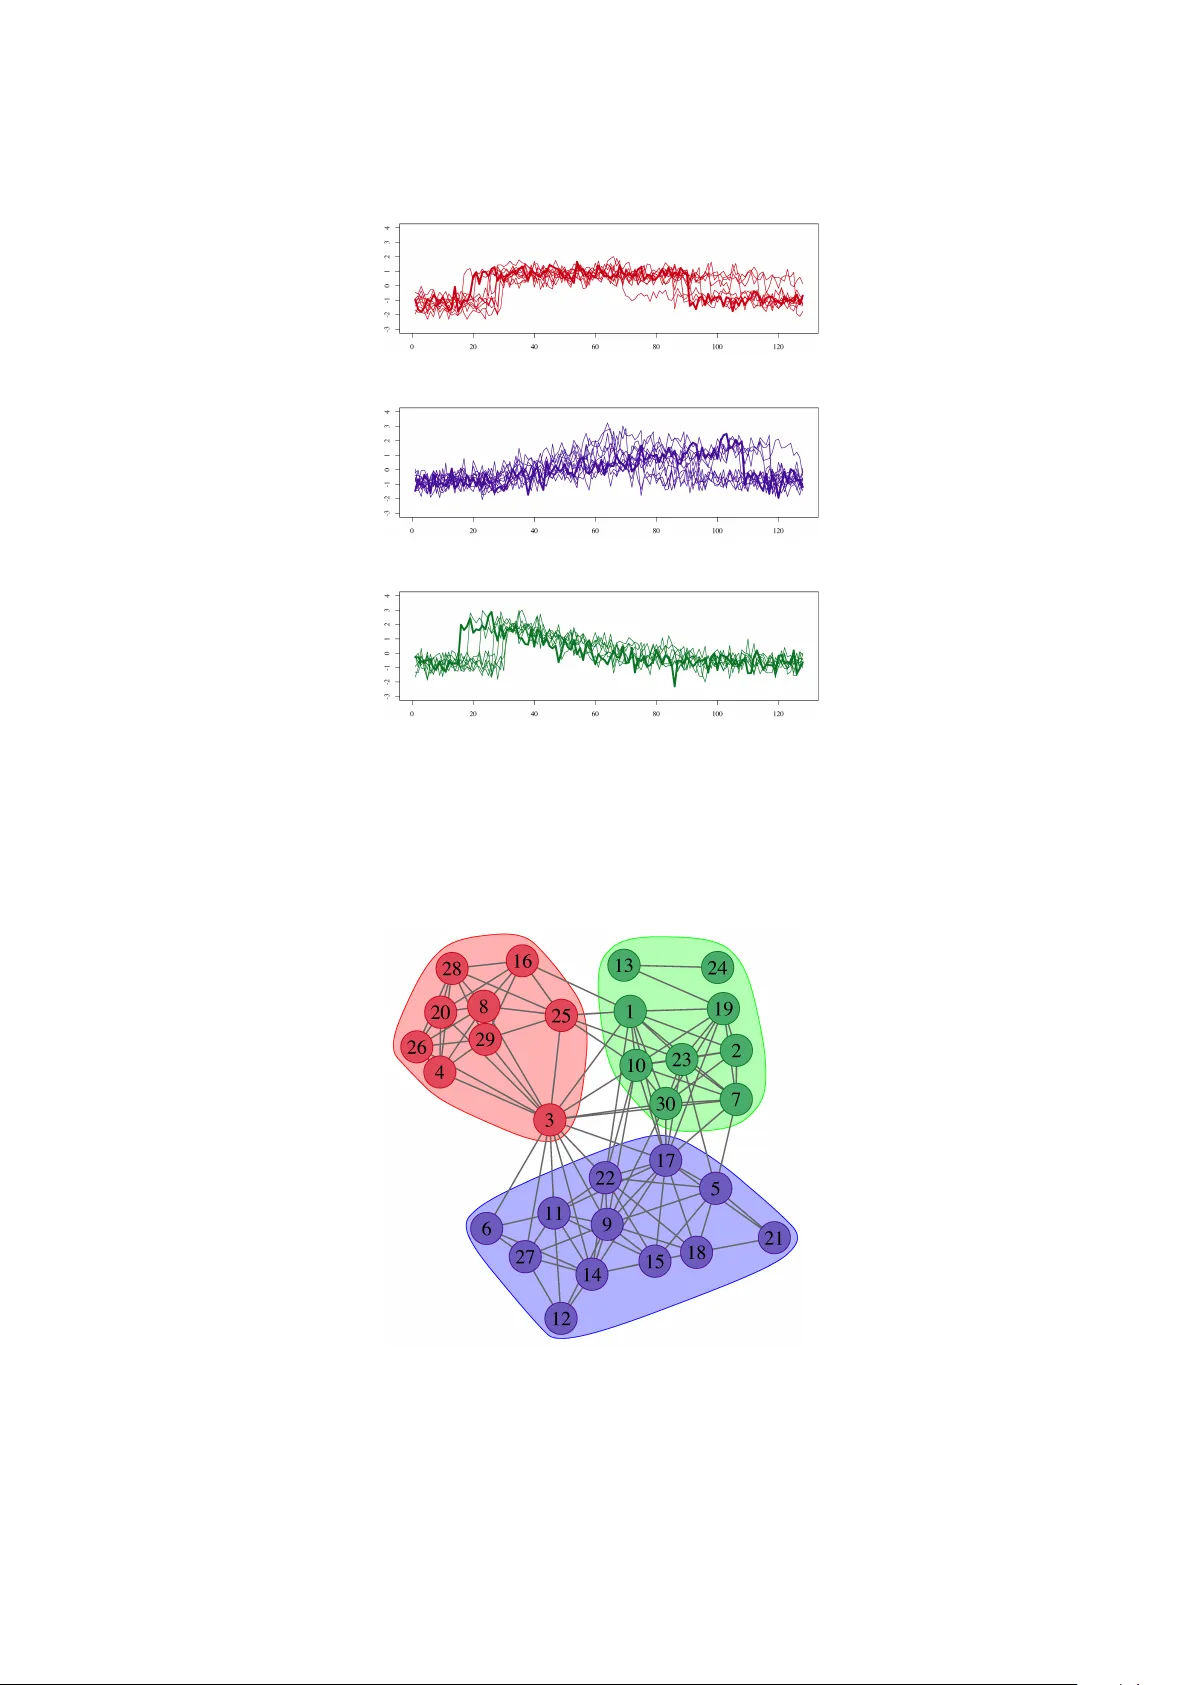
Leave a Comment