A New Intelligence Based Approach for Computer-Aided Diagnosis of Dengue Fever
Identification of the influential clinical symptoms and laboratory features that help in the diagnosis of dengue fever in early phase of the illness would aid in designing effective public health management and virological surveillance strategies. Ke…
Authors: Vadrevu Sree Hari Rao, Mallenahalli Naresh Kumar
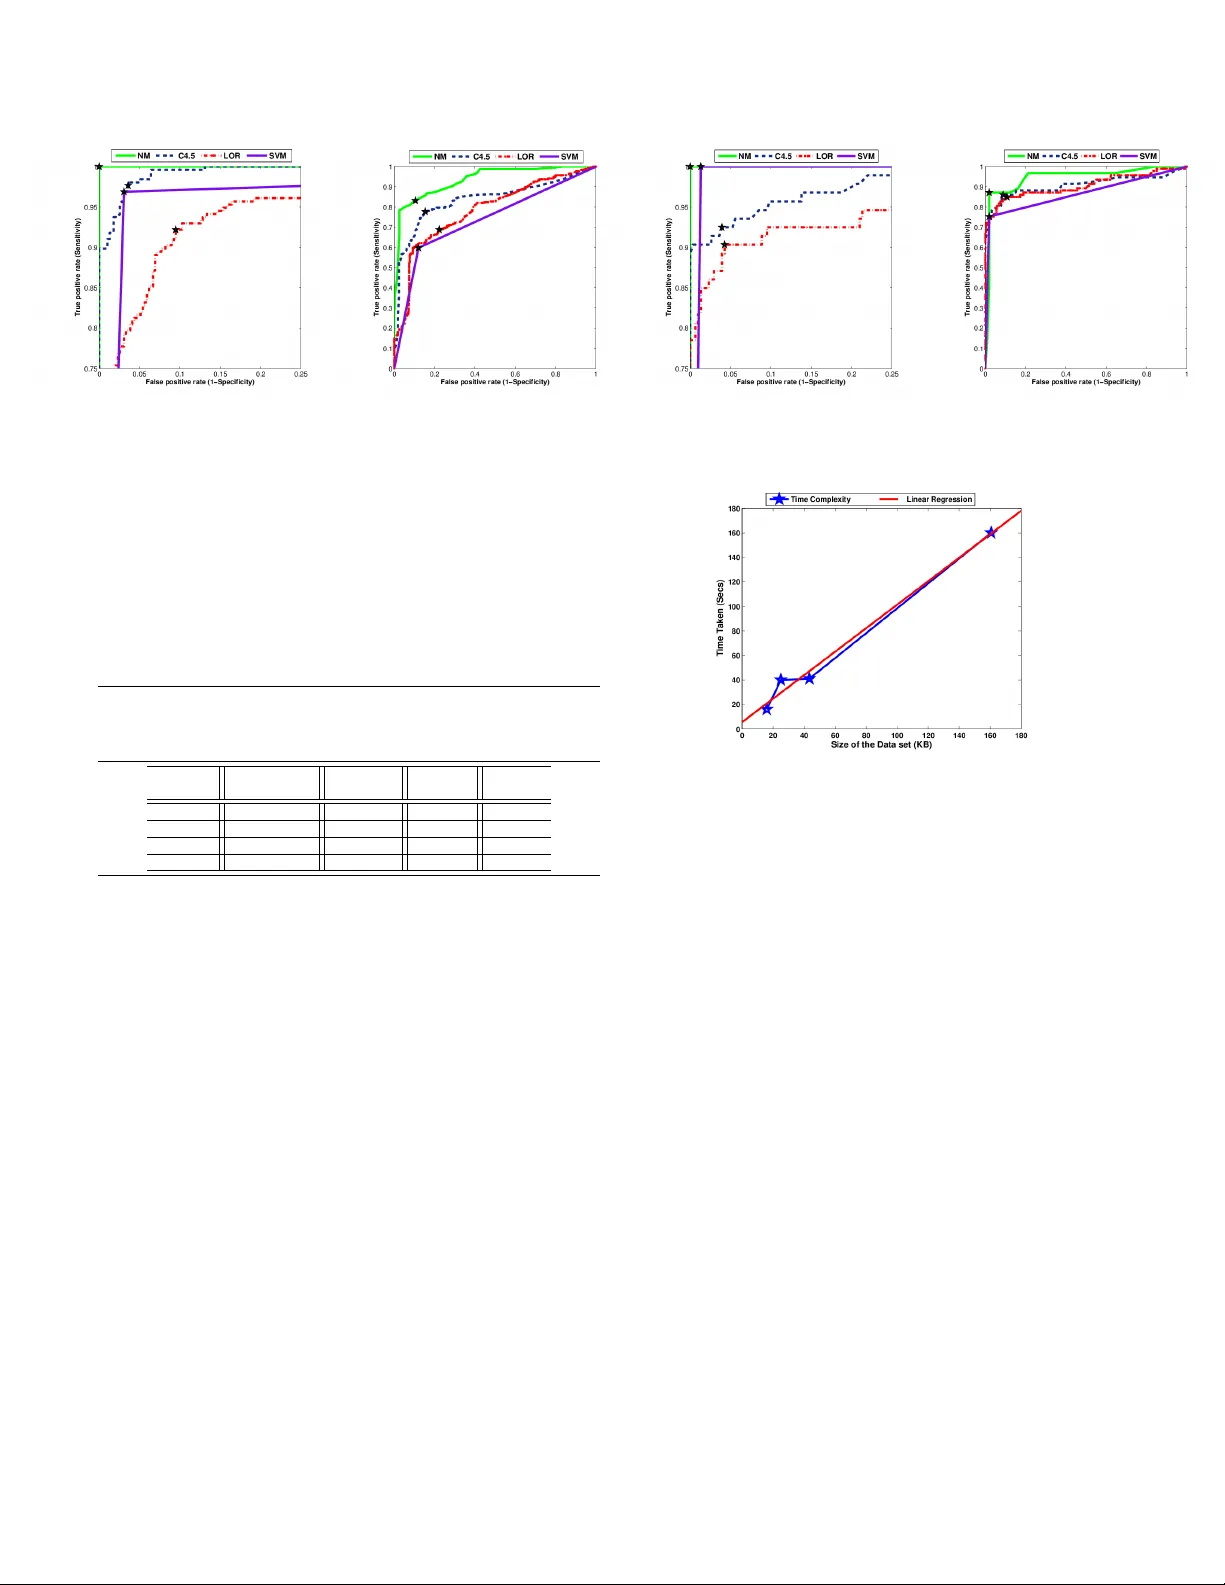
c 20XX IEEE. PERSONAL USE OF THIS MA TERIAL IS PERMITTED. PUBLISHED IN IEEE. DOI: 10.1109/TITB.2011.2171978 1 A Ne w Intelligence Based Approach for Computer -Aided Diagnosis of Dengue Fe ver V adre vu Sree Hari Rao, Senior Member , IEEE, and Mallenahalli Naresh Kumar Abstract —Identification of the influential clinical symptoms and laboratory features that help in the diagnosis of dengue fever in early phase of the illness would aid in designing effective public health management and vir ological surveillance strategies. Keeping this as our main objectiv e we de velop in this paper , a new computational intelligence based methodology that predicts the diagnosis in real time, minimizing the number of false positi ves and false negatives. Our methodology consists of thr ee major components (i) a novel missing value imputation procedure that can be applied on any data set consisting of categorical (nominal) and/or numeric (real or integer) (ii) a wrapper based features selection method with genetic search for extracting a subset of most influential symptoms that can diagnose the illness and (iii) an alternating decision tree method that employs boosting f or generating highly accurate decision rules. The predictive models developed using our methodology are f ound to be more accurate than the state-of-the-art methodologies used in the diagnosis of the dengue fever . Index T erms —dengue fever , classification, clinical diagnosis, prediction, imputation, features selection, genetic search, alter- nating decision trees I . I N T RO D U C T I O N D ENGUE fev er (DF) is a mosquito-borne infectious dis- ease caused by the viruses of the genus T ogaviridae , subgenus Flavirus . The transmission of this disease is through the bites of vectors (aedes aegypti, aedes albopictus) carrying the viruses belonging to Flavi genus [1]. From its first appear- ance in the Philippines in 1953 , the disease has been identified as one of the most important arthropod-borne viral disease in humans [2]. Dengue virus infection has been reported in more than 100 countries, with 2 . 5 billion people living in areas where dengue is endemic. The annual occurrence is estimated to be around 100 million cases of DF and 250 , 000 cases of dengue hemorrhagic fev er (DHF). The diagnosis of dengue fever presents great challenges as the symptoms ov erlap with other febrile illnesses. Accurate diagnosis is possible only after conducting definitive tests such Manuscript receiv ed May 13, 2011: revised August 24, 2011 and September 30, 2011; accepted October 7, 2011. V adrevu Sree Hari Rao is with the Department of Mathematics, Jawahar - lal Nehru T echnological University , Hyderabad, Andhra Pradesh, 500 085, India. Also, he is an advisor for International Centre for Interdisciplinary Research and Innovation, VNR VJIET Campus, Hyderabad, India. e-mail: vshrao@jntuh.ac.in Mallenahalli Naresh Kumar is with the Software and Database Systems Group, National Remote Sensing Center (ISR O), Hyderabad, Andhra Pradesh, 500 625, India. e-mail: nareshkumar m@nrsc.gov .in c 20xx IEEE. Personal use of this material is permitted. Permission from IEEE must be obtained for all other uses, in any current or future media, including reprinting/republishing this material for advertising or promotional purposes, creating ne w collectiv e works, for resale or redistribution to servers or lists, or reuse of any copyrighted component of this work in other works. DOI: 10.1109/TITB.2011.2171978 as enzyme-linked immunosorbent assays (ELISA) and real- time polymerase-chain reaction (R T -PCR) which are based on nucleic and acid hybridization [3]. A recent study [4] on the behavior of C-type lectin domain family 5 , member A (CLEC5A) gene may result in a strategy for reducing tissue damage which would help improve the odds of surviv al of the patients suffering from DHF and dengue shock syndrome (DSS). A multi variate model was de veloped in [5] for pre- dicting hemoglobin (Hb) using predictors such as reactance obtained from a single frequency bioelectrical impedance analysis, sex, nausea/vomiting sensation and weight. These strategies can be employed only after 2 − 12 days from the onset of the illness and require state-of-the-art laboratory facilities. The W orld Health Organization (WHO) has arrived at a classification scheme for identifying the infected individuals based on clinical symptoms and laboratory features. The de- velopment of predictiv e models for diagnosis of dengue fev er based on these schemes is affected by missing or incomplete data records in the clinical databases [6] which may arise due to any or all of the following reasons (i) value being lost (erased or deleted) (ii) not recorded (iii) incorrect measure- ments (i v) equipment errors and (v) an expert not attaching any importance to a particular clinical procedure. Usually data is not collected from an or ganized research point of vie w [7]. The presence of large number of clinical symptoms and laboratory features requires one to search large sub spaces for optimal feature subsets. These issues unless addressed appropriately would hinder the dev elopment of accurate and computationally effecti ve diagnostic system. In view of the above challenges, we present the following nov el features of our work: • to identify the missing values (MV) in the data set and impute them by using a ne wly de veloped novel imputation procedure; • to identify a set of clinical symptoms that would enable early detection of suspected dengue in children and adults, which reduces the risk of transmission of the dengue fev er in the community; • to identify the laboratory features and clinical symptoms that would enable better diagnosis and understanding of the disease in suspected dengue individuals. This renders optimal utilization of the laboratory resources required for confirmed diagnosis; • to build a predictiv e model that has a capability of render- ing effecti ve diagnosis in realtime. Further we compare its performance with other state-of-the-art methods used in the diagnosis of dengue fever . c 20xx IEEE. Personal use of this material is permitted. Permission from IEEE must be obtained for all other uses, in any current or future media, including reprinting/republishing this material for advertising or promotional purposes, creating new collectiv e works, for resale or redistribution to servers or lists, or reuse of any copyrighted component of this work in other works. DOI: 10.1109/TITB.2011.2171978 The present paper is organized as follows: A survey of the state-of-the-art techniques for the diagnosis of dengue fev er is presented in Section II, while in Section III we describe our nov el methodology for computer-aided clinical diagnosis of dengue. The performance ev aluation of the methodologies is described in Section IV. The description of the data sets and the experimental results are presented in Section V. W e present a comparison of our new imputation methodology with other imputation methods in Section VI. In Section VII we discuss the computational complexity of our new method. Comparison of our new methodology with other state-of-the-art methods forms the subject of Section VIII. Conclusions and discussion are deferred to Section IX. I I . S U RV E Y O F T H E S TA T E - O F - T H E - A RT T E C H N I Q U E S F O R D I AG N O S I S O F D E N G U E F E V E R Logistic regression method was employed to identify clini- cal symptoms and laboratory features in 381 individuals, out of which 148 were confirmed dengue [8]. The data records with missing values (MV) are ignored and are deleted from the data set. In [9], the study was conducted on clinical records comprising of 341 children and 597 adults out of which 38 and 107 respectiv ely were laboratory-confirmed positive dengue cases. In this study the data fields that are incomplete or inaccurate for all suspected dengue cases were replaced with the kno wn values corresponding to the information in the medical charts. A C4.5 decision tree which has an in built mechanism of handling MV was employed in [10] to de velop a diagnostic algorithm to dif ferentiate dengue from non-dengue illness on a data set comprising of 1200 patients of which 173 had DF , 171 had DHF and 20 had DSS. A support vector machine (SVM) based methodology was employed in [11] to analyze the expression pattern of 12 genes of 28 dengue patients of which 13 were DHF and 15 were DF cases. A set of seven influential genes were identified through selective remov al of expression data of these twelve genes. In the above studies the MV were either removed [8], or filled with approximate values based on medical charts [9]. These approaches would lead to biased estimates and may either reduce or exaggerate the statistical po wer . Methods such as logistic regression, maximum likelihood and expectation maximization have been employed for imputation of MV , but they can be applied only on data sets that are either nominal or numeric. There are other imputation methods such as k- nearest neighbor imputation (KNNI) [12]; k-means clustering imputation (KMI) [13]; weighted k-nearest neighbor imputa- tion (WKNNI) [14] and fuzzy k-means clustering imputation (FKMI) [13] that have been applied on other data sets but not on dengue fe ver data sets. Howe ver , the authors in [8], [9], [11] hav e employed methods such as odds ratio (OR) and selectiv e inclusion or exclusion of attributes for obtaining features sub sets of data sets of dengue fev er . But these methods do not yeild effecti ve diagnosis as all interactions or correlations between the features and the diagnosis are not considered in these studies. I I I . A N E W M E T H O D O L O G Y F O R C O M P U T E R - A I D E D D I AG N O S I S O F D E N G U E F E V E R Motiv ated by the above issues we propose a new method- ology comprising of a novel non parametric missing value imputation method that can be applied on data sets consisting of attributes that are of the type categorical (nominal) and/or numeric (integer or real). The methodology proposed in [15] ignores missing values while generating the decision tree, which renders lower prediction accuracies. W e have embedded the ne w imputation strategy (Section III-B) before generating the alternating decision tree which results in the improved performance of the classifier on data sets having missing values. Also, we dev elop an effecti ve wrapper based features selection algorithm in order to identify the most influential features subset. The present methodology comprises in uti- lizing the new imputation embedded alternating decision tree and the wrapper based features subset selection algorithm. This methodology can predict the diagnosis of dengue in real time. In fact the machine knowledge acquired by utilizing this nov el methodology will be useful to diagnose other indi viduals based on clinical symptoms and laboratory features where the clinical decision is unav ailable. W e designate this novel methodology as NM throughout this work. A. Data repr esentation A clinical data set can be represented as a set S having row vectors ( R 1 , R 2 , . . . , R m ) and column vec- tors ( C 1 , C 2 , . . . , C n ) . Each record can be represented as an ordered n-tuple of clinical and laboratory attributes ( A i 1 , A i 2 , . . . , A i ( n − 1) , A in ) for each i = 1 , 2 , . . . , m where the last attribute ( A in ) for each i , represents the physician’ s diagnosis to which the record ( A i 1 , A i 2 , . . . , A i ( n − 1) ) belongs and without loss of generality we assume that there are no missing elements in this set. Each attribute of an element in S that is A ij for i = 1 , 2 , . . . , m and j = 1 , 2 , . . . , n − 1 can either be a categorical (nominal) or numeric (real or integer) type. Clearly all the sets considered are finite sets. B. A new non-parametric imputation strate gy The first step in any imputation algorithm is to compute the proximity measure in the feature space between the clinical records to identify the nearest neighbors from where the v alues can be imputed. The most popular metric for quantifying the similarity between any two records is the Euclidean distance. Even though this metric is simpler to compute, it is sensitiv e to the scales of the features inv olved. Further it does not account for correlation between the features. Also, the categorical variables can only be quantified by counting measures which calls for the dev elopment of effecti ve strategies for computing the similarity [16]. Considering these factors we first propose a ne w indexing measure I C l ( R i , R k ) between two typical elements R i , R k for i, k = 1 , 2 , . . . , m, l = 1 , 2 , . . . , n − 1 belonging to the column C l of S which can be applied on any type of data, be it categorical (nominal) and/or numeric (real or integer). W e consider the following cases: Case I: A in = A kn Let A denote the collection of all members of S that c 20xx IEEE. Personal use of this material is permitted. Permission from IEEE must be obtained for all other uses, in any current or future media, including reprinting/republishing this material for advertising or promotional purposes, creating new collectiv e works, for resale or redistribution to servers or lists, or reuse of any copyrighted component of this work in other works. DOI: 10.1109/TITB.2011.2171978 belong to the same decision class to which R i and R k belong and does not hav e MV . Based on the type of the attribute to which the column C l belongs, the following situations arise: (i) Elements of the column C l of S are of categorical (nominal) type: W e no w express A as a disjoint union of non- empty subsets of A , say B γ p 1 , B γ p 2 , . . . , B γ p s ob- tained in such a manner that ev ery element of A belongs to one of these subsets and no element of A is a member of more than one subset of A . That is A = B γ p 1 S B γ p 2 S , . . . , S B γ p s , in which γ p 1 , γ p 2 , . . . , γ p s denote the cardinalities of the respec- tiv e subsets B γ p 1 , B γ p 2 , . . . , B γ p s formed out of the set A , with the property that each member of the same subset has the same first co-ordinate and members of no two different subsets have the same first co-ordinate. W e define an index I C l ( R i , R k ) = ( min { γ p i γ q k , γ q k γ p i } , for i 6 = k ; 0 , otherwise. where γ p i represents the cardinality of the subset B γ p i , all of whose elements hav e first co-ordinates A il and γ q k represents the cardinality of that subset B γ q k , all of whose elements have first co-ordinates A kl . (ii) Elements of the column C l of S are of numeric type: Numeric types can be classified further as integers (whole numbers) or real (fractional numbers). If the attribute is of integer type then we follo w the procedure discussed in Case I item (i). F or fractional numbers we construct the index I C l ( R i , R k ) , based on the ratio of the values of the elements A il , A kl of l th column to the mean of the set of elements belonging to A that do not hav e MV and is given by I C l ( R i , R k ) = min { A il A # , A kl A # } , for i 6 = k ; 0 , otherwise. In the abov e definition A # denotes the av erage of the l th column entries of all the elements of the set A excluding those with MV in the l th column. Case II: A in 6 = A kn Clearly R i and R k belong to two different decision classes. Consider the subsets P i and Q k consisting of members of S that share the same decision with R i and R k respectiv ely and does not have MV . Clearly P i T Q k = ∅ . Based on the type of the attribute to which the column C l belongs, the following situations arise: (i) Elements of the column C l of S are of nominal or categorical type: Follo wing the procedure discussed in Case I item (i) we write P and Q as a disjoint union of non-empty subsets of P β 1 , P β 2 , . . . , P β r and Q δ 1 , Q δ 2 , . . . , Q δ s respectiv ely in which β 1 , β 2 , . . . , β r and δ 1 , δ 2 , . . . , δ s indicate the cardinalities of the respective subsets. W e define the indexing measure between the two records R i and R k as I C l ( R i , R k ) = max { β r δ s , δ s β r } , for i 6 = k ; 0 , otherwise. where β r represents the cardinality of the subset P β r all of whose elements hav e first co-ordinates A il in set P and δ s represents the cardinality of that subset Q δ s , all of whose elements hav e first co-ordinates A kl in set Q . (ii) Elements of the column C l of S are of numeric type: If the type of the attribute is integer we follow the procedure discussed in Case II item (i). For fractional numbers we define the index I C l ( R i , R k ) between the two records R i andR k as I C l ( R i , R k ) = max { A il Λ , A kl Λ } , for i 6 = k ; 0 , otherwise. In the abov e definition Λ = min { P # , Q # } where P # , and Q # denote the average of the first column entries of all the elements of the sets P and Q excluding those with MV in the l th column. The proximity or distance scores between the clinical records in the data set S can be represented as D = {{ 0 , d 12 , . . . , d 1 m } ; { d 21 , 0 , . . . , d 2 m } ; . . . ; { d m 1 , d m 2 , . . . , 0 }} where d ik = q P n − 1 l =1 I 2 C l ( R i , R k ) . For each of the missing value instances in a record R i our imputation procedure first computes the score z ( d ij ) = ( d ij − d ) q 1 m − 1 P m i =1 ( d ij − d ) where j = 1 , 2 . . . , m and d denotes the mean distance. W e then pick up only those records (nearest neighbors) which satisfy the condition z ( d ij ) ≤ 0 where { d i 1 , d i 2 , . . . , d im } denote the distances of the current record R i to all other records in the data set S . If the type of attribute is categorical or integer , then the data value that has the highest frequency (mode) of occurrence in the corresponding columns of the nearest records is imputed. For the data values of type real we impute the mean of data values in the corresponding columns of the nearest records. Illustrative example: The following example illustrates the spirit of the new imputation algorithm. Consider a data set represented by the matrix S consisting of ro ws R 1 =(?, 12.0, positiv e), R 2 =( yes, 10.5, positiv e), R 3 =( no, 14.0, positiv e) and R 4 =(no, 13.0, negati ve). The missing value instance (’?’) in this data set is present in record R 1 and column C 1 . These rows correspond to the data records of four individuals. Clearly the Case I item (i) of the imputation algorithm applies to this data set for determining the missing value. The matrix of the indexing measure I has the following rows: (0,0.86) and (0,0.99) in which γ p = 0 , γ q = 1 and A # = 12 . 17 . The rela- tiv e distances between R 1 and the other records are computed as { 0 . 93 , 0 , 0 } and the corresponding z-scores are obtained as {− 0 . 57 , − 0 . 57 , 1 . 154 } . Since z ≤ 0 for the distances between R 1 and R 2 and also R 1 and R 3 , we conclude that the records R 2 and R 3 are nearer to R 1 and hence the highest frequency c 20xx IEEE. Personal use of this material is permitted. Permission from IEEE must be obtained for all other uses, in any current or future media, including reprinting/republishing this material for advertising or promotional purposes, creating new collectiv e works, for resale or redistribution to servers or lists, or reuse of any copyrighted component of this work in other works. DOI: 10.1109/TITB.2011.2171978 (mode) of the data value in column C 1 is ’yes’. Accordingly this value is a suitable candidate for imputation. C. Identification of influential featur es In situations presented by real world processes, influential features are often unkno wn a priori , hence features that are redundant or those that are weakly participating in decision making must be identified and appropriately handled. The features selection procedures can be categorized as random or sequential. The sequential methods such as forward selec- tion, backward elimination and bidirectional selection employ greedy methods and hence may not often be successful in finding the optimal features subsets. In contrast to this stochas- tic optimization methods such as genetic algorithms (GAs) perform global search and are capable of effecti vely exploring large search spaces [17]. In our approach we adopt a wrapper subset based feature ev aluation model [18] where the method of classification itself is used to measure the importance of the features sub set identified by the GA. D. Predictive modeling using decision tr ees An alternating decision tree (ADT) consists of decision nodes (splitter node) and prediction nodes which can either be an interior node or a leaf node. The tree generates a prediction node at the root and then alternates between decision nodes and further prediction nodes. Decision nodes specify a pred- icate condition and prediction nodes contain a single number denoting the predicti ve value. An instance can be classified by following all paths for which all decision nodes are true and summing the relev ant prediction nodes that are trav ersed. A positiv e sum implies membership of one class and the neg ativ e sum indicates the membership of the opposite class. I V . P E R F O R M A N C E E V A L UAT I O N M E T H O D S The standard definitions of the performance measures such as the specificity (SP), sensiti vity (SE), recei ver operator characteristics (R OC) and area under R OC (A UC) based on number of true positives, true negati ves, false positiv es and false negati ves are utilized in our experimental analysis. W e employed a stratified k -fold cross validation for estimating the test error on classification algorithms. W e have randomly divided the gi ven data set into k disjoint subsets. Each subset is roughly of equal size and has the same class proportions as in the original data set. The classification model has been built by setting aside one of the subsets as test data set and train the classifier using the other nine subsets. The trained model is then employed in classifying the test data set. The experiment is repeated by setting aside each of the k subsets as test data sets one at a time. T o compute R OC for k folds we first train a classifier using the training data set of a k fold and then obtain the scores in terms of the predicted probabilities for positives and neg ativ es from the trained classifier using the test data set corresponding to the same fold as the training data. Once all the probabilities and corresponding actual decisions are collected, the R OC is obtained by first computing the thresholds using the quartiles of the cumulati ve predictiv e Algorithm 1 The NM Methodology Input: (a) Data sets for the purpose of decision making S ( m, n ) where m and n are number of records and attributes respectively and the members of S may have MV in any of the attrib utes except in the decision attribute, which is the last attribute in the record. (b) The type of attribute C of the columns in the data set. Output: (a) Classification accuracy for a giv en data set S . (b) Performance metrics A UC, SE, SP . Algorithm (1) Identify and collect all records in a data set S (2) Impute the MV in the data set S using the procedure discussed in Section III-B. (3) Extract the influential features using a wrapper based approach with genetic search for identifying features subsets and alternating decision tree for its evaluation as discussed in Section III-C. (4) Split the dataset in to training and testing sets using a stratified k fold cross validation procedure. Denote each training and testing data set by T k and R k respectiv ely . (5) For each k compute the following (i) Build the ADT using the records obtained from T k . (ii) Compute the predicted probabilities (scores) for both positive and negati ve diagnosis of dengue from the ADT built in Step (5)-(i) using the test data set R k . Designate the set consisting of all these scores by P . (iii) Identify and collect the actual diagnosis from the test data set R k in to set denoted by L . (6) Repeat the Steps (5)-(i) to Step (5)-(iii) for each fold. (7) Obtain the performance metrics A UC, SE and SP utilizing the sets L and P . (8) RETURN A UC, SE, SP . (9) END. probabilities of all the k folds. For each threshold value the measures SE and SP are computed. The false positi ve rate and true positiv e rate values of the R OC is taken as (1-SP) and SE respectiv ely . The A UC is computed by applying a trapezoidal rule on the data points of the R OC curve. The optimal cut off or operating point is the threshold that is closest point to (0,1) on the R OC curve which giv es the equal error rate. The optimal values of A UC, SE, SP are computed for this cut off point. V . E X P E R I M E N T S A N D R E S U LT S In our methodology we hav e employed a stratified ten-fold cross validation ( k = 10 ) procedure. W e applied a standard implementation of SVM with radial basis function kernel [11] using LibSVM package [19]. The GA algorithm for features selection has been performed using the parameter v alues: cross over probability= 1 . 0 and mutation probability= 0 . 001 . The standard implementation of C4.5, LOR algorithms in W eka c [20] are considered for ev aluating the performance of our algorithm. W e have implemented the NM algorithm and the performance ev aluation methods in Matlab c . A non- parametric statistical test proposed by W ilcoxon [21] is used to compare the performances of the algorithms. W e compared the NM with the state-of-the-art methodologies employed in diagnosis of dengue fev er using different performance measures discussed in Section IV. A. Data sets W e hav e obtained four surveillance data sets from case- patients admitted into hospitals located in central and western States of India. Standard procedures were adopted in collect- ing the clinical and demographic attributes of the patients. The probable cases of the dengue fev er are arrived through definitiv e laboratory tests such as ELISA. The patients records include clinical symptoms: fe ver , fev er duration, headache, c 20xx IEEE. Personal use of this material is permitted. Permission from IEEE must be obtained for all other uses, in any current or future media, including reprinting/republishing this material for advertising or promotional purposes, creating new collectiv e works, for resale or redistribution to servers or lists, or reuse of any copyrighted component of this work in other works. DOI: 10.1109/TITB.2011.2171978 T ABLE I Performance comparison of the NM with other methodologies (C4.5, SVM and LOR) on the data sets used in the present study Dataset Method Accuracy SE SP AUC (%) DS1 NM 100.00 100.00 100.00 1.00 C4.5 96.44 95.90 97.27 1.00 LOR 91.02 89.49 93.36 0.96 SVM 96.75 97.18 96.09 0.97 DS2 NM 86.53 88.97 82.81 0.93 C4.5 82.35 87.18 75.00 0.84 LOR 72.91 74.36 70.70 0.78 SVM 78.17 89.49 60.94 0.75 DS3 NM 100.00 100.00 100.00 1.00 C4.5 94.97 95.41 93.55 0.99 LOR 92.71 92.79 92.47 0.96 SVM 98.99 98.69 100.00 0.99 DS4 NM 95.48 98.03 87.10 0.95 C4.5 90.20 91.48 86.02 0.91 LOR 88.44 89.84 83.87 0.90 SVM 92.71 98.03 75.27 0.87 retro-orbital pain (eye pain), myalgia (body pain), arthralgia (joint pain), nausea or vomiting, bleeding gums, rash, bleeding sites, restlessness and abdominal pain and laboratory features: haemoglobin (Hb), white blood cell count (WBC), packed cell volume (PCV) and platelets. The last attribute in data set is the decision attribute. The clinical records are then re- grouped into four data sets. The first data set (DS1) comprises of 646 adults (age ≥ 16 years) with clinical symptoms and laboratory features out of which 256 were dengue positiv e and 390 are dengue negati ve. The second data set (DS2) is a part of DS1 consisting of only clinical symptoms (ignoring the laboratory features) and has the same number of records as in DS1. The third data set (DS3) consists of 398 children (age between 5 − 15 years) [9] with clinical symptoms and laboratory features, out of which 93 were dengue positiv e and 305 were dengue negati ve. The fourth data set (DS4) is a part of DS3 with only clinical symptoms and has same number of records as DS3. B. Results The performance of the NM is compared with other method- ologies (C4.5, SVM and LOR) on the data sets used in the present study and the classification accuracies are presented in T able I. A hundred percent accuracy is reported by NM both in data sets DS1 and DS3. The Wilcoxon matched-pairs rank sum test results comparing the accuracies of NM with other methodologies are shown in T able II. For example, the positiv e rank sum of 55 . 0 and negativ e rank sum of 0 . 0 with a p-value < 0 . 01 for C4.5 using data set DS1 (first row T able II) indicates the superior performance of the new methodology ov er C4.5 and also in respect of other methods as well. T ABLE III Influential features subsets identified by NM Data set # Orignal # influential features Accuracy features features (%) identified DS1 16 5 100.00 retro-orbital pain , arthralgia, fev er duration, platelet, fever DS2 9 6 86.53 vomiting or nausea, myalgia, rash, bleeding sites, abdominal pain, arthralgia DS3 16 2 100.00 Hb, fev er DS4 9 2 95.48 retro-orbital pain, arthralgia T ABLE II W ilcoxon matched-pairs rank sum test for compar- ing the performance of NM with other methodologies used in diagnosis of dengue fev er Dataset Method Rank sum(+, -) p-value DS1 C4.5 55.0, 0.0 0.002 LOR 55.0, 0.0 0.002 SVM 45.0, 0.0 0.004 DS2 C4.5 55.0, 0.0 0.002 LOR 55.0, 0.0 0.002 SVM 55.0, 0.0 0.002 DS3 C4.5 36.0, 0.0 0.008 LOR 36.0, 0.0 0.008 SVM 10.0, 0.0 0.125 DS4 C4.5 38.5, 6.5 0.074 LOR 37.0, 8.0 0.098 SVM 27.0, 9.0 0.25 The above comparisons and statistical tests clearly demon- strate the significance of our methodology in identifying the suspected dengue both in children and adults. The imputation strategy employed in our methodology has improv ed the classification accuracies when compared with C4.5 which uses a modified information gain measure to generate the decision tree in presence of MV . The mean imputation strategies adopted in SVM and LOR could not render classification accuracies higher than NM. The features subsets identified by the NM is sho wn in T able III. The application of features selection method reduced the number of attributes by 75% in DS1 and 87 . 5% in DS3 data sets. Our methodology identified some of the clinical symptoms and laboratory features in adults (vomiting and abdominal pain) different from those in children which are in concurrence with earlier studies [22], [23]. The clinical attribute rash was identified as an important feature in adults but not in children. This may be explained by the relativ e frequency of the secondary infections in adults [24]. Arthralgia was found to be influencing the final diagnosis of dengue both in children and adults. The ROC curves comparing the performance of NM with other methodologies are shown in Figs. 1a-1d. The operating point or cut off point ( p < 0 . 001 ) is shown as a pentagon on each of the R OC curves. The ROC curves clearly demonstrate the superior performance of NM ov er other methods used in the diagnosis of dengue. V I . P E R F O R M A N C E C O M PA R I S O N O F N E W I M P U TA T I O N A L G O R I T H M W I T H B E N C H M A R K I N G DAT A S E T S Since no specific studies on imputation of missing v alues in dengue data sets we hav e utilized some bench marking data sets obtained from Keel and Uni versity of California Irvin (UCI) machine learning data repositories [25], [26] to test the performance of the new imputation algorithm. The c 20xx IEEE. Personal use of this material is permitted. Permission from IEEE must be obtained for all other uses, in any current or future media, including reprinting/republishing this material for advertising or promotional purposes, creating new collectiv e works, for resale or redistribution to servers or lists, or reuse of any copyrighted component of this work in other works. DOI: 10.1109/TITB.2011.2171978 (a) DS1 (b) DS2 (c) DS3 (d) DS4 Fig. 1. R OC curves W ilcoxon statistics in T able IV is computed based on the accuracies obtained by the new imputation algorithm with the accuracies of those obtained by other imputation algorithms using a C4.5 decision tree. The results in T able IV clearly demonstrate the fact that our algorithm is superior to other imputation algorithms as the positiv e rank sums are higher than the negati ve rank sums ( p < 0 . 05 ) in all the cases. T ABLE IV W ilcoxon sign rank statistics for matched pairs comparing the ne w imputation algorithm with other imputation methods using C4.5 decision tree Method Rank Sums T est Critical p-v alue (+, -) Statistics V alue FKMI 78.5, 12.5 12.5 18 0.021 KMI 85.0, 6.0 6 18 0.003 KNNI 76.0, 15.0 15 18 0.032 WKNNI 83.0, 8.0 8 18 0.006 V I I . C O M P U T A T I O NA L C O M P L E X I T Y The computational complexity is a measure of the perfor- mance of the algorithm. For each data set having n attributes and m records, we select only those subset of records m 1 ≤ m , in which missing values are present. The distances are computed for all attributes n excluding the decision attribute. So, the time complexity for computing the distance would be O ( m 1 ∗ ( n − 1)) . The time complexity for selecting the nearest records is of order O ( m 1 ) . For computing the frequency of occurrences for nominal attributes and av erage for numeric attributes the time taken would be of the order O ( m 1 ) . Therefore, for a giv en data set with k -fold cross validation having n attributes and m records, the time complexity of our new imputation algorithm would be k ∗ ( O ( m 1 ∗ ( n − 1) ∗ m ) + 2 ∗ O ( m 1 )) which is asymptotically linear . Our experiments were conducted on a personal computer having a Intel(R) core (TM) 2 Duo, CPU @ 2 . 93 GHZ processor with 4 GB RAM. For each data set the computational time for imputation and features selection is measured in terms of the number of CPU clock c ycles elapsed in seconds. Based on the results, we obtain a scatter plot (red line in Fig. 2) between the varying database sizes and the time taken by NM. Also, we employed a linear regression on our results and obtained the relation between the time taken (T) and the data size (D) as T = 0 . 96 D + 5 . 54 , α = 0 . 05 , p < 0 . 05 , r 2 = 0 . 98 . The Fig. 2. Computational comple xity of the NM presence of the linear trend between the time taken and the varying database sizes ensures the numerical scalability of the performance of NM in terms of asymptotic linearity . V I I I . C O M PAR I S O N O F R E L A T E D M E T H O D O L O G I E S O N D E N G U E S T U D I E S In this section we compare the results (T able V) obtained in [8]–[10] with the results of our new methodology on the current data set of 1044 individuals including children and adults. As compared to [9] where children with rash were having SE of 41 . 2% and SP of 95 . 5% our methodology when applied on the data set DS2 resulted in an accuracy of 86 . 53% , SE of 88 . 97% and SP of 82 . 81% which is considered to be a good classification model as both SE and SP are higher than 80% . In [10] both clinical and laboratory features were utilized to dev elop decision rules using C4.5 decision tree and they hav e reported a SE of 87 . 8% and SP of 75 . 7% . In comparison to [10] our methodology when applied on DS1 and DS3 had resulted in SE of 100% and SP of 100% . From these comparisons we conclude that the ne w methodology presented in this study if applied on the data sets used in [8]–[10] would yield more accurate results. I X . C O N C L U S I O N S A N D D I S C U S S I O N A new methodology (NM) with built in features for im- putation of missing v alues and identification of influential attributes is discussed. The NM has out performed the state- of-the-art methodologies in diagnosis of dengue fev er on all c 20xx IEEE. Personal use of this material is permitted. Permission from IEEE must be obtained for all other uses, in any current or future media, including reprinting/republishing this material for advertising or promotional purposes, creating new collectiv e works, for resale or redistribution to servers or lists, or reuse of any copyrighted component of this work in other works. DOI: 10.1109/TITB.2011.2171978 T ABLE V Evaluation of NM with other related methodologies on dengue studies State-of-the- art #Patients (DF) Records with MV Methods Accuracy (%) SE (%) SP (%) Chadwick et al., [8] (clinical) 381 (148) deleted LOR, OR 84 . 5 84 85 Chadwick et al., [8] (laboratory) 381 (148) deleted -do- 76 . 5 74 79 Ramos et al., [9] (clinical, children) 938 (38) manual update -do- 68 . 95 41 . 2 95 . 5 T anner et al., [10] (laboratory) 1200 (173) deleted C4.5 81 . 75 87 . 8 75 . 7 Gomes et al., [11] (gene database) 20 (15) - SVM 85 - - NM (DS1) (adults, clinical & laboratory) 1044 (256) imputed (new algo- rithm) ADT , GA 100 100 100 NM (DS2) (adults, clinical) 1044 (256) -do- -do- 86 . 53 88 . 97 82 . 81 NM (DS3) (children, clinical & laboratory) 1044 (93) -do- -do- 100 100 100 NM (DS4) (children, clinical) 1044 (305) -do- -do- 95 . 48 98 . 03 87 . 10 the four data sets considered in our experiments. The NM has generated a decision tree with an accuracy of 100 . 0% in children and adults using both clinical and laboratory features. Based on the performance measures we conclude that the use of the new imputation strategy and features selection methods with wrapper based subset ev aluation using genetic search has improv ed the accuracies of the predictions. Though the new methodology discussed in this paper may be taken as a univ er- sal tool for the effecti ve diagnosis of this disease, it remains to be seen whether or not this methodology is geographically independent. Howe ver , we are willing to share our predictive methodologies and strategies with the researchers working on dengue fe ver all over the globe. W e hold the view that more intensiv e and introspectiv e studies of this kind will pav e way for better clinical management and virological surveillance of dengue fev er . A C K N O W L E D G M E N T S W e thank the Associate Editor and the anon ymous revie wers for their constructive suggestions on our paper . This research is supported by the Foundation for Scientific Research and T echnological Innov ation (FSR TI)- A Constituent Division of Sri V adrevu Seshagiri Rao Memorial Charitable Trust, Hyderabad - 500 035, India. R E F E R E N C E S [1] D. Gubler, “Dengue and dengue hemorrhagic fever , ” Clinical Micr obi- ology Re views , v ol. 11, pp. 480–96, 1998. [2] T . P . Monath, “Dengue: The risk to de veloped and developing countries, ” Pr oceedings of the National Academy of Sciences of the United States of America , v ol. 91(7), pp. 2395–2400, 1994. [3] S. De Paula and B. Fonseca, “Dengue: a review of the laboratory tests a clinician must know to achiev e a correct diagnosis, ” Braz J Infect Dis. , vol. 8(6), pp. 390–398, 2004. [4] S.-T . Chen, Y .-L. Lin, M.-T . Huang, M.-F . W u, S.-C. Cheng, H.-Y . Lei, C.-K. Lee, T .-W . Chiou, C.-H. W ong, and S.-L. Hsieh, “Clec5a is critical for dengue-virus-induced lethal disease, ” Natur e , vol. 453(7195), pp. 672–676, 2008. [5] F . Ibrahim, N. Ismail, M. T aib, and A. W . W an, “Modeling of hemoglobin in dengue fever and dengue hemorrhagic fever using bio- electrical impedance. ” Physiol Meas , vol. 25(3), pp. 607–15, 2004. [6] M. N. Colleen, A. G. William, L. K. Merril, C. D. Naylor, and S. L. Duncan, “Dealing with missing data in observational health care outcome analyses, ” Journal of Clinical Epidemiology , vol. 53(4), pp. 377–383, 2000. [7] K. J. Cios and W . Mooree, “Uniqueness of medical data mining, ” Artificial Intelligence in Medicine , vol. 26, pp. 1–24, 2002. [8] D. Chadwick, B. Arch, A. Wilder -Smith, and N. P aton, “Distinguishing dengue fever from other infections on the basis of simple clinical and laboratory features: application of logistic regression analysis, ” J Clin V ir olology , vol. 35(2), pp. 147–153, 2006. [9] M. M. Ramos, K. M. T omashek, D. F . Arguello, C. Luxembur ger , L. Quiones, J. Lang, and J. L. Muoz-Jordan, “Early clinical features of dengue infection in puerto rico, ” T ransactions of the Royal Society of T r opical Medicine and Hygiene , vol. 103(9), pp. 878–884, 2009. [10] L. T anner , M. Schreiber , J. Low , A. Ong, and T . T olfvenstam, “Decision tree algorithms predict the diagnosis and outcome of dengue fever in the early phase of illness, ” PLoS Ne gl T rop Dis , vol. 2(3), pp. 1–9, 2008. [11] A. L. V . Gomes, L. J. K. W ee, A. M. Khan, L. H. V . G. Gil, E. T . A. Marques, Jr , C. E. Calzav ara-Silva, and T . W . T an, “Classification of dengue fev er patients based on gene expression data using support v ector machines, ” PLoS ONE , vol. 5(6), pp. 1–7, 2010. [12] G. Batista and M. Monard, “ An analysis of four missing data treatment methods for supervised learning, ” Applied Artificial Intelligence , vol. 17, no. 5, pp. 519–533, 2003. [13] J. Deogun, W . Spaulding, B. Shuart, and D. Li, “T o wards missing data imputation: A study of fuzzy k-means clustering method, ” in 4th International Confer ence of Rough Sets and Current T rends in Computing(RSCTC’04) , ser . Lecture Notes on Computer Science, vol. 3066. Lecture Notes In Computer Science, 2004, pp. 573–579. [14] O. Tro yanskaya, M. Cantor , G. Sherlock, P . Brown, T . Hastie, R. Tib- shirani, D. Botstein, and R. Altman, “Missing value estimation methods for dna microarrays, ” Bioinformatics , vol. 17, pp. 520–525, 2001. [15] Y . Freund and L. Mason, “The alternating decision tree learning al- gorithm, ” in Proceeding of the Sixteenth International Conference on Machine Learning Bled, Slovenia . A CM, 1999. [16] U. T adashi, M. Y oshihide, K. Daichi, S. Masami, and K. Kenji, “Fast multidimensional nearest neighbor search algorithm based on ellipsoid distance, ” International J ournal of Advanced Intelligence , vol. 1(1), pp. 89–107, 2009. [17] D. E. Goldberg, Genetic algorithms in searc h, optimization and machine learning . Addison-W esley , 1989. [18] K. Ron and H. J. George, “Wrappers for feature subset selection, ” Artificial Intelligence , vol. 97, pp. 273–324, 1997. [19] C.-C. Chang and C.-J. Lin, “LIBSVM: A library for support vector machines, ” ACM T ransactions on Intelligent Systems and T echnology , vol. 2(3), pp. 1–27, 2001. [20] I. W itten and E. Frank, Data Mining: Practical machine learning tools and techniques . Mor gan Kaufmann, San Francisco., 2005. [21] F . W ilcoxon, “Individual comparisons by ranking methods, ” Biometrics Bulletin , vol. 1(6), pp. 80–83, 1945. [22] J. G.-R. Enid and G. R.-P . Jos, “Dengue severity in the elderly in puerto rico, ” P an Am J Public Health , v ol. 13(6), pp. 362–368, 2003. [23] W . Ole, H. Suchat, B. Chureeratana, C. Kesinee, S. Y oawalark, and P . Sasithon, “Risk factors and clinical features associated with sev ere dengue infection in adults and children during the 2001 epidemic in chonburi, thailand, ” T r opical Medicine and International Health , vol. 9(9), pp. 1022–1029, 2004. [24] C. Cobra, J. G. Rigau-Prez, G. Kuno, and V . V omdam, “Symptoms of dengue fever in relation to host immunologic response and virus serotype, puerto rico, 19901991, ” American Journal of Epidemiology , vol. 142(11), pp. 1204–1211, 1995. [25] A. Alcal-Fdez, A. Fernandez, Luengo, J. Derrac, S. G. J., L. Snchez, and F . Herrera, “Keel data-mining software tool: Data set repository , integration of algorithms and experimental analysis framework, ” Journal of Multiple-V alued Logic and Soft Computing , 2010. [26] A. Frank and A. Asuncion, “UCI machine learning repository , ” 2010. [Online]. A v ailable: http://archiv e.ics.uci.edu/ml
Original Paper
Loading high-quality paper...
Comments & Academic Discussion
Loading comments...
Leave a Comment