Statistical testing of shared genetic control for potentially related traits
Integration of data from genome-wide single nucleotide polymorphism (SNP) association studies of different traits should allow researchers to disentangle the genetics of potentially related traits within individually associated regions. Formal statis…
Authors: Chris Wallace
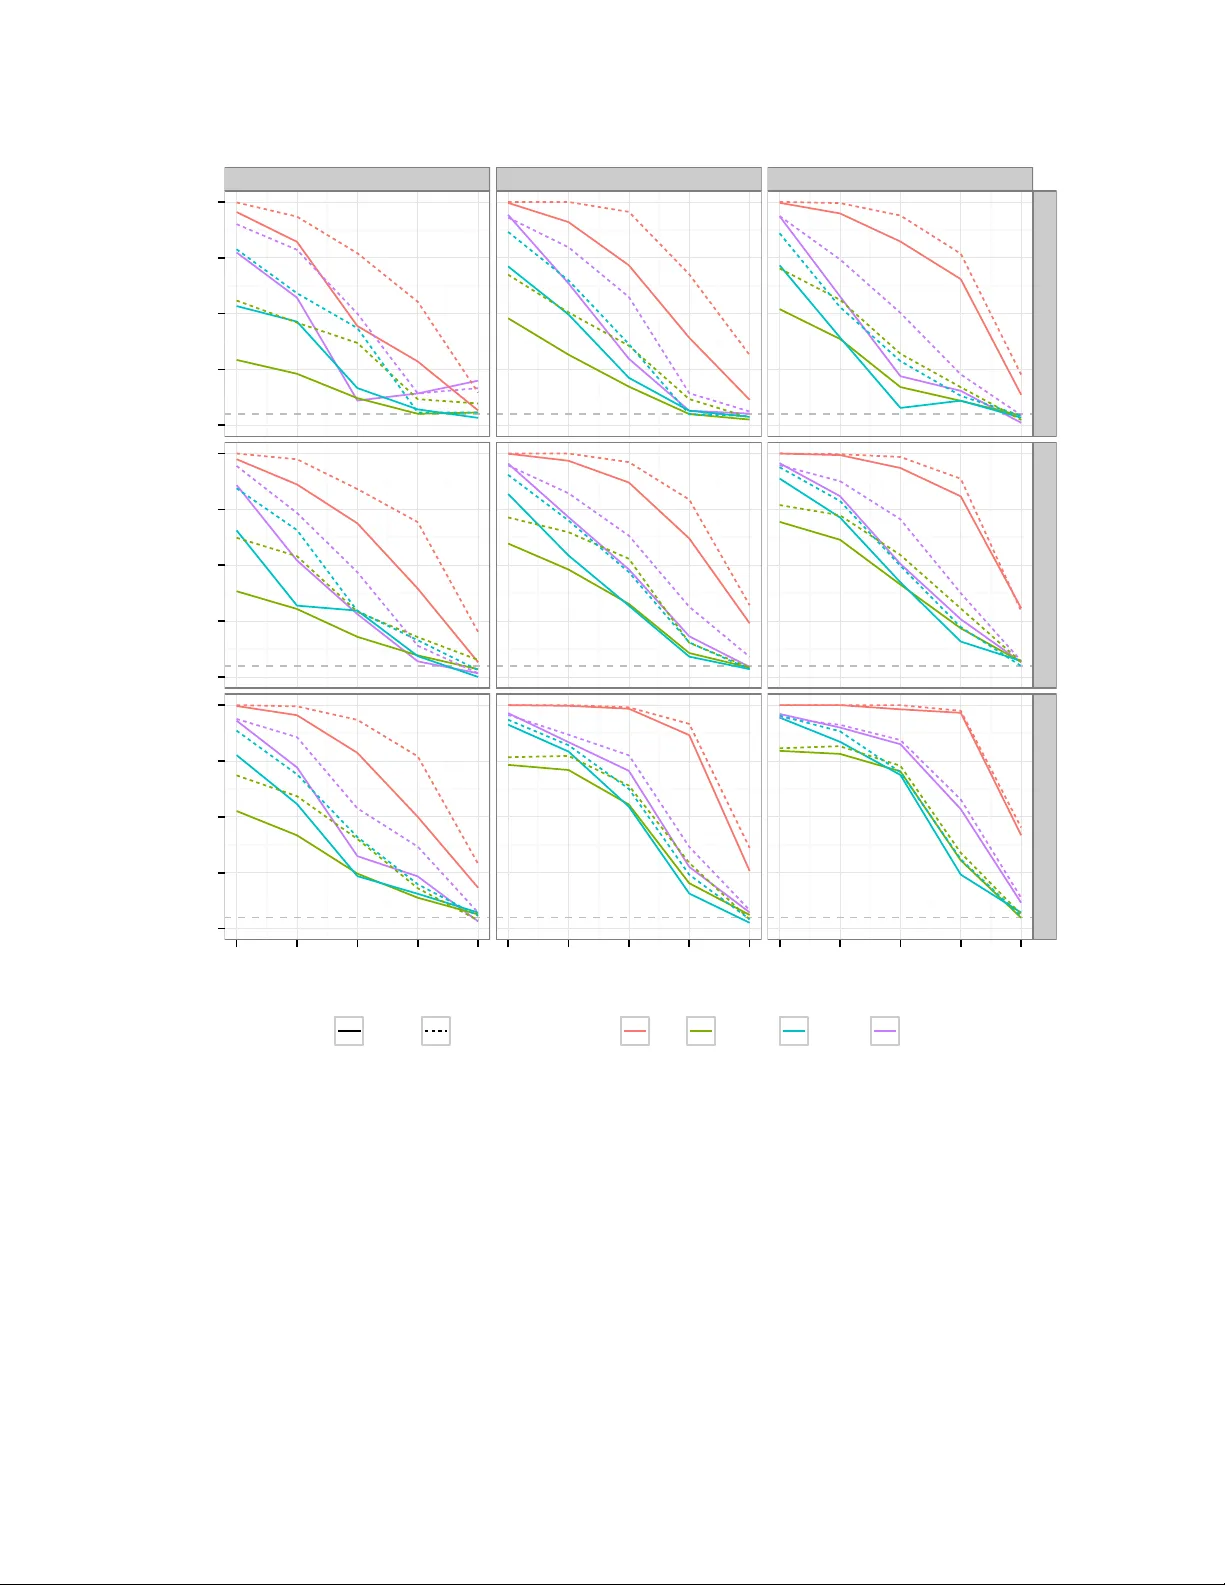
Statistical testing of shared genetic con trol for p oten tially related traits Chris W allace (Corresp onding author) Departmen t of Medical Genetics JDRF/W ellcome T rust Diab etes and Inflammation Lab oratory NIHR Cam bridge Biomedical Researc h Cen tre Cam bridge Institute for Medical Researc h Univ ersit y of Cam bridge W ellcome T rust/MR C Building Cam bridge CB2 0XY UK +44 (0)1223 761093 chris.wallace@cimr.cam.ac.uk 1 Abstract In tegration of data from genome-wide single n ucleotide p olymorphism (SNP) association studies of differen t traits should allow researchers to disentangle the genetics of potentially related traits within individually asso ciated regions. F ormal statistical colo calisation testing of individual regions, whic h requires selection of a set of SNPs summarizing the asso ciation in a region. W e sho w that the SNP selection metho d greatly affects t yp e 1 error rates, with published studies ha ving used methods exp ected to result in substan tially inflated t yp e 1 error rates. W e sho w that either av oiding v ariable selection and instead testing the most informative principal components or in tegrating ov er v ariable selection using Ba yesian model av eraging can lead to correct control of type 1 error rates. Application to data from Grav es’ disease and Hashimoto’s th yroiditis rev eals a common genetic signature across sev en regions shared b etw een the diseases, and indicates that in five of six regions asso ciated with Gra ves’ disease and not Hashimoto’s thyroiditis, this more likely reflects genuine absence of asso ciation with the latter rather than lac k of p ow er. Our examination, by simulation, of the p erformance of colo calisation tests and asso ciated softw are will foster more widespread adoption of formal colo calisation test- ing. Given the increasing av ailability of large expression and genetic asso ciation data sets from disease-relev ant tissue and purified cell p opulations, coupled with identification of regulatory sequences by pro jects such as ENCODE, colo calisation analysis has the p otential to reveal b oth shared genetic signatures of related traits and causal disease genes and tissues. Keyw ords Colo calisation, GW AS, genetic asso ciation, causal v ariants 2 In tro duction In recen t y ears, genome-wide asso ciation studies (GW AS) ha v e facilitated a dramatic increase in the num b er of genetic v ariants asso ciated with h uman disease and other traits such as gene expression. Understanding the means by which these v ariants exert their effect will aid the design of the detailed functional follo wup studies already underwa y . Although the causal v arian ts are not commonly known, multiple traits hav e b een mapped to the same genetic lo ci, raising the p ossibilit y that the same v ariants affect multiple traits either directly or with one trait mediating the other. F or example, genetic susceptibility to type 2 diab etes across 12 lo ci app ears mediated b y the genetic influence on b o dy mass index [Li et al., 2011]. Within individual lo ci, researchers are examining the genetic asso ciation signals from pairs of traits in parallel, with similar results in terpreted as evidence that the t w o traits ma y colo calise, or share a common causal v arian t. These traits may b e eQTL signals across tw o or more tissues [Dimas et al., 2009; F airfax et al., 2012], eQTL and disease signals [Nica et al., 2010; W allace et al., 2012] or tw o or more diseases [Cotsapas et al., 2011]. Distinguishing cases where related diseases share a common causal v ariant versus those where neigh b ouring but distinct v ariants app ear to underlie disease risk in a region will aid iden tification of cross-disease and disease-specific mec hanisms. In addition, comparison of disease and eQTL data has the p otential to rev eal b oth the lik ely disease causal gene in regions where a n um b er of candidate causal genes exist, and the relev ant tissue type where tissue-sp ecific eQTLs exist. Ho w ev er, dep endence betw een genot ypes at neighbouring SNPs, caused b y LD, means that determination of colo calisation is not obvious, as there may exist distinct but neighbouring causal v arian ts for each trait which are mutually asso ciated. When these traits are measured in the same individuals, it is p ossible to use conditioning to determine whether one trait mediates the other [Li et al., 2011]. F or example, if both b o dy mass index (BMI) and t yp e 2 diab etes (T2D) ha v e b een linked to a SNP , then when including BMI and the SNP as explanatory v ariables for T2D, BMI but not the SNP should sho w asso ciation if BMI is a mediator. How ever, when the traits are measured in distinct samples, or when tw o traits may share a common causal v arian t without one mediating the other, most researchers ha v e approac hed the task of lo oking for colo calisation either by examining b y eye the asso ciation signals across a set of common SNPs in the tw o data sets [Dub ois et al., 2010] or by testing for evidence of residual 3 asso ciation in their av ailable dataset conditional on the most asso ciated SNP in the other [Nica et al., 2010]. When full data for both traits are a v ailable, colo calisation ma y be tested b y examining whether co efficien ts from regressions of eac h trait against t wo or more SNPs are proportional, as they should b e if those SNPs jointly tag a common causal v ariant [W allace et al., 2012; Plagnol et al., 2009]. W e sho w here that na ¨ ıv e application of both conditional and prop ortional colo calisation tests ma y result in substantially inflated t yp e 1 errors, and explore reasons for that inflation. The inflation cannot b e easily resolved for conditional tests, but we demonstrate t w o alternativ e approaches for prop ortional testing whic h result in unbiased inference. Finally , w e apply these methods to colo calisation testing of 13 regions shown in Supplementary T able I which hav e b een asso ciated with one or b oth of the autoimm une th yroid diseases, Grav es’ disease (GD) and Hashimoto’s th yroiditis (HT), using previously published dense genot yping data [Co op er et al., 2012]. Metho ds Approac hes to colo calisation testing W e b egin by in tro ducing some notation and setting out the details of the existing approaches to colo calisation testing that are explored in this paper. Assume tw o traits, Y and Y 0 , ha ve b een measured in distinct samples and evidence exists for asso ciation of b oth traits to some genetic region. Let the region b e co v ered b y p SNPs genot yped in b oth samples, with the genot yp e matrices denoted b y X = ( X 1 , . . . , X p ) and X 0 = X 0 1 , . . . , X 0 p resp ectiv ely . Conditional approac hes b egin with iden tifying the most strongly asso ciated SNPs for Y and Y 0 , SNPs k and k 0 , say , then examine whether there is an y evidence for asso ciation b etw een Y and SNP k conditional on SNP k 0 . The n ull hypothesis is therefore H cond 0 : Y ⊥ ⊥ X k | X k 0 . (1) Concerned that LD would make in terpretation of the conditional test difficult, Nica et al. [2010] extended the conditional method as follows. F or ev ery SNP j generate residuals R j from a regression of Y against X j and test the correlation of R j and X k using Sp earman’s rank correlation 4 test, generating p v alues P j . The evidence against the n ull hypothesis (1) is then measured by the rank of P k 0 in the empirical distribution, [ P j ], generated. This effectiv ely compares the p v alue at the test SNP k conditional on SNP k 0 to that conditioning on all other SNPs in the region. Ho w ev er, note that b ecause this metho d summarizes evidence for colo calisation by a rank only , there is no statistical inference attached. Thresholds for in terpreting ranks w ould b e exp ected to dep end on SNP densit y and LD patterns. The proportional approach frames the n ull hypothesis differen tly . A set of q SNPs are c hosen whic h are deemed somehow to jointly b e goo d predictors of one or b oth traits. Regressing Y and Y 0 against these columns of X and X 0 resp ectiv ely pro duces estimates, b 1 and b 2 , of regression co efficien ts β 1 and β 2 , with v ariance-cov ariance matrices V 1 and V 2 resp ectiv ely . Since sample sizes are large, the com bined likelihoo d may b e closely appro ximated by a Gaussian likelihoo d for ( b 1 , b 2 ), assuming V 1 , V 2 are kno wn and that Cov( b 1 , b 2 ) = 0. Assuming equal LD in the tw o cohorts, i.e. that the correlation structure betw een the SNPs does not differ, Plagnol et al. [2009] sho w that the regression co efficients should be proportional and proposed testing for a shared causal v arian t by testing the null hypothesis H prop 0 : β 1 ∝ β 2 , i.e. β 1 = 1 η β 2 = β . The chi-squared statistic T ( η ) 2 = u T V − 1 u ∼ χ 2 (2) is derived from Fieller’s theorem [Fieller, 1954], where u = b 1 − 1 η b 2 and V = V 1 + 1 η 2 V 2 . If η w ere known, T ( η ) 2 w ould hav e a χ 2 distribution on q degrees of freedom. Plagnol et. al take a profile lik eliho o d approac h and replace η b y its maxim um likelihoo d estimate, ˆ η , which also minimises T ( η ) 2 . Asymptotic lik eliho o d theory suggests that T ( ˆ η ) 2 has a χ 2 distribution on q − 1 degrees of freedom. Alternativ ely , W allace et al. [2012] take a Ba yesian approach. They begin b y reparametrising the lik eliho o d in terms of θ = tan − 1 ( η ) and rewriting the null hypothesis as H prop 0 : β 1 = β cos( θ ); β 2 = β sin( θ ) . 5 This allo ws calculation of the p osterior distribution of θ , P ( θ | b 1 , b 2 ), assuming uninformative priors for θ and β . Inference is based on p osterior predictive p v alues Z T ∗ ( θ ) P ( θ | b 1 , b 2 ) d θ (3) where T ∗ ( θ ) is the p v alue asso ciated with T (tan( θ )). F ull mathematical details are giv en in the supplemen tary material of W allace et al. [2012], but it is worth revisiting here the justification of a flat prior for θ . If β 1 , β 2 w ere univ ariate with Gaussian priors and mean 0, then tan( θ ) = β 1 β 2 w ould ha ve a Cauch y (0 , k ) prior where k is the ratio of the prior v ariances of β 1 and β 2 . Thus it seems an appropriate form to consider for the prior for θ in the m ultiv ariate case. k is unknown, but W allace et al. [2012] found that v arying k had a negligible effect on the p osterior predictive p v alue for the sample sizes common in GW AS and eQTL studies (100s to 1000s of sub jects) and we ha v e set k = 1, implying a uniform prior for θ , for all analyses in this paper. P osterior predictive p v alues hav e a somewhat different in terpretation than and app ear conser- v ativ e in comparison to standard p v alues [Rubin, 1984; Meng, Sep., 1994]. Ho w ev er, they av oid assuming the log-likelihoo d for η is approximately quadratic near its maximum whic h is not alw a ys the case. In practice, W allace et al. [2012] found standard and posterior predictiv e p v alues to b e almost iden tical in large s amples. H prop 0 is not the same as H cond 0 as it do es not explicitly condition on the most asso ciated SNPs, but is a general prop ert y exp ected to b e true of an y pair of traits which share a common causal v arian t. While a shared causal v arian t should imply H prop 0 is true at an y pair of SNPs, and that H cond 0 is true if k = k 0 is the causal v ariant, the rev erse is not the case as it is possible that t wo traits ha v e distinct causal v ariants in complete LD. Th us, failure to reject the n ull h yp othesis indicates only that the data are consisten t with a shared causal v arian t. Note that colo calisation testing may be applied equally to case con trol data (using logistic regression), expression data (using linear regression) or to compare case con trol results against expression results for a sp ecific gene. Most commonly , this last approach migh t b e applied in turn to all genes with a known eQTL signal in the neigh b ourho o d of the disease asso ciation signal. Ho w ev er, it is assumed that cov( b 1 , b 2 ) = 1, meaning that case control studies ma y only be compared if they do not share a common con trol group. 6 Choice of SNPs for prop ortional colo calisation testing The choice of SNPs for colo calisation testing will b e shown in this pap er to hav e a considerable influence on the type 1 error rate of coloc alisation tests. F or the proportional approach, tw o strategies ha v e b een applied. Either colo calisation has b een tested using the pair of SNPs k and k 0 defined ab o v e [Plagnol et al., 2009] or a lasso approach, where SNPs are first selected in a lasso for one trait, and then additional SNPs are selected in a further lasso for the other trait [W allace et al., 2012]. How ever, as shown b y Miller [Miller, 1984], any v ariable selection metho d must induce bias in the estimated co efficien ts ( b 1 , b 2 ) if the estimation o ccurs in the same dataset as the selection. The aim of selecting the most informative subsets of SNPs for prop ortional colocalisation testing is to minimise the degrees of freedom of the test, and hence maximize p ow er. How ever, unless indep enden t data are av ailable for v ariable selection, this increase in p ow er comes at a cost to t yp e 1 error rate control as sho wn ab ov e. In this pap er, w e prop ose tw o metho ds for av oiding this problem. Summary of genetic v ariation b y principal comp onents If the region of in terest displa ys strong LD, a mo dest num b er of principal comp onents (PCs) are generally required to capture most of the SNP v ariation (Supplementary Figure 9) and w e can use a subset of the most informative comp onen ts for colocalisation analysis. Because PCs are b y definition uncorrelated, and b ecause the selection is not based on their relationship to the traits of interest, the estimated co efficien ts at any suc h subset are un biased. T o allo w PC analysis of tw o datasets, we first form a com bined genotype matrix, cen ter and scale eac h SNP , and then define the principal comp onents. Colo calisation testing is p erformed using the pro jection of the data onto the transformed basis for the most imp ortant comp onen ts. The optimal choice of threshold defining the “most imp ortan t” comp onents is not ob vious, and we explore that in our simulations. Ba y esian Mo del Av eraging Alternatively , we ma y combine the ideas of Bay esian mo del av er- aging (BMA) [Viallefon t et al., 2001] and posterior predictiv e p v alues, to treat the mo del describing the join t asso ciation itself as a n uisance parameter, and av erage the p v alues not just ov er the p os- terior for η , but also ov er the p osterior for all SNP selection mo dels. Analogous to equation (3), 7 p osterior predictiv e p v alues are therefore defined by ppp = X m ∈M p ∗ ( m ) P ( m ) (4) where M is the set of mo dels under consideration, p ∗ ( m ) is the colo calisation testing p or ppp v alue under the SNP mo del m , P ( m ) is the p osterior probabilit y of model m giv en the data and under the assumption that one of M is the true mo del. T o minimize the degrees of freedom of the test, w e explore all tw o SNP mo dels and, in the absence of any indep endent evidence to fav our one SNP ov er another, we assume the prior is ev enly spread ov er the set of mo dels. Approximating the p osterior probabilities by means of the Ba yesian Information Criterion appro ximation [Sch warz, 1978; Ho eting et al., 1999] and discarding highly improbable mo dels at the outset, this could b e done without excessiv e computational burden (see Supplementary Material for full details). Both the PC and BMA approac hes are av ailable in our R [R Developmen t Core T eam, 2010] pac k age, coloc, a v ailable from the Comprehensiv e R Arc hive Netw ork ( http://cran.r- project. org/web/packages/coloc ). Sim ulation W e used sim ulation to demonstrate the effects of v ariable selection on the p o w er and t yp e 1 error rate for colo calisation testing. F ull details are giv en in supplementary material. Briefly , w e sampled, with replacement, haplotypes of SNPs with a minor allele frequency of at least 5% found in phased 1000 Genomes Pro ject data [Consortium et al., 2012] across all 49 genomic regions outside the ma jor histocompatibility complex (MHC) which hav e b een iden tified as t yp e 1 diab etes (T1D) susceptibilit y lo ci to date, as summarized in T1DBase [Burren et al., 2011]. These represen t a range of region sizes and genomic top ography t ypical of GW AS hits. W e excluded the MHC region which is known to hav e high v ariation, strong LD and exhibits huge genetic influence on autoimm une disease risk inv olving m ultiple lo ci and hence requires individual treatmen t in an y GW AS [Nejen tsev et al., 2007]. Using a single “causal v arian t” SNP chosen at random, we sampled case and control haplot yp es according a multiplicativ e disease susceptibility mo del with relative risks of ranging from 1.1 to 1.3 to represen t GW AS data. T o simulate a quan titative trait, and to extend our exploration to t wo 8 causal v ariants in each trait, we selected one or tw o “causal v ariants” at random, and sim ulated a Gaussian distributed quantitativ e trait for which each causal v ariant SNP explains a sp ecified prop ortion of the v ariance. T o reflect our exp ectation that this test will b e applied in cases in whic h some nominal asso ciation to a region has already b een established, we discarded datasets in whic h all single SNP asso ciation p > 10 − 4 . W e either used all SNPs or the subset of SNPs whic h app ear on the Illumina HumanOmniExpress genot yping array to conduct colocalisation testing to reflect the scenarios of v ery dense targeted genot yping versus a less dense GW AS chip. All analyses w ere conducted in R [R Dev elopme n t Core T eam, 2010] using the coloc pack age for prop ortional colo calisation testing. Colo calisation testing for autoimm une th yroid disease An asso ciation study of the autoimmune thyroid diseases GD and HT has recen tly b een completed using the Imm unochip for genot yping, which provides dense cov erage of regions of the genome previously asso ciated with autoimm une disease [Co op er et al., 2012]. The pap er presented a total of 2285 Grav es’ disease cases, 462 Hashimoto’s disease cases and 9364 con trols. W e split the controls randomly in to t wo groups of size 4682, and analysed eac h of the 13 regions rep orted to b e associated with one or b oth diseases [Co op er et al., 2012]. Missing data were rare, but regression mo dels require complete genot yping data. W e therefore imputed missing genotypes b y means of multiple regression, as implemented in the R pac k age snpStats [Cla yton and Leung, 2007]. W e conducted prop ortional colocalisation analysis using the the tw o alternativ e methods set out ab ov e . F or the PCs approac h, w e used comp onents that captured at least 90% of the observed genetic v ariation. F or the BMA approach, we av eraged either o v er the universe of all p ossible t w o SNP mo dels or that of all three SNP mo dels. Results Naiv e application of colo calisation tests leads to biased inference The c hoice of SNPs to use for testing can induce bias for t wo reasons. First, selecting the “most asso ciated” SNP on the basis that the evidence for its asso ciation is strongest amongst all SNPs tested does not guaran tee either that it is the causal SNP or ev en the b est pro xy . Random v ariation 9 and LD mean that evidence for asso ciation may p eak at an alternativ e SNP ev en when the causal SNP is included in the genot yping panel, a bias whic h is more pronounced for w eak er effects and smaller sample sizes (Supplementary Figure 6). Second, although it is w ell kno wn that regression co efficien ts are unbiased estimates of p opulation effects, this prop erty do es not hold after v ariable selection [Miller, 1984], an effect which has b een referred to as “Winner’s curse” in genetics [Gring et al., 2001; Lohm ueller et al., 2003]. Cho osing SNPs on the basis of their significance or some other measure of strength of asso ciation induces a bias a w a y from the n ull - i.e. co efficien ts of selected SNPs are exp ected to ov erestimate the true effect - and again the effect is more pronounced for smaller sample sizes and weak er effects (Supplementary Figure 7). These tw o biases mean that, in conditional testing, there is lik ely to be some residual asso ciation b etw een the phenotype Y and the remaining genetic mark ers after conditioning on the selected SNP k 0 b ecause (1) the conditioning SNP k 0 ma y not capture all the true association and (2) the estimated effect at the tested SNP k tends to b e an o v erestimate. The result is v ery p o or control of the t yp e 1 error rate (Figure 1, track C1). Conditioning on the common causal v arian t rather than the most associated SNP (whic h is only possible in simulation studies) reduces the bias b y remo ving the SNP selection problem, but do es not eliminate it due to the o v erestimation of effect size (Figure 1, track C2). As seen in Supplemen tary Figure 8, Nica’s score tends to wards to 1 for traits that share a causal v arian t and is uniformly distributed on [0 , 1] for distinct unlink ed causal v arian ts. Its distribution is increasingly sk ew ed to w ards 1 as the LD b etw een distinct causal v ariants increases. This mak es sense if one considers that the case of t w o distinct v ariants in some LD lies part wa y b et w een the extreme cases of distinct link ed causal v ariants and a single common causal v ariant, whic h is equiv alen t to distinct causal v ariants in complete LD. The effect of using the most asso ciated SNPs for testing compared with using the true causal SNPs is to reduce the skew to wards higher rank scores as the r 2 b et w een v arian ts increases. Thus, Nica et. al ’s extension [Nica et al., 2010] is useful if searc hing for most lik ely colo calisation signals within a set, but as it a v oids formally testing a n ull h yp othesis, and b ecause the scale against whic h to in terpret the rank score is lik ely v aries according to effect size, it do es not provide a means to assess evidence for or against colo calisation at a giv en lo cus of in terest. W e sho w here that neither published metho d of SNP selection in prop ortional testing maintains con trol of the type 1 error rate (Figure 1, tracks P1, P2 and P3), although the bias is less extreme 10 than for conditional testing. The t w o-step lasso selection defined ab ov e do es reduce bias compared to indep endent lasso selection in the t w o datasets, but, p erhaps counter-in tuitively , leads to greater bias than simply testing the pair of most asso ciated SNPs ( k , k 0 ) when only tagging genot yp es are a v ailable and effect sizes are large (relative risk ∼ 1.3). This is b ecause, in this situation, lasso ma y select SNPs whic h are apparently weakly asso ciated (either truly or through random noise) at whic h, as demonstrated in Supplementary Figure 7, effect estimates are more strongly biased. Prop er control of type 1 error rates Principal comp onen ts When using principal comp onen ts to summarize the genetic v ariation in a region, it is not ob vious how man y comp onents are required. As more comp onents are selected, more information ab out the genetic v ariation in a region is captured, and hence we are more lik ely to accurately capture the signal of any causal v ariants. How ev er, successive comp onents add decreasing amounts of information whilst still adding another degree of freedom. A t some p oint the negative effect of increasing degrees of freedom will outw eigh the p ositive effect of increasing information, and we w ere concerned that the optimal test may dep end heavily on the threshold used to determine the n umber of comp onen ts selected. Instead, pow er seemed broadly acceptable once comp onen ts capturing 70-90% of v ariation were selected (Supplementary Figure 10). In our 49 test regions, 70% of the v ariance could b e captured by selecting an a v erage of 7 (range 2-18) or 9 (range 3-44) comp onen ts under a tagging or complete genotyping approac h. W e found t yp e 1 error rates were controlled across the range of thresholds explored, but show for illustrativ e purp oses the results when we fixed the threshold at ≥ 90% of genetic v ariation (Figure 1). W e examined p ow er to detect departure from colo calisation using simulations in which the causal v ariants are distinct for tw o traits but placed no restrictions on the LD b etw een these v arian ts. W e first examine the theoretical maximum p ow er of the test by testing the tw o causal v arian ts themselv es, which are known in a simulation study but not in real data (Figure 2). As migh t b e exp ected, p ow er increases with sample size and effect size, but is negatively correlated with the r 2 b et w een the causal v ariants, and is maximum when the t w o are completely unlink ed ( r 2 = 0). When using PCs, the p ow er is reduced reflecting the loss of information in not knowing these causal v ariants, but the loss is greatest for complete genotyping scenarios, suggesting that we ma y b e selecting to o many comp onen ts in the case of complete genotyping and emphasizing the 11 difficult y in choosing one optimal threshold for all studies and regions. Ba y esian Mo del a v eraging Because of its computational burden for simulations, w e only con- sider the BMA approach under a tagging genotyping scenario. This demonstrates go o d con trol of the type 1 error, even tending to b e mildly conserv ative, as has previously b een rep orted when p os- terior predictive p v alues are in terpreted similarly to standard p v alues [Meng, Sep., 1994]. Despite the slightly more conserv ative t yp e 1 error rates, the BMA approac h app ears more pow erful than the PCs approach (Figure 2), whic h presumably reflects the greater degrees of freedom required for the PCs approac h. Sensitivit y to the assumption of equal link age disequilibrium The prop ortional colocalisation test assumes identical patterns of LD in the t wo datasets so that the effect of a shared causal v arian t is proportional across an y set of SNPs. T o explore its sensitivit y to this assumption, we considered sampling haplotypes for one dataset from a subset of Europ ean p opulations, and for the other dataset from a either a mixture of European populations or a mixture of Europ ean and African p opulations. As might be exp ected, for strongly admixed datasets, the con trol of t yp e 1 error rate is lost, with type 1 error rates up to 8 fold that seen under the case of no mixing (Figure 3). How ever, it is perhaps surprising that the effect of mixing b etw een t wo Europ ean p opulations, or mixing very small prop ortion of African haplot yp es ( ∼ 5%) into a mainly European p opulation, is barely detectable at the sample sizes of 1,000 used, and indicates that the metho d is not v ery sensitive to small departures from the assumption of equal link age disequilibrium. Of course, as with any genetic analysis, it remains sensible not to rely on this property , but to formally examine the evidence for p opulation structure and exclude ob viously outlying samples. The case of multiple causal v arian ts So far, w e ha v e only considered the case of a single causal v ariant for eac h trait. But the pro- p ortional test mak es no assumption ab out the num b er of causal v ariants, only that their effects are prop ortional. Figure 4 shows that in the case of eQTL data with t wo shared causal v ariants, ha ving equal effects on each trait, type 1 error rates are still controlled. It has been rep orted that genes ma y exhibit a common cross-tissue eQTL, located proximal to the gene, as w ell as distinct 12 tissue sp ecific eQTLs in more distal lo cations [Brown et al., 2012]. W e were therefore interested to explore the case where our t wo traits share one causal v ariant, but one or b oth are also under the influence of additional, distinct v arian ts. T esting a single hypothesis of colo calising versus not colo calising v arian ts cannot capture the complexity of this situation, but it is instructive to ex- plore the test’s exp ected b ehaviour in order to allo w prop er interpretation with real data where the num b er, and sharing configuration of causal v ariants is unkno wn. Figure 4 sho ws that, under a tagging genot yping scenario, the prop ortional test tends to reject the null of colo calisation in the case of any distinct causal v ariants, ev en in the presence of an additional shared v ariant, although with sligh tly less p ow er than when there is no shared v ariant. V arying the num b er of SNPs in Bay esian Mo del Averaging mo dels So far, also, we ha v e assumed that it was enough to consider only the universe of tw o SNP mo dels when applying our BMA approac h. The motiv ation for this was that a t w o SNP mo del leads to a one degree of freedom test, and might therefore b e exp ected to maximise pow er. W e examined the effect of av eraging ov er either all tw o SNP or all three SNP mo dels in the con text of the ab ov e m ultiple causal v ariant simulations. This sho ws that t yp e one error rates are similar, that p ow er is similar for tw o SNP mo dels, but that p ow er can b e increased b y av eraging ov er three SNP mo dels compared to tw o SNP mo dels, particularly when there are really three or more distinct causal v arian ts (Figure 4) Application to colo calisation testing of Autoimm une Th yroid Diseases Existing evidence suggests that a single lo cus ma y contain v ariants whic h predisp ose to any one of m ultiple diseases, e.g. the non-synon ymous C1858T SNP in PTPN22 is asso ciated with rheumatoid arthritis and T1D [Stahl et al., 2010; Barrett et al., 2009], or distinct v arian ts which predisp ose to differen t diseases, e.g. distinct v ariants in IL2RA are asso ciated with T1D and multiple sclerosis [Maier et al., 2009; Martin et al., 2012]. W e used the prop ortional colo calisation approac h outlined ab o v e to examine the disease signals for the autoimm une thyroid diseases HT and GD from a recen t dense genot yping study [Co op er et al., 2012]. W e first examined the sev en regions where a significan t single SNP effect has b een identified in b oth diseases, i.e. at study-wide significan t lev els for GD ( p < 1 . 1 × 10 − 6 , a p ermutation derived 13 threshold sp ecific to this study) and at a nominal significance threshold of p < 0 . 05 for HT. Six of these display no evidence against colo calisation (all p osterior predictive p > 0 . 01), the exception b eing 2q33.2/ CTLA4 / ICOS in whic h the ppp v alue for the BMA approaches is 6 × 10 − 3 (t w o SNP mo dels) or 8 × 10 − 5 (three SNP models). In this region, the profile of the single SNP p v alues do differ (Supplementary Figure 11), but it w ould require larger sample sizes to confidently conclude that the t w o diseases ha ve different causal v ariants in this region given the num b er of tests completed. The co efficient of prop ortionalit y , η , can b e usefully interpreted when analysing tw o diseases. Tw o v alues of particular interest are η = 0 whic h would indicate no effect in HT given an effect in GD and η = 1 whic h indicates equal effects in each disease. In most of the seven regions, the credible interv al for η includes 1 (Figure 5), the exceptions b eing 2q33.2 and 10p15.1, where it ends just b elo w 1 using a PCs approac h, and 3q27.3/3q28/ LPP where it starts just ab o v e 1 on either BMA approac h. T urning to the the six regions where there is evidence of association in only GD, w e do not exp ect to see any departure from the null of colo calisation, without evidence of asso ciation to b oth traits, and indeed all p osterior predictive p > 0 . 01. How ever, our estimate of η helps infer whether this reflects a lac k of pow er or gen uine absence of association for HT. W e ev aluated the credible in terv als for η in eac h region and across four of the six regions, the credible in terv al for η includes 0, whilst in only one do es the credible interv al include 1 for all approaches. In one 14q31.1/ TSHR , the credible in terv al ends just b elow 0 for the BMA approac hes, whilst for 6q27/ CCR6 , it starts just ab ov e 0 and includes 1 for all metho ds. TSHR represen ts the primary autoantigen in h yp erthyroidism of GD [Brand and Gough, 2010], so is unlik ely to b e in v olv ed in HT. Discussion There are t wo sources to the bias in colocalisation testing presen ted abov e. The problem of v ariable selection is w ell studied in statistics generally [Miller, 1984] but has perhaps b een neglected in statistical genetics, where the aim has b een to detect con vincing asso ciation to a region, rather than pinp oint the causal v ariant, particularly as most datasets to date ha v e included an incomplete selection of v arian ts in an y region. Selecting SNPs whic h do not fully capture the trait asso ciation 14 will affect conditional colo calisation testing b ecause some residual asso ciation m ust remain after conditioning. On the other hand, it should not bias prop ortional testing as the aim there is to test for proportionality of effect size rather than evidence of residual effect. This ma y explain the substan tially higher error rates for naive conditional testing versus naiv e prop ortional testing seen in Figure 1. The bias in effect size estimates affects both metho ds, ho w ev er. In genetics, we are familiar with “Winner’s curse”, whic h causes effect estimates which are examined conditional on the asso ciated p v alue b eing b elow some significance threshold to b e biased a w ay from the null. Some attempts to correct this effect size bias hav e b een made, either by modelling a selection pro cedure defined as a single SNP exceeding a predetermined level of significance [Zollner and Pritchard, 2007], or b y b o otstrapping which can in theory account for the full selection strategy [Sun et al., 2011]. W e explored b oth approac hes, but found neither led to un biased or ev en nearly unbiased inference (data not sho wn). F or Zollner and Pritchard [2007], this failure is presumably do wn to the discrepancy b et w een correcting for a p v alue that exceeds some threshold and selecting SNPs with the minim um p v alues. In the case of Sun et al. [2011], it is p ossible that single lo ci do not contain sufficient information for a b o otstrap based correction; the corrected estimates tended to b e biased in the opp osite direction, suggesting the metho d w as o v er-correcting. Our prop osed solution is to use prop ortional testing and either av oid v ariable selection altogether b y using the PCs whic h capture the ma jority of genetic v ariation in the region under test, or in tegrate o v er the v ariable selection using BMA. Either metho d maintains type 1 error, and the BMA approach app ears more pow erful than the PC approac h, although b oth hav e reduced p ow er compared to the hypothetical scenario of b eing able to test the causal v arian ts themselv es. Recall from equation (4) that the ppp dep ends on b oth the p osterior probabilities of individual SNP mo dels and the degree of departure from the n ull under eac h mo del, p ∗ ( m ). If the posterior probability w as spread broadly ov er the mo del space and p ∗ ( m ) v aried considerably across mo dels, the distribution of ppp would b e far from uniform, with to o few observ ations in the tails. The fact that we observe only mildly conserv ative type 1 errors, even in the w eakest asso ciations considered here (case control sample sizes of 2000, and relativ e risks of 1.1), probably reflects our requirement in simulating our datasets that some nominal level of asso ciation m ust b e observ ed for at least one SNP in a region. This means that, for our simulated data, the p osterior probabilities tend to b e mainly fo cused on a 15 small subset of mo dels, and these mo dels tend to con tain sets of SNPs related by LD so that p ∗ ( m ) do es not v ary substan tially across the set of mo dels on whic h most of the p osterior probabilit y is concen trated. Whether caution is needed in applying this approach in smaller datasets dep ends somewhat on a researc her’s view. Certainly , it is unlikely that the ppp distribution w ould b e uniform if small samples with weak associations were used, and therefore p ow er to detect departure from colo calisation would b e reduced. Ho w ev er, the alternative to colo calisation b eing tested is not just that of no colo calisation, but implicitly that of distinct causal v arian ts in t w o traits. If there is w eak or only limited evidence for asso ciation with either trait, then it do es seem appropriate that one cannot reject a null of colo calising causal v ariants in fav our of an alternative distinct causal v arian ts. On the other hand, if evidence for association has b een indep endently established, a researc her may b e sure that there are causal v ariants for each trait although there is only w eak evidence in the curren tly av ailable datasets, in which case they may wish to explore calibrating the ppp distribution, for example b y means of simulation [Hjort et al., 2006], so that its null distribution is uniform b et w een [0 , 1]. Regions are typically defined after GW AS studies according to genetic distance in order to describ e the physical region within which a causal v ariant tagged b y the asso ciation is exp ected to lie. T1DBase uses a definition of 0.1cM surrounding any single SNP with p × 10 − 8 and we used a 0.1cM window around the most asso ciated SNP in our AITD analysis. If regions were defined more broadly , one migh t exp ect the BMA method to b e relativ ely unaffected, as SNPs b eyond the boundary of the curren t regions w ould not show m uc h evidence for association. On the other hand, we exp ect the p ow er of the PC approac h w ould decrease, as the num b er of comp onents, and therefore the degrees of freedom of the test, w ould increase without any comp ensatory increase in information. W e hav e prop osed alternative approac hes to colo calisation testing, but ho w should a researc her c ho ose which approach and the parameters specific to that approac h? Our view is that we would use PCs as a first pass if man y lo ci are under consideration, to prioritise regions for more detailed analysis. The optimal n umber of comp onents is unknown, but a n um b er that captures something in the region of 70–90% of genetic v ariation seems acceptable. Ho w ev er, if evidence for asso ciation is strong in b oth datasets, BMA is a more p ow erful approach and there seems little reason b ey ond computational exp ense to prefer av eraging ov er the universe of t w o SNP mo dels to that of three 16 SNP mo dels. Ho w ever, in large regions, a relatively mo dest n um b er of SNPs can cause the n um ber of three SNP mo dels to b e infeasible. F or example, 100 SNPs can generate 4,950 t w o SNP mo dels but 161,700 three SNP mo dels. W e w ould not suggest exploring four SNP mo dels b ecause that seems likely to spread the p osterior probabilities very thinly , and we ha ven’t explored com bining t w o and three SNP mo dels because it is unclear what prior w eigh t should b e giv en to a t w o SNP compared to a three SNP mo del. As an example application of our prop osed approac hes, w e analysed 13 lo ci asso ciated with the autoimm une thyroid diseases GD and HT. Reassuringly , inference was broadly similar regardless of metho d, and w e and sho w ed that in the sev en regions where a locus has b een asso ciated with the t w o diseases, the data are generally consisten t with common causal v arian ts exerting an equal effect on each disease. In regions previously significantly asso ciated with only GD, p osterior predictive p v alues are unlik ely to detect an y departure from colo calisation for reasons described abov e, but here the Bay esian approach does allow us to use make some inference using the p osterior distribution of η . Given the relativ ely smaller n umber of HT cases (462) compared to GD (2285), it migh t b e exp ected that many of the lo ci only asso ciated with GD ha v e failed to b e reach significance for HT due to lack of p o w er. Estimates of p o w er to detect asso ciation with HT under the assumption of equal effects in GD and HT are broadly similar across the seven regions asso ciated with b oth diseases and the six regions asso ciated with GD only (Supplemen tary T able I), but these are likely to b e ov er optimistic due to the exp ected bias in the GD effect size estimates. Ho w ev er, for five of these six regions, the evidence suggests that failure to detect asso ciation with HT is more likely to b e due to a discrepancy in effect size, with the effect considerably larger in, and p ossibly sp ecific to GD, compared to HT, rather than a lac k of p o w er. How ever, while the data suggest that LPP ma y ha v e a stronger effect on GD compared to HT, and that CCR6 may b e an undetected HT lo cus, the small sample size for HT prev en ts us from dra wing this conclusion with any confidence. There is a pressing need for more widespread use of formal colocalisation testing. Researc hers are turning to eQTL data to interpret GW AS results by simply considering whether an eQTL SNP is asso ciated with any disease [Nicolae et al., 2010], visually [T rynk a et al., 2011], by conditional testing [Nica et al., 2010], b y naive application of a prop ortional colo calisation test [Plagnol et al., 2009; W allace et al., 2012] or by attempting to integrate disease and gene expression asso ciation signals in netw orks [Hao et al., 2012]. Where colo calisation tests ha v e b een naively applied, w e 17 exp ect the n ull hypothesis of colo calisation has b een rejected to o readily , although this will affect lo ci with small and mo derate eff ects to a greater degree than those with large effects. Th us, for our earlier analysis of colo calisation b et w een T1D and mono cyte gene expression signals [W allace et al., 2012], the list of lo ci compatible with colo calisation are likely correct, but some lo ci w ere probably erroneously rejected, and re-analysis of these data will b e required. In the case of netw ork analysis, results can b e difficult to reconcile with simple representations of the data. F or example, in tegration of lung expression and asthma genetic association data led to the iden tification of GSDMA as the most likely causal gene for asthma in the 17q21 region [Hao et al., 2012], despite a graphical representation of the data showing that the SNPs most strongly asso ciated with GSDMA expression were relativ ely w eakly asso ciated with asthma, and, vic e versa , that the SNPs most strongly asso ciated with asthma show ed relatively weak er levels of asso ciation with GSDMA expression compared to the strongest signals. The asthma asso ciation on the 17q21 region was one of the first cases of explicitly using expression data to interpret disease asso ciation, with the asso ciation with asthma initially attributed to ORMDL3 based on expression data from EBV transformed cell lines [Moffatt et al., 2007] and subsequently to GSDMB from a reanalysis of the same data [Moffatt et al., 2010]. Candidate gene h ypotheses hav e b een constructed for all three genes. The lung expression data ha v e greater potential for rev ealing the underlying gene, but, to hold confidence in results of analyses, particularly when the results con trast with simple visual insp ection of the data, requires careful examination of the properties of the statistical method used. Giv en the tissue-sp ecific nature of man y eQTLs iden tified to date [Dimas et al., 2009; F airfax et al., 2012], there is a need for more large, publicly av ailable eQTL datasets in a v ariety of disease relev ant tissues and purified cell subsets to supp ort the interpretation of existing GW AS data. Although expression data is t ypically shared after the publication of an eQTL study , we note that the genetic data m ust also b e m ade av ailable to allo w full integration of eQTL and disease signals at shared lo ci. The increasing abundance of substantial GW AS datasets and the increasing av ailability of large eQTL datasets [F airfax et al., 2012; F u et al., 2012; Hao et al., 2012], together with our reassurance that it is p ossible to conduct these te sts whilst maintaining t yp e 1 error rates and the av ailability of softw are in our R pack age will facilitate more widespread formal colo calisation testing. Integration of genetic asso ciation data has the potential to refine understanding of underlying genetic mechanisms and aid in the design of follo w-up studies already 18 underw a y . Ac kno wledgemen ts W e thank Matthew Simmonds, Stephen Gough, Ja yne F ranklyn, Oliver Brand, for sharing their AITD genetic association dataset and all AITD patients and con trol sub jects for participating in this study . The AITD UK national collection was funded b y the W ellcome T rust. Phased 1000 Genomes data was do wnloaded from h ttp://www.sph.umich.edu/csg/abecasis/MACH/do wnload/1 000G . 2012- 03-14.h tml W e w ould lik e to thank the UK Medical Researc h Council and W ellcome T rust for fund- ing the collection of DNA for the British 1958 Birth Cohort (MRC grant G0000934, WT grant 068545/Z/02). W e ackno wledge use of data from The UK Blo o d Services collection of Common Con trols (UKBS collection), funded b y the W ellcome T rust grant 076113/C/04/Z, b y the W ellcome T rust/JDRF gran t 061858, and b y the National Institute of Health Researc h of England. The DNA collection w as established as part of the W ellcome T rust Case-Control Consortium. F or additional detailed ac knowledgemen ts of the source assa y design, genot yping, data and samples, please see Co op er et al (2012). CW is funded b y the W ellcome T rust (089989). The Diab etes and Inflammation Lab oratory is funded b y the JDRF, the W ellcome T rust and the National Institute for Health Research (NIHR) Cam bridge Biomedical Research Cen tre. The Cambridge Institute for Medical Research (CIMR) is in receipt of a W ellcome T rust Strategic Aw ard (100140). Conflict of In terest The authors ha v e no conflict of interest to declare. References Barrett JC, Cla yton DG, Concannon P , Ak olk ar B, Co op er JD, Erlich HA, Julier C, Morahan G, Nerup J, Nierras C, Plagnol V, P o ciot F, Sc huilen burg H, Sm yth DJ, Stev ens H, T o dd JA, W alker 19 NM, Rich SS, Consortium TTDG. 2009. Genome-wide asso ciation study and meta-analysis find that o v er 40 lo ci affect risk of type 1 diab etes. Nat Genet 41:703–707. Brand OJ, Gough SCL. 2010. Genetics of th yroid autoimm unit y and the role of the tshr. Mol Cell Endo crinol 322:135–143. Bro wn CD, Mangravite LM, Engelhardt BE. 2012. In tegrativ e mo deling of eQTLs and cis- regulatory elemen ts suggest mec hanisms underlying cell t yp e specificity of eQTLs. arXiv12103294 . Burren OS, Adlem EC, Ac h uthan P , Christensen M, Coulson RMR, T o dd JA. 2011. T1dbase: up date 2011, organization and presentation of large-scale data sets for type 1 diab etes research. Nucleic Acids Res 39:D997–1001. Cla yton D, Leung HT. 2007. An R pack age for analysis of whole-genome asso ciation studies. Hum Hered 64:45–51. Consortium GP , Ab ecasis GR, Auton A, Bro oks LD, DePristo MA, Durbin RM, Handsaker RE, Kang HM, Marth GT, McV ean GA. 2012. An integrated map of genetic v ariation from 1,092 h uman genomes. Nature 491:56–65. Co op er JD, Simmonds MJ, W alker NM, Burren O, Brand OJ, Guo H, W allace C, Stevens H, Cole- man G, Consortium WTCC, F ranklyn JA, T o dd JA, Gough SCL. 2012. Seven newly identified lo ci for autoimm une thyroid disease. Hum Mol Genet 21:5202–5208. Cotsapas C, V oight BF, Rossin E, Lage K, Neale BM, W allace C, Ab ecasis GR, Barrett JC, Behrens T, Cho J, Jager PLD, Elder JT, Graham RR, Gregersen P , Klareskog L, Siminovitc h KA, v an Heel D A, Wijmenga C, W orthington J, T o dd JA, Hafler DA, Rich SS, Daly MJ, of Consortia F OCN. 2011. P erv asive sharing of genetic effects in autoimm une disease. PLoS Genet 7:e1002254. Dimas AS, Deutsc h S, Stranger BE, Montgomery SB, Borel C, Attar-Cohen H, Ingle C, Beazley C, Arcelus MG, Sek owsk a M, Gagnebin M, Nisbett J, Delouk as P , Dermitzakis ET, An tonarakis SE. 2009. Common regulatory v ariation impacts gene expression in a cell type-dep endent manner. Science 325:1246–1250. 20 Dub ois PCA, T rynk a G, F ranke L, Hun t KA, Romanos J, Curtotti A, Zhernak ov a A, Heap GAR, Adn y R, Aromaa A, Bardella MT, v an den Berg LH, Bock ett NA, de la Concha EG, Dema B, F ehrmann RSN, F ernndez-Arquero M, Fiatal S, Grandone E, Green PM, Gro en HJM, Gwilliam R, Hou wen RHJ, Hun t SE, Kaukinen K, Kelleher D, Korp ona y-Szab o I, Kurppa K, MacMath una P , Mki M, Mazzilli MC, McCann OT, Mearin ML, Mein CA, Mirza MM, Mistry V, Mora B, Morley KI, Mulder CJ, Murray JA, Nez C, Oosterom E, Ophoff RA, Polanco I, P eltonen L, Platteel M, Rybak A, Salomaa V, Sc h w eizer JJ, Sp erandeo MP , T ack GJ, T urner G, V eldink JH, V erb eek WHM, W eersma RK, W olters VM, Urcelay E, Cukro wsk a B, Greco L, Neuhausen SL, McManus R, Barisani D, Delouk as P , Barrett JC, Saav alainen P , Wijmenga C, v an Heel D A. 2010. Multiple common v ariants for celiac disease influencing immune gene expression. Nat Genet 42:295–302. F airfax BP , Makino S, Radhakrishnan J, Plan t K, Leslie S, Dilthey A, Ellis P , Langford C, V annberg F O, Knigh t JC. 2012. Genetics of gene expression in primary immune cells iden tifies cell type- sp ecific master regulators and roles of hla alleles. Nat Genet 44:502–510. Fieller EC. 1954. Some problems in interv al estimation. Journal of the Ro y al Statistical So ciety Series B Metho dological 16:175–185. F u J, W olfs MGM, Deelen P , W estra HJ, F ehrmann RSN, Meerman GJT, Buurman W A, Rensen SSM, Gro en HJM, W eersma RK, v an den Berg LH, V eldink J, Ophoff RA, Snieder H, v an Heel D, Jansen RC, Hofk er MH, Wijmenga C, F ranke L. 2012. Unrav eling the regulatory mechanisms underlying tissue-dep enden t genetic v ariation of gene expression. PLoS Genet 8:e1002431. Gring HH, T erwilliger JD, Blangero J. 2001. Large upw ard bias in estimation of lo cus-sp ecific effects from genomewide scans. Am J Hum Genet 69:1357–1369. Hao K, Boss Y, Nickle DC, Par PD, Postma DS, Laviolette M, Sandford A, Hac k ett TL, Daley D, Hogg JC, Elliott WM, Couture C, Lamontagne M, Brandsma CA, v an den Berge M, Kopp elman G, Reicin AS, Nicholson D W, Malk o v V, Derry JM, Suver C, Tsou JA, Kulk arni A, Zhang C, V essey R, Opitec k GJ, Curtis SP , Timens W, Sin DD. 2012. Lung eqtls to help reveal the molecular underpinnings of asthma. PLoS Genet 8:e1003029. 21 Hjort NL, Dahl F A, Steinbakk GH. 2006. Post-processing p osterior predictive p v alues. Journal of the American Statistical Asso ciation 101:pp. 1157–1174. Ho eting JA, Madigan D, Raftery AE, V olinsky CT. 1999. Bay esian mo del a v eraging: A tutorial. Statistical Science 14:382417. Li S, Zhao JH, Luan J, Langen b erg C, Lub en RN, Khaw KT, W areham NJ, Loos RJF. 2011. Genetic predisp osition to ob esit y leads to increased risk of type 2 diab etes. Diabetologia 54:776–782. Lohm ueller KE, P earce CL, Pike M, Lander ES, Hirschhorn JN. 2003. Meta-analysis of genetic asso ciation studies supports a contribution of common v ariants to susceptibility to common disease. Nat Genet 33:177–182. Maier LM, Low e CE, Co op er J, Downes K, Anderson DE, Severson C, Clark PM, Healy B, W alker N, Aubin C, Oksenberg JR, Hauser SL, Compston A, Saw cer S, Consortium IMSG, Jager PLD, Wic k er LS, T o dd JA, Hafler DA. 2009. Il2ra genetic heterogeneity in m ultiple sclerosis and type 1 diab etes susceptibility and soluble interleukin-2 receptor pro duction. PLoS Genet 5:e1000322. Martin JE, Carmona FD, Bro en JCA, Simen CP , V onk MC, Carreira P , Ros-F ernndez R, Espinosa G, Vicente-Rabaneda E, T olosa C, Garca-Hernndez FJ, Castellv I, F onollosa V, Gonzlez-Ga y MA, Sez-Comet L, P ortales R G, de la P ea PG, F ernndez-Castro M, Daz B, Martnez-Estupin L, Coenen M, V oskuyl AE, Sch uerw egh AJ, V an th uyne M, Houssiau F, Smith V, de Keyser F, Langhe ED, Riemek asten G, Witte T, Hunzelmann N, Kreuter A, Palm , Chee MM, v an Laar JM, Denton C, Herric k A, W orthington J, Koeleman BPC, Radstake TRDJ, F onseca C, Martn J, Group SS. 2012. The autoimm une disease-asso ciated il2ra lo cus is inv olved in the clinical manifestations of systemic sclerosis. Genes Immun 13:191–196. Meng XL. Sep., 1994. Posterior predictive p-v alues. The Annals of Statistics 22:1142–1160. Miller AJ. 1984. Selection of subsets of regression v ariables. Journal of the Roy al Statistical So ciet y Series A General 147:pp. 389–425. Moffatt MF, Gut IG, Demenais F, Strachan DP , Bouzigon E, Heath S, v on Mutius E, F arrall M, Lathrop M, Co okson WOCM, Consortium GABRIEL. 2010. A large-scale, consortium-based genomewide asso ciation study of asthma. N Engl J Med 363:1211–1221. 22 Moffatt MF, Kab esc h M, Liang L, Dixon AL, Strac han D, Heath S, Depner M, v on Berg A, Bufe A, Rietsc hel E, Heinzmann A, Simma B, F rischer T, Willis-Owen SA G, W ong KCC, Illig T, V ogelb erg C, W eiland SK, von Mutius E, Ab ecasis GR, F arrall M, Gut IG, Lathrop GM, Co okson WOC. 2007. Genetic v arian ts regulating ormdl3 expression contribute to the risk of c hildho o d asthma. Nature 448:470–473. Nejen tsev S, Ho wson JMM, W alker NM, Szeszk o J, Field SF, Stevens HE, Reynolds P , Hardy M, King E, Masters J, Hulme J, Maier LM, Smyth D, Bailey R, Co op er JD, Ribas G, Campb ell RD, Cla yton DG, T o dd JA, Consortium WTCC. 2007. Localization of type 1 diab etes susceptibilit y to the mhc class i genes hla-b and hla-a. Nature 450:887–892. Nica AC, Montgomery SB, Dimas AS, Stranger BE, Beazley C, Barroso I, Dermitzakis ET. 2010. Candidate causal regulatory effects b y in tegration of expression qtls with complex trait genetic asso ciations. PLoS Genet 6:e1000895. Nicolae DL, Gamazon E, Zhang W, Duan S, Dolan ME, Co x NJ. 2010. T rait-asso ciated snps are more lik ely to b e eqtls: annotation to enhance discov ery from gwas. PLoS Genet 6:e1000888. Plagnol V, Sm yth DJ, T o dd JA, Cla yton DG. 2009. Statistical independence of the colocalized asso- ciation signals for type 1 diab etes and rps26 gene expression on chromosome 12q13. Biostatistics 10:327–334. R Developmen t Core T eam. 2010. R: A Language and Environmen t for Statistical Computing. R F oundation for Statistical Computing, Vienna, Austria. ISBN 3-900051-07-0. Rubin DB. 1984. Ba y esianly justifiable and relev ant frequency calculations for the applied statis- tician. Ann Statist 12:1151–1172. Sc h w arz G. 1978. Estimating the dimension of a mo del. Ann Statist 6:461–464. Stahl EA, Ra ychaudh uri S, Remmers EF, Xie G, Eyre S, Thomson BP , Li Y, Kurreeman F AS, Zher- nak o v a A, Hinks A, Guiducci C, Chen R, Alfredsson L, Amos CI, Ardlie K G, Consortium BIRAC, Barton A, Bow es J, Brou w er E, Burtt NP , Catanese JJ, Coblyn J, Co enen MJH, Costenbader KH, Criswell LA, Crusius JBA, Cui J, de Bakker PIW, Jager PLD, Ding B, Emery P , Flynn E, Harrison P , Hocking LJ, Huizinga TWJ, Kastner DL, Ke X, Lee A T, Liu X, Martin P , Morgan 23 A W, P adyuk o v L, Posth umus MD, Radstake TRDJ, Reid DM, Seielstad M, Seldin MF, Shadick NA, Steer S, T ak PP , Thomson W, v an der Helm-v an Mil AHM, v an der Horst-Bruinsma IE, v an der Schoot CE, v an Riel PLCM, W einblatt ME, Wilson AG, W olbink GJ, W ordsworth BP , Consortium YEAR, Wijmenga C, Karlson EW, T o es REM, de V ries N, Bego vic h AB, W orthing- ton J, Siminovitc h KA, Gregersen PK, Klaresk og L, Plenge RM. 2010. Genome-wide asso ciation study meta-analysis iden tifies seven new rheumatoid arthritis risk lo ci. Nat Genet 42:508–514. Sun L, Dimitromanolakis A, F ay e LL, Paterson AD, W aggott D, Group DCCTDICR, Bull SB. 2011. Br-squared: a practical solution to the winner’s curse in genome-wide scans. Hum Genet 129:545–552. T rynk a G, Hun t KA, Bock ett NA, Romanos J, Mistry V, Szperl A, Bakk er SF, Bardella MT, Bha w- Rosun L, Castillejo G, de la Concha EG, de Almeida R C, Dias KRM, v an Diemen CC, Dub ois PCA, Duerr RH, Edkins S, F ranke L, F ransen K, Gutierrez J, Heap GAR, Hrdlic k o v a B, Hun t S, Izurieta LP , Izzo V, Jo osten LAB, Langford C, Mazzilli MC, Mein CA, Midah V, Mitro vic M, Mora B, Morelli M, Nutland S, Nez C, Onengut-Gumuscu S, P earce K, Platteel M, Polanco I, P otter S, Ribes-Koninckx C, Ricao-P once I, Rich SS, Rybak A, San tiago JL, Senapati S, So o d A, Sza jewsk a H, T roncone R, V arad J, W allace C, W olters VM, Zhernako v a A, Spanish Consortium on the Genetics of Co eliac Disease (C. E. G. E. C), Prev en t C. D Study Group, W ellcome T rust Case Control Consortium (W. T. C. C. C), Thelma BK, Cukrowsk a B, Urcela y E, Bilbao JR, Mearin ML, Barisani D, Barrett JC, Plagnol V, Delouk as P , Wijmenga C, v an Heel DA. 2011. Dense genot yping iden tifies and lo calizes multiple common and rare v ariant asso ciation signals in celiac disease. Nat Ge net 43:1193–1201. Viallefon t V, Raftery AE, Richardson S. 2001. V ariable selection and bay esian mo del av eraging in case-con trol studies. Statistics in Medicine 20:3215–3230. W allace C, Rotiv al M, Co op er JD, Rice CM, Y ang JHM, McNeill M, Smyth DJ, Niblett D, Cambien F, Consortium C, Tiret L, T o dd JA, Clayton DG, Blank en b erg S. 2012. Statistical colo calization of mono cyte gene expression and genetic risk v ariants for t yp e 1 diab etes. Hum Mol Genet 21:2815–2824. 24 Zollner S, Pritc hard JK. 2007. Ov ercoming the winner’s curse: estimating p enetrance parameters from case-con trol data. Am J Hum Genet 80:605–615. 25 N=2000 N=5000 N=8000 ● ● ● ● ● ● ● ● ● ● ● ● ● ● ● ● ● ● ● ● ● ● ● ● ● ● ● ● ● ● ● ● ● ● ● ● ● ● ● ● ● ● ● ● ● ● ● ● ● ● ● ● ● ● ● ● ● ● ● ● ● ● ● ● ● ● ● ● ● ● ● ● ● ● ● ● ● ● ● ● ● 0.0 0.2 0.4 0.6 0.0 0.2 0.4 0.6 Complete T agging 1.1 1.2 1.3 1.1 1.2 1.3 1.1 1.2 1.3 Relativ e risk in case/control dataset T ype 1 error T est ● ● ● ● ● C1 C2 P1 P2 P3 P4 P5 Figure 1: Type 1 error rates in naive colo calisation testing. A nominal type 1 error rate of 5%, sho wn b y a dashed line, is consisten tly exceeded using conditional colocalisation testing conditioning on either the most asso ciated SNP for the other trait (C1) or the common causal SNP which is only p ossible in simulated complete genotyping data (C2). Prop ortional colo calisation testing tends to exhibit low er type 1 error rates, but the excess can still be substantial when using the most strongly asso ciated SNPs in each dataset (P1); the union of lasso v ariable selection in each dataset (P2) or a t wo stage lasso v ariable selection (P3) as previously describ ed [W allace et al., 2012]. In con trast , t yp e 1 error rates are well controlled for prop ortional testing using principle comp onents whic h capture 85% of the genetic v ariation (P4) or within a Bay esian Mo del Av eraging approac h to v ariable selection (P5), ev en app earing conserv ativ e for small effect sizes. Note that Bay esian Mo del Av eraging w as not examined in the complete genotyping scenario due to computational burden. The X axis sho ws the relativ e risk of disease (RR) with columns divided according to the n umber of cases and controls in a case-control dataset. T yp e 1 error rates w ere calculated by comparing t w o case-control datasets of equal sample and effect size, simulated to share a common causal v arian t. 26 N=2000 N=5000 N=8000 ● ● ● ● ● ● ● ● ● ● ● ● ● ● ● ● ● ● ● ● ● ● ● ● ● ● ● ● ● ● ● ● ● ● ● ● ● ● ● ● ● ● ● ● ● ● ● ● ● ● ● ● ● ● ● ● ● ● ● ● ● ● ● ● ● ● ● ● ● ● ● ● ● ● ● ● ● ● ● ● ● ● ● ● ● ● ● ● ● ● ● ● ● ● ● ● ● ● ● ● ● ● ● ● ● ● ● ● ● ● ● ● ● ● ● ● ● ● ● ● ● ● ● ● ● ● ● ● ● ● ● ● ● ● ● ● ● ● ● ● ● ● ● ● ● ● ● ● ● ● ● ● ● ● ● ● ● ● ● ● ● ● ● ● ● ● ● ● ● ● ● ● ● ● ● ● ● ● ● ● ● ● ● ● ● ● ● ● ● ● ● ● ● ● ● ● ● ● ● ● ● ● ● ● ● ● ● ● ● ● ● ● ● ● ● ● ● ● ● ● ● ● ● ● ● ● ● ● ● ● ● ● ● ● ● ● ● ● ● ● ● ● ● ● ● ● ● ● ● ● ● ● ● ● ● ● ● ● ● ● ● ● ● ● ● ● ● ● ● ● ● ● ● ● ● ● ● ● ● ● ● ● ● ● ● ● ● ● ● ● ● ● ● ● ● ● ● ● ● ● ● ● ● ● ● ● ● ● ● ● ● ● ● ● ● ● ● ● ● ● ● ● ● ● ● ● ● ● ● ● ● ● ● ● ● ● ● ● ● ● ● ● ● ● ● ● ● ● ● ● ● ● ● ● ● ● ● ● ● ● 0.00 0.25 0.50 0.75 1.00 0.00 0.25 0.50 0.75 1.00 0.00 0.25 0.50 0.75 1.00 RR=1.1 RR=1.2 RR=1.3 0.2 0.4 0.6 0.8 1.0 0.2 0.4 0.6 0.8 1.0 0.2 0.4 0.6 0.8 1.0 r 2 betw een causal SNPs P o w er/T ype 1 error data CC/CC CC/eQTL Anal ysis ● ● ● ● Max PCs (C) PCs (T) BMA (T) Figure 2: P o w er for prop ortional colo calisation analysis using PC or BMA approaches. The the- oretical maxim um pow er (Max) is calculated by prop ortional colo calisation testing using the t w o causal v ariants which are known in simulated data and show that the predominant determinan t of p ow er is the r 2 b et w een the v ariants, with p o w er decreasing as LD increases. When the causal v arian ts are not known, p ow er decreases under either a PC or BMA approach. The X axis sho ws the maximum r 2 b et w een the causal v ariants, i.e. r 2 has b een categorised into 5 groups: [0 , 0 . 2], (0 . 2 , 0 . 4], (0 . 4 , 0 . 6], (0 . 6 , 0 . 8], (0 . 8 , 1 . 0]. N is the n umber of cases and con trols in a case-control dataset with relativ e risk of disease RR. P o w er is shown for comparing tw o case-control studies with equal sample n um b ers and effect size s (solid lines) or for comparing a case-control study to an eQTL study of 1000 samples where the causal v ariant explains 30% of the v ariance of the ex- pression. The PC approac h was implemen ted by selecting the smallest subset of comp onents whic h captured 85% of the genetic v ariance. W e considered only tagging genotype scenarios to reduce computation time. 27 pi = 0.02 pi = 0.05 pi = 0.1 pi = 0.2 pi = 0.3 pi = 0.4 pi = 0.5 0 5 10 15 0 5 10 15 European/European European/African 0.00 0.05 0.10 0.15 0.20 0.00 0.05 0.10 0.15 0.20 0.00 0.05 0.10 0.15 0.20 0.00 0.05 0.10 0.15 0.20 0.00 0.05 0.10 0.15 0.20 0.00 0.05 0.10 0.15 0.20 0.00 0.05 0.10 0.15 0.20 Effect siz e Relative type 1 error r ate T est BMA PC Figure 3: Departure from assumption of equal LD structure. Each plot reflects sim ulations in whic h a single, common causal v ariant explains a fixed prop ortion of v ariance of tw o quan titative traits, sho wn on the x axis, each av ailable in a sample of 1,000 individuals. In the top ro w, all haplotypes in the first dataset and (1 − π ) of the haplotypes in the second dataset were sampled from the Europ ean CEU, GBR and FIN p opulations, and the remaining π in the second dataset from the alternate European TSI and IBS p opulations. In the b ottom ro w, we used the same strategy but sampling either from all Europ ean p opulations (CEU, GBR, FIN, TSI and IBS) or from a mixture of these Europ ean p opulations and the African ASW , L WK and YRI p opulations. The y axis sho ws the relative type 1 error rate - the ratio of the estimated rate for the given scenario and the estimated rate for the equiv alent scenario with no mixing. Because these are ratios, there is rather less certaint y than for other plots and 95% confidence interv als calculated by means of the delta metho d are sho wn for each p oint. Analysis was conducted b y prop ortional testing using either a PC approac h with n umber of principal components selected to capture 90% of genetic v ariation or a BMA approac h, av eraging o v er the space of either all possible t w o SNP models. W e considered only tagging genotype scenarios. CEU=Utah Residents (CEPH) with Northern and W estern Europ ean ancestry; GBR=British in England and Scotland; FIN=Finnish in Finland; TSI=T oscani in Italia; IBS=Ib erian population in Spain; ASW=Americans of African Ancestry in SW USA; L WK=Luh ya in W ebuy e, Keny a; YRI=Y oruba in Ibadan, Nige ra 28 ⬤ ⬤ - ⬤ ◒ - ◓ ⬤ - ◒ ◒ - ◒ - ◓ ◒ - ◒ - ◓ - ◓ 0.00 0.25 0.50 0.75 1.00 0.00 0.25 0.50 0.75 1.00 0.0 5 0. 10 0 .15 0.20 0.0 5 0.10 0.15 0.20 0.0 5 0. 10 0 .15 0.20 Total trait variation explained Power/Type 1 error Test BM A 2 S NP m ode ls BM A 3 S NP m odels P Cs Figure 4: Effect of more than tw o causal v ariants. Each plot reflects sim ulations in which causal v arian ts in total explain a fixed proportion of v ariance of t wo quan titative traits, shown on the x axis, each av ailable in a sample of 1,000 individuals. The total num b er of causal v arian ts is shown b y the num b er of circles ab ov e each plot, with full circles indicating a causal v ariant shared by b oth traits and half shaded a causal v ariant associated with one trait or the other. Analysis was conducted b y prop ortional testing using either a PC approac h with n umber of principal components selected to capture 90% of genetic v ariation or a BMA approach, av eraging ov er the space of either all p ossible t w o SNP or three SNP mo dels. W e considered only tagging genotype scenarios. 29 14q31.1/TSHR 12q12/PRICKLE1 1q23.1/FCRL3 1p36.32/TNFRSF1 16p11.2/ITGAM 6q27/CCR6 2q33.2/CTLA4/ICOS 10p15.1/IL2RA 11q21/−− 1p13.2/PTPN22 6q15/BA CH2 2p25.1/TRIB2 3q27.3/3q28/LPP 0.0 2.5 5.0 7.5 eta Chromosome region Coefficient of propor tionality 0 2 4 −log10 P values Colocalisation test 0 2 4 6 8 10 −log10 P values Disease association Colocalisation, BMA.2 Colocalisation, BMA.3 Colocalisation, PC Disease, Gra ves Disease , Hashimoto Figure 5: Colo calisation analysis of Gra ves’ and Hashimoto’s diseases. Regions are labelled b y c hro- mosome and likely candidate gene(s) and arranged so that the top sev en regions show ed marginally significan t association with b oth GD and HT ( p < 0 . 05) and the bottom six with just GD in the published single SNP analysis [Coop er et al., 2012]. The left panel shows the estimate of the co- efficien t of proportionality , η , for the estimate of the ratio of effect sizes in HT compared to GD, and its 95% credible in terv al, calculated using either the PCs approach (PC), or BMA av eraging o v er t w o SNP mo dels (BMA.2) or three SNP mo dels (BMA.3). The middle panel sho ws the the evidence against colocalisation using either the − log 10 ( p ) v alue (PCs) or the posterior predictive − log 10 ( p ) (BMA). The right panel summarizes the evidence for asso ciation of the region with eac h disease using − log 10 ( p ) v alues for the asso ciation analysis of Gra v es’ and Hashimoto’s using the selected principal comp onen ts for the PCs approac h. The − log 10 scale has b een truncated at 10 so that more extreme p v alues are display ed at − log 10 ( p ) = 10. F or the PC approach, testing was based on the smallest subset of comp onen ts that captured 90% of the genetic v ariance. 30 Supplemen tary Material Sim ulation Once a “causal v ariant” SNP , S , w as selected, control haplotypes were sampled randomly and case haplot yp es sampled conditional on the allele carried at S . F or a disease mo del with relative risk r , and giv en the minor (risk) allele at S has frequency π 0 , in con trols, the frequency in cases is π 1 = r π 0 1 − π 0 + r π 0 . Therefore when sampling case haplot yp es, w e o ver-sample haplotypes carrying the risk allele and under sample those carrying the protectiv e allele b y using sampling probabilities proportional to P S = π 1 π 0 haplot yp e carries risk allele 1 − π 1 1 − π 0 haplot yp e carries protective allele allele. F or eQTL data, w e simulated a resp onse v ariable, Y as a mixture of Gaussians Y = √ 0 . 7 Z + √ 0 . 3 X where Z was sampled from a standard Gaussian and X is the coun t of the minor allele at the causal SNP . Th us, X w ould explain 30% of the v ariance of Y , or 30% of the simulated eQTL, indep enden t of minor allele frequency . The effect size at a selected SNP T o calculate the bias in figure 7, we compared the estimated effect size at the sampled SNP to the true effect at that SNP , ie not at the causal SNP . If the causal SNP is S and the selected SNP is T , then the underlying relative risk at T is simplest to calculate in a haploid system, which is equiv alen t to assuming Hardy W einberg equilibrium. Giv en ρ 0 = ρ ( S, T ) p π S π T (1 − π S )(1 − π T ) 31 where ρ ( S, T ) is the correlation b etw een S and T , then the exp ected prop ortion of cases in the p opulation conditional on the allele carried at SNP T is D 1 = r ( π S π T + ρ 0 ) + ((1 − π S ) π T − ρ 0 ) π T T is risk allele D 0 = r ( π S (1 − π T ) − ρ 0 ) + ((1 − π S )(1 − π T ) + ρ 0 ) 1 − π T T is protective allele and the relativ e risk is D 1 D 0 . F or a rare disease such as T1D, relativ e risks and o dds ratios are appro ximately equal. Implemen tation of Ba yesian Mo del Av eraging Ba y esian model a v eraging requires ev aluating all possible m ultiple SNP mo dels in eac h trait, and conducting colo calisation testing for eac h mo del. W e b egan b y defining the p osterior probabilit y of mo del j for b oth traits as, π j = π 1 j π 2 j P k π 1 k π 2 k where π i j is the p osterior probability of mo del j for trait i and a mo del j indicates which SNPs are included in the mo del. Ev en when the num b er of SNPs to b e tested is fixed at tw o, the num b er of p ossible models is p ! 2!( p − 2)! . Whilst testing all mo dels is feasible if computationally exp ensive for analysis of real data, it is impractical for simulations. T o reduce the computation burden, we first ev aluated all p single SNP models and indentified the set of SNPs with v ery lo w p osterior probabilit y ( π j < 0 . 01). W e then excluded any t w o SNP mo del containing only SNPs from this set. If p 0 < p such SNPs w ere identified, this reduced the num ber of mo dels to test to p ! 2!( p − 2)! − p 0 ! 2!( p − 2)! . F or the purp oses of sim ulation, we used the profile likelihoo d approach to generate a χ 2 1 dis- tributed test statistic and av eraged the resulting p v alues, P j , ov er the mo del space to calculate an ov erall p osterior predictive p v alue, P j P j π j . F or the application to AITD, we integrated the p v alue asso ciated with the χ 2 2 distributed test statistic calculated assuming η w as kno wn ov er both the p osterior distribution of η given each mo del, and the p osterior of the model space. The latter is formally correct, but comptationally to o exp ensive for sim ulation, and the profile likelihoo d p v alue and the p osterior predictiv e p v alue ha v e b een shown to b e very similar for large samples. 32 Region SNP MAF GD HT P o w er, α = OR p v alue OR p v alue 0 . 05 10 − 6 Asso ciate d with GD and HT in publishe d study 1p13.2/ PTPN22 rs2476601 G > A 0.096 1.55 4 . 03 × 10 − 16 2.02 3 . 74 × 10 − 15 0.99 0.37 2q33.2/ CTLA4 / ICOS rs11571297 G > A 0.493 0.72 2 . 81 × 10 − 23 0.82 3 . 21 × 10 − 3 0.99 0.490 2p25.1/ TRIB2 rs1534422 A > G 0.455 1.16 4 . 69 × 10 − 6 1.24 1 . 64 × 10 − 3 0.61 0.004 3q27.3/3q28/ LPP rs13093110 C > T 0.452 1.18 8 . 17 × 10 − 7 1.20 7 . 09 × 10 − 3 0.70 0.008 6q15/ BA CH2 rs72928038 G > A 0.177 1.21 3 . 63 × 10 − 6 1.30 1 . 36 × 10 − 3 0.64 0.005 10p15.1/ IL2RA rs706779 A > G 0.467 0.85 2 . 27 × 10 − 6 0.84 0.0125 0.674 0.007 11q21/– rs4409785 T > C 0.173 1.21 5 . 37 × 10 − 6 1.34 3 . 54 × 10 − 4 0.63 0.004 Asso ciate d with GD only in publishe d study 1p36.32/ TNFRSF1 rs2843403 C > T 0.362 0.84 7 . 94 × 10 − 7 0.97 0.696 0.69 0.007 1q23.1/ F CRL3 rs7522061 T > C 0.480 1.16 1 . 08 × 10 − 5 1.03 0.634 0.60 0.004 6q27/ CCR6 imm 6 167338101 A > C 0.408 0.84 3 . 30 × 10 − 7 0.88 0.056 0.71 0.009 12q12/ PRICKLE1 rs4768412 C > T 0.363 1.19 3 . 30 × 10 − 7 1.00 0.949 0.73 0.010 14q31.1/ TSHR rs2300519 T > A 0.380 1.54 1 . 34 × 10 − 38 0.93 0.295 1 0.95 16p11.2/ ITGAM rs57348955 G > A 0.396 0.83 3 . 76 × 10 − 8 0.91 0.188 0.76 0.013 Supplemen tary T able I: P o w er to detect asso ciation with Hashimoto’s Thyroiditis to confirmed lo ci for Grav es’ Disease. Region denotes chromosomal region and most lik ely candidate gene(s) where av ailable [9]. GD=Gra ves’ Disease; HT=Hashimoto’s Th yroiditis; MAF=minor allele frequency in c on trols. 33 Complete T agging ● ● ● ● ● ● ● ● ● ● ● ● ● ● ● ● ● ● ● ● ● ● ● ● ● ● ● ● ● ● ● ● ● ● ● ● ● ● ● ● ● ● ● ● ● ● ● ● ● ● ● ● ● ● ● ● ● ● ● ● ● ● ● ● ● ● ● ● ● ● ● ● ● ● ● ● ● ● ● ● ● ● ● ● ● ● ● ● ● ● ● ● ● ● ● ● ● ● ● ● ● ● ● ● ● ● ● ● ● ● ● ● ● ● ● ● ● ● ● ● ● ● ● ● ● ● ● ● ● ● ● ● ● ● ● ● ● ● ● ● ● ● ● ● ● ● ● ● ● ● ● ● ● ● ● ● ● ● ● ● ● ● ● ● ● ● ● ● ● ● ● ● ● ● ● ● ● ● ● ● ● ● ● ● ● ● ● ● ● ● ● ● ● ● ● ● ● ● ● ● ● ● ● ● ● ● ● ● ● ● ● ● ● ● ● ● ● ● ● ● ● ● ● ● ● ● ● ● ● ● ● ● ● ● ● ● ● ● ● ● ● ● ● ● ● ● ● ● ● ● ● ● ● ● ● ● ● ● ● ● ● ● ● ● ● ● ● ● ● ● ● ● ● ● ● ● ● ● ● ● ● ● ● ● ● ● ● ● ● ● ● ● ● ● ● ● ● ● ● ● ● ● ● ● ● ● ● ● ● ● ● ● ● ● ● ● ● ● ● ● ● ● ● ● ● ● ● ● ● ● ● ● ● ● ● ● ● ● ● ● ● ● ● ● ● ● ● ● ● ● ● ● ● ● ● ● ● ● ● ● ● ● ● ● ● ● ● ● ● ● ● ● ● ● ● ● ● ● ● ● ● ● ● ● ● ● ● ● ● ● ● ● ● ● ● ● ● ● ● ● ● ● ● ● ● ● ● ● ● ● ● ● ● ● ● ● ● ● ● ● ● ● ● ● ● ● ● ● ● ● ● ● ● ● ● ● ● ● ● ● ● ● ● ● ● ● ● ● ● ● ● ● ● ● ● ● ● ● ● ● ● ● ● ● ● ● ● ● ● ● ● ● ● ● ● ● ● ● ● ● ● ● ● ● ● ● ● ● ● ● ● ● ● ● ● ● ● ● ● ● ● ● ● ● ● ● ● ● ● ● ● ● ● ● ● ● ● ● ● ● ● ● ● ● ● ● ● ● ● ● ● ● ● ● ● ● ● 0.00 0.25 0.50 0.75 1.00 0.00 0.25 0.50 0.75 1.00 0.00 0.25 0.50 0.75 1.00 N=2000 N=5000 N=8000 1.1 1.2 1.3 1.1 1.2 1.3 Relativ e Risk R 2 betw een selected SNP and causal SNP RelativeRisk 1.1 1.2 1.3 Supplemen tary Figure 6: The most asso ciated SNP in a region is not necessarily the causal SNP . Bo xplots show the distribution of r 2 b et w een the SNP with the smallest p v alue (conditional on p < 1 × 10 − 8 ) and the causal SNP from sim ulated data, either under tagging or complete genot yp e co verage. Increasing the effect size increases the range of tagging SNPs detectable, and hence can hav e the apparen tly counter-in tuitive result of decreasing the correlation b et w een selected and causal SNPs. How ever, if complete genotype cov erage is a v ailable, the LD b et w een selected and causal SNPs tends to increase with effect size or sample size. 34 N=2000 N=5000 N=8000 ● ● ● ● ● ● ● ● ● ● ● ● ● ● ● ● ● ● ● ● ● ● ● ● ● ● ● ● ● ● ● ● ● ● ● ● ● ● ● ● ● ● ● ● ● ● ● ● ● ● ● ● ● ● ● ● ● ● ● ● ● ● ● ● ● ● ● ● ● ● ● ● ● ● ● ● ● ● ● ● ● ● ● ● ● ● ● ● ● ● ● ● ● ● ● ● ● ● ● ● ● ● ● ● ● ● ● ● ● ● ● ● ● ● ● ● ● ● ● ● ● ● ● ● ● ● ● ● ● ● ● ● ● ● ● ● ● ● ● ● ● ● ● ● ● ● ● ● ● ● ● ● ● ● ● ● ● ● ● ● ● ● ● ● ● ● ● ● ● ● ● ● ● ● ● ● ● ● ● ● ● ● ● ● ● ● ● ● ● ● ● ● ● ● ● ● ● ● ● ● ● ● ● ● ● ● ● ● ● ● ● ● ● ● ● ● ● ● ● ● ● ● ● ● ● ● ● ● ● ● ● ● ● ● ● ● ● ● ● ● ● ● ● ● ● ● ● ● ● ● ● ● ● ● ● ● ● ● ● ● ● ● ● ● ● ● ● ● ● ● ● ● ● ● ● ● ● ● ● ● ● ● ● ● ● ● ● ● ● ● ● ● ● ● ● ● ● ● ● ● ● ● ● ● ● ● ● ● ● ● ● ● ● ● ● ● ● ● ● ● ● ● ● ● ● ● ● ● ● ● ● ● ● ● ● ● ● ● ● ● ● ● ● ● ● ● ● ● ● ● ● ● ● ● ● ● ● ● ● ● ● ● ● ● ● ● ● ● ● ● ● ● ● ● ● ● ● ● ● ● ● ● ● ● ● ● ● ● ● ● ● ● ● ● ● ● ● ● ● ● ● ● ● ● ● ● ● ● ● ● ● ● ● ● ● ● ● ● ● ● ● ● ● ● ● ● ● ● ● ● ● ● ● ● ● ● ● ● ● ● ● ● ● ● ● ● ● ● ● ● ● ● ● ● ● ● ● ● ● ● ● ● ● ● ● ● ● ● ● ● ● ● ● ● ● ● ● ● ● ● ● ● ● ● ● ● ● ● ● ● ● ● ● ● ● ● ● ● ● ● ● ● ● ● ● ● ● ● ● ● ● ● ● ● ● ● ● ● ● ● ● ● ● ● ● ● ● ● ● ● ● ● ● ● ● ● ● ● ● ● ● ● ● ● ● ● ● ● ● ● ● ● ● ● ● ● ● ● ● ● ● ● ● ● ● ● ● ● ● ● ● ● ● ● ● ● ● ● ● ● ● ● ● ● ● ● ● ● ● ● ● ● ● ● ● ● ● ● ● ● ● ● ● ● ● ● ● ● ● ● ● ● ● ● ● ● ● ● ● ● ● ● ● ● ● ● ● ● ● ● ● ● ● ● ● ● ● ● ● ● ● ● ● ● ● ● ● ● ● ● ● ● ● ● ● ● ● ● ● ● ● ● ● ● ● ● ● ● ● ● ● ● ● ● ● ● ● ● ● ● ● ● ● ● ● ● ● ● ● ● ● ● ● ● ● ● ● ● ● ● ● ● ● ● ● ● ● ● ● ● ● ● ● ● ● ● ● ● ● ● ● ● ● ● ● ● ● ● ● ● ● ● ● ● ● ● ● ● ● ● ● ● ● ● ● ● ● ● ● ● ● ● ● ● ● ● ● ● ● ● ● ● ● ● ● ● ● ● ● ● ● ● ● ● ● ● ● ● ● ● ● ● ● ● ● ● ● ● ● ● ● ● ● ● ● ● ● ● ● ● ● ● ● ● ● ● ● ● ● ● ● ● ● ● ● ● ● ● ● ● ● ● ● ● ● ● ● ● ● ● ● ● ● ● ● ● ● ● ● ● ● ● ● ● ● ● ● ● ● ● ● ● ● ● ● ● ● ● ● ● ● ● ● ● ● ● ● ● ● ● ● ● ● ● ● ● ● ● ● ● ● ● ● ● ● ● ● ● ● ● ● ● ● ● ● ● ● ● ● ● ● ● ● ● ● ● ● ● ● ● ● ● ● ● ● ● ● ● ● ● ● ● ● ● ● ● ● ● ● ● ● ● ● ● ● ● ● ● ● ● ● ● ● ● ● ● ● ● ● ● ● ● ● ● ● ● ● ● ● ● ● ● ● ● ● ● ● ● ● ● ● ● ● ● ● ● ● ● ● ● ● ● ● ● ● ● ● ● ● ● ● ● ● ● ● ● ● ● ● ● ● ● ● ● ● ● ● ● ● ● ● ● ● ● ● ● ● ● ● ● ● ● ● ● ● ● ● ● ● ● ● ● ● ● ● ● ● ● ● ● ● ● ● ● ● ● ● ● ● ● ● ● ● ● ● ● ● ● ● ● ● ● ● ● ● ● ● ● ● ● ● ● ● ● ● ● ● ● ● ● ● ● ● ● ● ● ● ● ● ● ● ● ● ● ● ● ● ● ● ● ● ● ● ● ● ● ● ● ● ● ● ● ● ● ● ● ● ● ● ● ● ● ● ● ● ● ● ● ● ● ● ● ● ● ● ● ● ● ● ● ● ● ● ● ● ● ● ● ● ● ● ● ● ● ● ● ● ● ● ● ● ● ● ● ● ● ● ● ● ● ● ● ● ● ● ● ● ● ● ● ● ● ● ● ● ● ● ● ● ● ● ● ● ● ● ● ● ● ● ● ● ● ● ● ● ● ● ● ● ● ● ● ● ● ● ● ● ● ● ● ● ● ● ● ● ● ● ● ● ● ● ● ● ● ● ● ● ● ● ● ● ● ● ● ● ● ● ● ● ● ● ● ● ● ● ● ● ● ● ● ● ● ● ● ● ● ● ● ● ● ● ● ● ● ● ● ● ● ● ● ● ● ● ● ● ● ● ● ● ● ● ● ● ● ● ● ● ● ● ● ● ● ● ● ● ● ● ● ● ● ● ● ● ● ● ● ● ● ● ● ● ● ● ● ● ● ● ● ● ● ● ● ● ● ● ● ● ● ● ● ● ● ● ● ● ● ● ● ● ● ● ● ● ● ● ● ● ● ● ● ● ● ● ● ● ● ● ● ● ● ● ● ● ● ● ● ● ● ● ● ● ● ● ● ● ● ● ● ● ● ● ● ● ● ● ● ● ● ● ● ● ● ● ● ● ● ● ● ● ● ● ● ● ● ● ● ● ● ● ● ● ● ● ● ● ● ● ● ● ● ● ● ● ● ● ● ● ● ● ● ● ● ● ● ● ● ● ● ● ● ● ● ● ● ● ● ● ● ● ● ● ● ● ● ● ● ● ● ● ● ● ● ● ● ● ● ● ● ● ● ● ● ● ● ● ● ● ● ● ● ● ● ● ● ● ● ● ● ● ● ● ● ● ● ● ● ● ● ● ● ● ● ● ● ● ● ● ● ● ● ● ● ● ● ● ● ● ● ● ● ● ● ● ● ● ● ● ● ● ● ● ● ● ● ● ● ● ● ● ● ● ● ● ● ● ● ● ● ● ● ● ● ● ● ● ● ● ● ● ● ● ● ● ● ● ● ● ● ● ● ● ● ● ● ● ● ● ● ● ● ● ● ● ● ● ● ● ● ● ● ● ● ● ● ● ● ● ● ● ● ● ● ● ● ● ● ● ● ● ● ● ● ● ● ● ● ● ● ● ● ● ● ● ● ● ● ● ● ● ● ● ● ● ● ● ● ● ● ● ● ● ● ● ● ● ● ● ● ● ● ● ● ● ● ● ● ● ● ● ● ● ● ● ● ● ● ● ● ● ● ● ● ● ● ● ● ● ● ● ● ● ● ● ● ● ● ● ● ● ● ● ● ● ● ● ● ● ● ● ● ● ● ● ● ● ● ● ● ● ● ● ● ● ● ● ● ● ● ● ● ● ● ● ● ● ● ● ● ● ● ● ● ● ● ● ● ● ● ● ● ● ● ● ● ● ● ● ● ● ● ● ● ● ● ● ● ● ● ● ● ● ● ● ● ● ● ● ● ● ● ● ● ● ● ● ● ● ● ● ● ● ● ● ● ● ● ● ● ● ● ● ● ● ● ● ● ● ● ● ● ● ● ● ● ● ● ● ● ● ● ● ● ● ● ● ● ● ● ● ● ● ● ● ● ● ● ● ● ● ● ● ● ● ● ● ● ● ● ● ● ● ● ● ● ● ● ● ● ● ● ● ● ● ● ● ● ● ● ● ● ● ● ● ● ● ● ● ● ● ● ● ● ● ● ● ● ● ● ● ● ● ● ● ● ● ● ● ● ● ● ● ● ● ● ● ● ● ● ● ● ● ● ● ● ● ● ● ● ● ● ● ● ● ● ● ● ● ● ● ● ● ● ● ● ● ● ● ● ● ● ● ● ● ● ● ● ● ● ● ● ● ● ● ● ● ● ● ● ● ● ● ● ● ● ● ● ● ● 1.0 1.2 1.4 1.0 1.2 1.4 Complete T agging 1.1 1.2 1.3 1.1 1.2 1.3 1.1 1.2 1.3 Relativ e Risk Estimation r atio : β ^ β at selected SNP Supplemen tary Figure 7: Effect sizes at selected SNPs tend to b e ov erestimated. Bo xplots show the distribution of the ratio of the estimated effect size ( ˆ β ) to the true effect size ( β ) at the most asso ciated SNP in a region. Sim ulations w ere conducted for samples of N cases and N controls, with a relativ e risk at a randomly selected “causal SNP” of 1.1, 1.2 or 1.3, under either a complete genot yping scenario (all SNPs in 1000 Genomes, top row) or the subset of SNPs app earing on the Illumina Human Omni Express c hip chip (“T agging”, b ottom ro w). Estimated effects are more lik ely to b e biased for smaller effect sizes and sample sizes. 35 [0,0.1] (0.1,0.5] (0.5,0.8] [0.8,1) 1 0 10 20 30 0 10 20 30 T r ue causal SNPs Most associated SNPs 0.0 0.5 1.0 0.0 0.5 1.0 0.0 0.5 1.0 0.0 0.5 1.0 0.0 0.5 1.0 Scaled r ank density Supplemen tary Figure 8: Distribution of Nica et. al ’s rank statistic. The statistic is ev enly distributed within [0,1] when the LD b et w een the causal v ariants is negligable, but is increasingly biased to w ards 1 as the LD increases. Columns are divided b y the r 2 b et w een distinct causal v arian ts, with r 2 = 1 indicating a shared causal v ariant. The top row shows the optimal result that could be obtained if conditioning on the true causal v ariant were p ossible, the bottom row shows the effect of conditioning on the most asso ciated SNP is to reduce the degree of skew. Results are sho wn for a complete genotyping scenario, with a sample size of 2000 and a relativ e risk of 1.3. Similar effects are seen under tagging or complete genotyping approaches, but the skew tow ards 1 o ccurs more rapidly with larger samples and effect sizes. 36 0 500 1000 1500 2000 0 50 100 Complete T agging 0 10 20 30 40 50 Region n umber Number of SNPs Threshold T otal 99 98 97 96 95 90 85 80 70 60 50 Supplemen tary Figure 9: The n um b er of principal comp onen ts required to capture a predefined prop ortion of the v ariance. The 49 regions used for sim ulation are displa y ed, unlab elled and ordered b y the total num b er of SNPs. The ma jorit y of v ariation can b e captured b y a relativ ely modest n umber of comp onents even for regions con taining large num bers of SNPs. Threshold sp ecifies the minim um prop ortion of v ariance captured, or “T otal” for the total num b er of SNPs in a region. 37 1.1 1.2 1.3 0.00 0.25 0.50 0.75 1.00 0.00 0.25 0.50 0.75 1.00 Complete T agging 20 40 60 80 100 20 40 60 80 100 20 40 60 80 100 % v ar iance captured b y PCs po w er N N=200 0 N=500 0 N=800 0 Supplemen tary Figure 10: P ow er using colo calisation testing of principal comp onents ac- cording to the prop ortion of genotype v ariance captured. P o wer is sho wn for all sim ulated datasets where the r 2 b et w een the causal SNPs was less than 0.5. 38 2 04 7 20 k 2 04 7 30 k 2 04 7 40 k 2 04 7 50 k c h r 2 : 2 0 47 1 84 7 7.. 2 04 7 5 74 4 9 c h r 2 : 2 0 47 1 84 7 7.. 2 04 7 5 74 4 9 H a shi mo t o D i sea se: C o op er et a l . ( 2 012 ) p - va l u es, ( - log 10(p )) 5 5 0 0 1 1 2 2 3 3 4 4 G r ave s D i sea se: Coo p er et a l . ( 2 012) p - v a lues, (- l o g10 ( p )) 30 30 0 0 3 3 6 6 9 9 12 12 15 15 18 18 21 21 24 24 27 27 30 30 T 1D B a se G en e S p an C T L A4 A I T D : Coop e r e t al. ( 20 12) p - va l u es, ( - log 10 ( p )) 30 30 0 0 3 3 6 6 9 9 12 12 15 15 18 18 21 21 24 24 27 27 30 30 Supplemen tary Figure 11: Single SNP p v alues for GD and HT in the CTLA4 / ICOS region on 2q33.2. 39
Original Paper
Loading high-quality paper...
Comments & Academic Discussion
Loading comments...
Leave a Comment