Isoelastic Agents and Wealth Updates in Machine Learning Markets
Recently, prediction markets have shown considerable promise for developing flexible mechanisms for machine learning. In this paper, agents with isoelastic utilities are considered. It is shown that the costs associated with homogeneous markets of ag…
Authors: Amos Storkey (University of Edinburgh), Jono Millin (University of Edinburgh), Krzysztof Geras (University of Edinburgh)
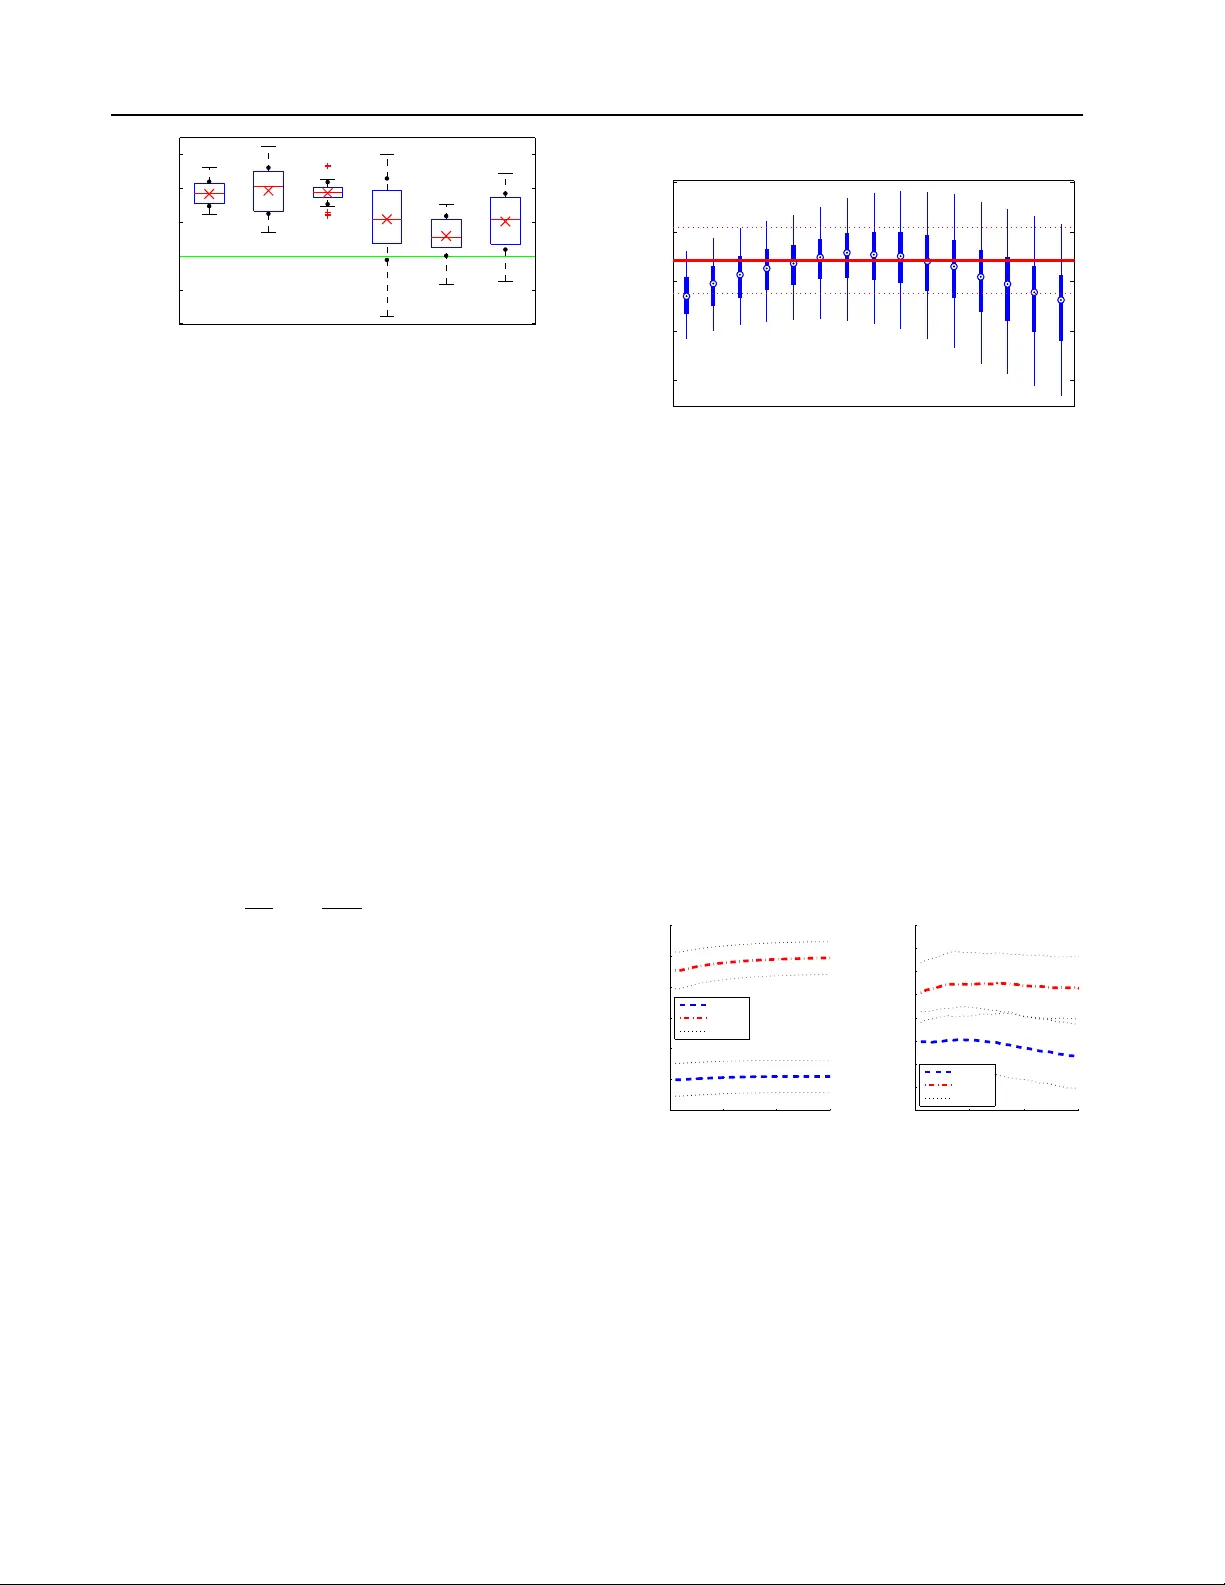
Iso elastic Agen ts and W ealth Up dates in Mac hine Learning Mark ets Amos J. Stork ey a.storkey@ed.ac.uk Jonathan J. Millin j.j.millin@sms.ed.ac.uk Krzysztof J. Geras k.j.geras@sms.ed.ac.uk Sc ho ol of Informatics,Univ ersity of Edin burgh Abstract Recen tly , prediction mark ets hav e shown considerable promise for dev eloping flexible mec hanisms for machine learning. In this pa- p er, agen ts with isoelastic utilities are con- sidered. It is sho wn that the costs asso- ciated with homogeneous mark ets of agen ts with iso elastic utilities pro duce equilibrium prices corresponding to alpha-mixtures, with a particular form of mixing component relat- ing to eac h agent’s w ealth. W e also demon- strate that wealth accumulation for logarith- mic and other isoelastic agents (through pa y- offs on prediction of training targets) can im- plemen t b oth Bay esian model updates and mixture w eight updates by imp osing different mark et pay off structures. An iterativ e algo- rithm is giv en for mark et equilibrium compu- tation. W e demonstrate that inhomogeneous mark ets of agen ts with isoelastic utilities out- p erform state of the art aggregate classifiers suc h as random forests, as w ell as single clas- sifiers (neural net works, decision trees) on a n umber of machine learning b enchmarks, and sho w that isoelastic com bination metho ds are generally b etter than their logarithmic coun- terparts. 1. Introduction This paper addresses the problem of classifier aggre- gation through the use of Machine Learning Markets. In supervised machine learning, many algorithms use simple av eraging, weigh ted a veraging, mixtures, mix- ing and log opinion p ools for com bining a v ariety of classifiers to form aggregate classifiers. On the other hand, prediction markets hav e b een used for aggrega- tion of simple b eliefs in other fields (the market price is used as an aggregate probability). Some simple forms of theoretical prediction mark ets ha ve b een sho wn to b e equiv alen t to weigh ted av eraging ( Barbu & La y , 2011 ; Stork ey , 2011 ). Ho wev er, more generally , we can formulate prediction mark et mechanisms on the App earing in Pr oc e e dings of the 29 th International Confer- enc e on Machine L e arning , Edin burgh, Scotland, UK, 2012. Cop yright 2012 b y the author(s)/owner(s). basis of exp ected utilit y theory . W e show that a whole sp ectrum of aggregation metho ds are then av ailable, including and extending those provided by α -mixtures. W e demonstrate the empirical b enefits of these aggre- gation metho ds ov er those discussed ab o v e. A num b er of authors hav e recently examined the p os- sibilities of market mechanisms for implemen ting ma- c hine learning metho ds. Desirable properties of mar- k ets include the fact that agents act indep enden tly , mark ets are inherently parallelisable and the fact that the form of mo dels pro duced b y markets is more general than explicitly defined probabilistic mo dels. Mark et based machine learning approaches are b e- ing shown to b e consistent with standard probabilis- tic machine learning formalisms ( Stork ey , 2011 ) as w ell providing regret b ounds for market mak ers ( Chen & W ortman V aughan , 2010 ; Ab erneth y et al. , 2011 ). Mark ets are also a well studied and perv asive part of our so cial and computational infrastructure. W e envisage the p ossibilit y of setting up online pre- diction mark ets for large scale multiv ariate prediction problems in which different algorithms comp ete. This generalises prediction mark ets, which usually fo cus on disconnected discrete even ts, and relates to other re- cen t work in utilising algorithm cro wdsourcing for ma- c hine learning ( Ab ernethy & F rongillo , 2011 ). It would pro vide an alternative to, say , the current in terest in comp etition and challenge environmen ts (e.g. Netflix, Kaggle, P ASCAL2), where individuals compete for the b est p ersonal p erformance. Exp erience in these do- mains has suggested that it is common for individual algorithms to b e outp erformed by comp etitors group- ing together to pro duce mo del combinations ( Bell & Koren , 2007 ). This mirrors the exp erience regarding aggregation of exp ert predictions ( Dani et al. , 2006 ). The main no vel contributions of this pap er are: • Extending the set of standard agen ts from loga- rithmic agents and exp onen tial agen ts to also in- clude the v arious forms of iso elastic agents, and to sho w such agents can repro duce and extend the α -mixtures framework ( Amari , 2007 ). • Demonstrating that online and batc h agen t w ealth updates are equiv alen t to Bay esian p os- terior up dates and mixture co efficien t up dates re- Iso elastic Agents and W ealth Updates in Machine Learning M arkets sp ectiv ely . • Equating the multi-agen t equilibrium (fixed- p oin t) market with a divergence minimisation. The result is an iterativ e process for establishing the mark et equilibrium v alues. • Demonstrating that Machine Learning Mark ets outp erform individual strong classifiers when pre- sen ted with equiv alen t data. Showing that the mark ets improv e on state of the art classifiers, suc h as random forests, and provide b etter log- probabilit y performance on classification test sets. • Demonstrating that inhomogeneous sets of iso e- lastic agents pro duce b etter p erformance than logarithmic agen ts. Hence aggregation by simple mixtures can b e improv ed up on. 2. Other Related W ork A num b er of previous pap ers address machine learn- ing and prediction markets. In ( Lay & Barbu , 2010 ) and ( Barbu & Lay , 2011 ), the authors consider agents endo wed with betting functions, and do experimental tests in the context of classifiers (leav es of the trees of a random forest) trained on b o otstrapped samples. In ( Stork ey , 2011 ) the author develops a complementary approac h, utilizing beliefs and utilities of individual agen ts. He shows that a v ariety of machine learning mo del combination metho ds, including mo del av erag- ing, pro duct mo dels, factor graph s etc. can b e imple- men ted using Machine Learning Markets. In ( Chen & W ortman V aughan , 2010 ) the market is defined with resp ect to a global cost function, and they demon- strate achieving ‘no regret’ learning using information mark ets. F rom another p ersp ectiv e, Agraw al et al. ( Agra wal et al. , 2010 ) looked at the equilibrium con- ditions of prediction mark ets in v arious situations of matc hing buyers and sellers. The av ailable informa- tion is imp ortan t for market conditions. This was dis- cussed in ( Jumadino v a & Dasgupta , 2011 ), where they used a m ulti-agen t system to examine the v arious de- p endencies on information reliability , rate etc. It is the ability of prediction markets to aggregate b elief that is k ey to their p oten tial ( Pennock & W ellman , 1997 ; Ottaviani & Sørensen , 2007 ), and muc h of the exp erimen tal work on prediction markets backs that up ( Ledy ard & Hanson , 2008 ). The p oten tial of prediction markets has been consid- ered for some time. In ( Arrow et al. , 2008 ; Manski , 2006 ; W olfers & Zitzewitz , 2004 ) the authors discuss the capabilit y of practical prediction markets to cap- ture accurate probabilities. In ( Dani et al. , 2006 ) the authors compared a num b er of different mechanisms for exp ert aggregation including a simple prediction mark et approach. Differen t market designs hav e dif- feren t features, and ensuring go od prediction market design with sufficien t fluidit y ( Brahma et al. , 2010 ) will be critical for efficiently reaching equilibrium. In ( Tseng et al. , 2010 ) the authors examine the statistical prop erties of market agent mo dels, whereas in ( Lee & Moretti , 2009 ) the authors consider prediction mark ets in the con text of Bay esian learning. 3. Notation Mac hine Learning Markets use prediction market mec hanisms to generate machine learning models via the market price. The basic concepts and notation are no w introduced. 3.1. Go ods W e consider a set of market go o ds enumerated b y k = 1 , 2 , . . . N G , each corresponding to a sp ecific outcome of a discrete random v ariable, denoted k . The go o d k will pa y out one unit of currency in the ev ent that the outcome for k is k . The mark et has a commonly agreed cost c k (0 < c k < 1) for each go od k and we collect the costs into the cost vector c = ( c 1 , c 2 , . . . , c N G ) T . The cost vector c will b e interpreted as the aggregate probabilistic b elief provided by the mark et: the prob- abilit y 1 of k occurring is c k . 3.2. Agen t Actions A n umber of agents , en umerated b y i = 1 , 2 , . . . , N A , act in the mark et. Each agent has wealth W i , and in- v ests (or risks ) an amoun t r ik in stock k . W e collect r i = ( r i 1 , r i 2 , . . . , r iN G ) T . A no arbitrage assumption 2 implies that P k c k = 1, meaning a probabilistic in ter- pretation of c k is reasonable. Likewise, we can require all agents to spend all their wealth: if any agen t wan ts to k eep it as a risk free in v estment, that agent can sim- ply purchase one of each sto c k instead. Hence, without loss of generalit y , we hav e X k r ik = W i . (1) Again without loss of generality , we will measure w ealth in units such that the total wealth across all agen ts is 1: P i W i = 1. Hence P ik r ik = 1. Eac h agent is also endo wed with a utility function U i ( W ) denoting the utility of having w ealth W . F or the purp oses of this paper w e will only consider con- ca ve utilit y functions. Finally , eac h agent has a belief P i , where P i ( k ) denotes the probabilistic belief, for that particular agent i , that the outcome of k will b e k . Necessarily , as k en umerates all p ossible outcomes, P k P i ( k ) = 1 for all agents. 1 Strictly , the probability is c k divided by the unit of pa yout. This ensures dimensional consistency , b oth here and elsewhere. 2 No arbitrage: there is no opp ortunit y for a risk free gain. If P k c k 6 = 1 an agent can make a risk free win b y buying (or selling) one of each sto c k which has a sure return (or debt) of 1 unit. Iso elastic Agents and W ealth Updates in Machine Learning M arkets 3.3. Mark et The agents jointly act in a market. The market trans- actions are sub ject to the macroscopic constraint N A X i =1 r ik c k = N A X i =1 W i = 1 ⇒ N A X i =1 r ik = c k (2) where N A is the num ber of agen ts. This states that w ealth m ust b e conserv ed in the market: the total pa y- out were that item to o ccur matc hes the total original w ealth. Here r ik /c k is the amount of go o d k b ough t b y agen t i (the amount inv ested divided b y cost) and so is the amoun t received if even t k occurs. 3.4. Summary T able i → agen t k → go od/outcome N A , N G → #agen ts/go o ds r i → in vestmen t W i → W ealth U i → Utilit y c → cost vector P i ( k ) → agent b elief 4. Utility Maximisation In Machine Learning Mark ets the market price c de- fines a probability distribution ov er possible outcomes, whic h can be used for prediction. The multiclass pre- diction problem is the fo cus for this pap er. 4.1. In vestmen t F unctions A giv en utility function U i induces a given inv estmen t function r ∗ i ( W i , c ) via exp ected utility maximisation: r ∗ i = r ∗ i ( W i , c ) = arg max r i X k P i ( k ) U i r ik c k s.t. X k r ik = W i . (3) where w e hav e used the fact that every agent m ust sp end their whole w ealth ( 1 ). The in v estment function indicates the amount an agent ideally would wish to in vest in each go o d, giv en the costs c . The market constrain ts may mean this desire cannot be satisfied: the agen t must find a buyer or seller to realise this desire. The optimum of ( 3 ) is given by r ∗ ik = c k ( U 0 i ) − 1 λ i ( c ) c k P i ( k ) (4) where U 0 is the deriv ative of U and λ i ( c ) is a Lagrange m ultiplier such that P k r ∗ ik = W i is satisfied. In ge neral, the equation for λ i cannot b e explicitly solv ed. How ever, for a num b er of utilities the inv est- men t function is analytic. T able 1 lists some imp ortan t utilit y functions (exp onen tial, logarithmic and iso elas- tic) and their corresp onding inv estmen t functions. The class of iso elastic functions are a v ery useful set of utilities. The iso elastic utilities get their name as they all hav e in vestmen t functions that are linear in the curren t wealth; this property is called the iso elastic pr op erty . Iso elastic utilit y functions are parameterised b y η > 0. Strictly , the logarithmic utility is also an iso elastic utility with the limiting v alue of η = 1. 4.2. Mark et Equilibrium The Market must satisfy the market constraint ( 2 ). A t the same time each agent attempts to maximise their individual utility . It is well known ( Arrow & De- breu , 1954 ) that, if the individual utilities are conca ve (as is the case in this pap er), there is a unique fixed price p oin t for which agen ts all attain their maximum utilit y and the mark et constraints are satisfied. This is called the market e quilibrium . Ho wev er, the exis- tence of a fixed p oin t do es not establish a means of obtaining it. The question of how a market migh t equi- librate formed part of the early discussion regarding equilibria, and led to W alras’ concept of tˆ atonnement . This idea, as communicated by Samuelson ( Samuel- son , 1947 ), w as that prices are differentially c hanged in the direction of the excess or deficit demand. How- ev er, the constraints on this formalism meant it was not established as a general purp ose pro cedure. The are man y analyses that in volv e form ulating conv ex op- timisation approaches or auction pro cesses for obtain- ing market equilibria, e.g. ( Deng et al. , 2002 ; Dev anur et al. , 2008 ; Y e , 2006 ) – see ( V azirani , 2007 ) for more details. These algorithms typically require a com plete optimisation pro cedure. Tw o exceptions are ( Cole & Fleisc her , 2007 ; Fleischer et al. , 2008 ) which develop on the idea of tˆ atonnement. In this pap er an iterative tˆ atonnemen t-like approach is used for establishing market equilibria. Consider the fact that P k c k = 1 and P k ( P i r ik ) = 1 means that b oth c k and P i r ik tak e probabilistic form. A t equilibrium, w e hav e P i r ik = c k (see ( 2 )) when all agen ts are allo cated their optimal demand. Awa y from equilibrium there will b e an excess or deficit demand in different go ods, which is evident in the difference b et w een P i r ik and c k . Consider the KL divergence K L ( c || P i r i ). This is minimised and zero only at equilibrium. T o minimise this KL divergence we use Algorithm 1 . This algorithm only terminates when the (unique) equilibrium is reach ed, when c is the equilib- rium price. In all our empirical tests the equilibrium w as alw ays reached. Each pass of the algorithm is naiv ely O ( N A × N G ) – each update is computationally equiv alen t to a mixture model up date. In our exper- imen ts equilibria were reac hed in betw een 5 and 15 iterations. Satisfaction of the market constraints for given buying functions, or equiv alently minimisation of K L ( c || P i r i ), defines a fixed p oin t that is a market equilibrium. These market equilibria can b e explicitly computed for v arious agen t utilities. F or a mark et of iden tical logarithmic agents or a mark et of identical exp onen tial agen ts we hav e c k = P i W i P i ( k ) P i W i and c k ∝ N A Y i =1 P i ( k ) 1 N A , (6) Iso elastic Agents and W ealth Updates in Machine Learning M arkets Exp onen tial U ( W ) = − exp( − W ) r ik ( W i , c ) = W i N G + c k log P i ( k ) c k − 1 N G P k 0 c k 0 log P i ( k 0 ) c k 0 Logarithmic U ( W ) = log( W ) for W > 0 −∞ otherwise r ik ( W i , c ) = W i P i ( k ) Iso elastic U ( W ) = W 1 − η i − 1 1 − η i r ik = W i ( c k ) η i − 1 η i ( P i ( k )) 1 η i P k 0 ( c k 0 ) η i − 1 η i ( P i ( k 0 )) 1 η i T able 1. V arious utility functions and their corresp onding inv estment functions. F or the isoelastic utilities 0 < η . Algorithm 1 Market Equilibrium initialise c , initialise a (e.g. a = 0 . 1) define stopping criterion rep eat Compute optimal r i for each agent ignoring mar- k et constraint set (for normalising Z 1 ) c new k = 1 Z 1 P i r ik c k 1 − a c k (5) if KL( c new || P i r i ( c new )) − KL( c || P i r i ( c )) < 0 then discard c new k and increase a . end if un til KL( c new || P i r i ( c new )) < resp ectiv ely . F or logarithmic agen ts this tak es the form of a model a v erage or mixture of the agen ts’ beliefs; for exp onen tial agents it is a log opinion p ool of b eliefs. See ( Stork ey , 2011 ) for discussion of these. The term homo gene ous will be used to refer to markets where all agen ts hav e identical utility functions. 4.3. Equilibria for Iso elastic Agen ts W e cannot explicitly obtain the equilibrium for sets of iso elastic agents with η 6 = 1, and so the optimi- sation pro cedure of the previous section needs to b e emplo yed. Ho wev er we can sa y something ab out the form of solution we obtain for iso elastic agents. F or example we can obtain the following equilibrium for homogeneous markets of iso elastic age n ts, all having the same η . This solution is not closed form: c k = " X i V i P i ( k ) 1 η # η (7) where V i = W i / Z i and Z i is the implicit solution to Z i = X k X j W j Z j P j ( k ) 1 η η − 1 P i ( k ) 1 η . (8) Equation ( 7 ) is precisely the equation for α -mixtures ( Amari , 2007 ; W u , 2009 ), but where V i is defined im- plicitly in terms of a set of w eights (or wealths) W i . This particular expression for α -mixtures is interest- ing b ecause of the iso elastic prop ert y: if a single com- p onen t from the α -mixture is replaced by t wo iden- −10 −5 0 5 10 0 0.05 0.1 0.15 0.2 0.25 0.3 0.35 0.4 x P(x) −10 −5 0 5 10 0 0.02 0.04 0.06 0.08 0.1 0.12 0.14 0.16 0.18 x P(x) (a) (b) Figure 1. (a) Three different comp onents (i.e. agen t b e- liefs), eac h giv en w eights W i of 0 . 4, 0 . 4 and 0 . 2 from left to righ t. (b) The logarithmic (i.e. mixture) combination of these components (dashed) and the iso elastic ( η = 10) com bination (solid). Note the iso elastic combination puts more weigh t where the ov erlap of the different comp onen ts are and do wn-w eights the regions of disagreemen t or iso- lated comp onen ts. tical comp onen ts with weigh t W i / 2, it results in ex- actly the same model. The precise num b er of comp o- nen ts/agents does not matter, just the total w ealth as- so ciated with eac h b elief, regardless of the ho w man y comp onen ts share it. F urthermore the influence the agen t has on the ov erall mo del dep ends on the level of agreemen t that the agen t has with the ov erall consen- sus. This affect the v alue of Z i for that agen t. Figure 1 illustrates the distinction b etw een an iso elas- tic mark et combination and a logarithmic com bination (whic h is equiv alen t to a standard mixture). In the isolelastic market, for η > 1, the individual b eliefs are ‘squashed’ (raised to a fractional pow er) b efore being mixed, and are then ‘unsquashed’ again after mixing. The result of this is the areas of agreement b et ween agen ts are emphasised relativ e to a standard mixture. As an alternativ e to ( 7 ), we can also write c k = X i W i P η ik ( c ) (9) where P η ik ( c ) is defined as P η ik ( c ) = c k P i ( k ) c k 1 /η P k 0 c k 0 P i ( k 0 ) c k 0 1 /η . (10) Again this is not closed form, but expresses the equi- librium c k as a weigh ted sum of the effe ctive b eliefs P η ik that are asso ciated with each agent once the impact of the com bination with rest of the market is taken in to account. Each effective belief is w eighted b y the agen t’s wealth W i b efore aggregation. Iso elastic Agents and W ealth Updates in Machine Learning M arkets In the discussion ab o ve, all the agents hav e utilities with the same v alue of η . This is a homogeneous mar- k et structure. How ev er there is no restriction to homo- geneit y in the context of Machine Learning Markets. Here an inhomo gene ous market structure can b e used where differen t agents ha v e different η v alues. Hence the equilibria of Machine Learning Markets can im- plemen t a broader set of combination pro cesses than standard α -mixtures, and so generalises the α -mixture formalism. W e show in Section 6 that the use of an in- homogeneous market structure pro vides impro vemen ts o ver standard mixtures for a v ariety of standard ma- c hine learning b enc hmarks. 5. T raining and W ealth Allo cation W e consider a classification problem, with a train- ing dataset D T r consisting of cov ariates x n and cor- resp onding classifications k n . W e wish to learn the relationship b et ween v ariables x and classifications k , so that given a test p oint x ∗ w e can provide a predic- tiv e distribution for the v alue that the corresponding class lab el k ∗ will take. A test dataset D T e is used to ev aluate the final p erformance. 5.1. Agen t Beliefs and W ealth Up dates Eac h agen t has an individual belief P i ( k ). In this pa- p er we consider agents that ha ve used standard ma- c hine learning algorithms on a training data set D T r to deriv e their b eliefs. Eac h agent has a sp ecific wealth W i . The wealth af- fects the market influence of that agent. An agent’s action in the mark et changes the w ealth of the agen t: the c hange of wealth after a single in vestmen t r i , and a return on that purc hase is given by r ik ∗ /c k ∗ where k ∗ denotes the index of the ev en t that o ccurs. The agents mak e purc hases in predictions across the whole train- ing dataset, trading with the other agents. Pa y outs are then made and each agen t mak es a return on the in vestmen t. Agents that inv est well (relatively) gain w ealth, whereas agents that inv est in go ods that don’t pa y out lose wealth and hence mark et influence. This pro cess can b e rep eated for a num ber of ep o chs . F or analytic purp oses, w e consider tw o wealth up date sc hemes: an online and a batch sc heme. All the em- pirical analyses are done using the batc h scheme. 5.1.1. Online: Ba yesian Model Upd a tes Consider the case of all agents starting with w ealth 1 / N A , where N A is the n umber of agents. Let T denote the first t data items and D T denote the ordered set of those data items, with D t b eing the t th item. The total n umber of items is N T r . Let k t b e the target for the t th data p oin t. In the online setting, the agen t purc hases predictions on the data p oin ts t = 1 , 2 , . . . , N T r one at a time. At eac h time p oin t the outcome is then revealed and all b ets are cashed in. This is an online up date sc heme. Let W t i denote the wealth of agen t i after the target for data p oin t t is kno wn and the winnings are received. F or iso elastic agen ts (including logarithmic agents when η = 1), at each data p oin t t , eac h agent b ets the whole wealth W t i and gains a return of r ik t /c k t , leading to W t +1 i = W t i P η ik t ( c ) P i 0 W t i 0 P η i 0 k t ( c ) (11) using ( 10 ) and ( 9 ), and r ik from T able 1 . If we equate W t +1 i with the concept P ( i | D t +1 ) then this leads to W t +1 i = P ( i | D T +1 ) = P η ik t P ( i | D T ) P i 0 P η i 0 k t P ( i 0 | D T ) (12) whic h giv es the Ba yesian up date rule on observ ation of a new data p oin t at time t for a single agen t likelihoo d P η ik t . F or logarithmic agents the b elief P η ik t = P i ( k t ) and this just reduces to a Bay es up date, treating eac h agen t as an indep enden t probabilistic mo del. F or iso e- lastic agen ts it is still a Ba y es update, but where Ba y es rule uses the effe ctive b eliefs P η ik t as the comp onent dis- tributions, instead of the individual agen t b elief P i ( k t ). The equilibrium cost c t for any item at time t after seeing data D T is a standard Bay esian mo del av erage, giv en by ( 9 ), as the weigh ts are the p osterior proba- bilities asso ciated with each agent ( 12 ). The fact that these Bay esian up dates o ccur for log- arithmic utilities (or equiv alen tly log-loss) has been discussed in a different context in ( Beygelzimer et al. , 2012 ). Establishing the extension of this rule for iso e- lastic agen ts is a nov el generalisation. 5.1.2. Ba tch: Mixing Coefficient Upd a tes Ba yesian mo del av eraging is appropriate if we in ter- pret each agent as an alternativ e comp eting hypothe- sis, where ultimately one agent has the correct b elief. Ho wev er, in many , or even most situations (see e.g. ( Domingos , 2000 ; 1997 ; Mink a , 2002 ) for a con tin ued discussion), we ma y b eliev e that the most appropriate mo del is a com bination of beliefs rather than a single one. In those settings Ba yesian mo del av eraging is in- appropriate. Rather, w e ma y believe the data is b est describ ed by a mixture of probabilities, and we wish to determine optimal mixing prop ortions. Consider, instead, splitting the agent wealth equally across test cases, and requiring the agents to place b ets on all test cases at once. In this case the w ealth up dates are equiv alent to a single step of the mixture comp onen t up dates. Sp ecifically the return from con- sidering data item t is P ( i | t ) def = W i P η ik t ( c ) P i 0 W i 0 P η i 0 k ( c ) . (13) Equation ( 13 ) is precisely the form of resp onsibilit y Iso elastic Agents and W ealth Updates in Machine Learning M arkets T ests W av eform V ehicle Image Ionosphere Breast Cancer Sonar Letter Recognition 21f, 3c, 5000d 18f, 3c, 946d 19f, 7c, 2310d 34f, 2c, 351d 10f, 2c, 699d 60f, 2c, 208d 16f, 26c, 20000d RF LLR 30 7 . 9 21 1 . 9 2 1 . 1 190 σ (LLR) 5 . 9 2 . 4 3 . 1 1 . 9 1 . 9 0 . 8 11 p 6 . 8 × 10 − 23 1 . 1 × 10 − 17 1 . 9 × 10 − 26 3 . 4 × 10 − 6 1 . 2 × 10 − 6 6 . 4 × 10 − 9 3 . 9 × 10 − 38 isoNN LLR − 41 − 31 − 8 5 . 6 0 . 5 2 . 2 210 σ (LLR) 15 9 . 8 7 . 9 8 3 . 8 5 . 1 29 p 1 1 1 0 . 00031 0 . 22 0 . 012 3 . 4 × 10 − 27 NN LLR 28 12 27 19 20 16 390 σ (LLR) 33 21 19 11 10 7 . 9 41 p 3 . 7 × 10 − 5 0 . 0024 5 . 1 × 10 − 9 5 . 4 × 10 − 11 4 . 8 × 10 − 12 6 . 2 × 10 − 12 1 . 5 × 10 − 30 isoDT LLR 28 7 . 3 16 2 . 1 3 . 7 1 . 4 12 σ (LLR) 13 5 . 8 8 . 8 3 . 2 3 . 4 2 . 6 28 p 5 . 2 × 10 − 13 6 . 9 × 10 − 8 2 . 4 × 10 − 11 0 . 00056 8 . 8 × 10 − 7 0 . 0035 0 . 01 DT LLR 2 . 3 × 10 2 42 61 6 . 8 14 8 . 8 580 σ (LLR) 30 13 18 4 . 2 7 . 2 3 . 6 73 p 6 . 5 × 10 − 28 2 . 7 × 10 − 17 3 . 9 × 10 − 18 4 . 4 × 10 − 10 1 . 4 × 10 − 11 2 . 8 × 10 − 14 3 . 1 × 10 − 28 T able 2. Comparisons against isoRF . The table uses an iso elastic market of trees from a random forest (isoRF) as a baseline and compares this with a num b er of metho ds ab o v e (p ositive LLR = > isoRF is b etter). The iso elastic market of trees (isoRF) p erforms b etter than the other standalone classifiers and random forest aggregation which is among state of the art on all these problems ( Caruana & Niculescu-Mizil , 2006 ). The exception is that isoRF is b eaten in some cases by the iso elastic mark et of neural netw orks. The other metho ds listed are the standalone random forest (RF), an inhomogeneous isoelastic mark et of neural net works (isoNN), a standalone neural net work (NN), an inhomogeneous iso elastic market of decision trees (isoDT) and a standalone decision tree (DT). LLR is the av erage test log likelihoo d- ratio (difference of log likelihoo ds) b et ween the isoRF and other listed metho ds. σ (LLR) is the standard error of that log lik eliho o d-ratio across differen t data samples. The p v alues giv e the sampling probability of each metho d being better than isoRF using a right-tailed paired t-test with 29 degrees of freedom. The information ab out the dataset is display ed b elo w its name, where f is the num b er of features, c the num ber of classes, and d the num b er of data p oin ts. Comparing test log lik eliho od tak es into account the full prediction probabilities. It captures not just the highest probability class but the quality of the measure of uncertaint y across classes. calculation for a mixture mo del, but where w e hav e used the effective b eliefs for the iso elastic agents. The up date rule W i = P t P ( i | t ), which is simply the ac- cum ulated return ov er the whole dataset, matches the up date rule for mixture co efficien ts. Hence across the whole range of isoelastic agents, ini- tialising agen ts with equal w ealth and repeatedly ap- plying the batch up date rule repro duces the usual mixture co efficien t up dates applied to an α -mixture mo del. Ho wev er m ultiple differen t v alues of α can b e used for differen t agents. 6. Results Mac hine Learning Markets with logarithmic and iso- elastic agents were compared with decision trees, neu- ral netw orks and random forests on a n um b er of UCI datasets 3 . Exp erimen tal data was split into tw o sets, with 2 / 3 of the data b eing used for training and 1 / 3 for testing, with a maximum total dataset size of 3200 items. F or large multiclass data, we used the L etter R e c o gnition dataset. The markets of random forests w ere built using the Ma tlab random forest imple- men tation, treebagger , with 20 decision trees pruned b y requiring a minim um of ten of observ ations p er tree leaf. Individual decision trees were extracted from the random forest after it has b een trained on all of the training data, and were used to generate eac h of the 20 agents’ beliefs. In our comparisons, market w ealths w ere adapted on the complete training set with 1 train- ing ep o c h. 30 iterations of each test were p erformed 3 Av ailable at: http://archive.ics.uci.edu/ml/ to generate meaningful statistics, with data b eing ran- domly permuted b efore eac h test. The same series of random seeds were used for each iteration of eac h test in order to fairly compare different utility functions. W ealth updates w ere p erformed using the batch mec h- anism describ ed in Section 5.1.2 . Inhomogeneous iso elastic markets w ere created by sampling v alues for η using ( η − 1) ∼ Γ( k , θ ), with shap e parameter k = 3 and scale parameter θ = 1. This pro duces a div erse set of η v alues for different agen ts, while ensuring η > 1. More risk a verse utilit y functions ( η > 1) were chosen as they emphasise re- gions of agreement betw een agen ts rather than regions of disagreemen t (see ( 7 ) and Figure 1 ). The primary purp ose of this analysis is to test differ- en t p ossible probabilistic combination metho ds against other single classifiers. Hence, we compute test log- lik eliho o ds as the main ev aluation metric. This is given b y LL = P T t log( P ( k t | x t )), where P ( k t | x t ) is the prob- abilit y of the true v alue k t giv en co v ariates x t . F or a mark et we ha ve P ( k t | x t ) = c k t where c is the equi- librium cost from the mark et given all agents in the mark et kno w the co v ariates x . Logs of test lik eliho od ratios are used when differen t mo dels are compared. 6.1. Relativ e Classifier Performance W e compare the metho ds used in Machine Learning Mark ets against other standard classifiers. Machine Learning Markets can utilise any probabilistic classi- fier as the b eliefs for each agent, and so w e compare a n umber of single classifiers with a mark et of those clas- Iso elastic Agents and W ealth Updates in Machine Learning M arkets − 0.04 − 0.02 0 0.02 0.04 0.06 wav veh img ion brc snr Dataset Scaled Log Likelihood − Ratio Figure 2. A boxplot (the red ’x’ represen ts the mean, and blac k dots represent one standard deviation from the mean) of the scaled test log likelihoo d-ratios in the iso elastic and logarithmic markets for man y iterations, scaled by the n umber of data points. Note that in general, the log- lik eliho o d for iso elastic agents is significan tly higher than for logarithmic agents. Letter recognition is excluded as it w ould b e off the top of the figure. sifiers. The exception is for random forests, which is already an aggregate classifier, and there w e compare a random forest, against a market of trees that match the trees in the random forest. An inhomogeneous iso elastic mark et with batch up dates is used for all comparisons. T able 2 presents the results along with standard deviations. The market approac hes outp er- form all the standard approac hes on all datasets, with clear statistical significance. This includes impro v e- men ts ov er random forests. Interestingly , the mark et of neural netw orks performed better than the market of random trees in some settings. 6.2. Iso elastic v ersus Logarithmic Mark ets Figure 2 sho ws 1 N T e log L ISO L LOG , where N T e is the n um- b er of test p oin ts, and L denotes the test likelihoo d. This is referred to as the (scaled) log of the test lik eliho o d-ratio b et ween the inhomogeneous iso elastic mark et and the logarithmic market predictions. In general, the log likelihoo d-ratios are positive, mean- ing that iso elastic mark ets ha ve higher test p erfor- mance than logarithmic markets. F urther, they are p ositiv e to one standard deviation (the blac k dots in Figure 2 ), implying that isoelastic markets p erform b etter (paired t-test p < 0 . 01 in all cases). 6.3. V arying the P arameter of Iso elasticit y Figure 3 shows that the test log-likelihoo d v aries for homogeneous iso elastic mark ets with v arying η . Searc hing for a go od η via a cross v alidation pro- cess can b e computationally exp ensiv e. An alterna- tiv e approac h is to randomly allo cate an η to eac h of the agents, pro ducing inhomogeneous markets, and p erform market up dates in order to tune the mixing prop ortions for the different agents. Figure 3 demon- strates that the inhomogeneous mark et provides re- sults ab out as go od as if w e has known the optimal test η but with significantly less computational cost. − 340 − 320 − 300 − 280 − 260 1.5 1.75 2 2.25 2.5 3 4 5 6 8 10 15 20 30 50 value Test Log − Likelihood Figure 3. Boxplot showing the test log-lik eliho ods for dif- feren t v alues of η (on wa veform dataset). The red line gives the test log-likelihoo d for the same data and an inhomoge- neous market with ( η − 1) ∼ Γ(3 , 1). The inhomogeneous mark et p erforms on par with the market with the b est η v alue (’best’ as assessed a p osteriori on the test data), without prior knowledge of go od η v alues. 6.4. Batc h W ealth Up dates and P erformance Figure 4 shows that adapting wealth impro ves the test log-likelihoo d. This is true for b oth logarithmic and iso elastic utilit y functions. W e ha v e noticed that w ealth adaptation do es not make a significant differ- ence on accuracy for small multiclass datasets, how- ev er, impro v ements in accuracy are observed on the large multiclass Letter Recognition data. In general, learning is more b eneficial in cases where some agents are significantly p o orer p erformers than others (e.g. they o verfit, or are trained on biased data etc.). 0 10 20 30 − 850 − 800 − 750 − 700 − 650 − 600 − 550 Epochs Test LogLiklihood Log Iso Std Dev 0 10 20 30 0.76 0.77 0.78 0.79 0.8 0.81 0.82 0.83 0.84 Epochs Accuracy Log Iso Std Dev (a) (b) Figure 4. The (a) log likelihoo ds and (b) accuracy for iso e- lastic and logarithmic utility functions, ov er a n umber of training ep ochs for the Letter datasets. V alue of log utility at time zero is equiv alent to the v alue for a random forest. The iso elastic utility is b etter than logarithmic utility and random forest in b oth accuracy and log likelihoo d. The gain from using an iso elastic utility is greater than the gain from wealth adaptation (equiv alen t to mixture weigh t optimisation). The w ealth adaptation does pro vide some b enefit, but is more muc h more useful when spurious or p oor classifiers are also included. Here most individual classifiers provide a similar contribution. Iso elastic Agents and W ealth Updates in Machine Learning M arkets 7. Discussion Mac hine Learning Markets can reflect many of the prop erties of principled probabilistic metho ds in hand- crafted probabilistic mo dels. The design of Machine Learning Markets allows the implicit definition of p ow- erful models. W e sho w that Ba ysesian model a verag- ing and mixture model learning can b e naturally im- plemen ted using market mechanisms. W e show that differen t utility functions hav e a significant effect on the market com bination results, and that iso elastic utilities are more effective in a num b er of tests than utilities that implemen t standard mixtures. The b ene- fits of inhomogeneous markets of isoelastic agen ts ov er state of the art classifiers has b een demonstrated, and the understanding of iso elastic utilities as enco ding a generalisation of α -mixtures has b een developed. There are t wo immediate extensions to this w ork to be considered. First, the adaptability of markets means that tests of this approach in the context of dataset shift, or non-stationary en vironments, would b e v alu- able. Another angle worth y of in vestigation is the mix- ture of exp ert setting. In the context of this pap er, all agen ts had b eliefs ab out the whole predictive dataset. It is likely that an agent will also learn about its o wn p erformance in the market: assessing what situations it is lik ely to generate a p ositiv e return on. Such agents w ould allo cate different resources to different condi- tional situations akin to a mixture of exp erts. References Ab erneth y , J. and F rongillo, R. A collab orativ e mec hanism for crowdsourcing prediction problems. In A dvanc es in NIPS 24 (NIPS2011) , 2011. Ab erneth y , J., Chen, Y., and W ortman V aughan, J. An optimization-based framew ork for automated mark et- making. In 12th ACM Confer enc e on Ele ctr onic Com- mer c e (EC 2011) , 2011. Agra wal, S., Megiddo, N., and Arm bruster, B. Equilibrium in prediction mark ets with buy ers and sellers. Ec onomics L etters , 109:46–49, 2010. Amari, S. Integration of sto c hastic mo dels by minimizing α -div ergence. Neur al Computation , 19(10):2780–2796, 2007. Arro w, K.J. and Debreu, G. Existence of an equilibrium for a comp etitive economy . Ec onometric a: Journal of the Econometric So ciety , 22(3):265–290, 1954. Arro w, K.J. et al. The promise of prediction markets. Sci- enc e , 320:877, 2008. Barbu, A. and Lay , N. An in tro duction to artificial predic- tion markets for classification. arXiv:1102.1465v3, 2011. Bell, R.M. and Koren, Y. Lessons from the Netflix prize c hallenge. ACM SIGKDD Explorations , 9(2):75–79, 2007. Beygelzimer, A., Langford, J., and Pennock, D. Learning p erformance of prediction mark ets with k elly b ettors. In Pr o c e e dings of AAMAS 2012 , 2012. Brahma, A., Das, S., and Magdon-Ismail, M. Compar- ing prediction market structures, with an application to mark et making. arXiv:1009.1446, 2010. Caruana, R. and Niculescu-Mizil, A. An empirical compar- ison of sup ervised learning algorithms. In Pr o c e e dings of ICML 2006 , 2006. Chen, Y. and W ortman V aughan, J. A new understanding of prediction markets via no-regret learning. In Pro- c e e dings of the 11th ACM c onfer enc e on Ele ctr onic c om- mer c e , 2010. Cole, R. and Fleischer, L. F ast-conv erging tatonnement algorithms for the market problem. T ec hnical rep ort, Dept. Computer Science. Dartmouth College., 2007. Dani, V. et al. An empirical comparison of algorithms for aggregating exp ert predictions. In Pr o c e e dings of the Confer enc e on Unc ertainty in AI (UAI) , 2006. Deng, X., Papadimitriou, C., Sab eri, A., and V azirani, V. On the complexity of equilibria. In STOC 2002 , 2002. Dev an ur, N.R., Papadimitriou, C.H., Sab eri, A., and V aziani, V.V. Market equilibrium via a primal–dual al- gorithm for a conv ex program. Journal of the ACM , 55: 22:1–22:18, 2008. Domingos, Pedro. Why does bagging work? a Bay esian accoun t and its implications. In Pr o c e e dings KDD , 1997. Domingos, Pedro. Bay esian av eraging of classifiers and the o verfitting problem. In In Pro c. ICML 2000 , 2000. Fleisc her, L., Garg, R., Kap oor, S., Khandek ar, R., and Sab eri, A. A fast and simple algorithm for computing mark et equilibria. In Pr o c e e dings of WINE , pp. 19–30, 2008. Jumadino v a, J. and Dasgupta, P . A m ulti-agent system for analyzing the effect of information on prediction mar- k ets. International Journal of Intel ligent Systems , 26: 383–409, 2011. La y , N. and Barbu, A. Sup ervised aggregation of classi- fiers using artificial prediction mark ets. In Pr o c e e dings of ICML , 2010. Ledy ard, J and Hanson, R. An exp erimen tal test of com- binatorial information markets. Journal of Ec onomic Behavior and Or ganization , pp. 469–483, 2008. Lee, D.S. and Moretti, E. Ba yesian learning and the pricing of new information: Evidence from prediction markets. Americ an Ec onomic R eview , 99(2):330–336, 2009. Manski, C.F. Interpreting the predictions of prediction mark ets. Ec onomics L etters , 91:425429, 2006. Mink a, T. Ba yesian mo del av eraging is not model combi- nation. T echnical rep ort, MIT Media Lab Note, 2002. Otta viani, M. and Sørensen, P .N. Aggregation of informa- tion and b eliefs in prediction markets. FR U W orking P ap ers, 2007. P enno c k, D.M. and W ellman, M.P . Representing aggregate b elief through the comp etitiv e equilibrium of a securities mark et. In Pr o c e e dings of the Thirte enth Confer enc e on Unc ertainty in AI , pp. 392–400, 1997. Sam uelson, P .A. F oundations of Ec onomic Analysis . Har- v ard Universit y Press, 1947. Stork ey , A.J. Machine Learning Mark ets. In Pr o c e e dings of Artificial Intel ligenc e and Statistics , volume 15. Journal of Machine Learning Research W&CP , 2011. Tseng, J.J., Lin, C.H., Lin, C.T., W ang, S.C., and Li, S.P . Statistical prop erties of agen t-based mo dels in mark ets with contin uous double auction mechanism. Physic a A: Statistic al Me chanics and its Applic ations , 389(8):1699– 1707, 2010. V azirani, V. Combinatorial algorithms for market equilib- ria. In et al., N. Nisan (ed.), Algorithmic Game Theory . Cam bridge Universit y Press, 2007. W olfers, J. and Zitzewitz, E. Prediction markets. Journal of Economic Persp e ctives , 1:107–126, 2004. W u, D. Parameter estimation for α -GMM based on max- im um likelihoo d criterion. Neur al c omputation , 21(6): 1776–1795, 2009. Y e, Y. A path to the Arro w-Debreu comp etitiv e market equilibrium. Mathematic al Pro gr amming , 2006.
Original Paper
Loading high-quality paper...
Comments & Academic Discussion
Loading comments...
Leave a Comment