Discriminating different classes of biological networks by analyzing the graphs spectra distribution
The brain's structural and functional systems, protein-protein interaction, and gene networks are examples of biological systems that share some features of complex networks, such as highly connected nodes, modularity, and small-world topology. Recen…
Authors: Daniel Yasumasa Takahashi, Jo~ao Ricardo Sato, Carlos Eduardo Ferreira
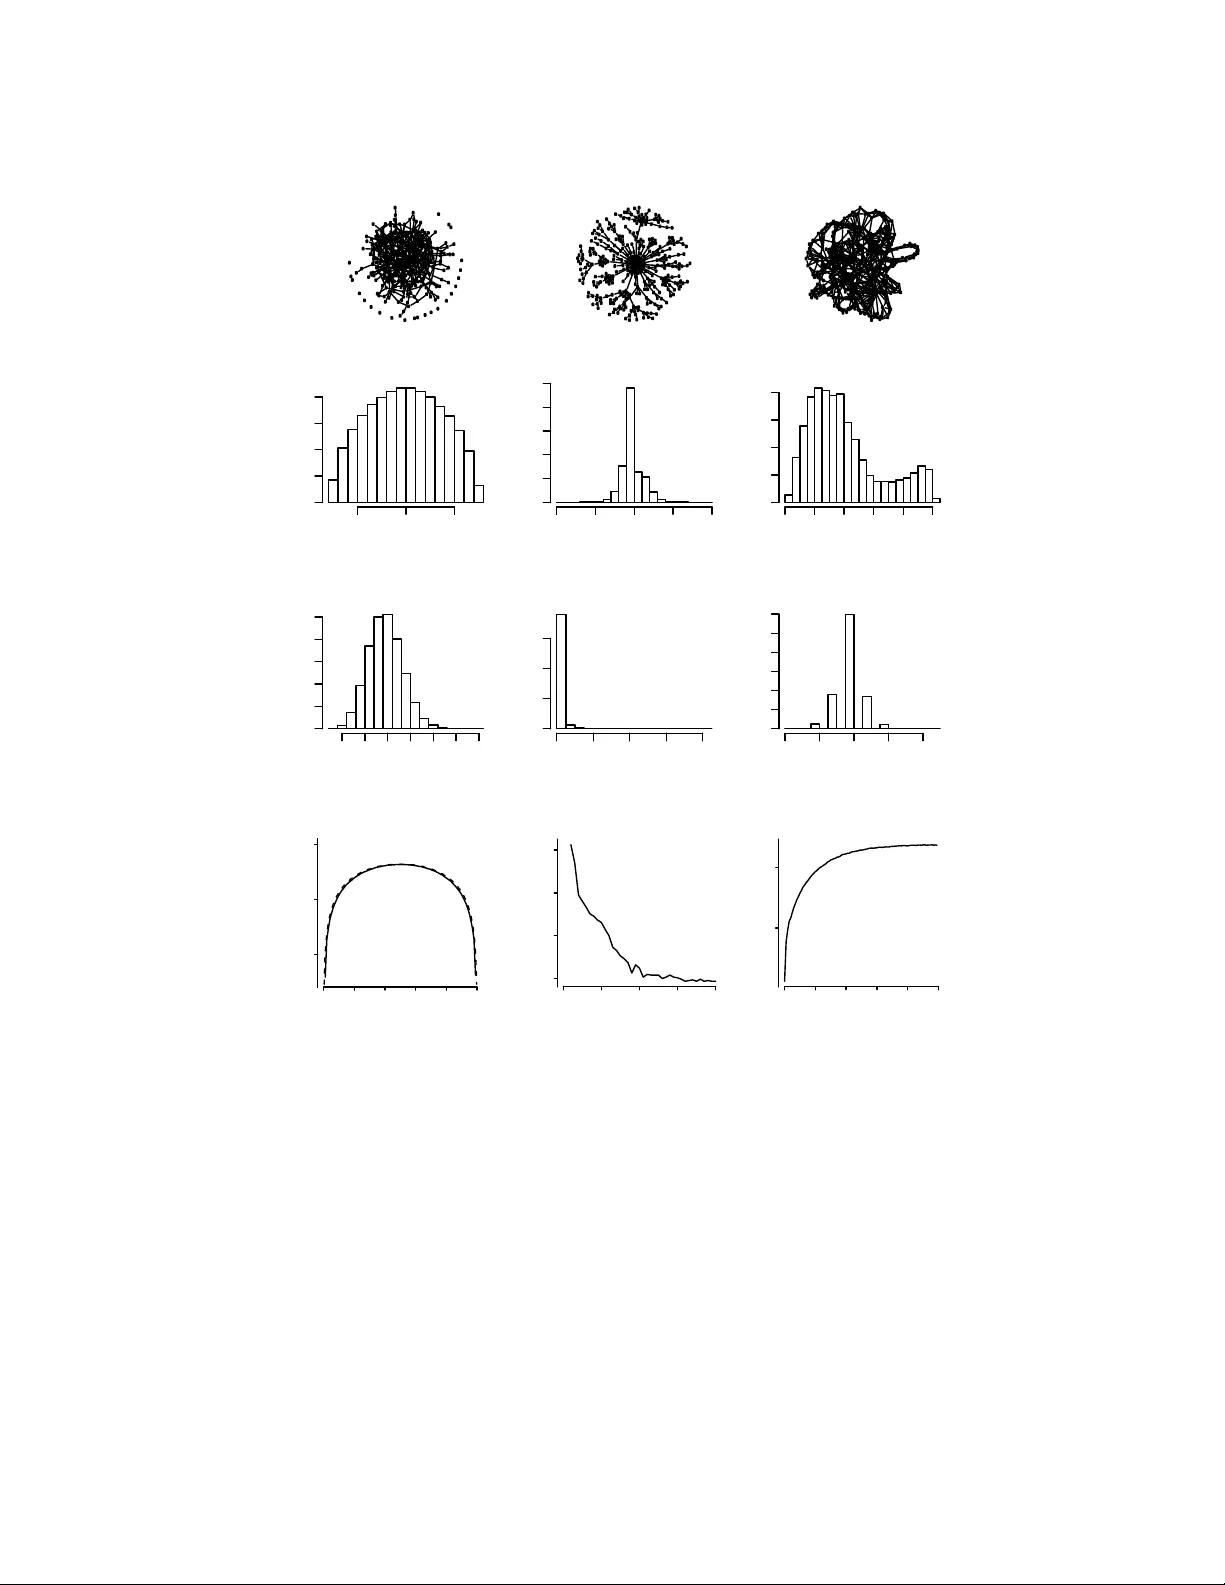
Discriminating differen t classes of biological net w orks b y analyzing the graphs sp ectra distribution Daniel Y asumasa T ak ahashi 1 , Jo˜ ao Ricardo Sato 2 , Carlos Eduardo F erreira 3 , Andr ´ e F ujita 3 ∗ 1 Dep artment of Psycholo gy and Neur oscienc e Institute, Gr e en Hal l, Princ eton University, NJ 08540 Princ eton, USA. 2 Center of Mathematics, Computation, and Co gnition, F e der al University of ABC, R ua Santa A d ´ elia, 166, Santo Andr ´ e, 09210-170, Br azil. 3 Dep artment of Computer Scienc e, Institute of Mathematics and Statistics, University of S˜ ao Paulo, Rua do Mat˜ ao, 1010 - Cidade Universit´ aria, S˜ ao Paulo - SP, 05508-090, Br azil. ∗ T o whom c orr esp ondenc e should b e addr esse d. The brain’s structural and functional systems, protein-protein in teraction, and gene net works are examples of biological systems that share some features of com- plex net works, such as highly connected nodes, modularity , and small-world topology . Recen t studies indicate that some pathologies presen t topological net work alterations relativ e to norms seen in the general p opulation. Therefore, metho ds to discrimi- nate the processes that generate the different classes of net works ( e.g. , normal and disease) migh t b e crucial for the diagnosis, prognosis, and treatmen t of the disease. It is known that sev eral top ological prop erties of a netw ork (graph) can b e describ ed b y the distribution of the sp ectrum of its adjacency matrix. Moreov er, large net- w orks generated by the same random pro cess hav e the same sp ectrum distribution, allo wing us to use it as a “fingerprin t”. Based on this relationship, we introduce and prop ose the entrop y of a graph sp ectrum to measure the “uncertaint y” of a random graph and the Kullback-Leibler and Jensen-Shannon divergences b et ween graph sp ectra to compare net works. W e also introduce general metho ds for mo del selection and netw ork mo del parameter estimation, as well as a statistical pro cedure to test the nullit y of div ergence b et ween tw o classes of complex net w orks. Finally , we demonstrate the usefulness of the prop osed metho ds b y applying them on (1) protein- protein in teraction netw orks of different sp ecies and (2) on netw orks derived from 2 c hildren diagnosed with Atten tion Deficit Hyp eractivit y Disorder (ADHD) and typi- cally dev eloping children. W e conclude that scale-free netw orks b est describ e all the protein-protein in teractions. Also, w e sho w that our proposed measures succeeded in the iden tification of top ological changes in the netw ork while other commonly used measures (num b er of edges, clustering co efficien t, av erage path length) failed. I. A UTHOR SUMMAR Y There is increasing evidence that there exist tight relationships b et w een neuronal or genetic diseases and top ological changes in brain connectivity or gene regulatory netw orks, resp ectiv ely . Ho wev er, the comparison b etw een health y v ersus disease netw orks cannot b e carried out directly by v erifying for the presence or absence of each in teraction, b ecause there are topological differences within health y p eople and also within patien ts. Even p eople b elonging to the same group presen t different neuronal or genetic top ological features in their net works that make them unique. Therefore, it b ecomes crucial to dev elop metho ds that are able to compare not just the top ological features of the net w ork, but that can verify whether t wo netw orks are generated b y the same process or not. T o this end, we dev elop ed statistical metho ds that succeeded in the identification of differences b et ween typically developing c hildren and those diagnosed with Atten tion Deficit Hyp eractivit y Disorder. The same set of metho ds w as used to decide whether protein-protein in teraction net works of differen t sp ecies are b etter describ ed by Erd¨ os-Renyi, scale-free, or small-world netw orks. I I. INTR ODUCTION In the last decades, attempts to understand the mec hanisms that determine the top ol- ogy of complex real world net works using random graphs (graphs that are generated b y some random pro cess) has gained muc h attention 7 . Some examples of complex netw orks are the W orld Wide W eb 17 , human so cial net w orks 32 , protein-protein in teraction net works 22 , metab olic netw orks 16 , and brain connectivity netw orks 10 . On studying these complex net- w orks, some questions naturally arise. F or example, how complex is a given random graph? Ho w differen t are tw o random graphs? Given a realization of a random graph, how can one infer whic h random graph pro cesses generated it? A ttempts to answer some of these ques- 3 tions hav e b een made on purely theoretical grounds 23 , but in terestingly , to the b est of our kno wledge, no simple and robust pro cedure exists to answer these questions using empirical data sets. Our aim in this work is to introduce such pro cedures. In teractions are essen tial to understand complex systems where, to determine the be- ha vior of the system, it is imp ortan t to understand the wa y each comp onen t of the system in teracts with others. F or most classes of complex systems, interactions are neither in v arian t in time nor across systems from the same class. F or example, neural netw orks in the cortex of the same individual can c hange in time, and synaptic organization is differen t among indi- viduals. Therefore, a searc h for an exact common net work structure seems to b e unfruitful. What seems to b e in v ariant are some statistical features that can b e repro duced in classes of random graphs; therefore, the corresp onding ensemble of random graphs can b e used as a plausible mo del for an ensem ble of cortical netw orks. Tw o random graph mo dels that are widely used to mo del natural phenomena are the scale-free 4 and the small-w orld netw orks 34 . The main c haracteristics of these random graphs are the non-trivial top ological features that differ from the Erd¨ os-R´ en yi random graphs 12 , i.e., complex net works presen t heavy tail in the degree distribution, high clustering co effi- cien t, comm unity , and hierarc hical structures and short path lengths. Usually , the scale-free net work is characterized by its p o wer-la w degree distribution while the small-world netw ork presen ts short path length and high clustering. How ev er, although these characteristics are essen tial features of these random graphs, they are not sufficien t to unambiguously iden tify a graph as b elonging to a particular class. F or example, small-world net works are highly clustered like regular lattices and hav e small characteristic path lengths like Erd¨ os-R´ en yi random graphs. In this w ork w e prop ose that the random graph sp ectrum, i.e., the ensemble av erage of the eigen v alues of the adjacency matrix, is a b etter and more general c haracterization of complex net works in comparison with other commonly used measures: n um b er of edges, clustering co efficien t, and av erage path length. F or instance, it is known that several top ological prop erties of a random graph, such as the num b er of walks, diameter, and cliques can b e describ ed b y the sp ectrum of its adjacency matrix 23 . Based on this relationship b et w een the top ological prop erties of the random graph and its sp ectrum, w e introduce the definition of entrop y of a random graph sp ectrum and the Kullbac k-Leibler div ergence b et ween tw o random graph sp ectra. By sim ulation exp erimen ts, we observe that the entrop y of random 4 graph sp ectrum is related to the intuitiv e idea of amount of uncertaint y of a random graph and that the Kullback-Leibler div ergence b et w een random graph sp ectra can discriminate t wo random graphs that were generated by different random pro cess. Statistical approac hes suc h as model selection, parameter estimation, and hypothesis test- ing to discriminate tw o classes of random graphs are also presented. W e illustrate practical use of the mo del selection approach in protein-protein in teraction netw orks of eight differen t sp ecies. By analyzing the random graph sp ectrum instead of the degree distribution, we classified all the eight protein-protein in teraction net works as scale-free graphs. Finally , the p o w er of Kullbac k-Leibler based statistical test is illustrated by an application in net works deriv ed from children with Atten tion Deficit Hyp eractivit y Disorder and with typical devel- opmen t. W e succeeded in the identification of top ological c hanges b et ween children with t ypical developmen t and ADHD patien ts, while standard measures such as n umber of edges, clustering co efficien t and av erage path length failed. Definition of graphs and graph sp ectrum A gr aph is a pair of sets G = ( P , E ), where P is a set of n no des and E is a set of m edges that connect tw o no des (elements of P ). A random graph g is a family of graphs, where eac h member of the family is generated by some probability la w. Among several classes of random graphs, there are three that ha ve known imp ortance due to their capabilit y to mo del real world ev en ts, namely , Erd¨ os-R ´ en yi random (Figure 1a) 12 , scale-free (Figure 1b) 4 , and small-world graphs (Figure 1c) 34 . Erd¨ os-R ´ en yi random graphs are the simplest ones in terms of construction. Erd¨ os and R ´ en yi define a random graph as n lab eled no des in which eac h pair of nodes ( i, j ) is connected b y an edge with a giv en probability p . Scale-free netw orks, prop osed by Barab´ asi and Alb ert (1999), ha ve a p o wer-la w degree distribution due to no de preferential attac hment. Barab´ asi and Alb ert (1999) prop osed the follo wing construction of a scale-free netw ork: start with a small num b er of ( n 0 ) no des and at every time-step, add a new no de with m 1 ( ≤ n 0 ) edges that link the new no de to m 1 differen t no des already present in the system. When choosing the no des to whic h the new no de connects, assume that the probability that a new no de will b e connected to no de i is prop ortional to the degree of no de i and the scaling exp onen t p s whic h indicates the order of the prop ortionalit y ( p s = 1 linear, p s = 2 quadratic and son on). 5 (a) Er dös−Ré n yi (b) Scale−free (c) Small− world Eigenv alue Spectral density −5 0 5 0.00 0.04 0.08 Eigenv alue −10 −5 0 5 10 0.0 0.2 0.4 Eigenv alue −4 −2 0 2 4 6 0.0 0.1 0.2 Degree 5 10 20 30 0.00 0.04 0.08 Degree density Degree 0 20 40 60 80 0.0 0.1 Degree 2 4 6 8 10 0.0 0.4 0.8 1.2 Probability (p) Entropy Probability (p r ) Scaling exponent (p s ) 0.0 0.2 0.4 0.6 0.8 1.0 1 2 3 4 5 0.0 0.2 0.4 0.6 0.8 1.0 −0.25 −0.20 −0.15 −0.10 −0.052 −0.048 −1.0 0.0 1.0 FIG. 1: Illustrative figure of the three different complex net work mo dels (a) Erd¨ os-R ´ en yi; (b) Scale- free; and (c) Small-world and their resp ectiv e sp ectra, degree distributions, and en tropies, in this order from top to b ottom. The estimated entropies are computed for the resp ectiv e graph type for the resp ectiv e parameters (probability p for the Erd¨ os-R´ en yi, scaling exp onent p s for the scale-free, and probabilit y p r for the small-world random graphs). In (a) the entrop y v alues estimated from the simulation data is depicted b y a solid line and the theoretical v alue of the entrop y computed using equation 4 is indicated by a dashed line. 6 Small-w orld graphs, prop osed by W atts and Strogatz (1998) are one-parameter mo dels that interpolate b et w een a regular lattice and an Erd¨ os-R´ enyi random graph 25 . First, a ring lattice with n no des is constructed, in whic h ev ery no de is connected to its first K neigh b ors ( K/ 2 on either side). Then, w e choose a vertex and the edge that connects it to its nearest neighbor in a clo ckwise sense. With probability p s w e reconnect this edge to a v ertex chosen uniformly at random ov er the en tire ring. This pro cess is rep eated b y moving clo c kwise around the ring, considering each vertex in turn until one lap is completed. Next, the edges that connect vertices to their second-nearest neighbors clo c kwise are considered. As the previous step, each edge is randomly rewired with probability p s , and contin ue this pro cess, circulating around the ring and pro ceeding outw ard to more distant neigh b ors after eac h lap, un til each edge in the original lattice has b een considered once 34 . An y undirected graph G with n no des can b e represented by its adjacency matrix A ( G ) with n × n elemen ts A ij , whose v alue is A ij = A j i = 1 if no des i and j are connected, and 0 otherwise. The sp e ctrum of graph G is the set of eigenv alues of its adjacency matrix A ( G ). A graph with n no des has n real eigenv alues λ 1 ≥ λ 2 ≥ . . . ≥ λ n . Now, given a random graph g , the eigenv alues are random vectors for whic h w e can take the exp ectation with resp ect to the probability la w of the random graph. W e define the sp e ctr al density distribution of a random graph g as ρ g ( λ ) = lim n →∞ * 1 n n X j =1 δ ( λ − λ j / √ n ) + , (1) where δ is the Dirac delta function and the brack ets “ hi ” indicate the exp ectation with resp ect to the probability law of the random graph. In what follows, w e use the shorthand name sp ectrum of g to indicate ρ g . The in terest in sp ectral prop erties is related to the fact that the sp ectral density can b e directly related to the graph’s top ological features 2 . In application, a closed form for the sp ectral density is rarely a v ailable, so we ha v e to rely on some statistical estimators ˆ ρ g . In order to estimate the sp ectral densities, first the eigen v alues are computed, and then Gaussian kernel regression using the Nadara ya- W atson estimator 24 is applied for the regularization of the estimator. Finally , the densit y is normalized to obtain the integral b elo w the curve equal to one. The bandwidth of the k ernel can b e chosen by (max(eigenv alues) - min(eigen v alues))/num b er of bins 29 , where the n umber of bins can b e selected b y using an y ob jective criterion. In this work, w e used the 7 Sturges’ criterion 31 . It is worth men tioning that the study of sp ectral densit y distribution of complex net works is still an active area of researc h 9,23 , but the aim has b een in general to obtain the exact or approximate prop erties of sp ectrum distribution for a given mo del. In this article, we are instead concerned with their statistical prop erties and applications to crucial biological systems. I I I. RESUL TS First w e will presen t the definitions of entrop y and div ergence for graphs sp ectra, along with statistical metho ds for estimation and significance testing. Then, the p erformance of eac h metho d is ev aluated by simulations and finally applied to actual data for illustration. En trop y of graph sp ectrum Let ρ g b e the sp ectrum of a random graph g . W e define the sp e ctr al entr opy H ( ρ g ) as H ( ρ g ) = − Z + ∞ −∞ ρ g ( λ ) log ρ g ( λ ) dλ, (2) where, as usual, we assume 0 log 0 = 0. Observe that the entrop y defined ab o ve is also kno wn as differential entrop y 8 and can assume negative v alues, in contrast to the en trop y defined for discrete distributions. Since the sp ectral density of an adjacency matrix of a random graph has a tigh t relation- ship with the random graph structure and can b e considered a fingerprint of the random graph 23 , we prop ose that the corresp onding sp ectral entrop y also describ es imp ortan t char- acteristics of the random graph. More sp ecifically , we prop ose that the sp ectral en tropy measures a form of “uncertain ty” asso ciated to the random graph. T o gain some intuition, w e can compute the approximate sp ectral en tropy for the Erd¨ os-R ´ en yi random graph g with parameter p as follows. F or large n , we ha ve ρ g ( λ ) ∼ p 4 p (1 − p ) − λ 2 2 π p (1 − p ) (3) for 0 < | λ | < 2 p ( p (1 − p )) and 0 otherwise 36,37 . Using the ab o ve appro ximation, w e hav e 8 that H ( ρ g ) ∼ 1 2 ln(4 π 2 p (1 − p )) − 1 2 . (4) This formula shows that the maxim um sp ectral entrop y for the Erd¨ os-R ´ en yi graph is ac hieved for p = 0 . 5, which is in accordance to the in tuition that this is the mo del with the largest uncertain ty . T o confirm our p oin t, the Erd¨ os-R ´ en yi random graph sp ectral entrop y w as calculated for man y different v alues of probabilit y p (b ottom panel Figure 1a, dashed line). F or the Erd¨ os-R ´ en yi graphs, not surprisingly , the en tropy ac hieved its maximum v alue on p = 0 . 5, and the minimum v alues on p = 0 and p = 1, whic h is the situation where there is only one p ossible graph, i.e., the empty and complete graphs, resp ectiv ely (Figure 1a). F urthermore, it is imp ortan t to p oin t out that the entrop y function is symmetric due to the symmetry of the sp ectrum function, i.e., the sp ectral densit y of the Erd¨ os-R´ enyi graph generated with parameter p is equal to the sp ectral density of the Erd¨ os-R´ en yi graph generated with parameter 1 − p . F or the scale-free and small-world netw orks, an exact formula for the sp ectral entrop y is not known, therefore, w e estimated the en tropy for differen t parameters of the mo dels. A straigh tforward w ay to obtain an estimator ˆ H ( ρ g ) for the sp ectral en tropy is to first obtain an estimator ˆ ρ ( λ ) of ρ ( λ ) and plug in to the equation (2). This is the pro cedure adopted in this w ork. T o v erify the accuracy of our estimator we compared the a verage estimated en tropy v alues for 100 Erd¨ os-R ´ en yi random graphs with 500 no des (b ottom panel Figure 1a, solid line) and the theoretical v alue in equation 4 (b ottom panel Figure 1a, dashed line). A visual insp ection shows that the estimator is very accurate. The av erage bias for this example was − 0 . 015, i.e., a small negative bias. F or the scale-free graphs we observ e (Figure 1b) that the estimated en tropy is higher in low scaling exp onen ts ( p s ) b ecause it b ecomes similar to an Erd¨ os-R´ en yi random graph, whereas when the scaling exp onen t go es to infinity it b ecomes closer to a complete bipartite graph resulting in a low er en tropy . Finally , for small-world graphs (Figure 1c), the entrop y is higher when the randomness of the graph (probabilit y p r ) increases. Notice that when p r = 1, the small-world graph b ecomes an Erd¨ os-R´ en yi graph, whereas when p r = 0 the graph is a ring 34 , therefore presenting low er entrop y . F or b oth scale-free and small-w orld graphs, the n umber of no des and edges were set to 500 and 600, resp ectiv ely , and for eac h scaling exp onent ( p s ) or probability ( p r ), an av erage entrop y of 100 graphs w ere calculated. 9 Kullbac k-Leibler divergence b etw een graphs Once the sp ectral en tropy is defined, one may in tro duce a measure of similarity b et w een t wo sp ectral densities, which is also a measure of similarity b et ween t w o random graphs. It is clear that if t wo sp ectral densities are differen t, then the resp ectiv e graphs should b e differen t, although the con v erse is not alw ays true (i.e., there are non-isomorphic graphs whic h are isosp ectral). W e define the Kul lb ack-L eibler diver genc e (for sake of brevity we call it KL divergence) b et w een tw o sp ectral densities ρ g 1 and ρ g 2 as K L ( ρ g 1 | ρ g 2 ) = Z + ∞ −∞ ρ g 1 ( λ ) log ρ g 1 ( λ ) ρ g 2 ( λ ) dλ, (5) if the supp ort of ρ g 2 con tains the supp ort of ρ g 1 . Otherwise, K L ( ρ g 1 | ρ g 2 ) = + ∞ . As usual, w e assume 0 log 0 0 = 0. F or the ab o v e equation, ρ g 2 is called the r efer enc e me asur e . This div ergence is asymmetric and non-negative. It is also zero if and only if ρ g 1 and ρ g 2 are equal. The KL div ergence can b e interpreted as a measure of discrepancy b etw een tw o random graphs, thus can b e used to build an estimator for the parameter of a mo del giv en an observ ation. Sp ecifically , let g b e a random graph with sp ectral density ρ g . Also let { ρ θ } b e a parametric family of sp ectral distributions indexed by a real vector θ . Assume that there exists a v alue of the parameter θ , which w e denote θ ∗ that minimizes K L ( ρ g | ρ θ ). An estimator ˆ θ of θ ∗ is given by ˆ θ = arg min θ K L ( ˆ ρ g | ρ θ ) . (6) The idea is that among all p ossible c hoices of mo dels in a parametric class of random graphs ρ θ , we c ho ose the one for which the corresp onding sp ectral densit y minimizes the div ergence with the non-parametrically estimated spectral density . This is in the same spirit as nonparametric likelihoo d estimators of whic h the Whittle estimator is an example 35 . T o sho w the p erformance of our estimator, differen t complex netw ork mo dels (Erd¨ os- R ´ en yi, scale-free, and small-w orld) with sizes equal to 50, 100, 200, and 300 no des w ere sim ulated. The parameters to b e estimated for each random graph mo del are: the probability p of connecting t wo no des for Erd¨ os-R ´ en yi graphs, the scaling exp onen t of the preferential attac hment p s for scale-free graphs, and the rewiring probability p r for small-world graphs. 10 The estimated parameters w ere a veraged v alues calculated for 50 repetitions, and the results are shown in T able I. Brack ets indicate one standard deviation. F rom the results in T able I, w e conclude that the estimator is reasonable and it can recov er the correct parameter with relativ ely small bias and v ariance, i.e., one or tw o order of magnitudes smaller than the v alue of the estimated parameter. W e observ e from T able I and further simulations not sho wn here that the direction of the bias dep end on the sp ecific parameter of the mo del and size of the graph, and therefore no systematic bias direction seems to exist. The p erformance of the estimator is further discussed in Section IV T ABLE I: Average parameters estimated by minimum distance estimator based on KL divergence for Erd¨ os-R´ enyi random, scale-free, and small-world graphs. One standard deviations are indicated b et w een brac kets. Calculations w ere carried out for 50 rep etitions. The parameters to be estimated for each graph mo del are: the probability p of connecting tw o no des for Erd¨ os-R´ en yi graphs, the p o w er of the preferential attachmen t p s for scale-free graphs, and the rewiring probability p r for small-w orld graphs. Random ( p ) Scale-free ( p s ) Small-world ( p r ) Num b er of no des / true parameters 0.50 1.50 0.30 50 0.51 (0.04) 1.53 (0.06) 0.33 (0.05) 100 0.50 (0.03) 1.53 (0.05) 0.33 (0.03) 200 0.50 (0.03) 1.56 (0.03) 0.34 (0.03) 300 0.50 (0.03) 1.55 (0.05) 0.34 (0.03) 500 0.50 (0.02) 1.54 (0.04) 0.33 (0.03) Another use of the KL is to build a model selection criterion to select goo d mo dels among a set of candidate random graphs. More sp ecifically , given a graph, it is imp ortant to decide if the graph can b e b etter predicted b y an Erd¨ os-R ´ en yi, scale-free, or small-world netw orks. The KL div ergence b et w een the given graph sp ectrum and the sp ectrum of different classes of graphs can b e interpreted as the quality of fitting the graph to the mo del. Giv en a graph g and its sp ectrum ρ g , sev eral candidate graph models ma y be rank ed according to their KL divergence v alues and the mo dels with smaller KL div ergence v alues should b e considered as go o d candidates to explain the data. Th us, KL div ergence provides an ob jective comparison among mo dels, i.e., a tool for mo del selection. Sp ecifically , let ˆ ρ g b e 11 the empirical sp ectral distribution and { ρ θ 1 } , . . . , { ρ θ m } b e m different parametric families of sp ectral distributions. Let ˆ θ i for i = 1 , . . . , m b e the estimators giv en in equation 6. W e denote by #( θ i ) the dimension of θ i . The b est candidate mo del ˆ θ j is chosen by j = arg min i 2 K L ( ˆ ρ | ρ ˆ θ i ) + 2#( ˆ θ i ) (7) The motiv ation for this criterion is the AIC (Ak aike Information Criterion) 1 mo del se- lection criterion. Informally , the mo del that minimizes equation 7 is the one that has the most similar sp ectral distribution when compared to the sp ectral distribution of the data. The p enalization term 2#( ˆ θ i ) is added to a void o verfitting. The three random graph mo dels analyzed here ha ve the same num b er of parameters; therefore, the p enalization term is not required. Sim ulations were carried out in order to verify the accuracy of the prop osed mo del selec- tion approach. T en thousand graphs of eac h class w ere generated and classified as Erd¨ os- R ´ en yi, scale-free, or small-w orld by the mo del selection approac h. The graph size v aried from 10 to 120 no des. Figure 2 illustrates the p erformance of the mo del selection metho d. F or all graph class (Erd¨ os-R´ en yi (Figure 2a), scale-free (Figure 2b) or small-world (Figure 2c)), when the num b er of no des increases, the correct prop ortion of hits also increases, demonstrating that the metho d is consisten t and improv es with the graph size. Usually , in real applications, complex net works are comp osed of hundreds to thousands of no des. In Figure 2, we observ e that the accuracy is high ev en for graphs smaller than 100 no des. Indeed, this implies that the prop osed mo del selection metho d should b e useful for applications in data set with realistic data size. In terestingly , the p erformance to identify small-world graphs is very high, close to 100% ev en when the graph is v ery small (10 no des). This is probably due to the sp ecific algorithm to construct suc h a graph. Remember that the construction of a small-world graph based on W atts-Strogatz algorithm starts with a deterministic step, i.e., a ring lattice with n no des whic h every no de is connected to its first K neighbors ( K / 2 on either side). It is lik ely that this first step mak es this type of graph different whether compared to Erd¨ os-R´ en yi or scale-free graphs that are totally non-deterministic. 12 20 40 60 80 100 0 20 60 100 (a) Number of nodes Selection frequency (%) 20 40 60 80 100 0 20 60 100 (b) Number of nodes Selection frequency (%) 20 40 60 80 100 0 20 60 100 (c) Number of nodes Selection frequency (%) random scale-free small-world FIG. 2: Figure illustrating the performance of the mo del selection approac h. Giv en a graph b elonging to (a) Erd¨ os-R ´ enyi with parameter p = 0 . 3, (b) scale-free with parameter p s = 1, and (c) small-w orld with parameter p r =0.3, the solid, dashed, and dotted lines represent the prop ortion of graphs classified as Erd¨ os-R´ en yi, scale-free, and small-world, resp ectively . Notice that the larger is the graph, the higher is the prop ortion of correct hits, showing that the mo del selection approac h is consistent. F or each graph size (10, 20, 30, 40, 50, 60, 70, 80, 90, 100, 110, 120 no des), 1,000 rep etitions were carried out. Jensen-Shannon divergence Giv en tw o random graphs g 1 and g 2 , no w we would lik e to define a notion of distance b et w een them based on entrop y . In other w ords, w e are in terested in identifying graphs that are generated by the same random pro cess instead of isomorphism in graphs (an isomorphism of graphs g 1 and g 2 is a bijection f from the vertex sets of g 1 to the v ertex sets of g 2 suc h that any tw o vertices u and v of g 1 are adjacent if and only if f ( u ) and f ( v ) are adjacen t in g 2 ) The KL div ergence is suited for the purp ose of parameter estimation and mo del selec- tion as explained in previous section. Nevertheless, it is not symmetric, i.e., in general K L ( ρ 1 | ρ 2 ) 6 = K L ( ρ 2 | ρ 1 ). F or this reason, KL divergence is not suited when it is not clear whic h distribution is the reference distribution. This is indeed the case for statistical test comparing tw o graphs sp ectra ρ 1 and ρ 2 . W e would lik e to a void inconsistency in the results when considering K L ( ρ 1 | ρ 2 ) or K L ( ρ 2 | ρ 1 ). Therefore, we in tro duce the Jensen-Shannon diver genc e (JS) b et ween tw o sp ectral den- 13 sities ρ g 1 and ρ g 2 defined as J S ( ρ g 1 , ρ g 2 ) = 1 2 K L ( ρ g 1 | ρ M ) + 1 2 K L ( ρ g 2 | ρ M ) (8) where ρ M = 1 2 ( ρ g 1 + ρ g 2 ). This div ergence is symmetric and non-negativ e. It is also zero if and only if ρ g 1 and ρ g 2 are equal. Moreo v er, the square ro ot of the JS divergence satisfies the triangle inequality . It is natural to ask if the JS divergence b et w een tw o distributions is zero or not. Therefore, w e set the statistical test for JS divergence b et ween tw o sets of graphs sp ectra ρ g 1 and ρ g 2 as ( H 0 : J S ( ρ g 1 , ρ g 2 ) = 0 versus H 1 : J S ( ρ g 1 , ρ g 2 ) > 0). Details of the resp ectiv e b o otstrap- based test are provided in the Materials and Metho ds section. When a statistical test is prop osed, at least tw o prop erties m ust b e sho wn: the p o wer of the test under the alternativ e hypothesis ( H 1 ) and the con trol of the rate of false p ositives under the null hypothesis ( H 0 ). In order to chec k the p o w er of the statistical test, i.e., if the metho d based on the sp ectral distribution actually discriminates b etw een tw o sets of graphs characterized by sligh tly different parameters (details in the Materials and Metho ds section), R OC (Receiver Op erating Characteristic) curv es were constructed and compared to the test based on the degree distribution. The ROC curv e is useful in ev aluating the p o wer of the test and it consists in a bidimensional plot of sensitivit y (y-axis) versus 1 - sp ecificit y (x-axis), where sensitivit y = num b er of true p ositiv es/(num b er of true p ositiv es+num b er of false negatives) and sp ecificit y = n um b er of true negativ es/(n umber of true negatives + n um b er of false p ositiv es). The area b elo w the ROC curve is a quan titative summary of the p o wer of the test. In other w ords, an area closer to one (a curv e ab o ve the diagonal line) denotes high p o w er while an area close to 0.5 (a curve close to the diagonal line) is equiv alen t to random decisions. The top panels in Figure 3 illustrate the R OC curves with 10,000 rep etitions for eac h class (Erd¨ os-R´ enyi, scale-free, and small-w orld). The solid and dashed lines represen t the test based on the sp ectral and degree distributions, resp ectively . Despite the small differences b et ween the tw o conditions (parameters p 1 = 0 . 10 versus p 2 = 0 . 11 for Erd¨ os- R ´ en yi graphs; the scaling exp onen t p s 1 = 1 . 0 versus p s 2 = 1 . 1 for scale-free net works; and p r 1 = 0 . 30 versus p r 2 = 0 . 31 for small-world graphs) and relatively small sizes (100 no des), our statistical test based on the sp ectra was able to iden tify the graphs that w ere generated b y different sets of parameters with high accuracy as can b e observed by the R OC curves 14 0.0 0.2 0.4 0.6 0.8 1.0 0.0 0.4 0.8 (a) Er dös−Ré n yi 1−Specificity Sensitivity 0.0 0.2 0.4 0.6 0.8 1.0 0.0 0.4 0.8 (b) Scale−free 1−Specificity Sensitivity 0.0 0.2 0.4 0.6 0.8 1.0 0.0 0.4 0.8 (c) Small− world 1−Specificity Sensitivity p−value Density 0.0 0.2 0.4 0.6 0.8 1.0 0 200 400 p−value Density 0.0 0.2 0.4 0.6 0.8 1.0 0 200 400 p−value Density 0.0 0.2 0.4 0.6 0.8 1.0 0 200 400 FIG. 3: ROC curv e under the alternative hypothesis and p-v alue distribution under the null hy- p othesis for (a) Erd¨ os-R´ en yi graphs; (b) scale-free graphs, and (c) small-world graphs. Both ROC curv es and p-v alue distributions were constructed by analyzing 10,000 exp erimen ts. Solid and dashed lines represent the test based on the sp ectral and degree distributions, resp ectiv ely . clearly ab o ve the diagonal line. On the other hand, the statistical test based on the degree distribution w as equiv alen t to the sp ectra-based test only when the ev aluated net works w ere Erd¨ os-R ´ en yi graphs. When the degree-based test was applied to scale-free and small-world graphs, the discriminativ e p o w er w as not muc h b etter than by c hance, i.e., the ROC curves w ere close to the diagonal. This probably o ccurred b ecause the degree distribution is closely related to the n umber of edges while the sp ectrum is related to the whole structure of the graph. Notice that the parameter p of the Erd¨ os-R´ enyi graph is asso ciated to the n umber of edges, while the parameters p s of the scale-free net work and p r of the small-world netw ork are asso ciated to the structure of the graph. It is also necessary to verify if the b o otstrap-based test is actually controlling the rate of false p ositiv es under the null hypothesis, i.e., when b oth sets of graphs are generated by the 15 same mo del and same set of parameters. By simulating t wo random graphs g 1 and g 2 , each one generated b y the same mo del and parameters (see Materials and Metho ds section), and testing H 0 : J S ( ρ g 1 , ρ g 2 ) = 0 versus H 1 : J S ( ρ g 1 , ρ g 2 ) > 0, the p-v alue distribution should b e a uniform distribution. The uniform distribution of p-v alues illustrates that the rate of false p ositiv es is actually controlled under an y p-v alue threshold, since the uniform distribution emerges for p-v alues when the distribution of the null h yp othesis is correctly sp ecified by our b ootstrap pro cedure. Notice that for a p-v alue threshold set to 1%, it is exp ected to obtain 1% of false p ositiv es, for a threshold of 5%, 5% are exp ected to b e false p ositiv e and so on and so forth. The b ottom panels in Figure 3 show the p-v alue distributions (x-axis represen ts the p-v alues while the y-axis is the frequency or densit y of the resp ective p-v alue in 10,000 rep etitions under the null h yp othesis), one for each class (Erd¨ os-R ´ en yi, scale-free, and small-w orld), indicating that all of them are very similar to uniform distributions on [0 , 1] under the n ull hypothesis. In other words, the b o otstrap test is controlling the rate of false p ositiv es, as exp ected. Application to protein-protein in teraction net w ork In order to illustrate the mo del selection application in actual data, protein-protein in teraction data w ere do wnloaded from the DIP (Database of Interacting Proteins - h ttp://dip.do e-m bi.ucla.edu/dip/) on June 29th, 2011. The DIP database is comp osed of eigh t sp ecies namely , H. pylori (bacterium), R. norve gicus (rat), M. musculus (mouse), E. c oli (bacterium), C. ele gans (w orm), S. c er evisiae (y east), H. sapiens (h uman), D. melano gaster (fruit fly). All of them presen t different n umber of no des, edges, a verage degree, diameter, clustering co efficien t and av erage path length as can b e visualized in T a- ble I I. The adjacency matrices of graphs w ere constructed for each sp ecies and the set of eigen v alues with the corresp onding m ultiplicities w ere calculated. The sp ectral distributions of the eight sp ecies are display ed in Figure 4. W e ev aluate how successful our algorithm based on the graph sp ectrum and KL div ergence is by analyzing those protein-protein interaction netw orks that ha ve already b een classified as scale-free graphs by considering the degree distribution 18 . Remark ably , all the eigh t sp ecies w ere classified as scale-free net works by our mo del selection approac h based on the graph spectrum analysis (instead of the degree distribution) 16 H. pylori Spectral density −1 0 − 5 0 5 10 0 10 0 200 300 400 R. norvegicus −2 0 −1 0 0 1 0 20 0 10 0 200 300 400 500 600 M. musculus −2 0 −1 0 0 1 0 20 0 200 400 600 800 100 0 120 0 1400 E. coli −2 0 0 20 40 0 200 400 600 800 100 0 120 0 1400 C. elegans Eigenv alues Spectral density −1 5 − 5 0 5 1 0 15 0 500 100 0 150 0 2000 S. cerevisiae Eigenv alues −2 0 0 20 40 0 500 100 0 150 0 2000 2500 H. sapiens Eigenv alues −3 0 −1 0 0 1 0 20 30 0 100 0 2000 3000 4000 D. melanogaster Eigenv alues −1 0 0 1 0 20 0 100 0 2000 3000 4000 FIG. 4: The sp ectra distributions for the eigh t sp ecies ( H. pylori , R. norve gicus , M. musculus , E. c oli , C. ele gans , S. c er evisiae , H. sapiens , D. melano gaster ). 17 T ABLE II: The general characteristics of eight protein-protein interaction net works. F or eac h net work we indicate the num b er of no des, the num b er of edges, the a verage degree, the diameter, the clustering co efficien t and the av erage path length. Species Number of no des Number of edges Average degree Diameter Clustering co efficien t Average path length H. pylori 714 1,393 3.90 9 0.016 4.139 R. norve gicus 758 691 1.82 9 0.001 3.651 M. musculus 1,868 1,895 2.03 20 0.006 6.280 E. c oli 2,997 12,348 8.24 12 0.115 3.986 C. ele gans 3,183 5,068 3.18 13 0.012 4.803 S. c er evisiae 5,213 25,073 9.62 10 0.058 3.860 H. sapiens 5,940 14,144 4.76 17 0.017 4.755 D. melano gaster 7,931 23,386 5.90 12 0.012 4.468 (T able I I I) demonstrating that not only the degree distribution, but also the sp ectrum con tains information for classification. T ABLE I II: The estimated Kullback-Leibler divergence b et w een the eight sp ecies and the three random graph mo dels. In b old are the low est KL div ergence v alues. Species Erd¨ os-R´ enyi Scale-free Small-world H. pylori 15.07 1.46 11.36 R. norve gicus 134.67 100.47 118.67 M. musculus 14.10 6.93 24.51 E. c oli 21.15 1.91 17.90 C. ele gans 30.48 2.66 30.23 S. c er evisiae 24.21 0.87 18.25 H. sapiens 47.10 11.31 44.04 D. melano gaster 17.40 0.39 18.06 Application to neuroscience data Application of JS divergence measure (“distance” b et w een graphs) and its resp ectiv e sta- tistical test is illustrated in fMRI data of children diagnosed with A ttention Deficit Hyp erac- tivit y Disorder (ADHD) and children with t ypical developmen t. ADHD is a developmen tal disorder that affects at least 5-10% of children and is asso ciated with difficulty on staying fo cused, on paying atten tion, difficult y con trolling b eha vior, and hyperactivity 3 . Despite sev- eral efforts, there is no comprehensiv e mo del of this pathoph ysiology and the treatmen t is usually fo cused on medication that reduces the symptoms and impro v es functioning 30 . In or- 18 der to pro vide new insights for this disease b y using our prop osed metho dology , pre-processed functional magnetic resonance imaging (fMRI) data, from normal individuals and sub jects diagnosed with ADHD, w as do wnloaded from The Neuro Bureau as w ell as the ADHD- 200 consortium (h ttp://neurobureau.pro jects.nitrc.org/ADHD200/In tro duction.h tml). The data is based on monitoring the BOLD (blo o d oxygenation lev el dep endent) at differen t brain regions, whic h can b e considered as an indirect measure of lo cal neuronal activity 21 . The data was acquired under a resting state proto col, which is asso ciated with the observ a- tion of brain sp ontaneous activity 13 . P airwise Spearman correlation w as calculated among 351 mean signals at differen t regions (using CC400 Atlas, only regions larger than fiv e v oxels) and a threshold of p-v alue = 0.05 (after FDR correction 6 ) w as set to determine the existence of an edge. The correlation b et w een these regions describ es the functional connectivity of sp on taneous activity at these areas. In other words, an adjacency matrix for each sub ject w as constructed by considering a p-v alue < 0.05 as 1 and 0 otherwise. Netw ork top ological comparisons w ere carried out b et w een the 478 c hildren with t ypical developmen t against 158 with com bined type of ADHD (h yp eractiv e-impulsive and inattentiv e). Differences in the top ology b et w een children with t ypical developmen t and with ADHD w ere estimated by our approach based on graph sp ectral distribution and four robust and often used measures, namely num b er of edges, clustering co efficient, a verage path length, and degree distribution. The Wilco xon test was carried out in order to test differences in the num b er of edges, clustering coefficient, and the av erage path length. F or the degree distribution, w e applied the JS based test, similar to the one applied to test differences in the sp ectra. T able IV shows that no statistical evidences to discriminate the t wo groups of c hildren were identified by the num b er of edges (p-v alue = 0.82), clustering co efficien t (p- v alue = 0.85), and av erage path length (p-v alue = 0.87). Ho wev er, by analyzing the degree and sp ectral distributions (Figure 5), significant statistical differences were found (p-v alue = 0.031 for degree distribution and p-v alue = 0.024 for sp ectral distribution). In order to chec k whether the differences in the spectral distributions are not due to n umerical fluctuation, the control of the rate of false p ositiv es in biological data w as v erified. The set of 478 children with typical developmen t w as split randomly into t wo subsets, and the JS divergence test in graphs sp ectra w as applied b et w een these subsets. This pro cedure w as rep eated 10,000 times. The prop ortion of falsely rejected h yp othesis for p-v alues equal 19 T ABLE IV: Different metrics to measure graph discrepancy b etw een children with t ypical devel- opmen t and children with combined type of ADHD (hyperactive-impulsiv e and inattentiv e) and their resp ectiv e p-v alues. F or num b er of edges, clustering co efficien t and av erage path length, the Wilco xon test was carried out. F or degree and sp ectral distributions, the JS divergence with the b ootstrap test w as calculated. Num b er of edges Clustering co efficien t Av erage path length Degree distribution Sp ectrum normal vs ADHD 0.82 0.85 0.87 0.031 0.024 −50 0 50 100 200 −40 −30 −20 −10 (a) Eigenv alues Spectral density (log scale) (b) Degree Degree density (log scale) 0 50 100 150 200 250 300 −18 −14 −10 −6 150 250 FIG. 5: (a) Sp ectral and (b) degree distributions in the log-scale. Solid line represents the c hil- dren with typical dev elopment. Dashed line represents c hildren with combined type of ADHD (h yp eractiv e-impulsive and inattentiv e). to 0.1, 1, 5, and 10% were 0.16, 1.04, 5.55, and 11.05%, resp ectiv ely , confirming that the t yp e I error is effectiv ely con trolled in this biological data. Moreov er, in order to verify the site effect, the JS based test on the sp ectra was carried out among lab oratories. The tests w ere carried out under the null hypothesis, i.e., in t ypical dev elopment children datasets of differen t lab oratories. T able V shows the p-v alues after Bonferroni correction for multiple tests. Notice that since no null hypothesis was rejected (significance level of 0.05), there are no statistical evidences of site effect that may significantly affect our results. These results 20 suggest that the differences b et ween children with t ypical dev elopment and with ADHD graphs sp ectra are statistically significant. T ABLE V: P-v alues obtained by testing the Jensen-Shannon div ergence in the spectra distributions among different lab oratories. The tests were carried out under the null hypothesis, i.e., in t ypical dev elopment children datasets of differen t lab oratories. The lab oratories were num b ered from one to seven and the p-v alues are after Bonferroni correction for m ultiple tests. Labs. #2 #3 #4 #5 #6 #7 #1 0.9 1.0 0.2 1.0 1.0 1.0 #2 1.0 1.0 1.0 1.0 1.0 #3 1.0 1.0 1.0 1.0 #4 1.0 1.0 1.0 #5 1.0 1.0 #6 1.0 IV. DISCUSSION The top ology of the netw ork represents the set of in teractions b et ween the no des of the net work. The top ology affects the system’s dynamics and carries information ab out the functional needs of the system, its evolution and the role of each individual unit 14 . Therefore, net work analyses comparing con trol cases and disease cases is b ecoming a reference in the medical area 5 . Findings of significant differences when doing this comparison will colorred p ossibly lead to the improv emen t of diagnostic, prognostic, and therap y . Most of the netw ork analyses are based on algorithms that iden tify punctual c hanges (presence or absence of a certain edge) in their no de connectivity . How ever, in Systems Biology , differen t sub jects with the same disease may display top ologically different molec- ular netw orks or brain net works due to genetic v ariability rather than disease v ariability . Therefore, a single graph will probably not b e represen tative of the netw ork; instead, a class of graphs generated by a random mechanism seems to b e more appropriate. This situation requires statistical pro cedures to analyze graphs. The difficulty is then to understand which parameter is representativ e of the class of graphs. The sp ectral distribu- 21 tion of a graph giv es characteristics for ensem ble of graphs generated by the random graphs, and the entrop y of a sp ectrum and Kullback-Leibler divergence b et ween sp ectra are natural information theoretical quantities to b e studied. P arameter estimation F or some classes of graphs, the parameters of the mo del can b e easily estimated. F or example, the parameter p of an Erd¨ os-R ´ en yi graph can b e estimated by coun ting the edges and dividing it b y the total num b er of possible edges of the graph ( n 2 − n ). Ho w ever, for more complex mo dels such as the small-w orld graph prop osed by W atts and Strogatz, it is not trivial to estimate the probability p r of edge p erm utation. Here, w e demonstrated that the estimator based on the KL minimum distance (equation 6) is a general and straigh tforward metho d that can b e successfully applied to estimate parameters of div erse complex netw orks. One may argue whether the application of KL minim um distance estimator could not b e applied to degree distribution instead of the graph sp ectrum. Notice in Figure 3 that the degree distribution show ed a low er p o wer to discriminate graphs generated b y differen t parameters than the sp ectra. Therefore, the sp ectrum might b e a b etter feature to b e analyzed than the degree in order to estimate the parameters. Mo del selection Jeong and others 18 w ere the first group to classify protein-protein interaction netw orks as scale-free graphs b y analyzing the degree distribution. Later, several other groups re- analyzed the degree distribution of protein-protein in teraction net works and came to differing conclusions regarding whether it was appropriate to refer to these graphs as scale-free 19,20 . One difficulty w as the lack of an ob jective statistical pro cedure to decide which random graph mo del fits b etter the data set. By applying our mo del selection approach it is p ossible to c ho ose ob jectively , from a choice of candidate graph mo dels, which mo del b est fits the data. By our graph sp ectrum analysis, all the eight protein-protein in teraction net works were classified as scale-free net works among Erd¨ os-R ´ en yi, scale-free, and small-world mo dels. W e notice that, in the simulation study , our mo del selection approach has correctly classified 100% of the graphs with 120 no des and 22 the protein-protein in teraction net works analyzed here are larger than 700 nodes, whic h adds to the evidence that among these three candidate net works, the scale-free netw ork seems to fit b etter. Despite these results, it is imp ortan t to notice that the mo del selection approach is an ob jective criterion to select the mo del that b est fits the data among c andidate mo dels . There- fore, by analyzing the graph sp ectrum instead of the degree distribution, this study only pro vides one more evidence that, scale-free graphs fits b etter to protein-protein interaction net works than ER and small-w orld net w orks. If another complex net w ork model is prop osed, one may use this approac h to v erify which one b est fits the given graph. Another p oin t to b e analyzed is the fact that, since only part of the protein-protein net work is av ailable, it is alw ays p ossible that the observed sample is not represen tative of the entire netw ork, consequently , resulting in a sampling artifact problem 15 . Unfortunately , it is a problem ab out the original data set that should b e addressed when the data is collected or b y introduction of a priori mo del of the netw ork. The analysis prop osed here is conditioned to the quality of the data sets. V. CONCLUSIONS AND FUTURE APPLICA TIONS Our findings indicate that there are significant differences in the graph sp ectra of brain net works b et w een ch ildren with and without ADHD. W e anticipate that future studies in the field of graph sp ectra ma y illuminate the top ological significance of these features, and consequen tly help in the in v estigation of the relationship of these differences with brain function. The prop osed approaches are flexible enough to allow generalizations to other arbitrarily sophisticated families of graphs. Here, w e limited the analysis to three well-kno wn classes of random graphs, but the analysis can b e extended to other graphs without restriction and it is applicable to many areas where net work data is a source of concern. VI. MA TERIALS AND METHODS W e present b elo w the details of the computational exp erimen ts. The statistical analyses w ere done using custom made programs in R 28 (language and en vironment for statistical 23 computing and graphics). The R library igr aph was used to generate the random graphs. P arameter estimation The p erformance of the parameter estimator based on minimization of the KL div ergence w as ev aluated on differen t complex netw ork mo dels namely Erd¨ os-R´ en yi random graph, scale-free, and small-world, with sizes v arying from 50 to 300 no des. The parameters to b e estimated are the probabilit y p = 0 . 50, the scaling exp onen t of the preferential attachmen t p s = 1 . 50 and the rewiring probabilit y p r =0.30 for Erd¨ os-R ´ en yi, scale-free, and small-w orld net works, resp ectively . The sp ectral densities ( ρ g ) of eac h graph were estimated by a Gaus- sian kernel regression using the Nadara ya-W atson estimator. Since the theoretical sp ectrum distribution ( ρ θ ) is unknown for scale-free and small-world net works, the sp ectrum distribu- tion was estimated b y simulating 50 graphs and calculating the av erage sp ectra distribution ( ˆ ρ θ ) as an approximation for the theoretical distribution ( ρ θ ). A grid searc h was carried out in order to determine the argument θ that minimizes K L ( ˆ ρ g | ˆ ρ θ ). Mo del selection In order to ev aluate the p erformance of the prop osed mo del selection approach, one ran- dom graph G is generated (among Erd¨ os-R´ en yi, scale-free, and small-w orld) with parameters p = 0 . 3 for Erd¨ os-R ´ en yi graph, p s = 1 for scale-free graphs and p r = 0 . 3 for small-w orld graphs, with sizes v arying from 10 to 120 no des. Then, the sp ectrum of G is estimated. In order to search the optimum set of parameters for eac h graph mo del (the set of parameters that minimizes the KL div ergence), a grid searc h was carried out. Fifty graphs for each class ( g 1 = Erd¨ os-R ´ en yi random; g 2 = scale-free; and g 3 = small-world) are generated. The KL div ergence is estimated b et ween the sp ectrum of G and the a verage sp ectrum of the 50 graphs of eac h graph type ( g 1 , g 2 , g 3 ). The graph mo del g i ( i = 1 , 2 , 3) which has the minim um KL div ergence v alue b et ween G and the three mo dels ( g 1 , g 2 , g 3 ) is the one which b est fits G . This exp eriment w as rep eated 1,000 times for eac h graph t yp e (Erd¨ os-R´ enyi, scale-free, or small-world) and eac h graph size (10 to 120 no des). 24 Statistical test for JS divergence b et ween graph sp ectra Giv en tw o sets of graphs g 1 and g 2 , the test consists of verifying if the JS divergence b et w een the av erage graph sp ectrum of set g 1 and the av erage graph sp ectrum of g 2 is zero or not. F ormally , we test H 0 : J S ( ρ g 1 , ρ g 2 ) = 0 versus H 1 : J S ( ρ g 1 , ρ g 2 ) > 0. One alternative to p erform the test is to use a b o otstrap pro cedure. The b o otstr ap w as in tro duced in 1979 as a computer-based metho d for estimating the standard error of the statistic or to construct confidential in terv als that could b e used to provide a significance lev el for a hypothesis test 11 . Let # g 1 and # g 2 b e the quan tity of graphs con tained in sets g 1 and g 2 , resp ectiv ely . The b ootstrap implemen tation of this test is as follows: 1. Create a set of graphs sp ectra ˜ g 1 (the b o otstrap sample) by resampling with replace- men t, # g 1 sp ectra distributions from g 1 ∪ g 2 . 2. Create a set of graphs sp ectra ˜ g 2 (the b o otstrap sample) by resampling with replace- men t, # g 2 sp ectra distributions from g 1 ∪ g 2 . 3. Let ρ ˜ g i 1 is the i -th sp ectra distribution of ˜ g 1 and ρ ˜ g i 2 is the i -th sp ectra distribution of ˜ g 2 . Calculate the a verage sp ectra distributions ρ g ∗ 1 , i.e., ρ g ∗ 1 ( λ ) = P # g 1 i =1 ρ ˜ g i 1 ( λ ) # g 1 , and ρ g ∗ 2 , i.e. ρ g ∗ 2 ( λ ) = P # g 2 i =1 ρ ˜ g i 2 ( λ ) # g 2 , of ˜ g 1 and ˜ g 2 , resp ectiv ely . 4. Calculate ˆ J S ( ρ g ∗ 1 | ρ g ∗ 2 ) (the b o otstrap replication). 5. Rep eat steps 1 to 5 un til obtaining the desired n umber of b ootstrap replications. 6. T est if ˆ J S ( ρ g 1 | ρ g 2 ) = 0 using the em pirical distribution obtained in steps 1 to 5. Gather the information from the empirical distribution of ˆ J S ( ρ g ∗ 1 | ρ g ∗ 2 ) to obtain a p -v alue for ˆ J S ( ρ g 1 | ρ g 2 ) = 0, by analyzing the probabilit y of obtaining v alues equal or greater than ˆ J S ( ρ g ∗ 1 | ρ g ∗ 2 ). The purp ose of steps 1 and 2 is to construct new sets ˜ g 1 and ˜ g 2 that are under the null h yp othesis. This is exactly done b y sampling graphs sp ectra distributions from g 1 ∪ g 2 . In order to verify whether the bo otstrap based statistical test is actually con trolling the rate of false p ositiv es, p-v alue histograms under the null h yp othesis w ere constructed. F or eac h class of graph (Erd¨ os-R´ enyi random, scale-free, and small-w orld), 100 graphs with 100 25 no des with the same set of parameters ( p = 0 . 5 for Erd¨ os-R ´ en yi graphs; p s = 1 for scale-free graphs and p r = 0 . 3 for small-world graphs) were constructed. The 100 graphs of each class w ere split into tw o sets of 50 graphs and the statistical test p erformed with 1,000 b o otstrap resampling. These exp erimen ts were rep eated 10,000 times in order to construct the p-v alue distributions. W e w ere concerned in ev aluating the p o wer of the prop osed test, therefore the parameters of the 50 graphs of one group and the 50 graphs of the other were set with small differences. The parameters are set as follo ws: p 1 = 0 . 50 v ersus p 2 = 0 . 52 for Erd¨ os-R ´ en yi graphs; the scaling exp onent p s 1 = 1 . 0 versus p s 2 = 1 . 1 for scale-free netw orks and p r 1 = 0 . 30 v ersus p r 2 = 0 . 31 for small-world graphs. The parameters p 1 and p 2 for Erd¨ os-R´ en yi graphs represen t the probabilit y of a pair of no des b e connected by an edge. The parameters p s 1 and p s 2 represen t the degree of prop ortionalit y (scaling exp onen t) that a new no de in the scale-free graph will b e connected to no de i . F or example, p s = 1 means that the new no de attac hes to no de i linearly prop ortional to the degree of no de i . p s = 2 means that the new no de attac hes to no de i quadratic prop ortional to the degree of node i and so on and so forth. The parameters p r 1 and p r 2 represen t the probabilit y of rewiring (p erm uting the edges) in the small-world graph. All other parameters (n umber of no des for Erd¨ os-R ´ en yi graphs and n umber of no des and edges for scale-free and small-w orld graphs) w ere main tained equal b et w een the t wo groups. VI I. A CKNO WLEDGMENTS W e w ould lik e to thank Adrian M. Bartlett, Christopher Honey , Katlin B. Massirer, Kaname Ko jima, and Stephen V. Shepherd for useful discussions during the preparation of this manuscript. W e also would lik e to thank the anonymous referee for carefully reading our manuscript and giving helpful commen ts that considerably improv ed the presen tation of the article. VI I I. FUNDINGS D YT was partially supported by P ew Latin American F ellowship and USP pro ject Math- ematics, computation, language and the brain. AF was supp orted b y F APESP gran t 26 11/07762-8 and CNPq gran t 306319/2010-1. JRS was partially supp orted b y F APESP gran t 10/01394-4. CEF was partially supp orted by CNPq gran t 302736/2010-7. 1 Ak aike, H. (1974) A new lo ok at the statistical mo del identification, IEEE T r ansactions on A utomatic Contr ol , 19 , 716-723. 2 Alb ert, R. and Barab´ asi, A-L. (2002) Statistical mechanics of complex net works, R eviews of Mo dern Physics , 74 , 47-97. 3 American Psyc hiatric Association (1994) Diagnostic and Statistical Manual of Mental Disorders (4th edition) American Psychiatric Asso ciation, W ashington, DC. 4 Barab´ asi, A-L. and Alb ert, R. (1999) Emergence of scaling in random net works, Scienc e , 286 , 509-512. 5 Barab´ asi, A-L., Gulbahce, N., Loscalzo, J. (2011) Net work medicine: a net work-based approac h to human disease, Natur e R eviews Genetics , 12 , 56-68. 6 Benjamini, Y. and Ho c hberg, Y. (1995) Controlling the F alse Disco very Rate: a practical and p o w erful approach to multiple testing, Journal of the R oyal Statistic al So ciety Series B , 57 , 289-300. 7 Bollob´ as, B. and Riordan, O. (2004) The diameter of a scale-free random graph, Combinatoric a , 24 , 5-34. 8 Co ver, T.M. and Thomas, J.A. (2006) Elements of information theory 2nd edition, Willey- In terscience: NJ. 9 Dorogo vtsev, S.N., Goltsev, A.V., Mendes, J.F.F., Samukhin, A.N. (2003) Sp ectra of complex net works, Physic al R eview E , E68 , 046109. 10 Egu ´ ıluz, V.M., Chialv o, D.R., Cecchi, G.A., Baliki, M., Apk arian, V. (2005) Scale-free brain functional netw orks, Physic al R eview L etters , 94 , 018102. 11 Efron, B. and Tibshirani, R.J. (1993) An in tro duction to the b o otstrap, Chapman & Hall/CR C. 12 Erd¨ os, P . and R´ en yi, A. (1959) On random graphs, Public ationes Mathematic ae (Debr e c en) , 6 , 290-297. 13 F ox, M.D., Snyder, A.Z., Vincent, J.L., Corb etta, M., V an Essen, D.C., Raichle, M.E. (2005) The human brain is in trinsically organized in to dynamic, anticorrelated functional netw orks, PNAS , 102 , 9673-8. 27 14 Guimer` a, R. and Sales-Pardo, M. (2009) Missing and spurious interactions and the reconstruc- tion of complex netw orks, PNAS , 106 , 22073-22078. 15 Han, J-D D., Dupuy , D., Bertin, N., Cusik, M.E. and Vidal, M. (2005) Effect of sampling on top ology predictions of protein-protein in teraction net works, Natur e Biote chnolo gy , 23 , 839-844. 16 Hart well, L.H., Hopfield, J.J., Leibler, S., Murray , A.W. (1999) F rom molecular to mo dular cell biology , Natur e , 402 , 47-52. 17 Hub erman, B.A. and Adamic, L.A. (1999) Growth dynamics of the W orld-Wide-W eb, Natur e , 401 , 131. 18 Jeong, H., T om b or, B., Alb ert, R., Oltv ai, Z.N., Barabsi, A-L. (2000) The large-scale organiza- tion of metab olic netw orks, Natur e , 407 , 651-654. 19 Khanin, R. and Wit, E. (2006) How scale-free are biological net works, Journal of Computational Biolo gy , 13 , 810-818. 20 Lima-Mendez, G. and v an Helden, J. (2009) The p ow erful law of the p o wer law and other myths in netw ork biology , Mole cular BioSystems , 5 , 14821493. 21 Logothetis, N.K., Pauls, J., Augath, M., T rinath, T., Oeltermann, A. (2001) Neurophysiological in vestication of the basis of the fMRI signal, Natur e , 412 , 150-157. 22 Maslo v, S. and Snepp en, K. (2002) Sp ecificity and stability in top ology of protein netw orks, Scienc e , 296 , 910-913. 23 Mieghem, P .V. (2011) Graph sp ectra for complex netw orks, Cambridge University Pr ess . 24 Nadara ya, E.A. (1964) On estimating regression, The ory of pr ob ability and its applic ations , 10 , 186-190. 25 Newman, M.E.J. and W atts, D.J. (1999) Renormalization group analysis of the small-world net work mo del, Physics L etters A , 263 , 341-346. 26 Newman, M.E.J., W atts, D.J., Strogatz, S.H. (2002) Random graph mo dels of so cial netw orks, PNAS , 99 , 2566-2572. 27 P astor-Satorras, R. and V espignani, A. (2001) Epidemic spreading in scale-free netw orks, Phys- ic al R eview L etters , 86 , 3200-3003. 28 R Developmen t Core T eam (2011) R: A Language and Environmen t for Statistical Computing, ISBN 3-900051-07-0. 29 Sain, S.R. and Scott, W. (1996) On lo cally adaptative densit y estimation, Journal of the Amer- ic an Statistic al Asso ciation , 91 , 1925-1934. 28 30 Singh, I. (2008) Beyond p olemics: science and ethics of ADHD, Natur e R eviews Neur oscienc e , 9 , 957-964. 31 Sturges, H.A. (1926) The choice of a class interv al, Journal of the Americ an Statistic al Asso ci- ation , 21 , 65-66. 32 W asserman, S. and F aust, K. (1994) So cial netw ork analysis, Cambridge University Pr ess , Cam bridge. 33 W atson, G.S. (1964) Smo oth regression analysis, Sankya A , 26 , 359-372. 34 W atts, D.J. and Strogatz, S.H. (1998) Collective dynamics of small-world net works, Natur e , 393 , 440-442. 35 Whittle, P . (1953) Estimation and information in stationary time series, A rk. Math. , 2 , 423- 434Z. 36 Wigner, E. (1955) Characteristic vectors of b ordered matrices with infinite dimensions, Ann. Math. , 62 , 548-564. 37 Wigner, E. (1958) On the distribution of the ro ots of certain symmetric matrices, Ann. Math. , 67 , 325-328.
Original Paper
Loading high-quality paper...
Comments & Academic Discussion
Loading comments...
Leave a Comment