Title: Benchmarking Preprocessing and Integration Methods in Single-Cell Genomics
ArXiv ID: 2601.00277
Date: 2026-01-01
Authors: Ali Anaissi, Seid Miad Zandavi, Weidong Huang, Junaid Akram, Basem Suleiman, Ali Braytee, Jie Hua
📝 Abstract
Single-cell data analysis has the potential to revolutionize personalized medicine by characterizing disease-associated molecular changes at the single-cell level. Advanced single-cell multimodal assays can now simultaneously measure various molecules (e.g., DNA, RNA, Protein) across hundreds of thousands of individual cells, providing a comprehensive molecular readout. A significant analytical challenge is integrating single-cell measurements across different modalities. Various methods have been developed to address this challenge, but there has been no systematic evaluation of these techniques with different preprocessing strategies. This study examines a general pipeline for single-cell data analysis, which includes normalization, data integration, and dimensionality reduction. The performance of different algorithm combinations often depends on the dataset sizes and characteristics. We evaluate six datasets across diverse modalities, tissues, and organisms using three metrics: Silhouette Coefficient Score, Adjusted Rand Index, and Calinski-Harabasz Index. Our experiments involve combinations of seven normalization methods, four dimensional reduction methods, and five integration methods. The results show that Seurat and Harmony excel in data integration, with Harmony being more time-efficient, especially for large datasets. UMAP is the most compatible dimensionality reduction method with the integration techniques, and the choice of normalization method varies depending on the integration method used.
💡 Deep Analysis
📄 Full Content
Benchmarking Preprocessing and Integration
Methods in Single-Cell Genomics
Ali Anaissi1,2, Seid Miad Zandavi2,3, Weidong Huang1, Junaid Akram2,
Basem Suleiman4, Ali Braytee1 and Jie Hua5
1 University of Technology Sydney, Australia
2 University of Sydney, Australia
3 Broad Institute, United States
4 University of New South Wales, Australia
5 Shaoyang University, China
ali.anaissi@uts.edu.au, szandavi@broadinstitute.org,
weidong.huang@uts.edu.au, Junaid.Akram@uts.edu.au,
b.suleiman@unsw.edu.au, ali.braytee@uts.edu.au, steven.hua@mq.edu.au
Abstract. Single-cell data analysis has the potential to revolutionize
personalized medicine by characterizing disease-associated molecular changes
at the single-cell level. Advanced single-cell multimodal assays can now
simultaneously measure various molecules (e.g., DNA, RNA, Protein)
across hundreds of thousands of individual cells, providing a compre-
hensive molecular readout. A significant analytical challenge is integrat-
ing single-cell measurements across different modalities. Various meth-
ods have been developed to address this challenge, but there has been
no systematic evaluation of these techniques with different preprocess-
ing strategies. This study examines a general pipeline for single-cell data
analysis, which includes normalization, data integration, and dimension-
ality reduction. The performance of different algorithm combinations of-
ten depends on the dataset sizes and characteristics. We evaluate six
datasets across diverse modalities, tissues, and organisms using three
metrics: Silhouette Coefficient Score, Adjusted Rand Index, and Calinski-
Harabasz Index. Our experiments involve combinations of seven nor-
malization methods, four dimensional reduction methods, and five inte-
gration methods. The results show that Seurat and Harmony excel in
data integration, with Harmony being more time-efficient, especially for
large datasets. UMAP is the most compatible dimensionality reduction
method with the integration techniques, and the choice of normalization
method varies depending on the integration method used.
1
Introduction
Technological advances have significantly increased our ability to generate high-
throughput single-cell gene expression data[17]. However, single-cell data often
originates from multiple experiments with variations in capturing time, person-
nel, reagents, equipment, and technology platforms, leading to large variations
arXiv:2601.00277v1 [q-bio.QM] 1 Jan 2026
that can confound biological variations during data integration. scRNA-seq in-
tegration[9, 2, 26] addresses two main issues: generating cell-type feature clusters
and determining whether clusters represent actual cell types or result from bio-
logical or technological variations, such as specific batch effects or high mitochon-
drial content. Despite its potential, scRNA-seq integration faces risks, including
low-quality cluster identification due to meaningless variations and biased clus-
tering from improper arrangement of similar cell types.
A popular strategy introduced by Haghverdi et al. [4] identifies cell mappings
between datasets and reconstructs the data in a shared space by finding mutual
nearest neighbors (MNNs) [4, 17]. This method, while effective in generating a
normalized gene expression matrix suitable for downstream analysis, is compu-
tationally intensive. To address this, the fastMNN algorithm applies the MNN
technique in a PCA-computed subspace, improving performance and accuracy
[8]. Similarly, Scanorama searches for MNNs in dimensionally reduced regions
for batch integration [6].
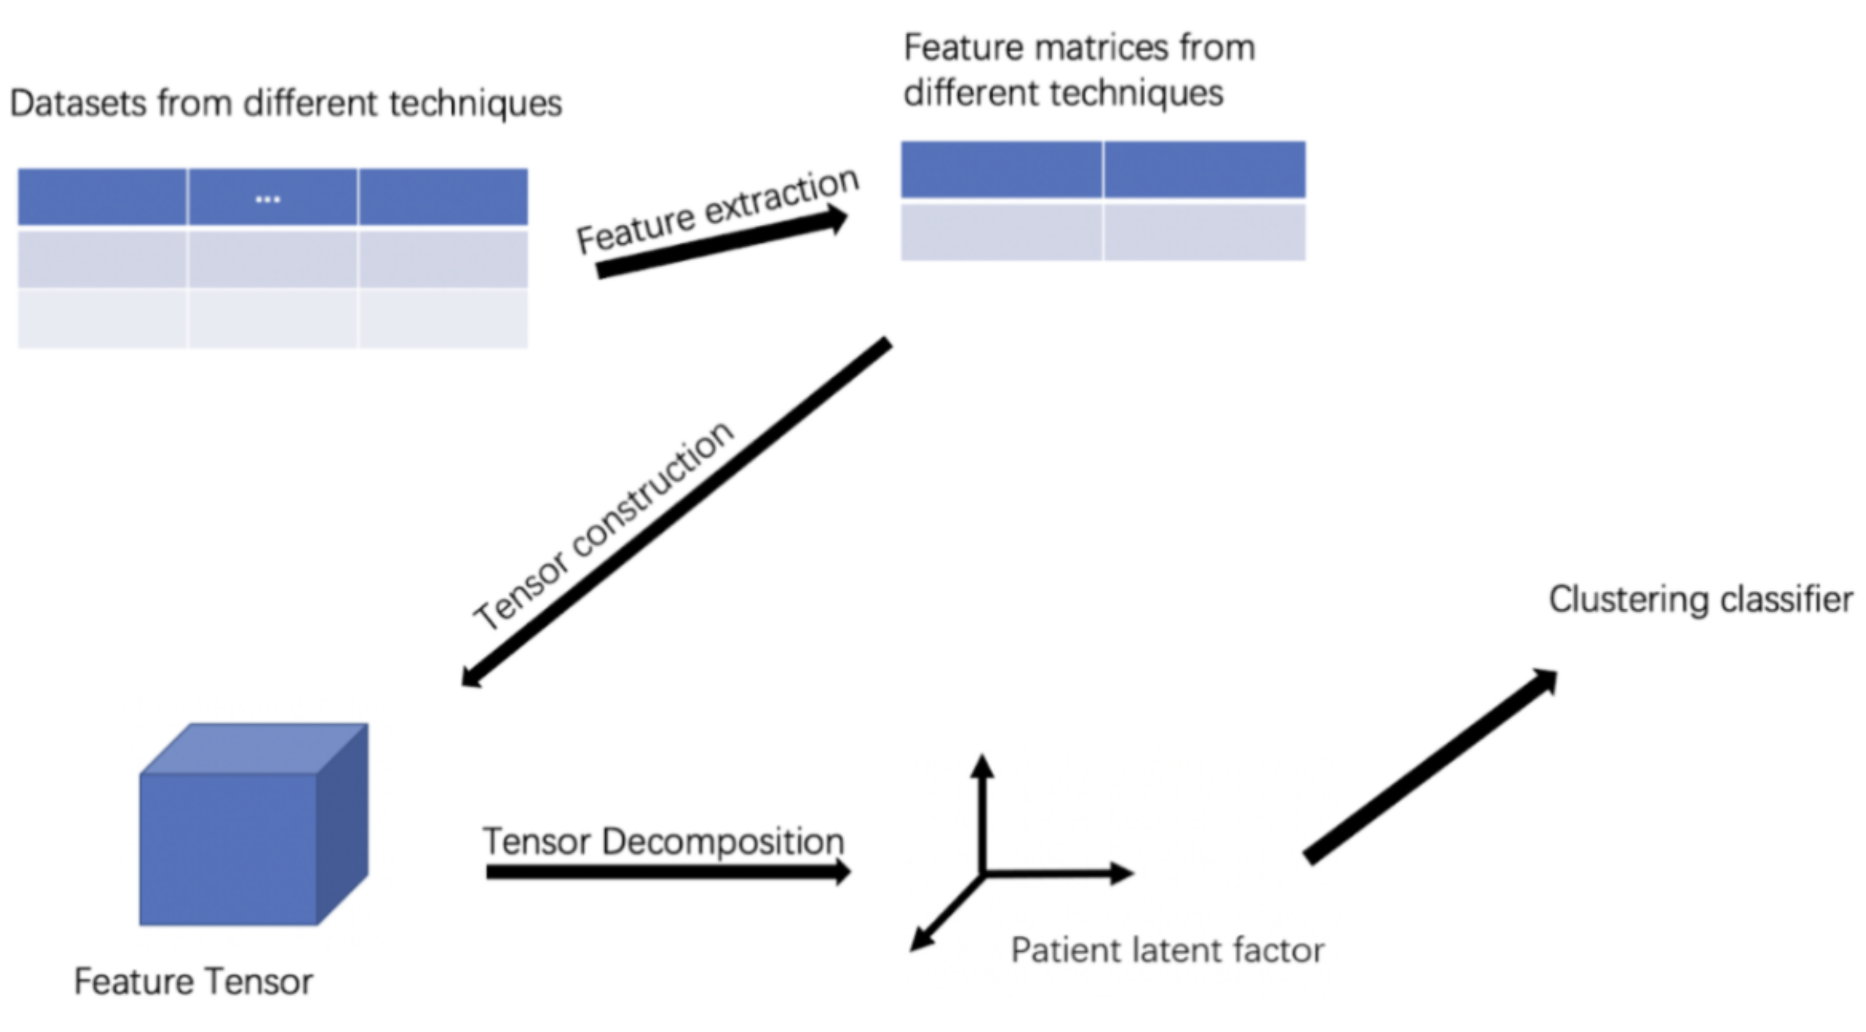
scRNA-seq integration analysis typically involves four modules: data nor-
malization, dimensionality reduction, data integration, and result visualization.
Numerous algorithms are available for each module, creating a vast number of
possible combinations that need evaluation to determine optimal performance.
The performance of these combinations depends heavily on dataset size and type,
posing a challenge in identifying the best algorithm and parameter settings. This
challenge requires significant computational resources, time, and expertise.
This paper addresses this challenge by introducing an empirical evaluation
framework to help scientists evaluate scRNA-seq algorithms and choose the best
combinations for their datasets. We investigate optimal clustering model com-
binations for different types of datasets using various evaluation methods. The
framework is divided into three parts: data normalization, dimensionality reduc-
tion, and data integration. For normalization, we investigate seven core meth-
ods: Log Normalization, Counts Per Million (CPM), SCTransform, TF-IDF,
Linnorm, Scran, and TTM [18, 31, 32]. For dimensionality reduction, we evalu-
ate PCA, UMAP, t-SNE, and PHATE. For data integration, we assess Seurat,
Harmony, FastMNN [4, 17], ComBat [7], and Scanorama [6]. We use three evalu-
ation metrics—Silhouette Coefficient Score, Adjusted Rand Index, and Calins