Financial crises emerge when structural vulnerabilities accumulate across sectors, markets, and investor behavior. Predicting these systemic transitions is challenging because they arise from evolving interactions between market participants, not isolated price movements alone. We present Systemic Risk Radar (SRR), a framework that models financial markets as multi-layer graphs to detect early signs of systemic fragility and crash-regime transitions.
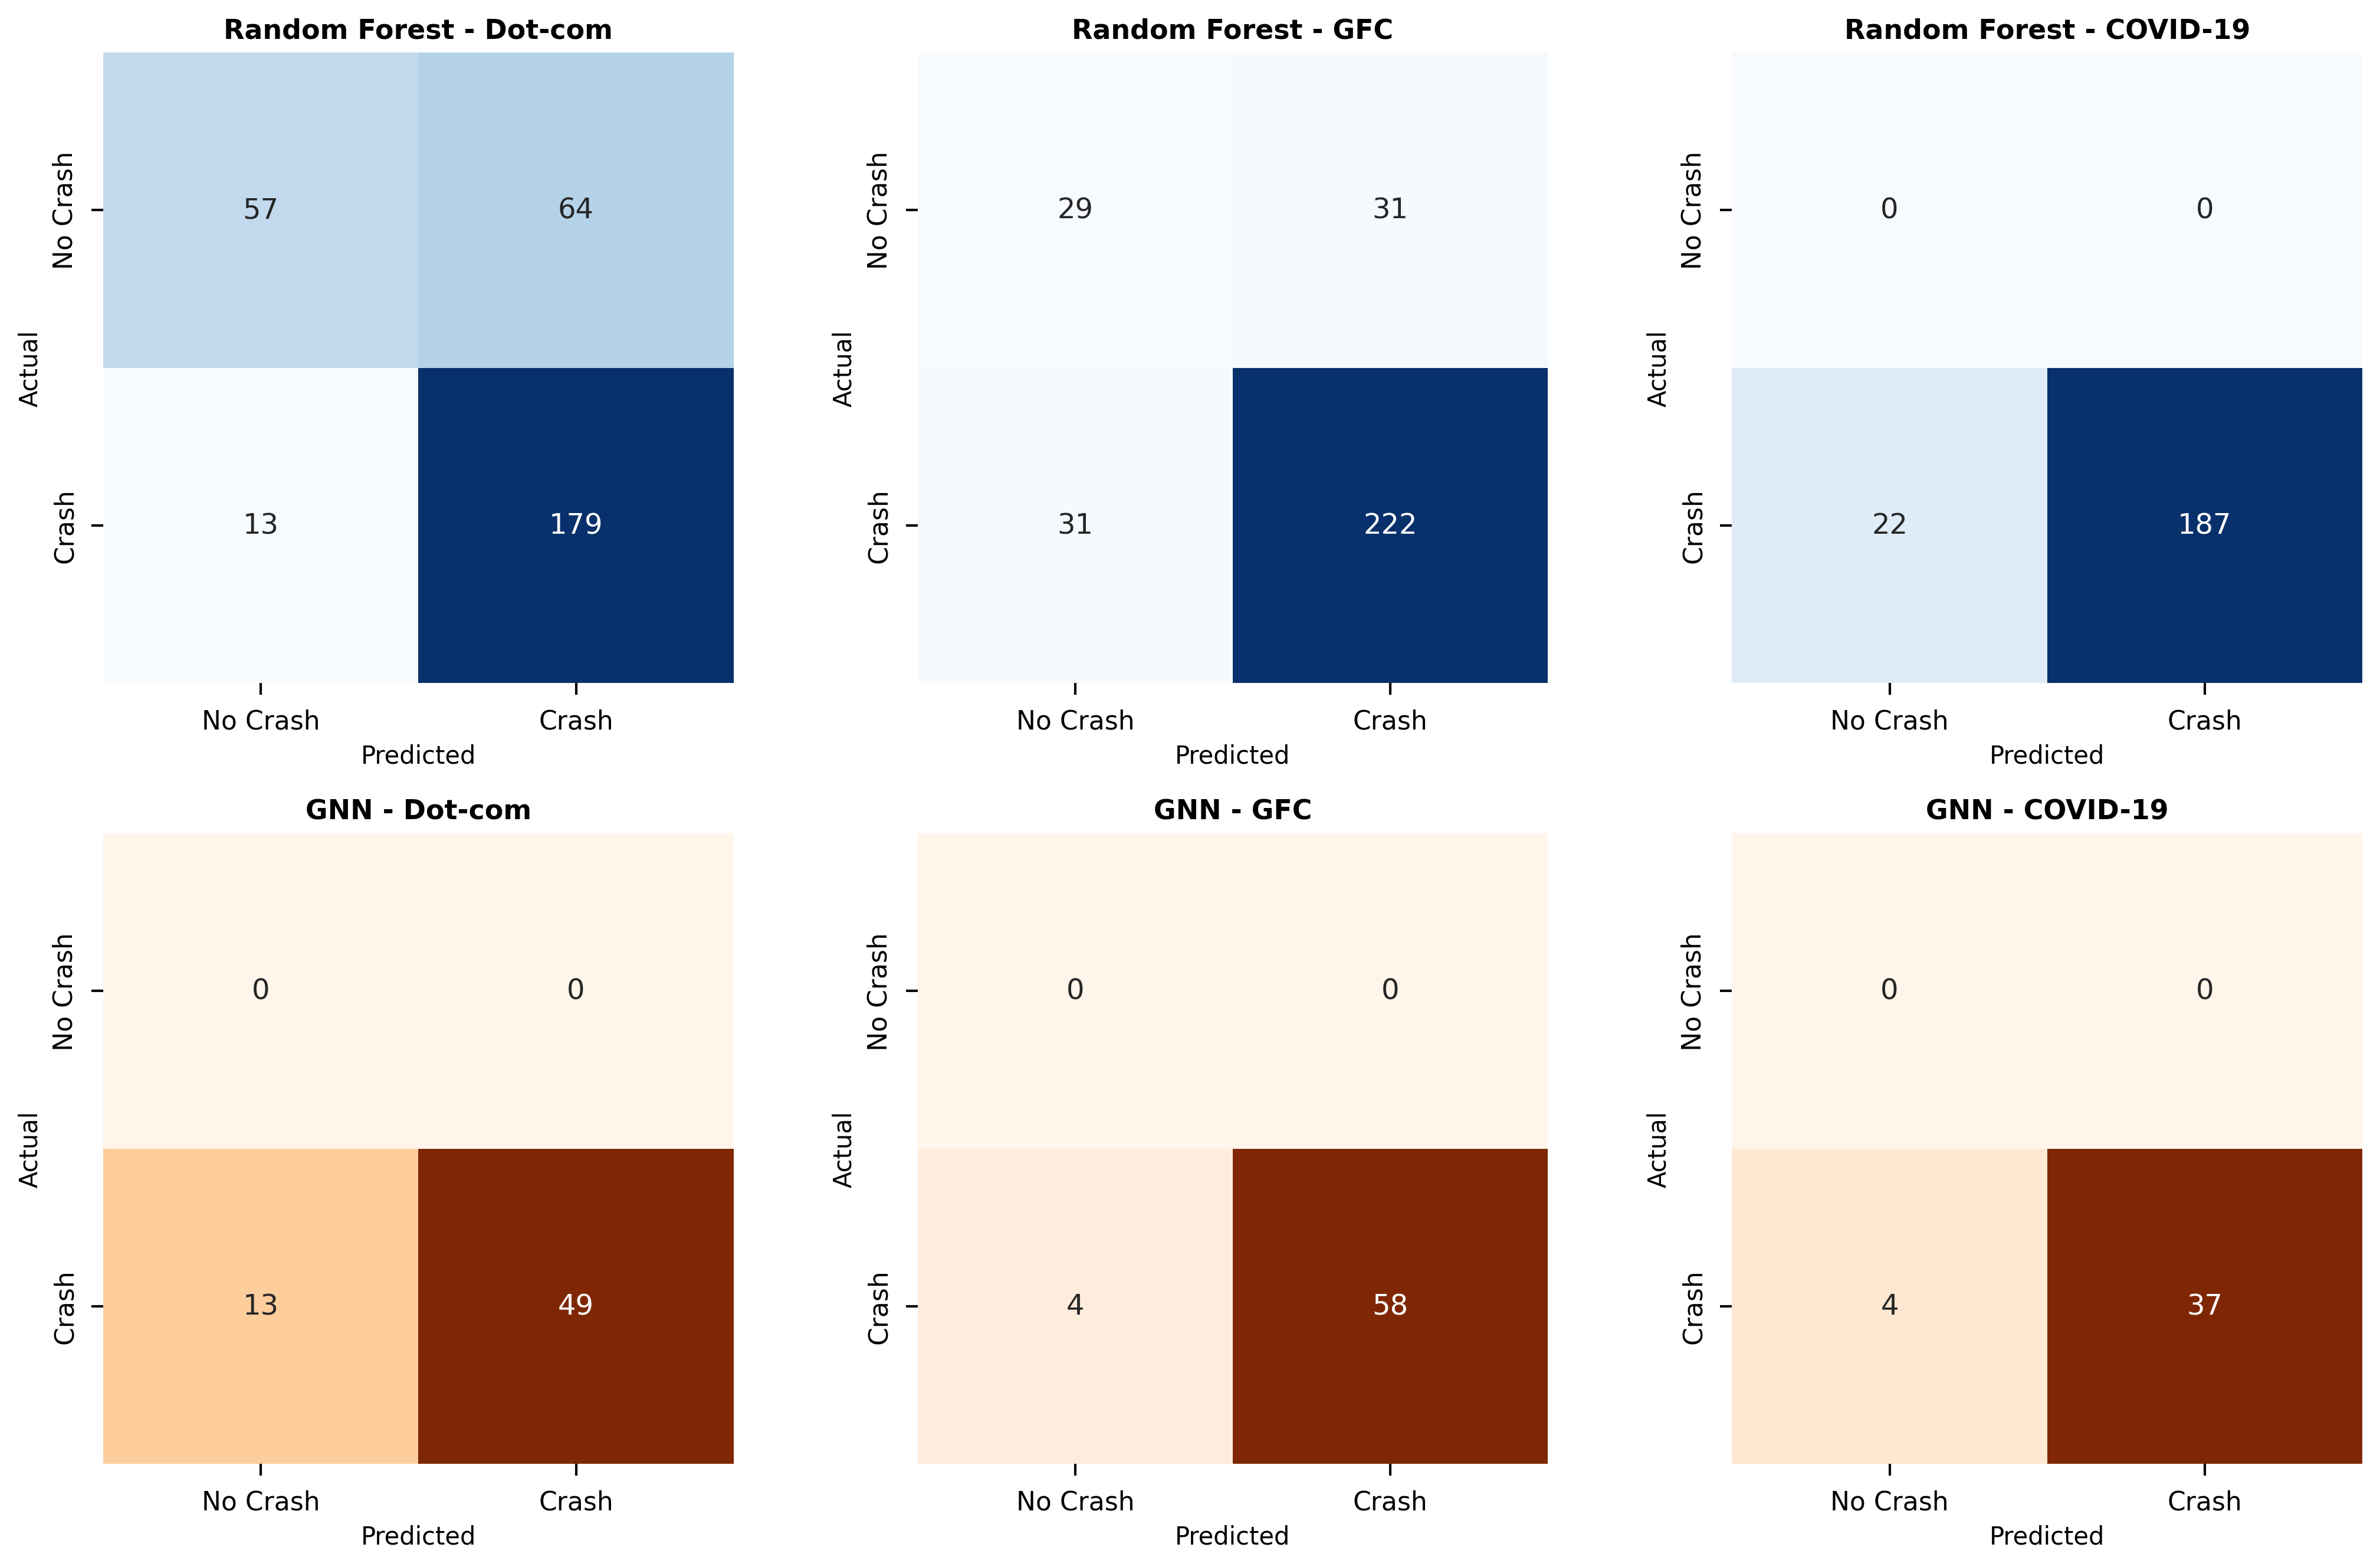
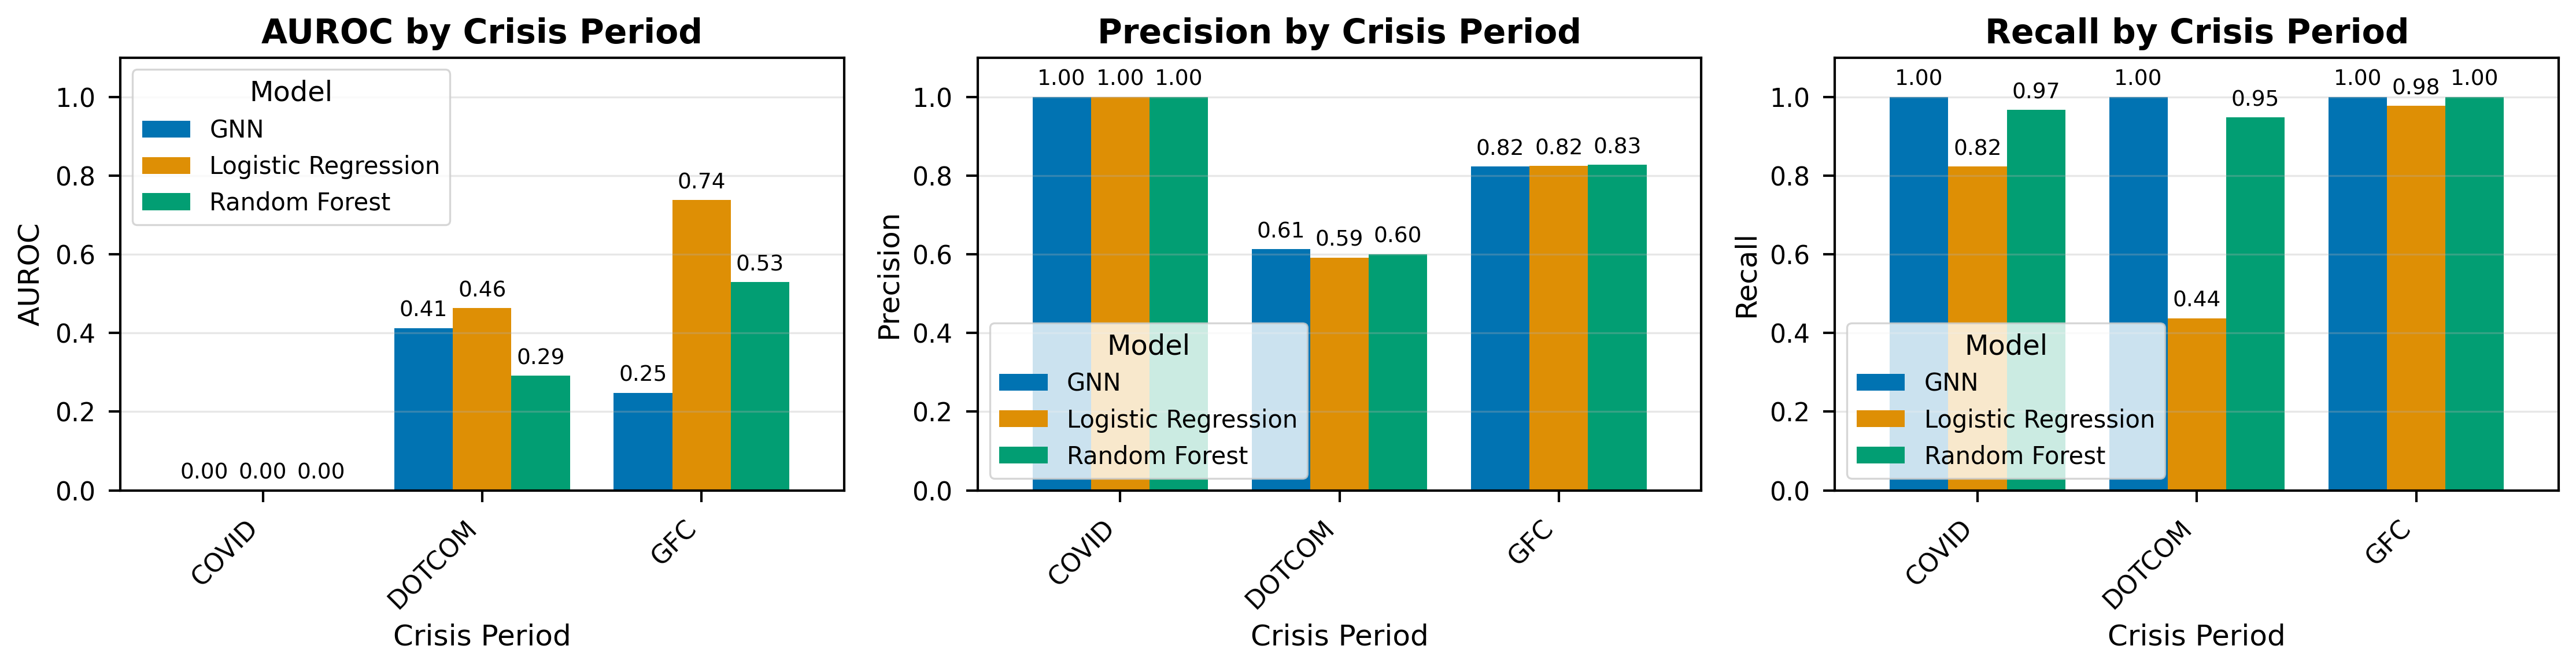
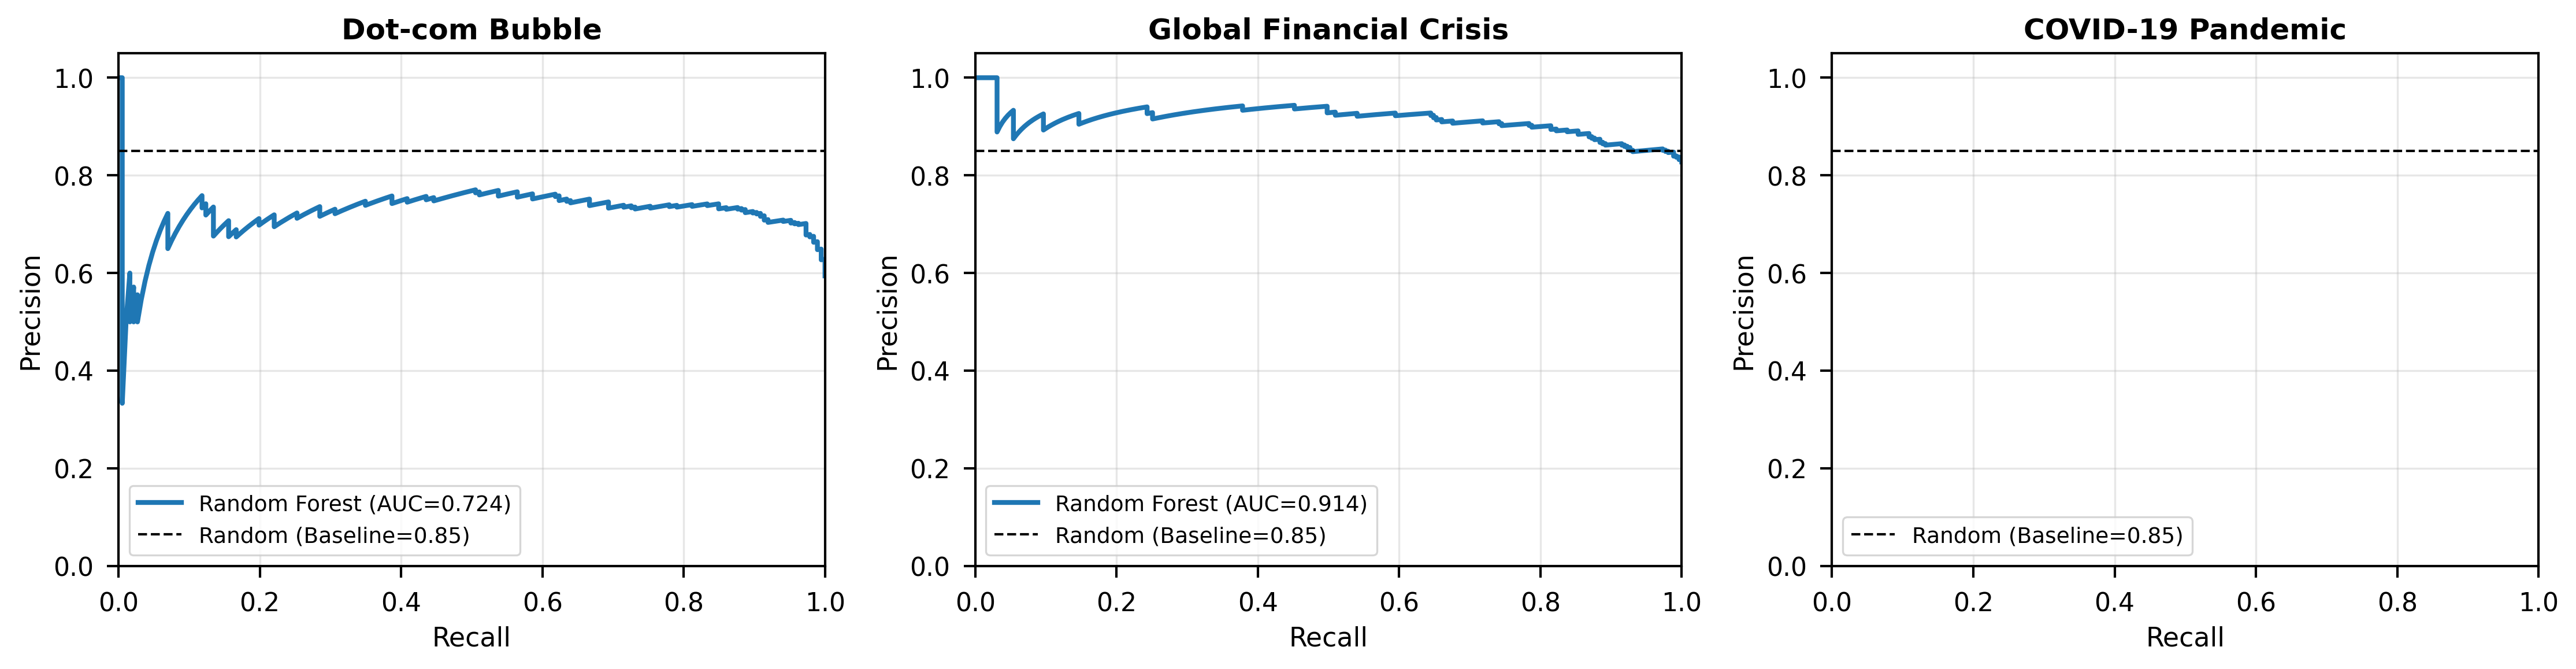
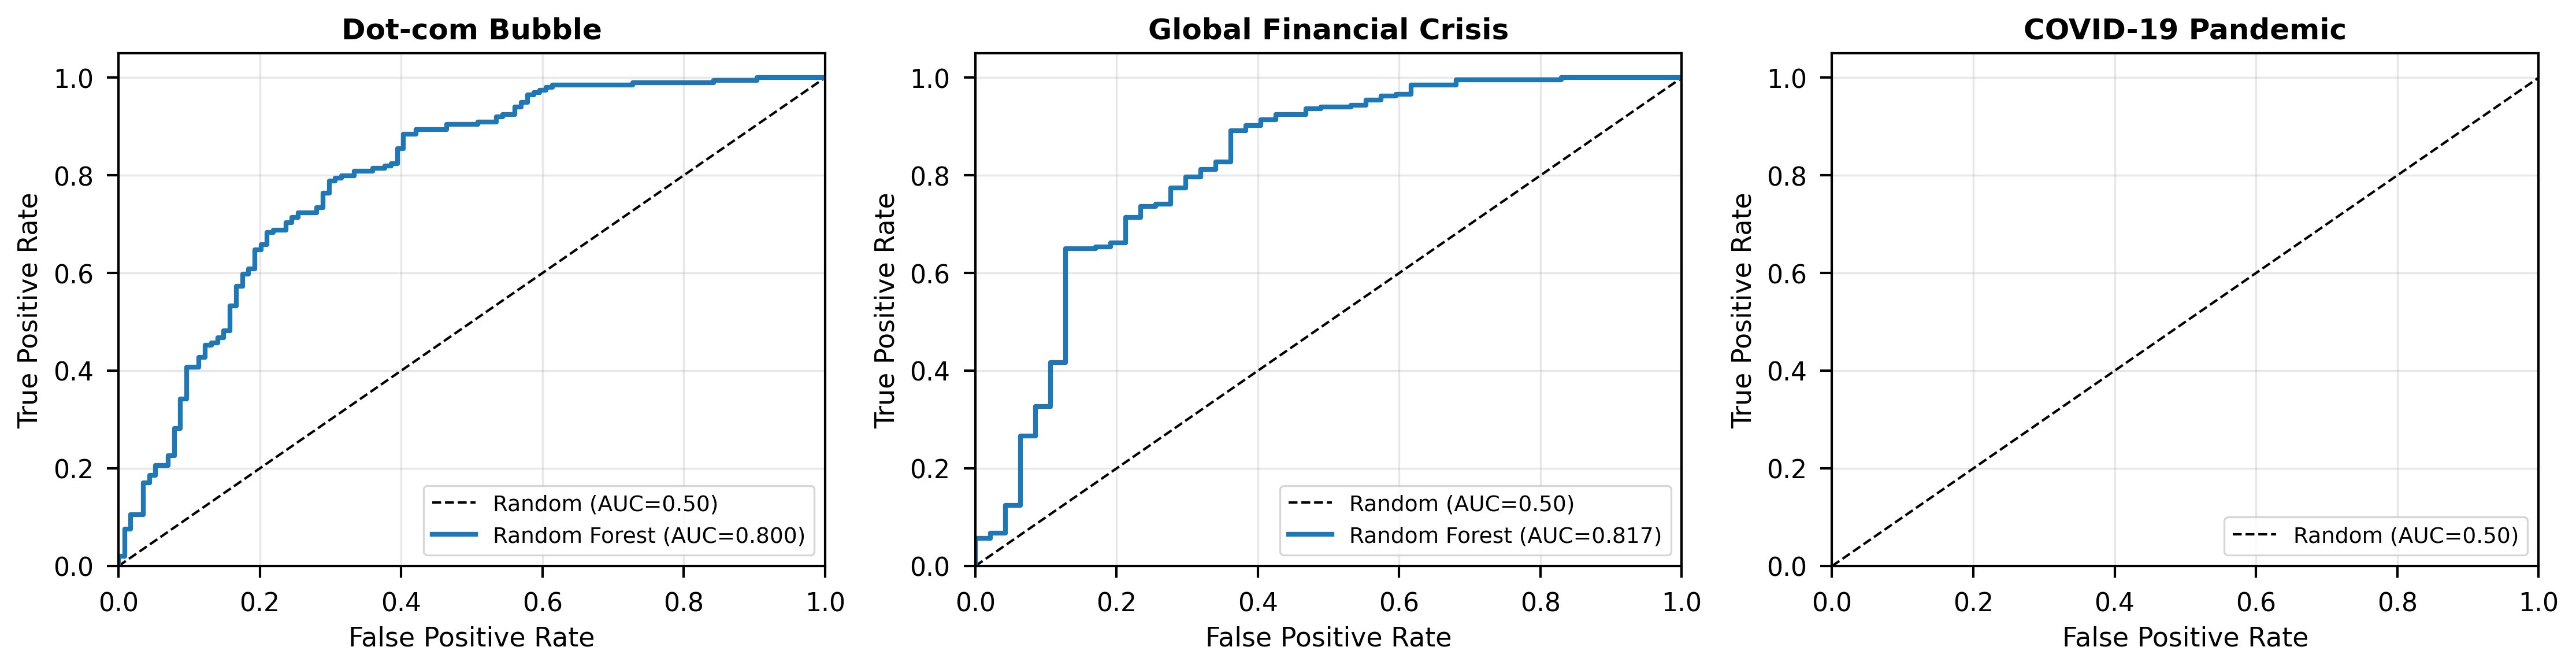
We evaluate SRR across three major crises: the Dot-com crash, the Global Financial Crisis, and the COVID-19 shock. Our experiments compare snapshot GNNs, a simplified temporal GNN prototype, and standard baselines (logistic regression and Random Forest). Results show that structural network information provides useful early-warning signals compared to feature-based models alone.
This correlation-based instantiation of SRR demonstrates that graph-derived features capture meaningful changes in market structure during stress events. The findings motivate extending SRR with additional graph layers (sector/factor exposure, sentiment) and more expressive temporal architectures (LSTM/GRU or Transformer encoders) to better handle diverse crisis types.
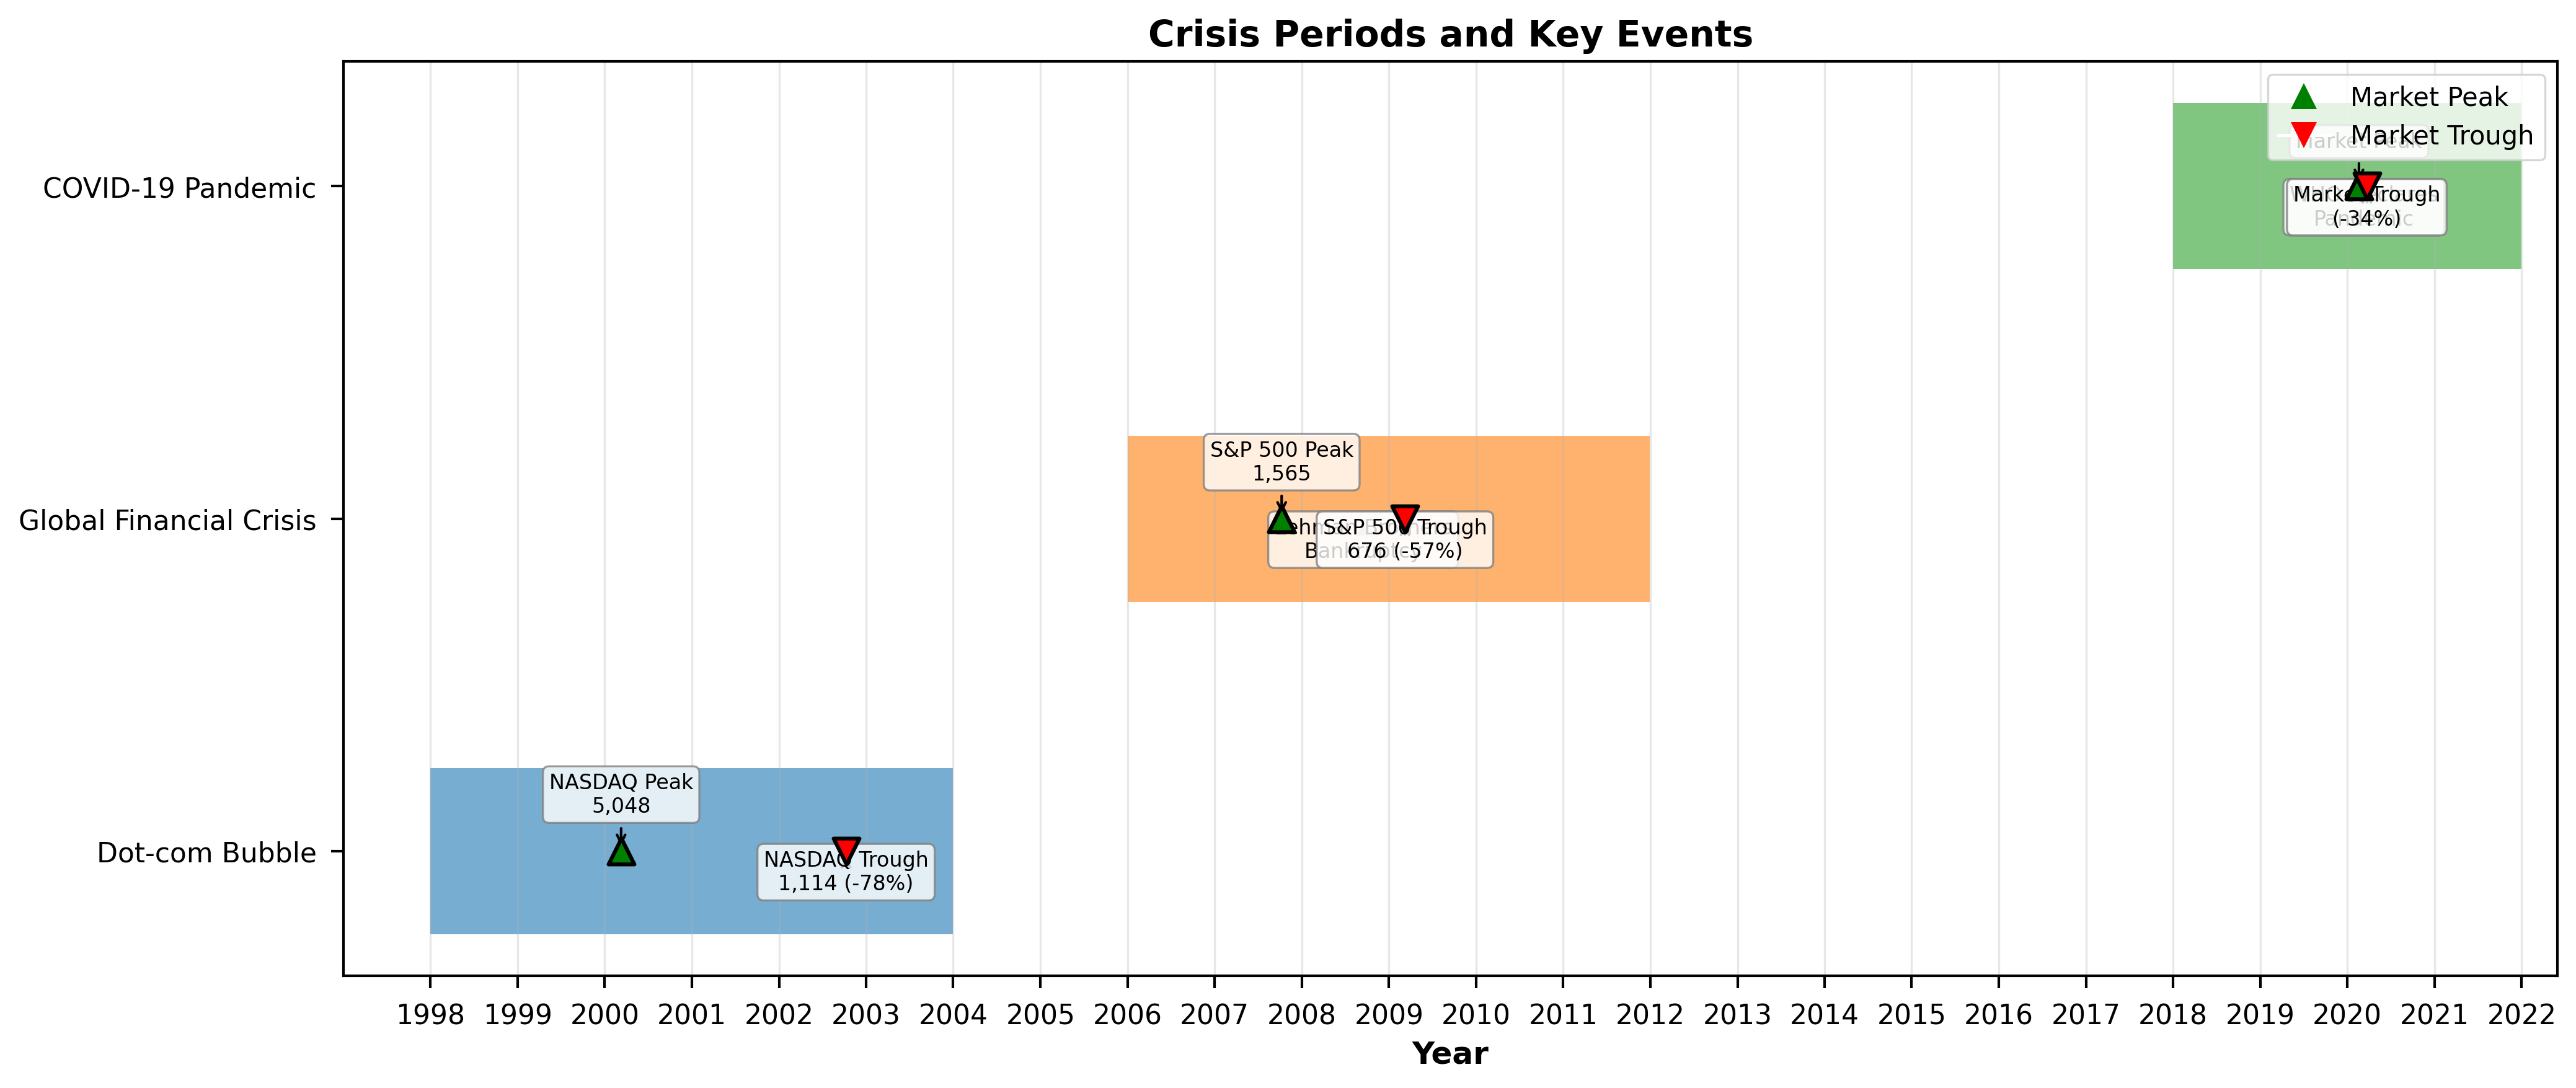
Financial markets are interconnected. Price formation, liquidity, and volatility reflect sector-wide and crossasset feedback effects. Large market declines over the last two decades-the Dot-com crash (2000Dot-com crash ( -2002)), the global financial crisis (2008)(2009)(2010), and the COVID-19 crash (2020)-were not triggered by single shocks. They emerged from accumulated fragility: rising correlations, leverage amplification, deteriorating liquidity, and cross-market contagion.
Most market prediction tools focus on individual assets or sector-wise indicators. Factor models, volatility indexes, and macroeconomic indicators struggle to capture systemic interactions. They predict whether specific assets or sectors will decline, not whether the broader market is approaching a systemic risk regime. This requires understanding the connectivity and temporal evolution of market structure.
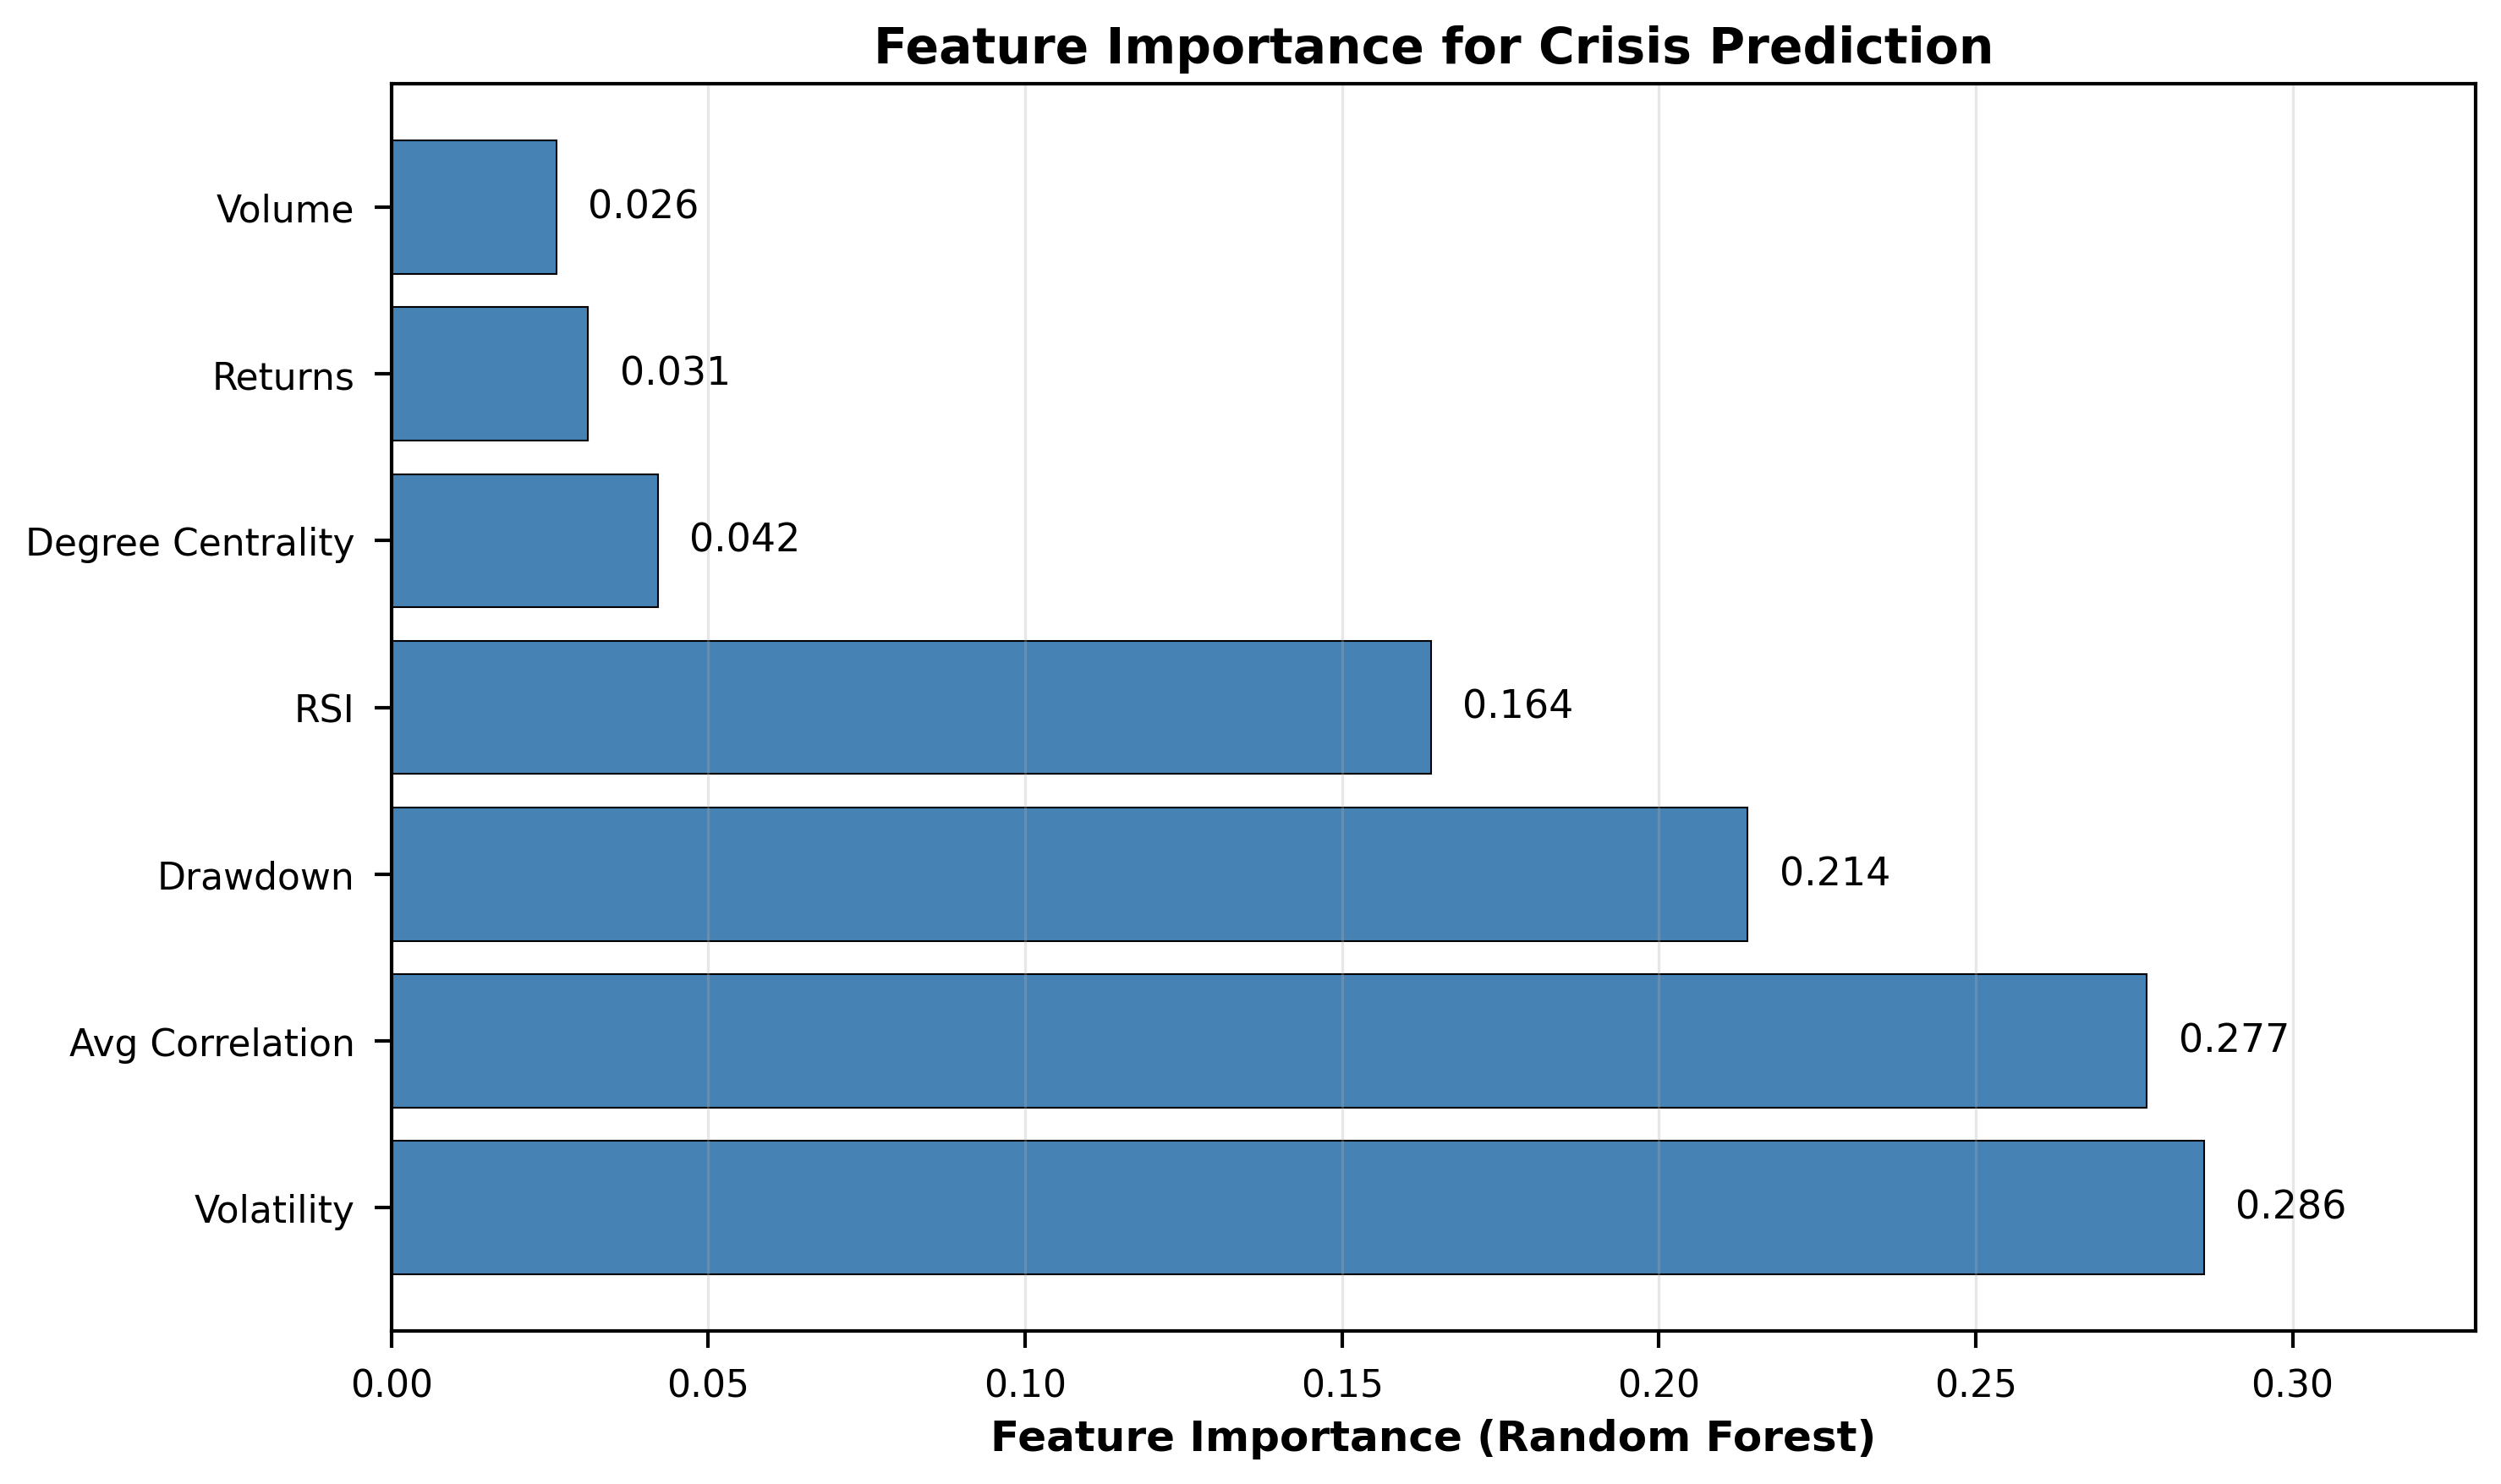
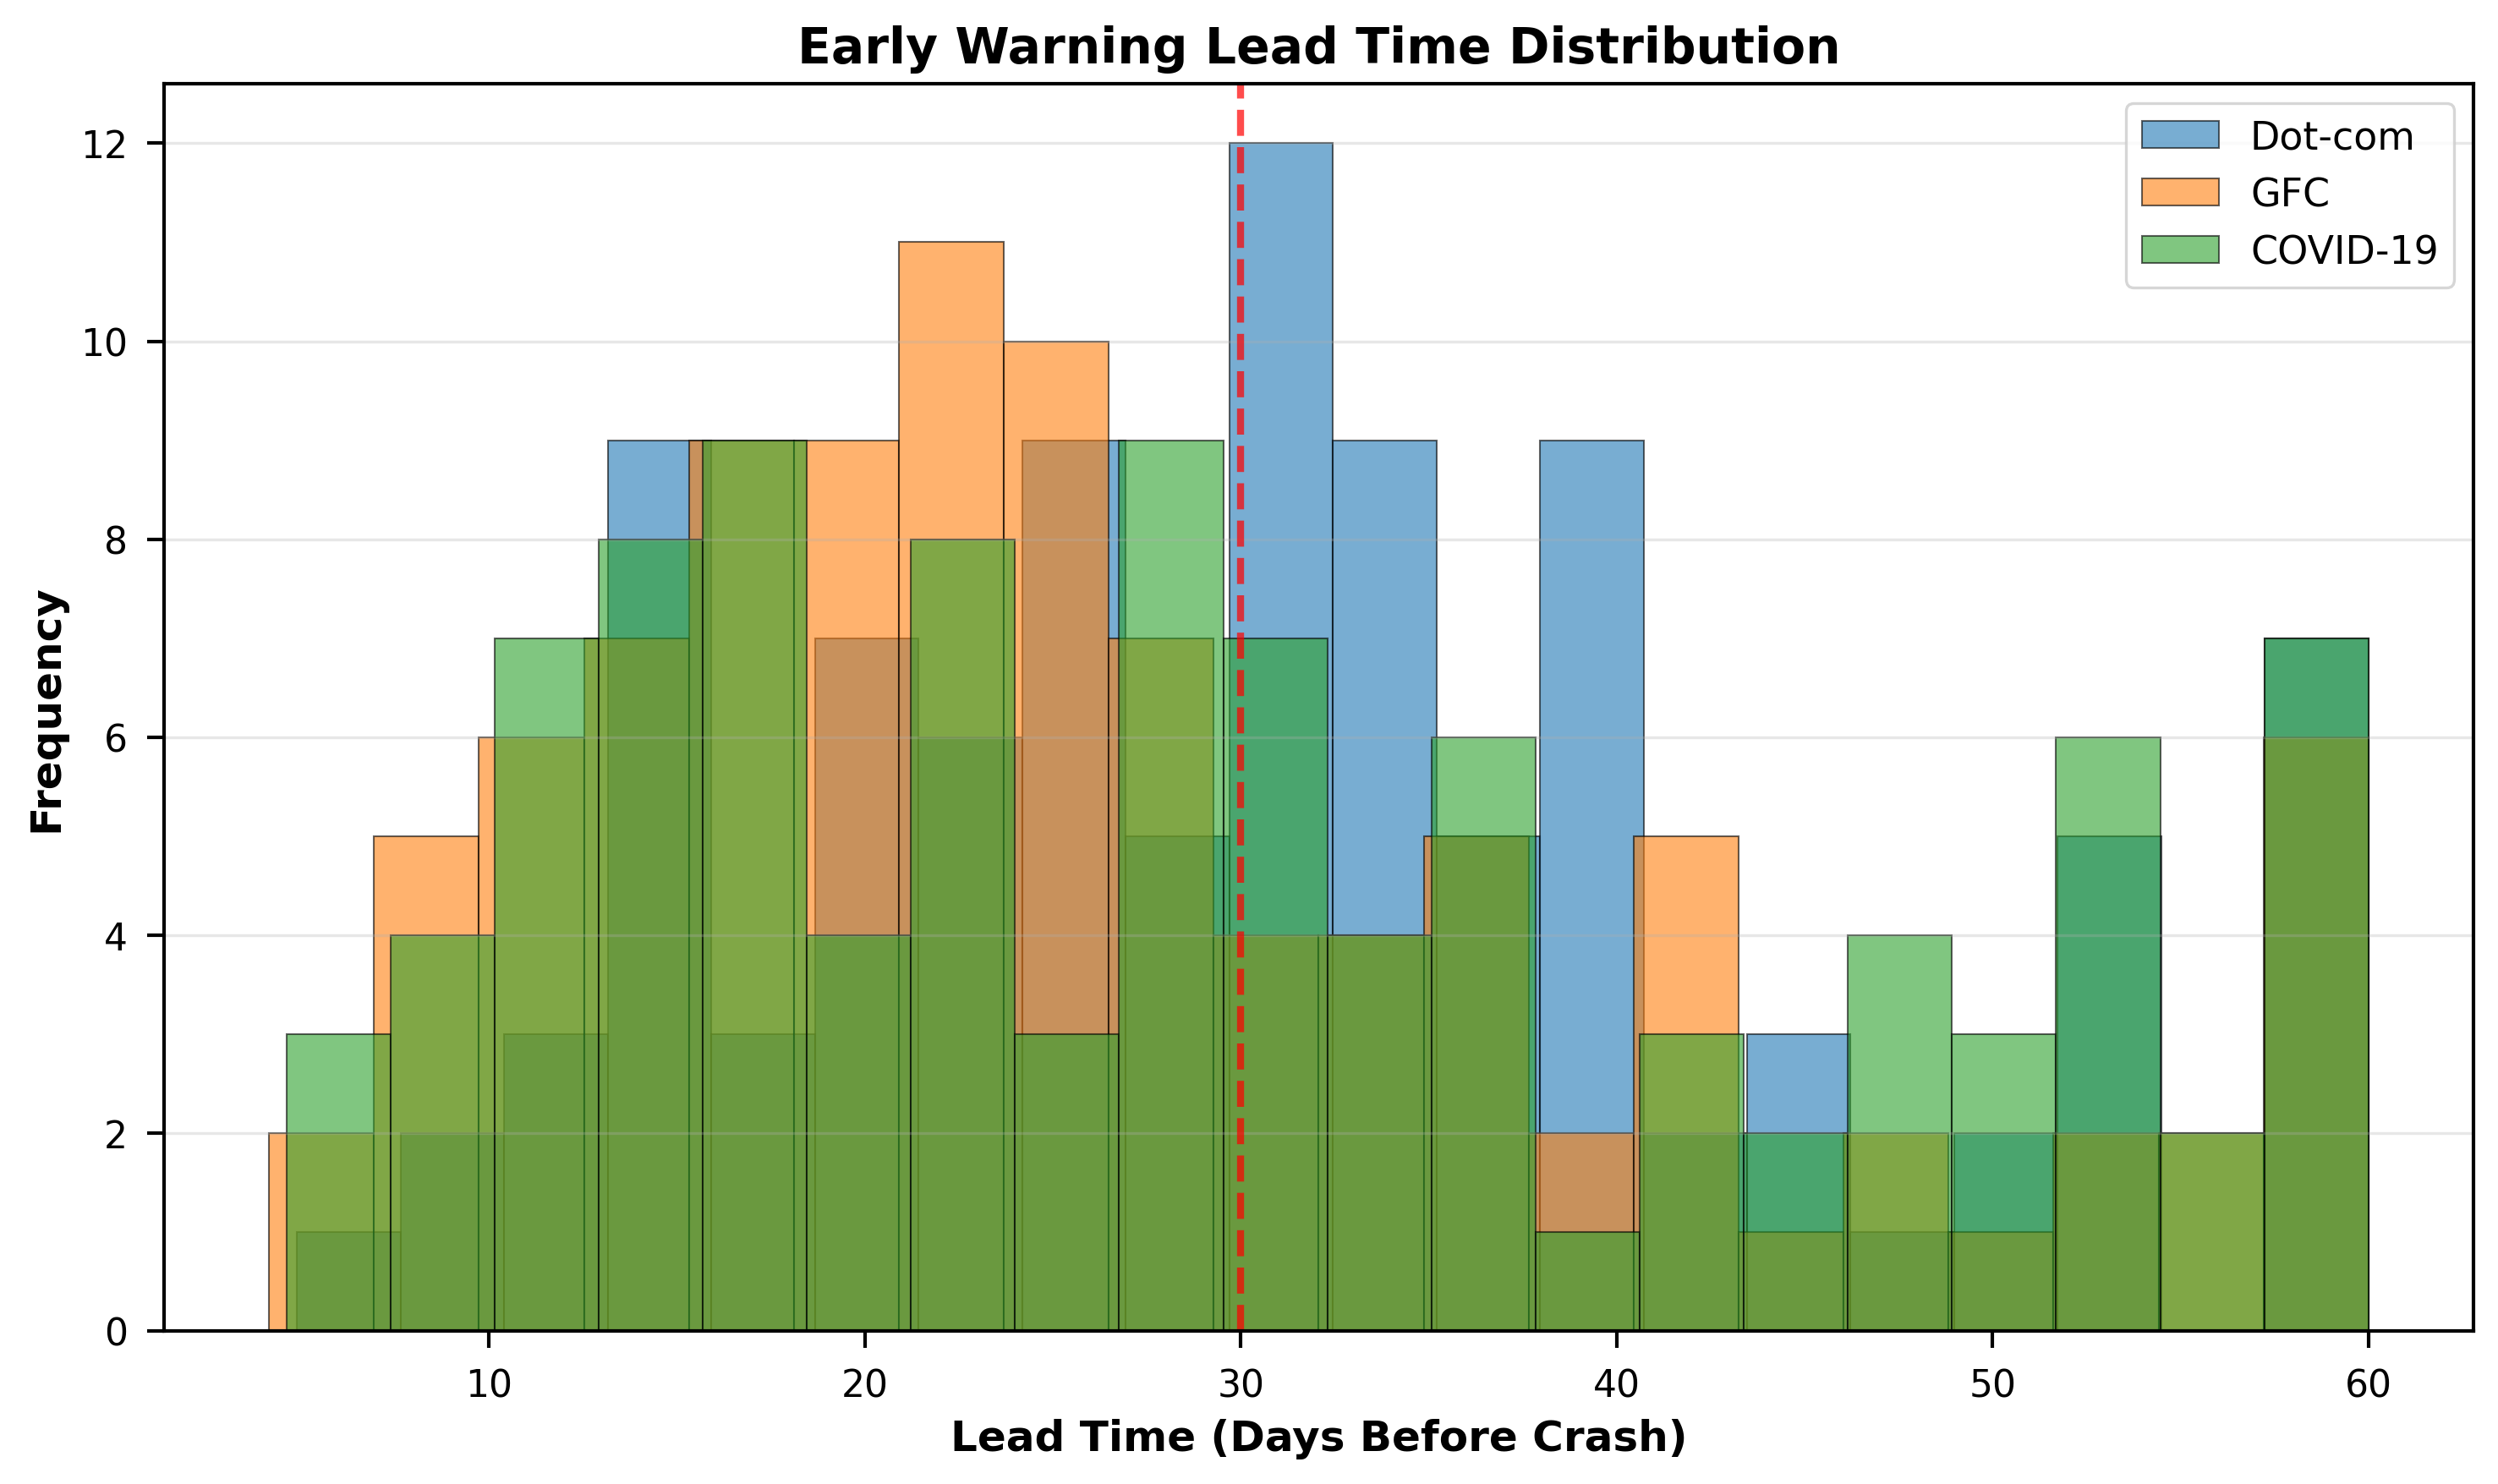
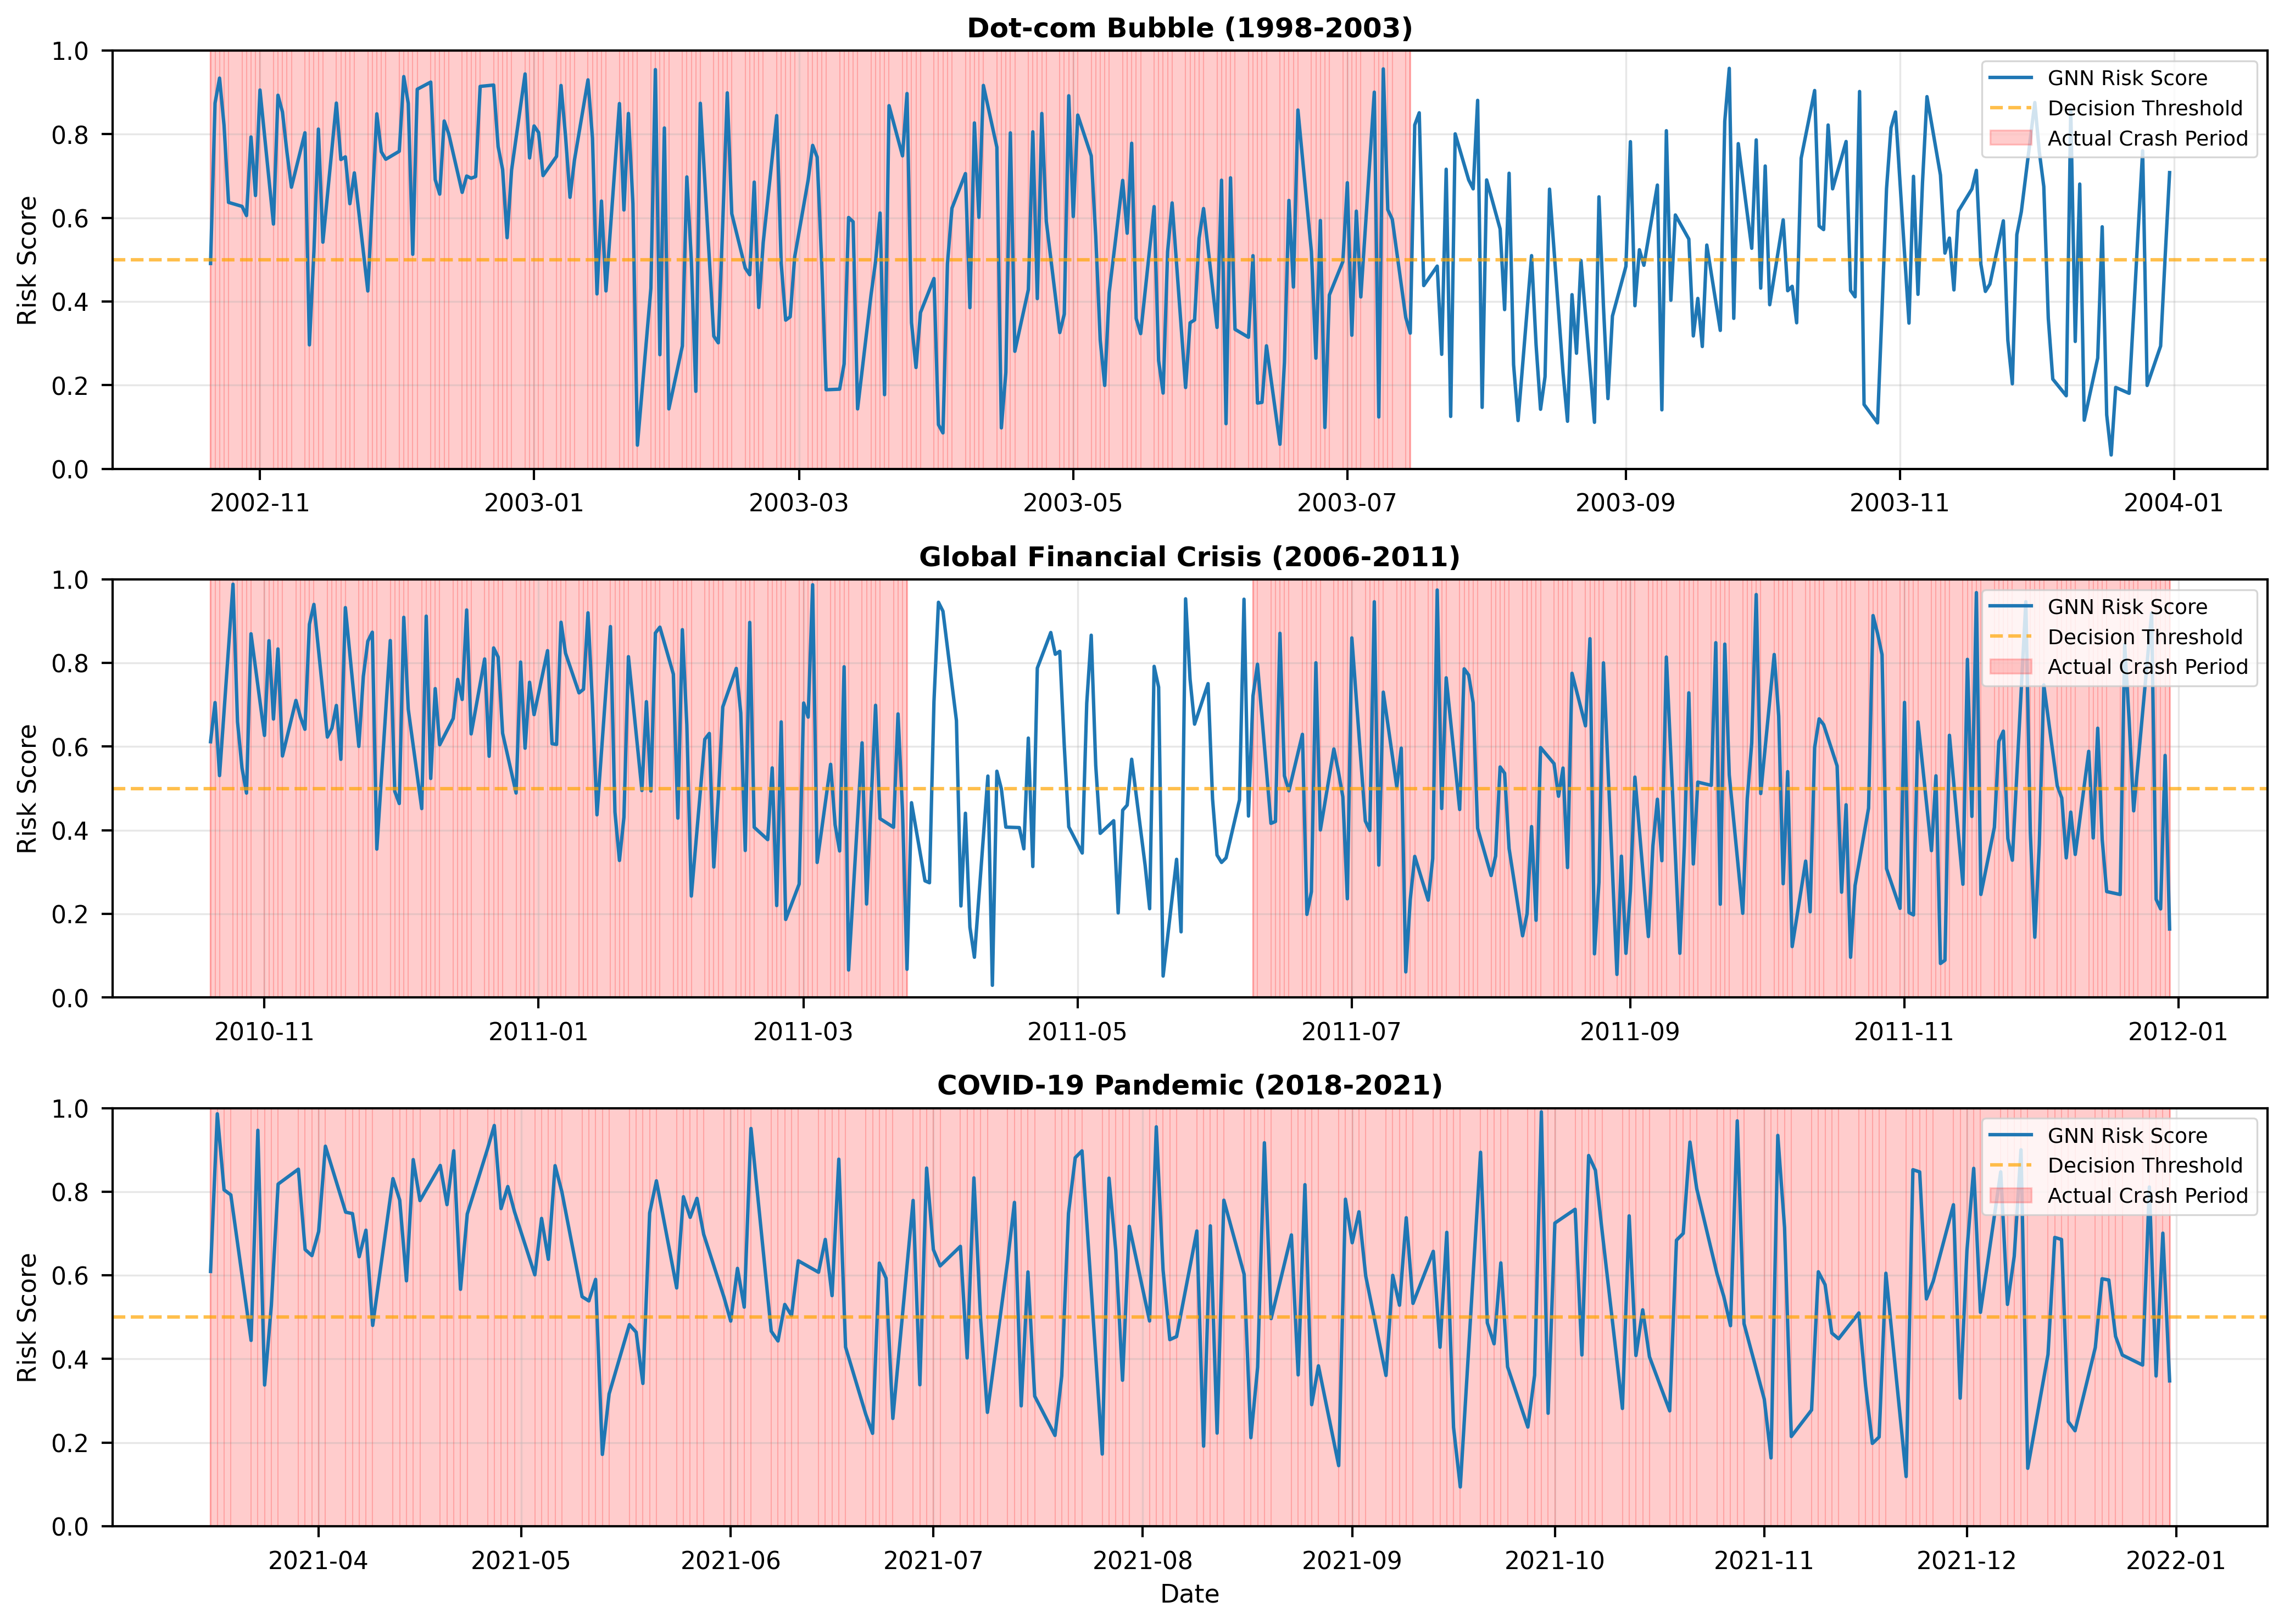
We introduce a modeling approach based on a simple observation: systemic instability shows up in the structure of the market before it shows up in prices. When correlations spike, volatility clusters spread, and sectors synchronize, the system becomes vulnerable. These structural signals precede actual drawdowns and can warn of impending regime shifts.
Recent research has explored complementary approaches at finer levels of granularity. Structural price decomposition methods have been proposed to extract explainable market behavior at the individual instrument level, while multimodal frameworks have been used to identify manipulation and anomaly patterns by aligning market data with social signals (Neela, 2025b;a). However, these approaches operate primarily at the micro or event level and do not model how localized stress accumulates and propagates across the broader market system. SRR is designed to address this gap by modeling systemic risk as an emergent property of market-wide structure rather than isolated signals.
Preliminary empirical analysis shows that graph-based representations provide meaningful early-warning signals of systemic fragility. In particular, simple snapshot GNN models, a simplified temporal GNN prototype, and traditional baselines (logistic regression and Random Forest) capture shifts in correlation structure and volatility clustering during known crisis events. The evaluated temporal model uses only the correlation layer and short graph sequences, but still demonstrates that market topology carries predictive information. These results provide preliminary support for the SRR framework and motivate training the full multi-layer temporal architecture with richer inputs.
Network-based contagion modeling has been widely studied in systemic risk research (Battiston et al., 2012;Haldane & May, 2011;Acemoglu et al., 2015), while correlation networks and random matrix theory have been used to characterize market structure and instability (Mantegna, 1999;Laloux et al., 2000). More recently, graph-based and temporal neural architectures have been applied to financial prediction tasks (Huang et al., 2020;Feng et al., 2019), but their use for macro-level systemic regime detection remains limited.
Systemic risk modeling spans early-warning systems, network-based contagion models, and deep learning for financial forecasting. Traditional early-warning systems use macroeconomic indicators like credit spreads, volatility indexes, and interest rate slopes. These identify broad stress but miss structural market dynamics.
Network models analyze contagion in interbank lending and credit networks through exposure networks, overlapping portfolios, and counterparty risk. Correlation networks proxy market connectivity, and rising correlation precedes instability. But correlation-only approaches produce a single market representation and miss other forms of connectivity.
Deep learning methods (RNNs, hybrid sentiment-market models) forecast volatility and stress but focus on asset-level dynamics, not systemic transitions.
Graph neural networks appear in portfolio optimization and risk propagation but temporal GNNs for systemic regime detection are rare. We know of no prior work combining heterogeneous multi-layer graphs with temporal sequence modeling for systemic risk prediction.
In parallel, the graph neural network literature has developed rapidly, from early graph convolutional networks (Kipf & Welling, 2017) and graph attention architectures (Veličković et al., 2018) to broader surveys of GNN methods (Wu et al., 2020). These models form a natural foundation for learning over financial network structures.
We utilize publicly available market and macroeconomic data, including:
• Equity index and sector ETF prices,
• Volatility indexes such as VIX (available but not used in current experiments),
• Treasury yields and credit spread proxies (future work),
• Sentiment and news-derived indicators (future work).
From these sources, we construct seven daily node-level features: daily returns, 20-day and 60-day rolling
This content is AI-processed based on open access ArXiv data.