시각적 지식 그래프를 활용한 대형 언어 모델 환각 탐지 및 인간‑인‑루프 피드백 프레임워크
Reading time: 4 minute
...
📝 Original Info
Title: 시각적 지식 그래프를 활용한 대형 언어 모델 환각 탐지 및 인간‑인‑루프 피드백 프레임워크
ArXiv ID: 2512.00663
Date: 2025-12-03
Authors: ** - Tanmay Agrawl (University of Arizona, Department of Computer Science) **
📝 Abstract
Large Language Models have rapidly advanced in their ability to interpret and generate natural language. In enterprise settings, they are frequently augmented with closed-source domain knowledge to deliver more contextually informed responses. However, operational constraints such as limited context windows and inconsistencies between pre-training data and supplied knowledge often lead to hallucinations, some of which appear highly credible and escape routine human review. Current mitigation strategies either depend on costly, large-scale gold-standard Q\&A curation or rely on secondary model verification, neither of which offers deterministic assurance. This paper introduces a framework that organizes proprietary knowledge and model-generated content into interactive visual knowledge graphs. The objective is to provide end users with a clear, intuitive view of potential hallucination zones by linking model assertions to underlying sources of truth and indicating confidence levels. Through this visual interface, users can diagnose inconsistencies, identify weak reasoning chains, and supply corrective feedback. The resulting human-in-the-loop workflow creates a structured feedback loop that can enhance model reliability and continuously improve response quality.
💡 Deep Analysis
📄 Full Content
Graphing the Truth: Structured Visualizations for
Automated
Hallucination Detection in LLMs
Tanmay Agrawal
Department of Computer Science, University of Arizona, Tucson, USA
tanmayagrawal21@arizona.edu
Abstract
Large Language Models have rapidly advanced in their ability to interpret and generate natural
language. In enterprise settings, they are frequently augmented with closed-source domain knowl-
edge to deliver more contextually informed responses. However, operational constraints such as
limited context windows and inconsistencies between pre-training data and supplied knowledge of-
ten lead to hallucinations, some of which appear highly credible and escape routine human review.
Current mitigation strategies either depend on costly, large-scale gold-standard Q&A curation or
rely on secondary model verification, neither of which offers deterministic assurance. This paper
introduces a framework that organizes proprietary knowledge and model-generated content into
interactive visual knowledge graphs. The objective is to provide end users with a clear, intuitive
view of potential hallucination zones by linking model assertions to underlying sources of truth
and indicating confidence levels. Through this visual interface, users can diagnose inconsistencies,
identify weak reasoning chains, and supply corrective feedback. The resulting human-in-the-loop
workflow creates a structured feedback loop that can enhance model reliability and continuously
improve response quality.
Key Words: Hallucination Detection, Knowledge Graph Visualization, Retrieval-Augmented Gen-
eration, Human-in-the-Loop Auditing, Closed-Source Knowledge Integration
1
Introduction
Large Language Models (LLMs) have become central to modern natural language processing
due to their strong performance in language understanding and generation [1]. As organizations in-
creasingly deploy these models in high-stakes, knowledge-centric environments, they often augment
LLMs with closed-source datasets to improve factual grounding. While this improves contextual
relevance, it also introduces new risks. Conflicts between pre-training distributions and domain-
specific knowledge, combined with finite context windows, can lead LLMs to generate hallucinations
that appear confident yet factually incorrect [2–4].
1
arXiv:2512.00663v1 [cs.CL] 29 Nov 2025
Much of the current research targets hallucination prevention during generation through im-
proved prompting, retrieval-augmented generation, or enhanced training pipelines. However, enter-
prise use cases frequently require post-hoc auditing of model outputs against authoritative sources,
a capability that remains comparatively underdeveloped.
Recent work explores several post-hoc detection strategies, including evaluator-model frame-
works, explainability-based inspection, and structured graph-based analysis [5–7]. Systems such
as GraphEval [7] demonstrate the promise of triplet-based comparisons for identifying factual
inconsistencies, although limitations in scalability, transparency, and traceability persist. These
challenges highlight the need for more interpretable and operationally efficient solutions.
Visualization techniques present an opportunity to address these gaps. Prior research shows that
visual encodings of semantic relationships can support intuitive inspection, large-scale comparison,
and human-in-the-loop validation of textual content [8–10]. Motivated by these insights, this work
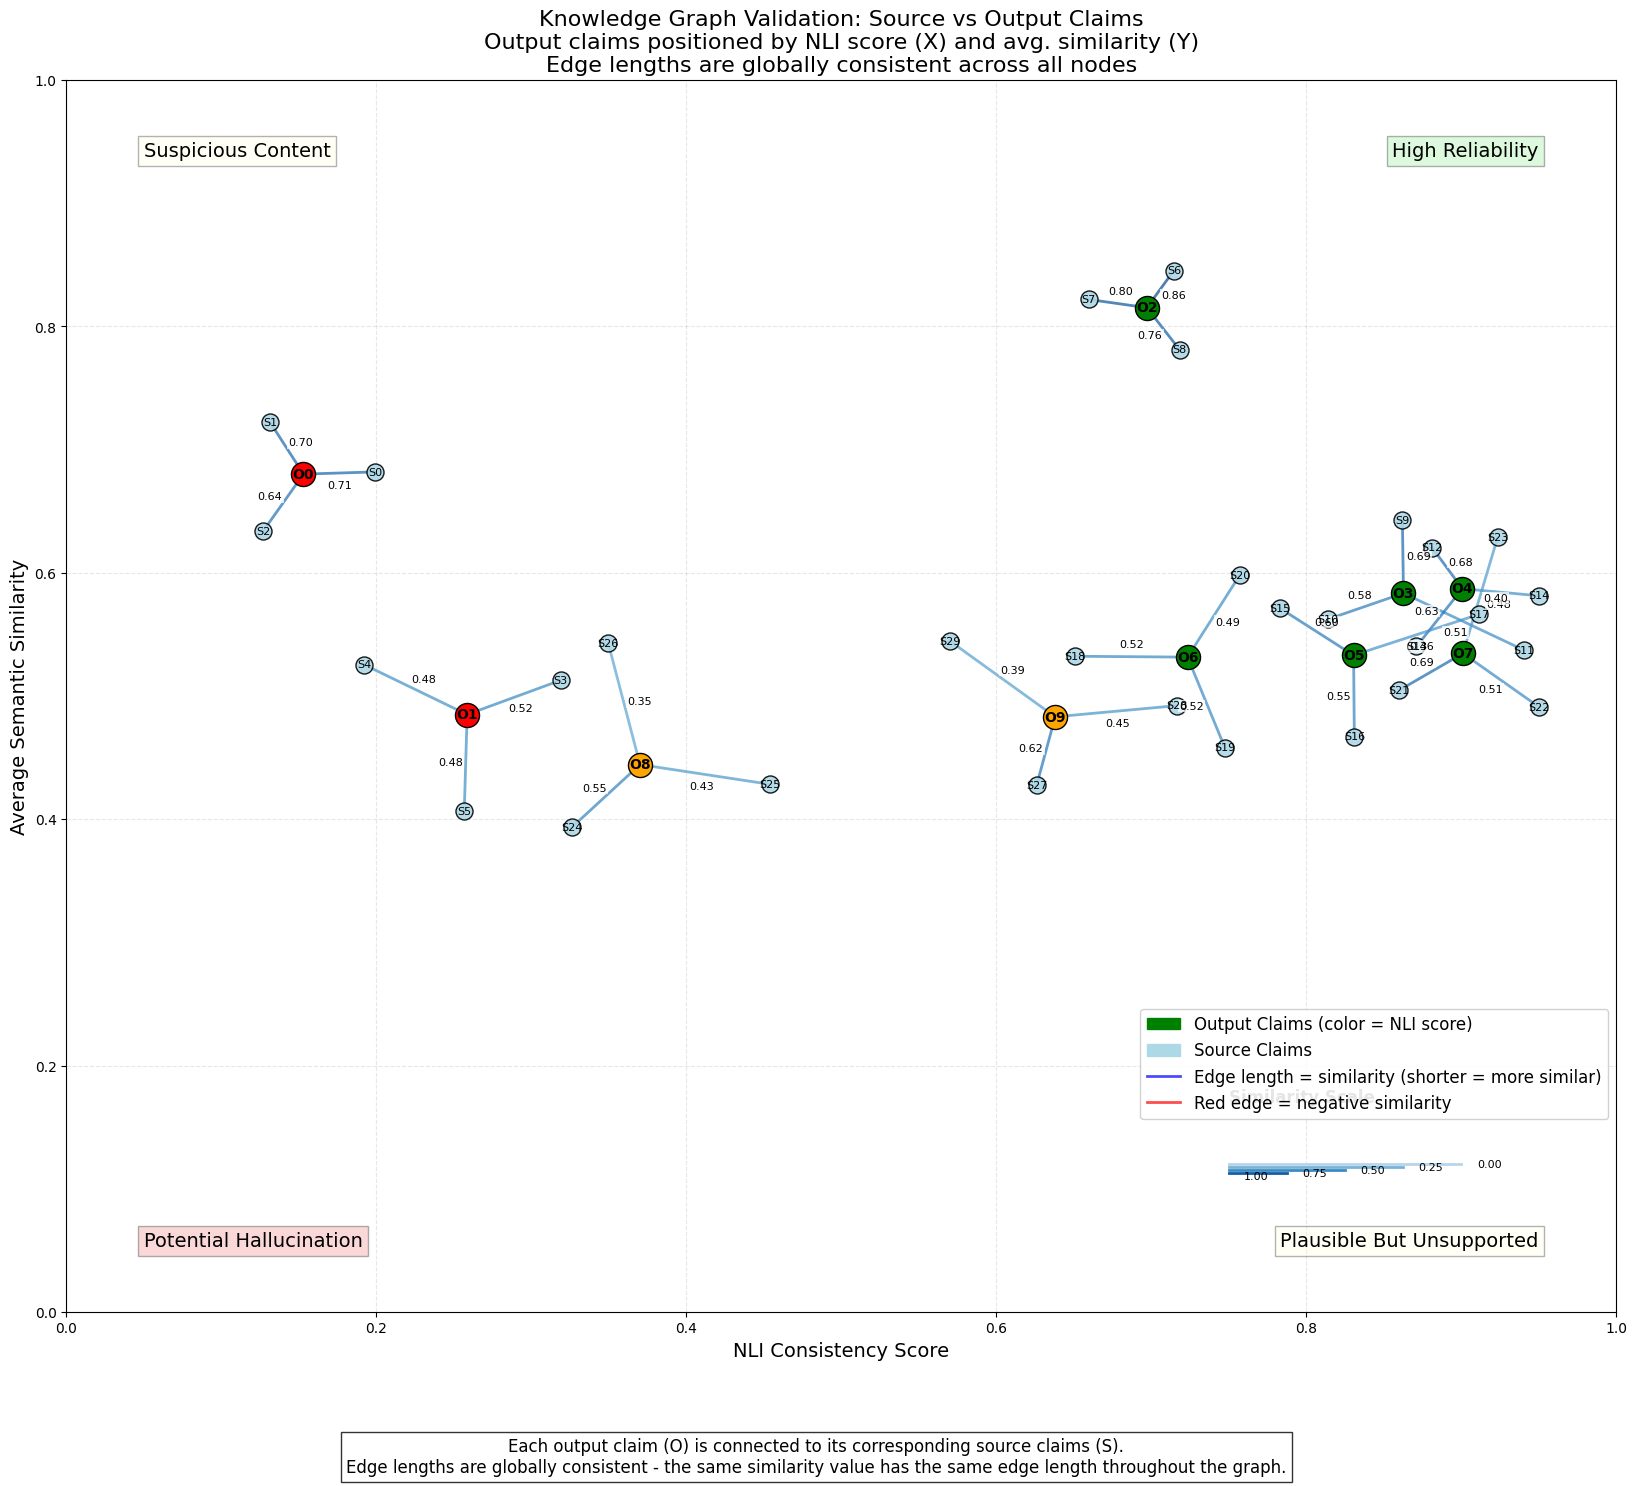
proposes a visualization-driven framework that structures closed-source knowledge and LLM-
generated statements as entity-relationship graphs.
Through interactive visual exploration, the
system enables users to identify potential hallucinations, trace their origins, and provide corrective
feedback that supports more trustworthy and reliable deployment of LLMs in mission-critical
applications.
2
Literature Review
Hallucination detection research follows three major directions. LLM-as-a-Judge approaches
rely on a separate model to evaluate factual consistency, although they frequently inherit correlated
biases and knowledge blind spots [5]. Explainable AI techniques analyze model rationales, attention
patterns, or generated explanations, but empirical evaluations indicate that many such explanations
do not accurately capture the true generative process [6]. Graph-based techniques convert source
material and model outputs into structured triplets or entity-relationship graphs, enabling deter-
ministic comparisons and improved transparency. These methods have gained traction due to their
reproducibility and interpretability [7].
GraphEval represents a leading example of structured evaluation. It translates claims and source
content into (subject, predicate, object) triplets and identifies factual mismatches through direct
comparison [7]. Although effective, the method faces challenges involving computational overhead
from Natural Language Inference pipelines, variability across NLI models, and limited traceabilit