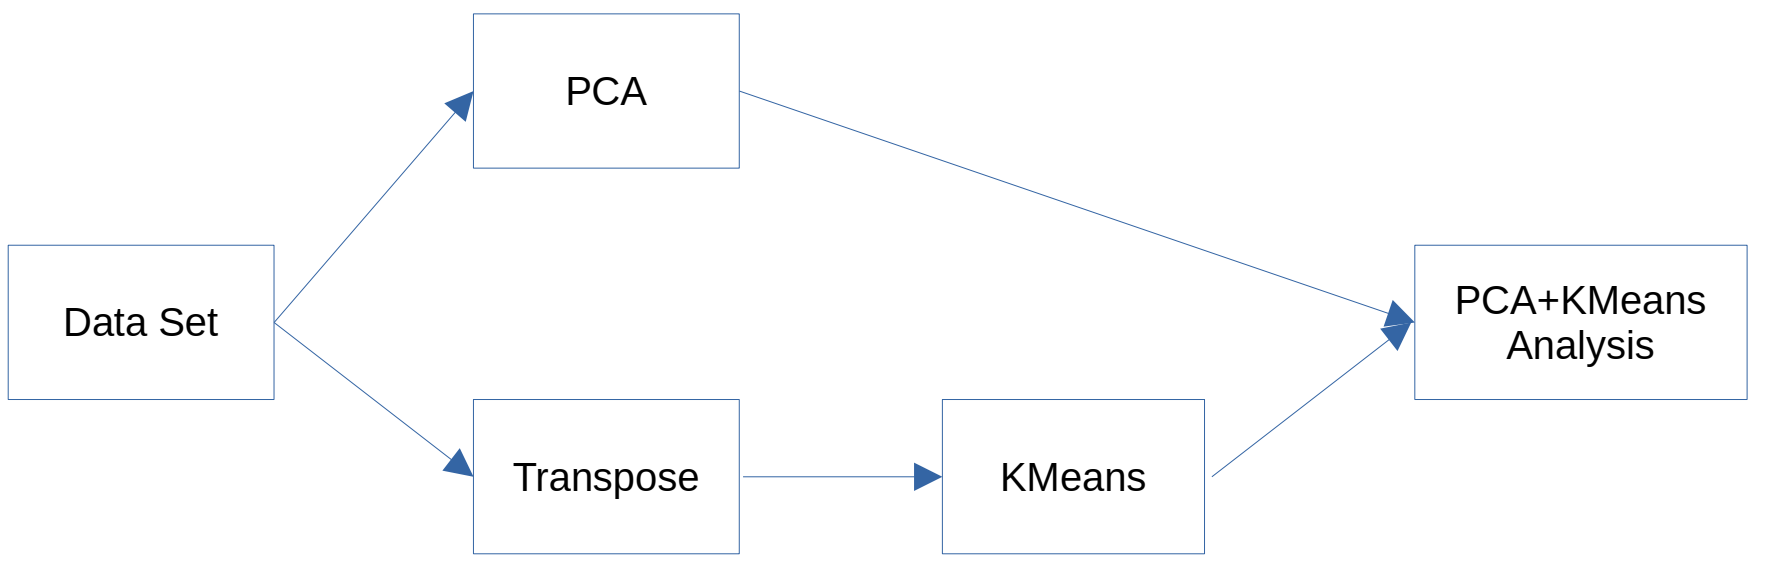
Principal Component Analysis (PCA) and K-means constitute fundamental techniques in multivariate analysis. Although they are frequently applied independently or sequentially to cluster observations, the relationship between them, especially when K-means is used to cluster variables rather than observations, has been scarcely explored. This study seeks to address this gap by proposing an innovative method that analyzes the relationship between clusters of variables obtained by applying K-means on transposed data and the principal components of PCA. Our approach involves applying PCA to the original data and K-means to the transposed data set, where the original variables are converted into observations. The contribution of each variable cluster to each principal component is then quantified using measures based on variable loadings. This process provides a tool to explore and understand the clustering of variables and how such clusters contribute to the principal dimensions of variation identified by PCA.
Multivariate data analysis is essential in a variety of disciplines, such as social sciences, biology, finance, and is fundamentally related to data science. Two Identify applicable funding agency here. If none, delete this.
widely used techniques to explore the internal structure of data are Principal Component Analysis (PCA) and K-means clustering. While PCA focuses on reducing the dimensionality of data and finding directions of maximum variance, K-means groups observations into clusters based on their similarity. Although these techniques are often applied independently, their combination can provide deeper insights into the relationships between variables in the data. However, there is a less explored perspective: how can we group variables in a systematic way and quantify their collective influence on the directions of maximum variability captured by PCA?. Understanding which groups of variables are the main factors driving the variance structure in the data is crucial for interpretation, feature selection and experimental design.
This paper proposes a novel approach that applies K-means to the transposed data matrix, where variables are treated as “observations,” in order to group variables with similar behavioral patterns. The contribution of these clusters is then formally quantified with respect to each principal component of PCA, providing an exploratory tool that enriches PCA interpretation and highlights how clusters of variables influence the main dimensions of variability. This approach is especially relevant for high-dimensional data and has potential applications across fields where understanding relationships between variables is essential for data-driven decision making. The following sections present the proposed method, experimental results, and its implications for multivariate data analysis.
Principal Component Analysis (PCA) and K-means clustering are fundamental techniques in multivariate data analysis, each with specific objectives and applications. On the one hand, the PCA technique, introduced by Karl Pearson [2] and Harold Hotelling [1], seeks to transform a set of possibly correlated variables into a new set of uncorrelated variables called principal components. These components capture the maximum variance present in the data, allowing efficient dimensionality reduction and facilitating the visualization and analysis of intrinsic patterns.
On the other hand, K-means [3], corresponds to an iterative clustering method that organizes data into clusters based on minimizing the sum of the quadratic distances between observations and their respective centroids. Its simplicity and efficiency have made it one of the most widely used clustering techniques in practical applications.
The combination of PCA and K-means is a widely used technique in unsupervised learning to reduce data dimensionality and perform effective clustering. The relationship between PCA and K-means has been studied in several papers. In [4] they showed that the first principal components of the data are related to minimizing the sum of quadratic distances within clusters in K-means. This finding suggests that the two techniques, although conceptually distinct, may complement each other in certain contexts. In [5], the effectiveness of principal component analysis in identifying cluster structures in gene expression data is investigated by comparing the quality of clusters obtained from original data with those derived from projections onto principal component subspaces. Their findings suggest that the use of PCA does not always improve the quality of clusters, questioning its usefulness as a preliminary step in the analysis of gene expression data. In [6], it is mentioned that combining PCA with clustering techniques allows for better identification of patterns in the data. PCA reduces dimensionality, facilitating the application of clustering algorithms, such as K-means, to group similar observations into a more manageable space. These interesting features have been widely exploited to improve visualisation and interpretation of the formed groups, making the underlying structure of the analyzed data more evident. It has been shown that applying PCA to the data set to subsequently apply K-means improves clustering performance by mitigating the curse of dimensionality, which can hide significant patterns in high-dimensional data [9].
Moreover, authors of [7] discuss how PCA can improve K-means initialization. In [8], PCA acts as a pre-processing tool that improves the efficiency of Kmeans by simplifying the feature space and revealing hidden structures in the data, resulting in more accurate customer segmentation useful for marketing strategies.
However, most of the existing studies focus on analyzing observations (rows of data) as grouping objects, whereas the grouping of variables (columns) is often approached from different perspectives, such as factor analysis or hierarchical clustering. Transposing the
This content is AI-processed based on open access ArXiv data.