This article attempts answering the following problematic: How to model and classify energy consumption profiles over a large distributed territory to optimize the management of buildings' consumption?
Doing case-by-case in depth auditing of thousands of buildings would require a massive amount of time and money as well as a significant number of qualified people. Thus, an automated method must be developed to establish a relevant and effective recommendations system.
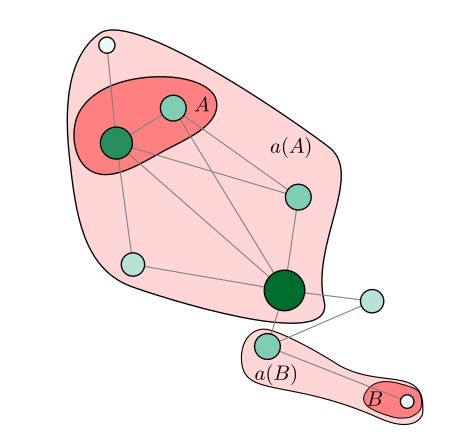
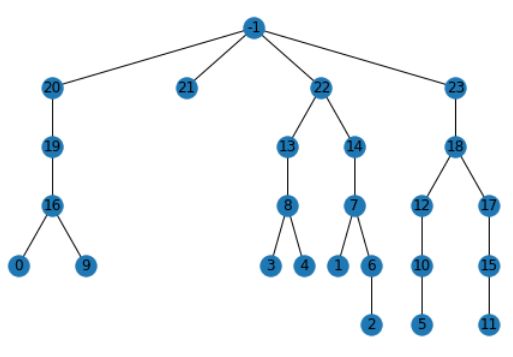
To answer this problematic, pretopology is used to model the sites' consumption profiles and a multi-criterion hierarchical classification algorithm, using the properties of pretopological space, has been developed in a Python library.
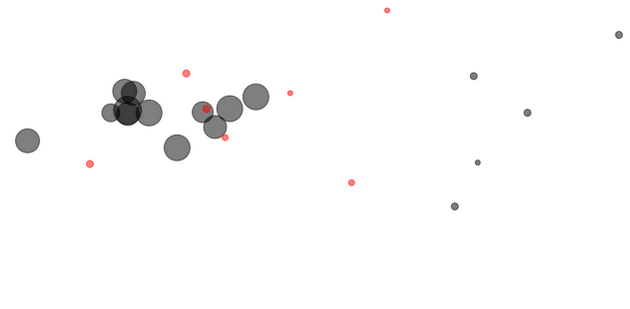
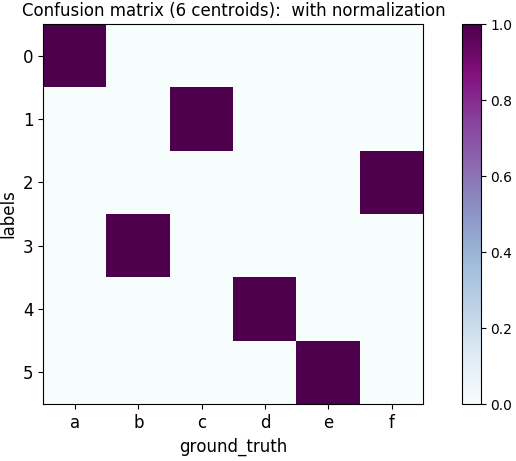
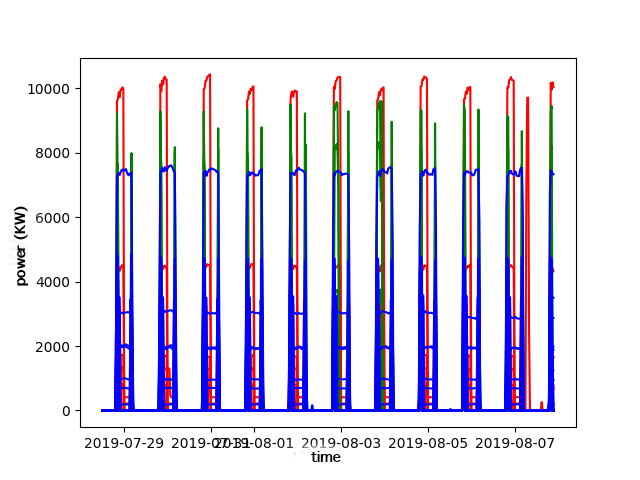
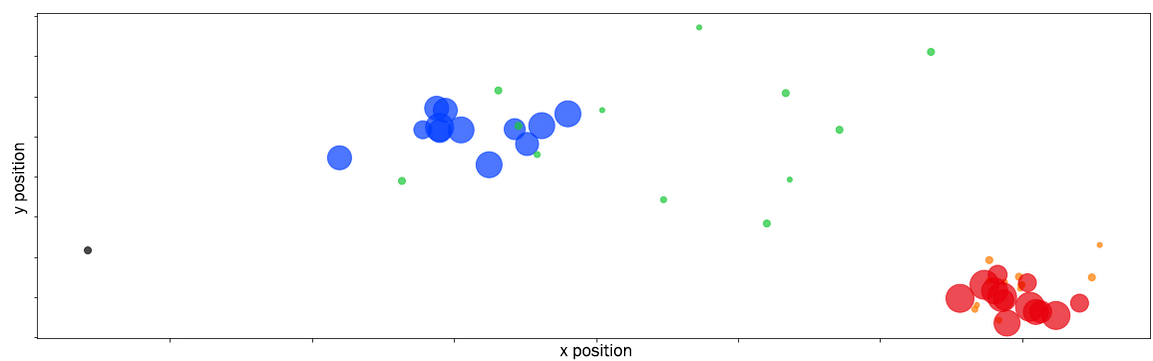
To evaluate the results, three data sets are used: A generated set of dots of various sizes in a 2D space, a generated set of time series and a set of consumption time series of 400 real consumption sites from a French Energy company.
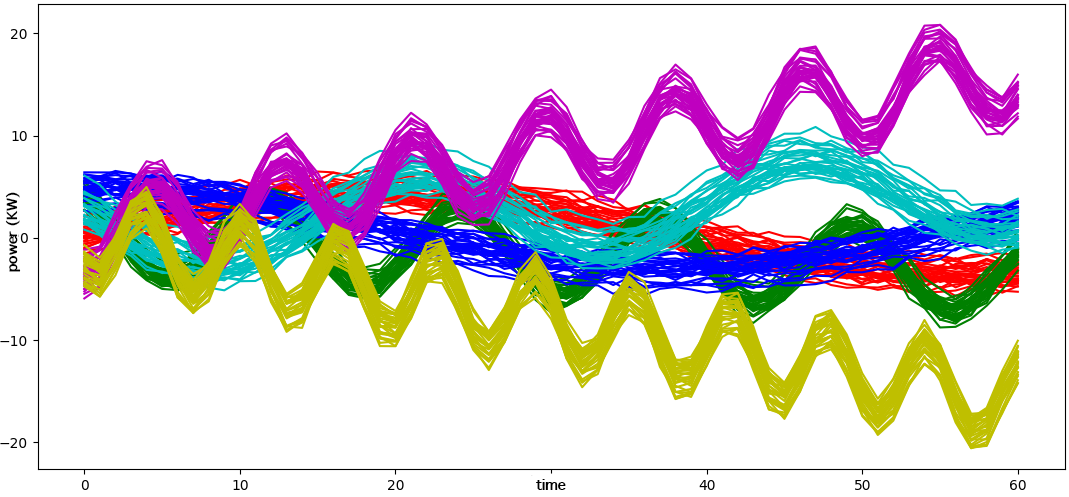
On the point data set, the algorithm is able to identify the clusters of points using their position in space and their size as parameter. On the generated time series, the algorithm is able to identify the time series clusters using Pearson's correlation with an Adjusted Rand Index (ARI) of 1.
In 2015 was signed the Paris agreement in which government from all over the world undertook to keep global warming behind a 2 • C increase compared to the arXiv:2512.03069v1 [cs.LG] 27 Nov 2025 temperatures of 1990. The year of the Cop21, the worldwide buildings sector was responsible for 30% of global final energy consumption and nearly 28% of total direct and indirect CO 2 emissions. Yet the energy demand from buildings and building's construction still rises, driven by improved access to energy in developing countries, greater ownership and use of energy-consuming devices and rapid growth in global buildings floor area, at nearly 3% per year 6 . The International Energy Agency's Reference Technology Scenario (RTS), which accounts for existing building energy policies and climate-related commitments, shows that final energy demand in the global buildings sector will increase by 30% by 2060 without more ambitious efforts to address low-carbon and energy-efficient solutions for buildings and construction. As a result, buildings-related CO 2 emissions would increase by another 10% by 2060, adding as much as 415 GtCO 2 to the atmosphere over the next 40 years -the half of the remaining 2 • C carbon budget and twice what buildings emitted between 1990 and 2016. 7 Yet there are significant opportunities for improvement, as in the United States where 16% of energy savings could be achieved by reducing performance deficiencies [23]. Energy actors such as Trusted Third-Party for Energy Measurement and Performance can play a role in identifying the most relevant actions to optimize energy consumption by exploiting the massive energy data now available [6].
There are many ways to decrease buildings’ energy consumption [9]: social programs, incentive programs, new energies, energy efficiency, dynamic pricing, demand-response programs. But it is challenging to identify precisely what action to take.
Furthermore, the energy systems are not necessarily buildings. They can be a building floor or simply a place inside a building. In consequence, it is more accurate to talk about sites [6].
The scales of analysis are various both in time (consumption time series are analyzed on a 24h profile as well as on a yearly profile) and space (the studied system can go from one room to a group of buildings across a country). Because of that, there is no universal performance scale on which to compare a site to another.
Because sites present an important heterogeneity both in intrinsic properties and geographic situation [22] only a comparison between similar sites might be meaningful to understand the performance of a new site. By investigating the works that were effective on a certain site, one can deduce what programs will probably be efficient for sites of similar nature. Hence, clustering sites based on their characteristics and consumption will enhance their evaluation and the recommendations system.
Therefore the topic of our paper is as following: How to cluster a large number of heterogeneous sites based on their energy consumption profiles to recommend the most relevant energy optimization solution possible?
In this article, we will consider that the energy consumption profile encompasses all the physical characteristics of a site as well as the external factors and the consumption data (time series, categorical data and numerical data). The latter is considered as a time series.
Our goal is to study a group of sites to optimize their consumption thanks to recommendations done on similar sites. This can be assimilated to portfolio analysis. Portfolio analysis represents a domain in which a large group of buildings, often located in the same geographical area or owned or managed by the same entity, are analyzed for the purpose of managing or optimizing the group as a whole [22].
The key contribution of this paper is to provide a clustering method adapted to portfolio analysis based on a pretopological framework. -new definitions, properties, and demonstrations -detailed explanations of the algorithms and their pseudo-codes Compared to the previous paper [17] this paper gives greater theoretical understanding of pretopology through added definitions, properties, and demonstration. It demonstrates how the pretopological framework used for the algorithms allows for the clustering of any finite set of items. It also explains the algorithms in greater details as well as presenting the pseudo-code of the algorithms. It also discusses the future work to exploit clustering for energy performance
The paper is structured as follows: the section 2 introduces clustering methods and some relevant examples on energy systems. The section 3 presents the pretopology theory and the different types of pretopological spaces. The section 4 explains in details the algorithms developped in the python library with pseudo-code, demonstrating how all finite set of items can be hierarchically clustered. The section 5 presents the clustering
This content is AI-processed based on open access ArXiv data.