Title: A novel k-means clustering approach using two distance measures for Gaussian data
ArXiv ID: 2511.17823
Date: 2025-11-21
Authors: Naitik Gada
📝 Abstract
Clustering algorithms have long been the topic of research, representing the more popular side of unsupervised learning. Since clustering analysis is one of the best ways to find some clarity and structure within raw data, this paper explores a novel approach to \textit{k}-means clustering. Here we present a \textit{k}-means clustering algorithm that takes both the within cluster distance (WCD) and the inter cluster distance (ICD) as the distance metric to cluster the data into \emph{k} clusters pre-determined by the Calinski-Harabasz criterion in order to provide a more robust output for the clustering analysis. The idea with this approach is that by including both the measurement metrics, the convergence of the data into their clusters becomes solidified and more robust. We run the algorithm with some synthetically produced data and also some benchmark data sets obtained from the UCI repository. The results show that the convergence of the data into their respective clusters is more accurate by using both WCD and ICD measurement metrics. The algorithm is also better at clustering the outliers into their true clusters as opposed to the traditional \textit{k} means method. We also address some interesting possible research topics that reveal themselves as we answer the questions we initially set out to address.
💡 Deep Analysis
📄 Full Content
A novel k-means clustering approach using two
distance measures for Gaussian data
School of Mathematical Sciences
College of Science
Rochester Institute of Technology
Naitik H. Gada
22nd October, 2022
arXiv:2511.17823v1 [cs.LG] 21 Nov 2025
Abstract
Clustering algorithms have long been the topic of research, representing the more
popular side of unsupervised learning. Since clustering analysis is one of the best
ways to find some clarity and structure within raw data, this paper explores a novel
approach to k-means clustering. Here we present a k-means clustering algorithm
that takes both the within cluster distance (WCD) and the inter cluster distance
(ICD) as the distance metric to cluster the data into k clusters pre-determined
by the Calinski-Harabasz criterion in order to provide a more robust output for
the clustering analysis.
The idea with this approach is that by including both
the measurement metrics, the convergence of the data into their clusters becomes
solidified and more robust. We run the algorithm with some synthetically produced
data and also some benchmark data sets obtained from the UCI repository. The
results show that the convergence of the data into their respective clusters is more
accurate by using both WCD and ICD measurement metrics. The algorithm is also
better at clustering the outliers into their true clusters as opposed to the traditional
k means method. We also address some interesting possible research topics that
reveal themselves as we answer the questions we initially set out to address.
1
Contents
1
Introduction
3
1.1
Clustering Analysis . . . . . . . . . . . . . . . . . . . . . . . . . . . .
4
1.2
k-means Clustering . . . . . . . . . . . . . . . . . . . . . . . . . . . .
5
2
Related Work
6
2.1
Literature Assessment
. . . . . . . . . . . . . . . . . . . . . . . . . .
6
2.2
Inspiration and Hypothesis . . . . . . . . . . . . . . . . . . . . . . . .
7
3
Algorithm Overview
8
3.1
Description
. . . . . . . . . . . . . . . . . . . . . . . . . . . . . . . .
8
3.2
Terms and Definitions
. . . . . . . . . . . . . . . . . . . . . . . . . .
9
3.3
Pseudocode . . . . . . . . . . . . . . . . . . . . . . . . . . . . . . . .
10
4
Data
11
4.1
Synthetic Data
. . . . . . . . . . . . . . . . . . . . . . . . . . . . . .
11
4.2
UCI Machine Learning Repository . . . . . . . . . . . . . . . . . . . .
12
5
Results and Observations
13
5.1
Synthetic Data Sets . . . . . . . . . . . . . . . . . . . . . . . . . . . .
13
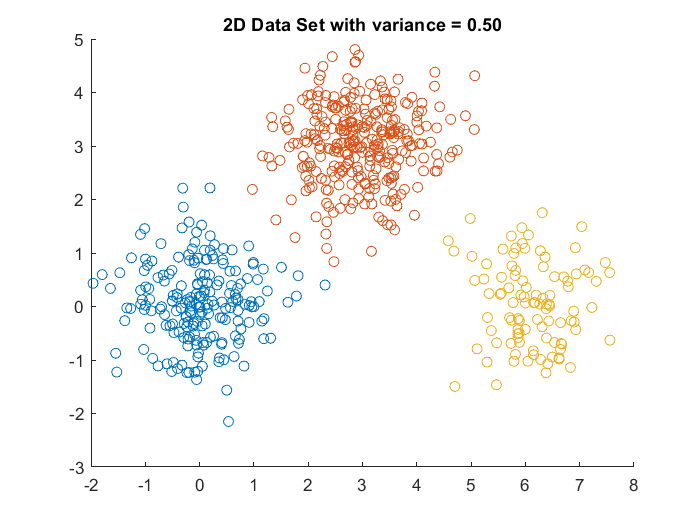
5.1.1
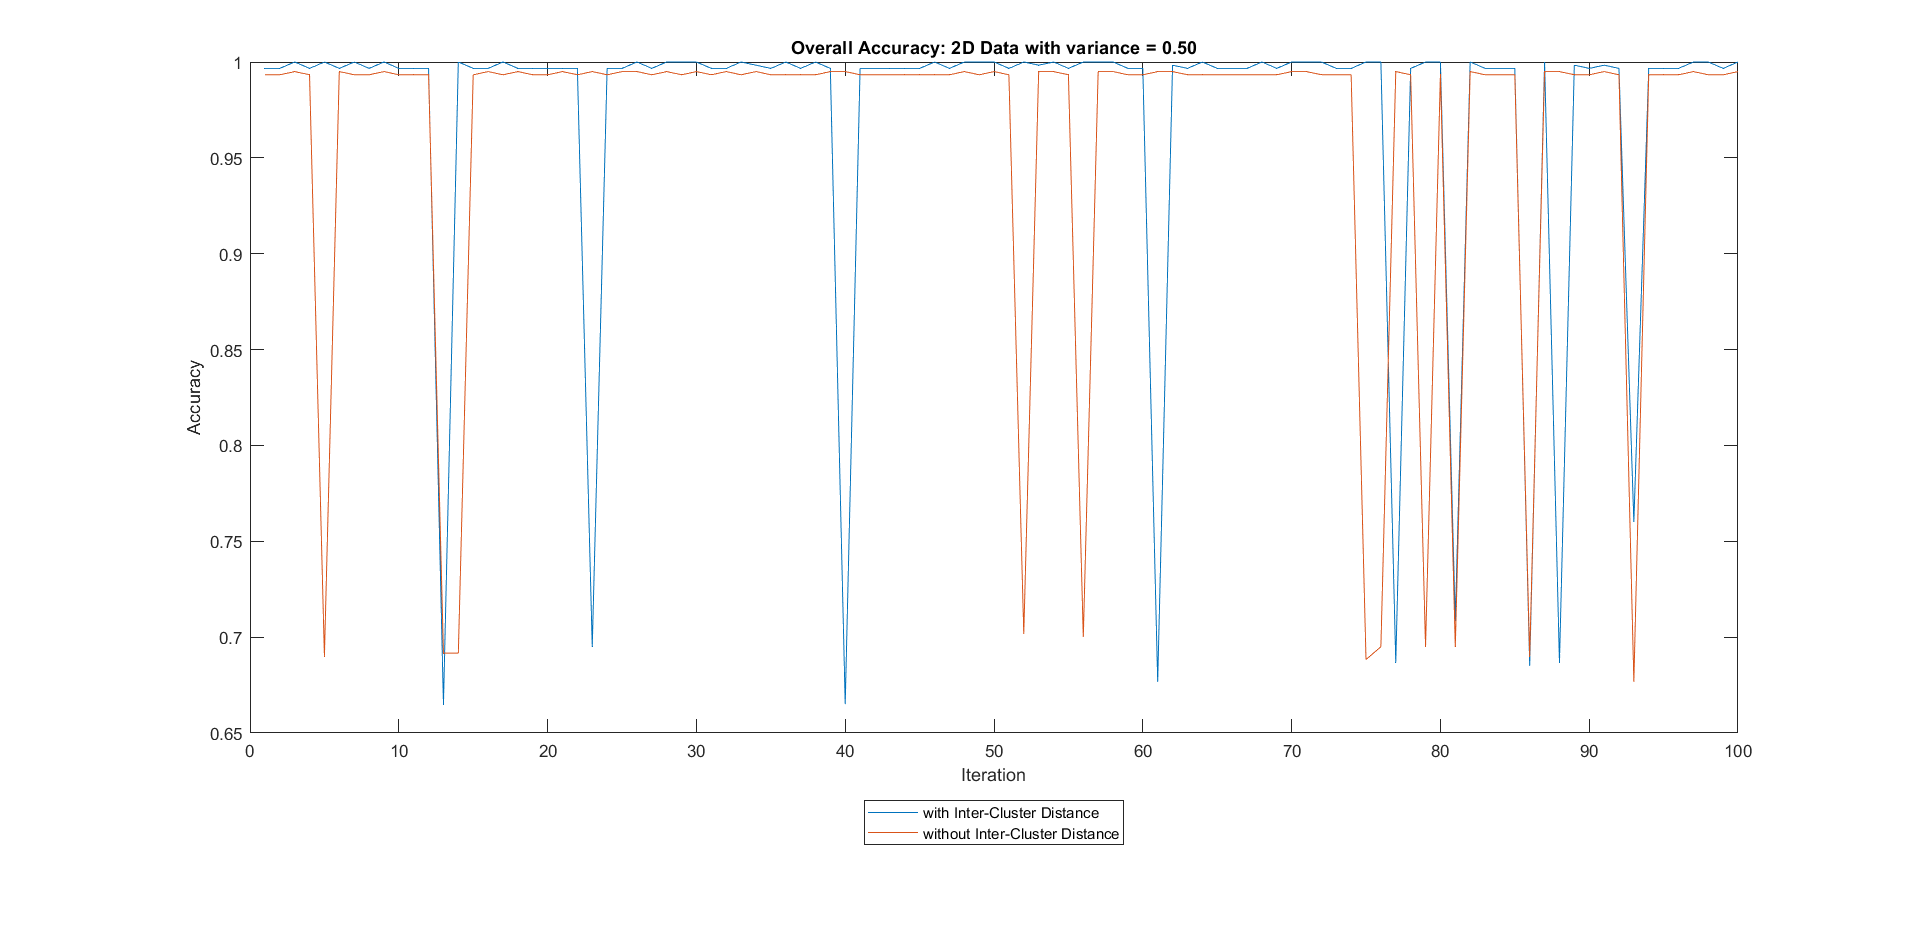
2D Data with variance = 0.5 . . . . . . . . . . . . . . . . . . .
13
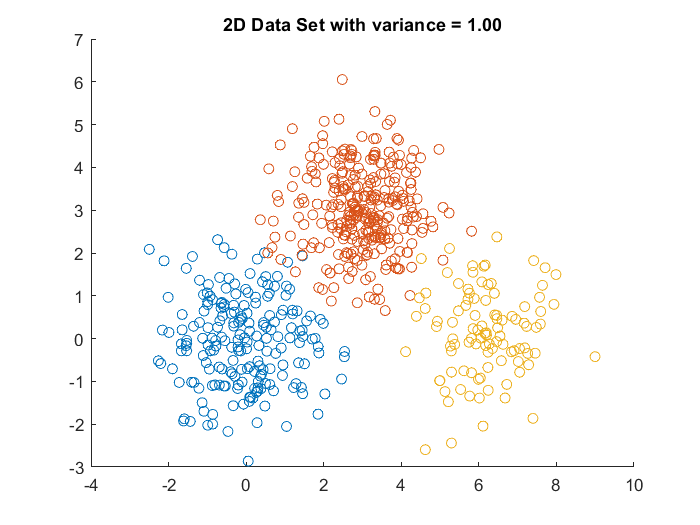
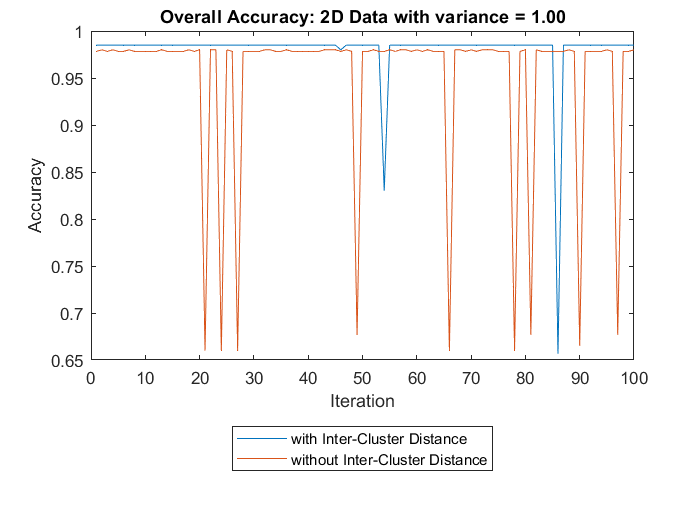
5.1.2
2D Data with variance = 1 . . . . . . . . . . . . . . . . . . . .
15
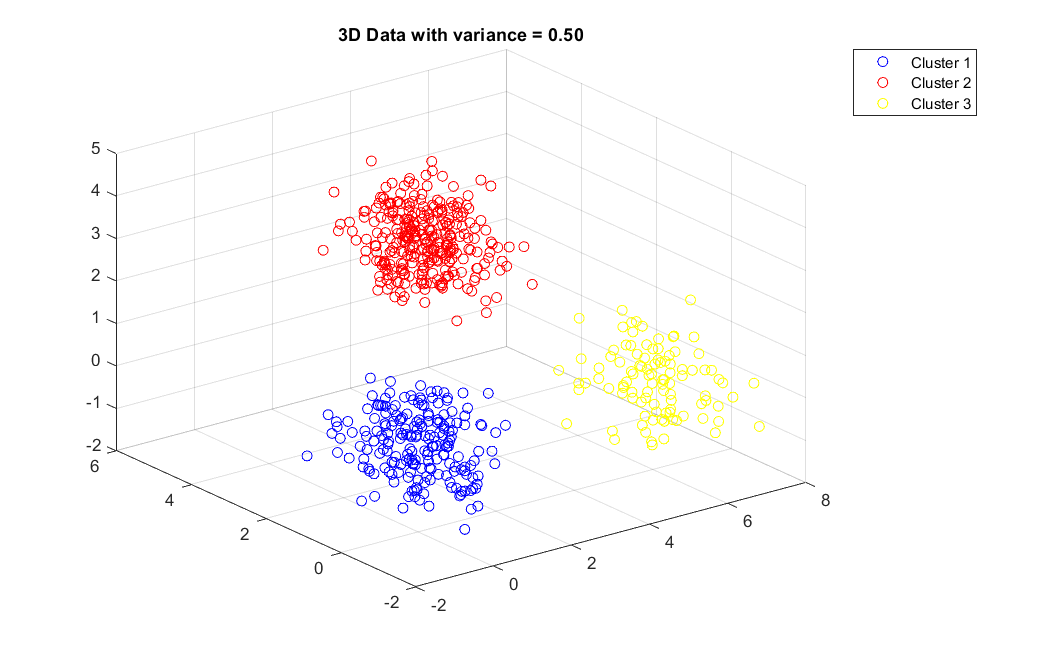
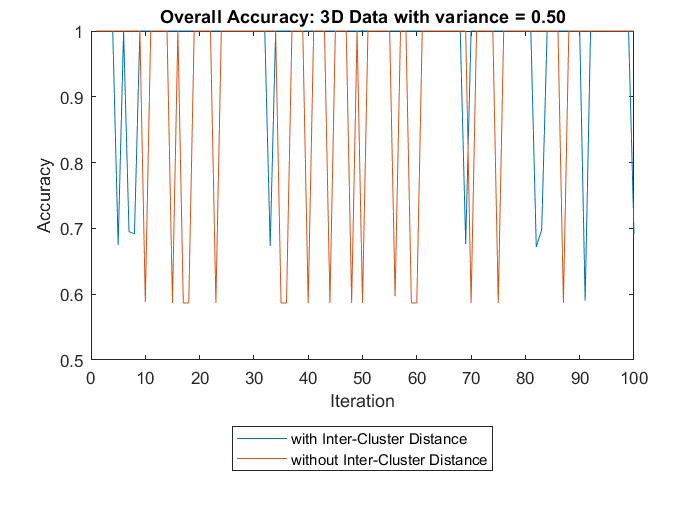
5.1.3
3D Data with variance = 0.5 . . . . . . . . . . . . . . . . . . .
17
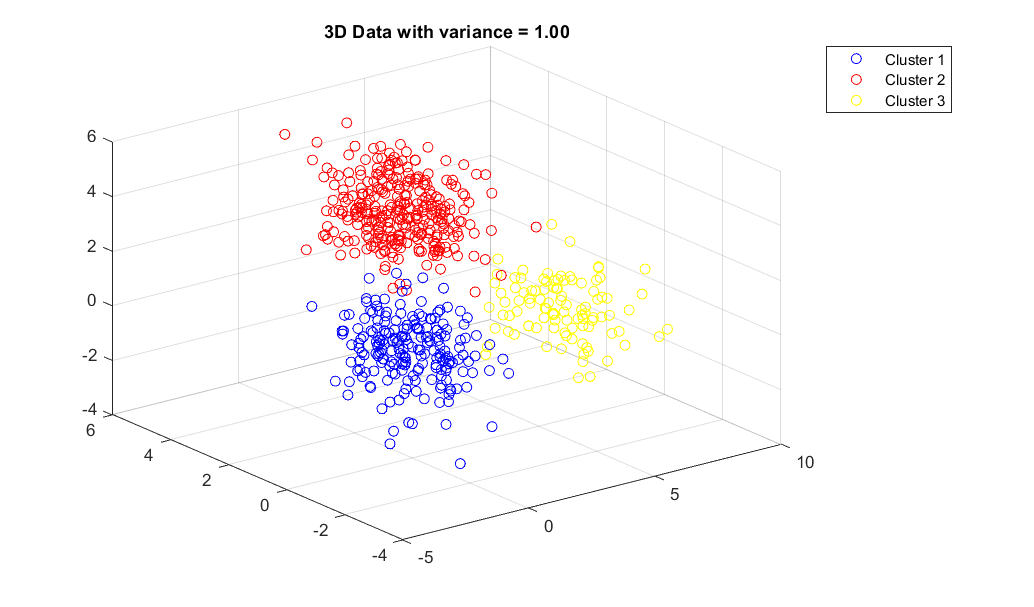
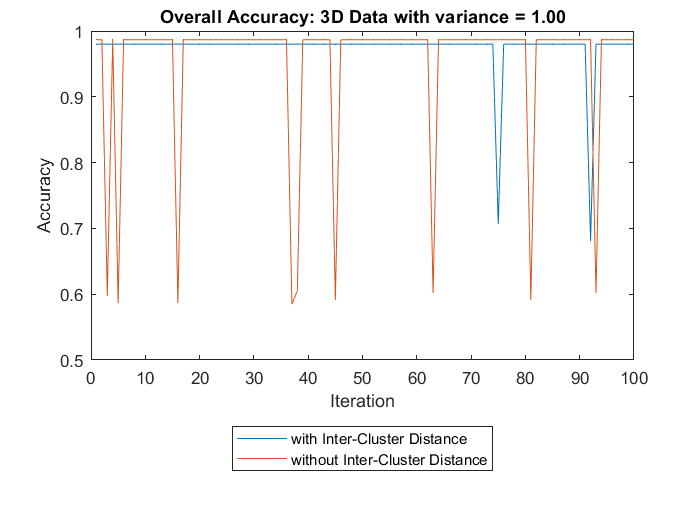
5.1.4
3D Data with variance = 1 . . . . . . . . . . . . . . . . . . . .
19
5.2
UCI Machine Learning Repository . . . . . . . . . . . . . . . . . . . .
21
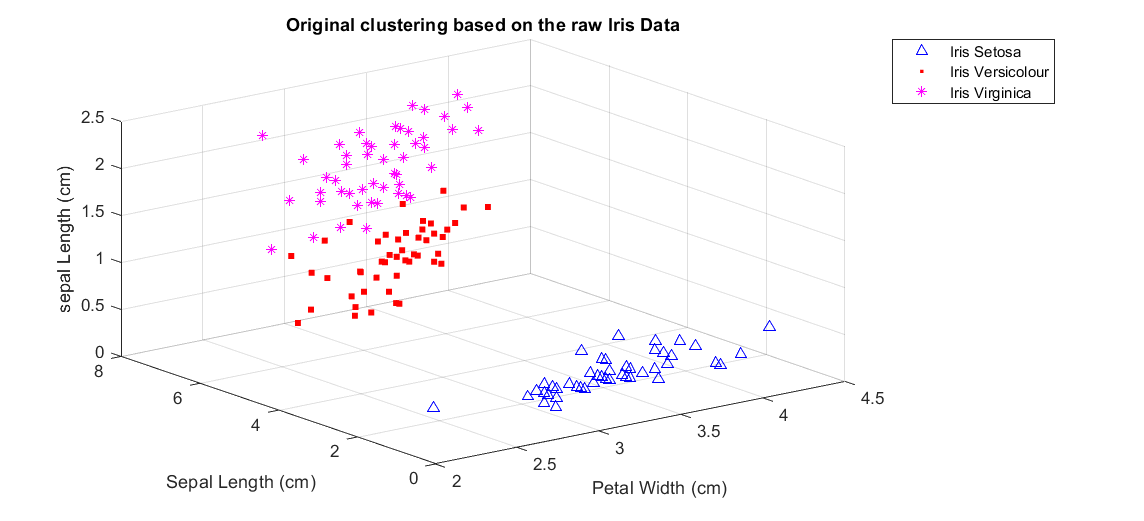
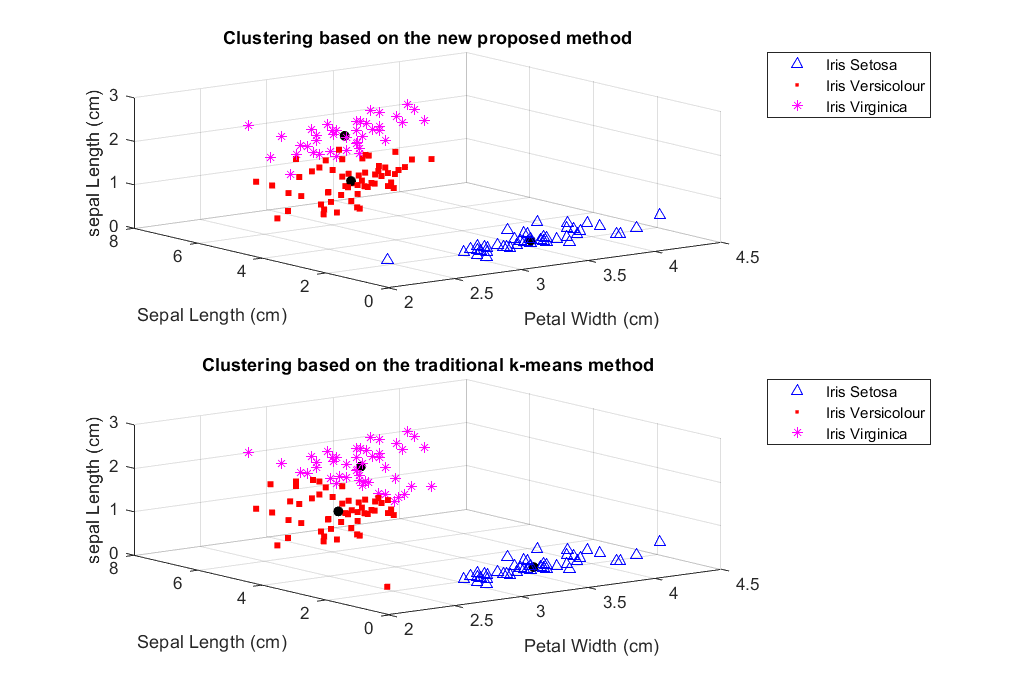
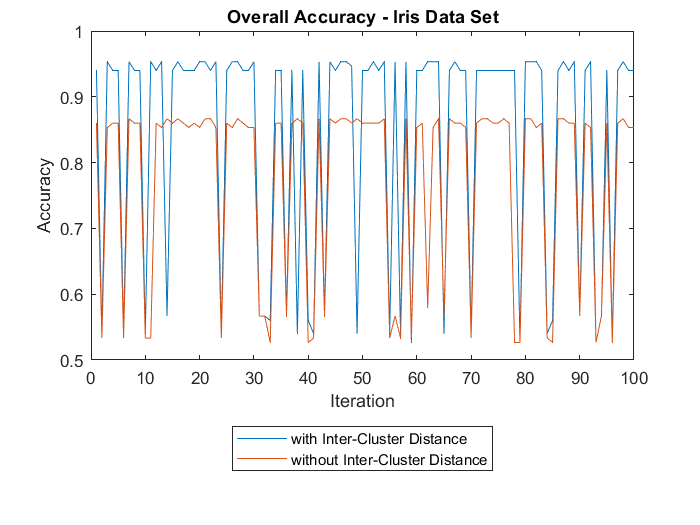
5.2.1
Iris Data set . . . . . . . . . . . . . . . . . . . . . . . . . . . .
21
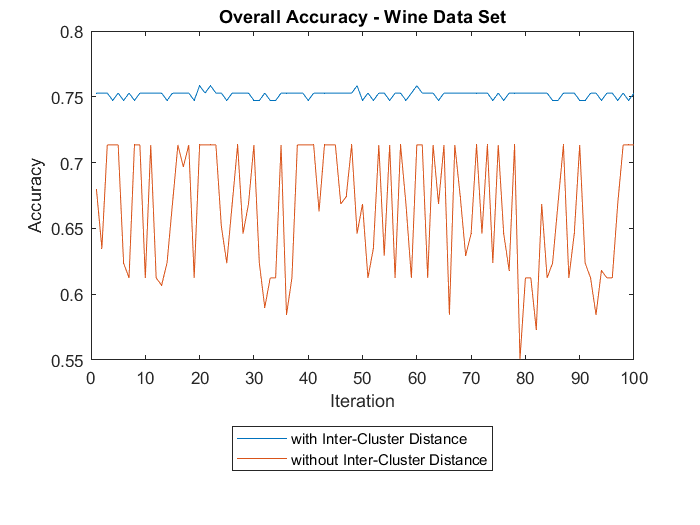
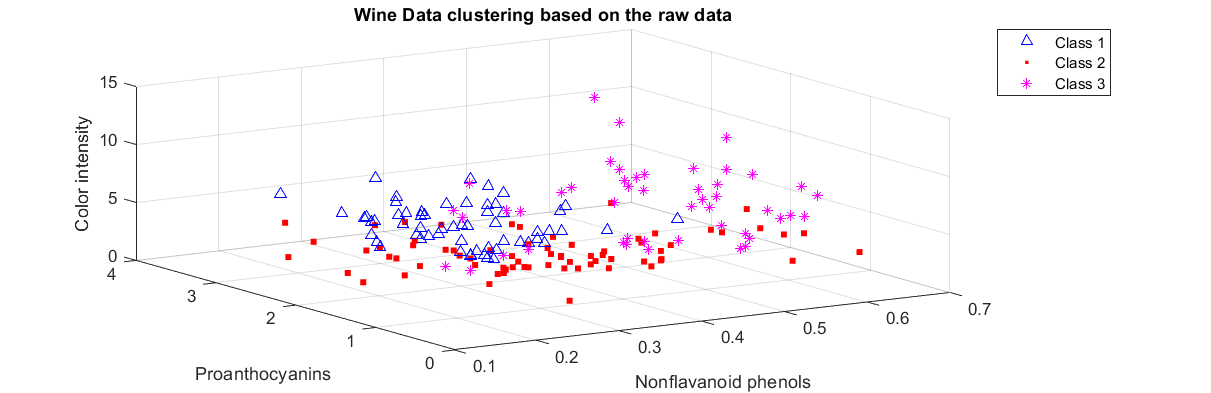
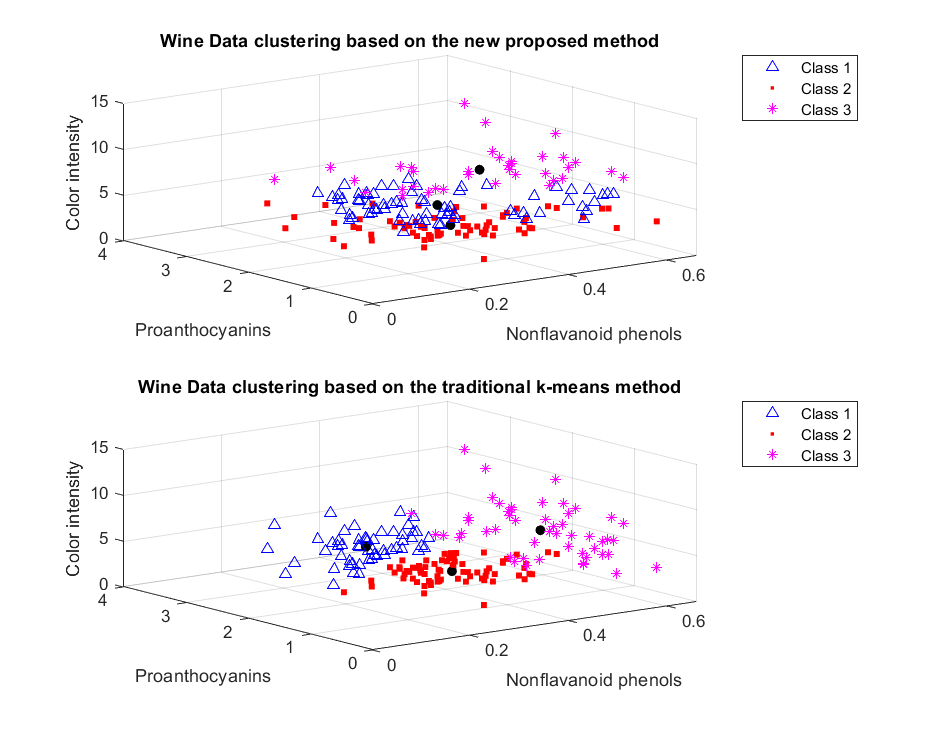
5.2.2
Wine Data set . . . . . . . . . . . . . . . . . . . . . . . . . . .
24
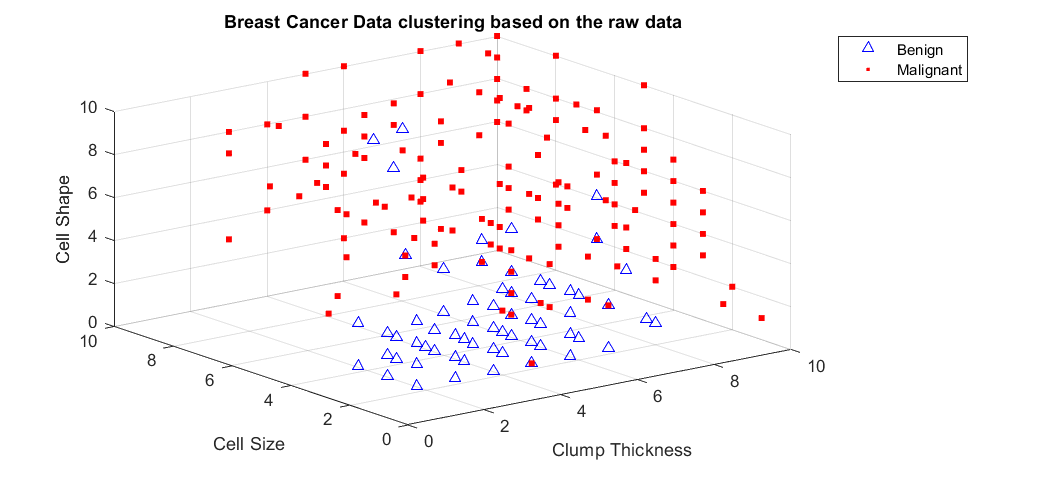
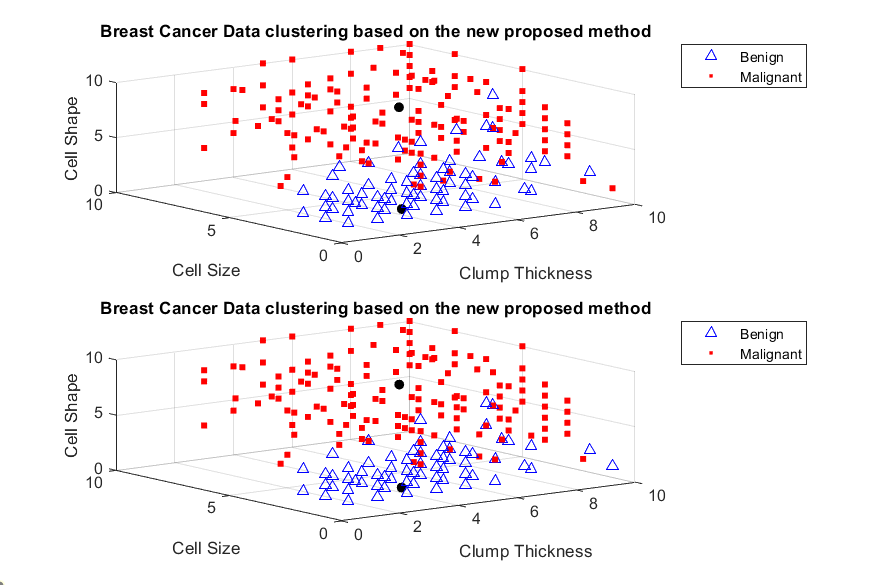
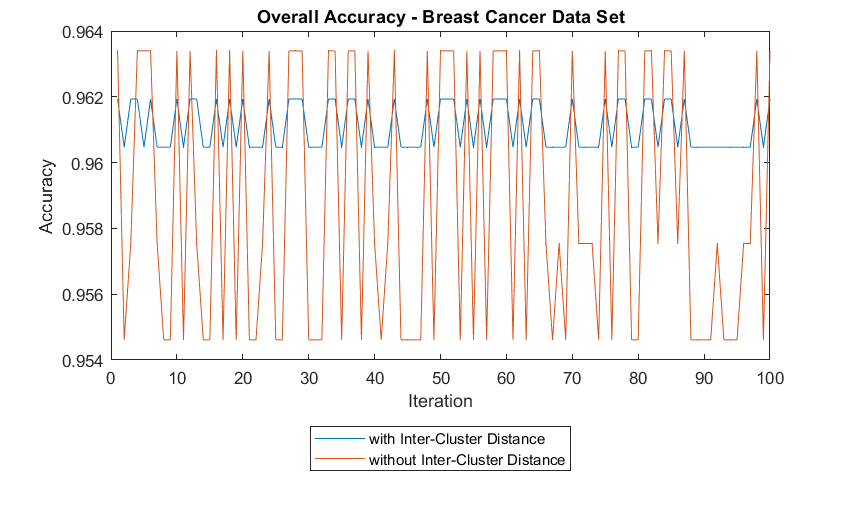
5.2.3
Breast Cancer Data set . . . . . . . . . . . . . . . . . . . . . .
27
6
Conclusion
30
7
Future Work
31
2
Chapter 1
Introduction
Machine learning can be broadly classified into three categories of algorithmic
techniques depending on the type of problem being faced. These techniques also
vary heavily, based on the learning algorithms themselves. They are: Supervised
Learning, Reinforcement Learning and Unsupervised Learning.
Supervised learning makes use of predetermined classes of the responses to train
the underlying algorithm and make predictions based on the same. The features
or the independent variables, X are mapped to the responses or the dependent
variables, Y . The algorithm learns from this mapping to make predictions on unseen
data. Hence the name, machine learning [1]. It is the human equivalent of learning
from our past experiences in order to gather knowledge that is imperative to improve
our ability to perform future tasks in the real world. Supervised learning algorithms
can either be categorized as regression or classification. Dependent variables with
continuous data fall into the regression category whereas dependent variables with
discrete data labels fall into the classification category [2].
Reinforcement learning is another entity altogether wherein the algorithm in-
teracts with the environment based on some actions, A = a1, a2, ...aN and tries to
produce an optimal policy or decision, by trial and error, based on rewards (or pun-
ishments), R = r1, r2, ...rN. The goal with this algorithm is to produce a decision
based on a path that maximizes the rewards or minimize the punishments by the
time the stopping criteria is met [3], [4].
Contrary to the supervised learning algorithms where the output data is la-
belled, unsupervised algorithms almost seem black boxed because there is no co-
herent knowledge about the data prior to processing it [5]. The features or the
independent variables, X = x1, x2, ....xN, where X is an N-dimensiona