Possible explanations of the Maunder minimum from a flux transport dynamo model
📝 Original Info
- Title: Possible explanations of the Maunder minimum from a flux transport dynamo model
- ArXiv ID: 1101.4342
- Date: 2015-06-05
- Authors: Bidya Binay Karak, Arnab Rai Choudhuri
📝 Abstract
We propose that at the beginning of the Maunder minimum the poloidal field or amplitude of meridional circulation or both fell abruptly to low values. With this proposition, a flux transport dynamo model is able to reproduce various important aspects of the historical records of the Maunder minimum remarkably well.💡 Deep Analysis
📄 Full Content
arXiv:1101.4342v1 [astro-ph.SR] 23 Jan 2011
Title of your IAU Symposium
Proceedings IAU Symposium No. xxx, 2010
A.C. Editor, B.D. Editor & C.E. Editor, eds.
c⃝2010 International Astronomical Union
DOI: 00.0000/X000000000000000X
Possible explanations of the Maunder
minimum from a flux transport dynamo
model
Bidya Binay Karak and Arnab Rai Choudhuri
Department of Physics, Indian Institute of Science, Bangalore-560012
email: bidya karak@physics.iisc.ernet.in,
arnab@physics.iisc.ernet.in
Abstract. We propose that at the beginning of the Maunder minimum the poloidal field or
amplitude of meridional circulation or both fell abruptly to low values. With this proposition,
a flux transport dynamo model is able to reproduce various important aspects of the historical
records of the Maunder minimum remarkably well.
Keywords. Sun: activity – Sun: magnetic field, meridional circulation
1. Introduction
One important aspect of the solar cycle is the Maunder minimum during 1645–1715
when the solar activity was strongly reduced (Ribes & Nesme-Ribes 1993). It was not
an artifact of few observations, but a real phenomenon (Hoyt & Schatten 1996). From
the study of historical data (Ribes & Nesme-Ribes 1993), it has been confirmed that
the sunspot numbers in both the hemisphere fell abruptly to nearly zero value at the
beginning of the Maunder minimum, whereas a few sunspots appeared in the southern
hemisphere during the last phase. It is also established from the cosmogenic isotopes
data (Beer et al. 1998; Miyahara et al. 2004) that the cyclic oscillations of solar activity
continued in the heliosphere at a weaker level during the Maunder minimum, but with a
period of 13–15 years instead of the regular 11-year period.
The most promising model of studying solar cycle at present is the flux transport
dynamo model (Choudhuri et al. 1995; Durney 1995; Dikpati & Charbonneau 1999;
Chatterjee et al. 2004). The main sources of irregularities in this model are the stochastic
fluctuations in the Babcock–Leighton process of poloidal field generation (Choudhuri
1992; Choudhuri et al. 2007) and the stochastic fluctuations of meridional circulation
(hereafter MC) (Hathaway 1996). Therefore we propose that the polar field or amplitude
of MC or both decreased at the beginning of Maunder minimum. With this proposition,
we use a flux transport dynamo model to reproduce a Maunder minimum. The details
of this work can be found in Choudhuri & Karak (2009) and Karak (2010).
2. Methodology
We cary out all the analyses with the flux transport dynamo model described in Chat-
terjee et al. (2004). To reproduce the Maunder minimum, we perform the following three
separate sets of experiments. Similar to Choudhuri et al. (2007), first, we decrease the
polar field above 0.8R⊙by a factor γ after stopping the code at a solar minimum. We
change the polar field by different amount in two hemispheres. In northern hemisphere,
we take γ = 0.0, whereas in southern hemisphere, it is 0.4. In addition, in this calculation,
119
120
Karak & Choudhuri
1640
1650
1660
1670
1680
1690
1700
1710
1720
1730
1740
1750
−60
−40
−20
0
20
40
60
Year
Latitude
(a)
1640
1650
1660
1670
1680
1690
1700
1710
1720
1730
1740
1750
0
2
4
6
8
10
Year
Sunspot number
(b)
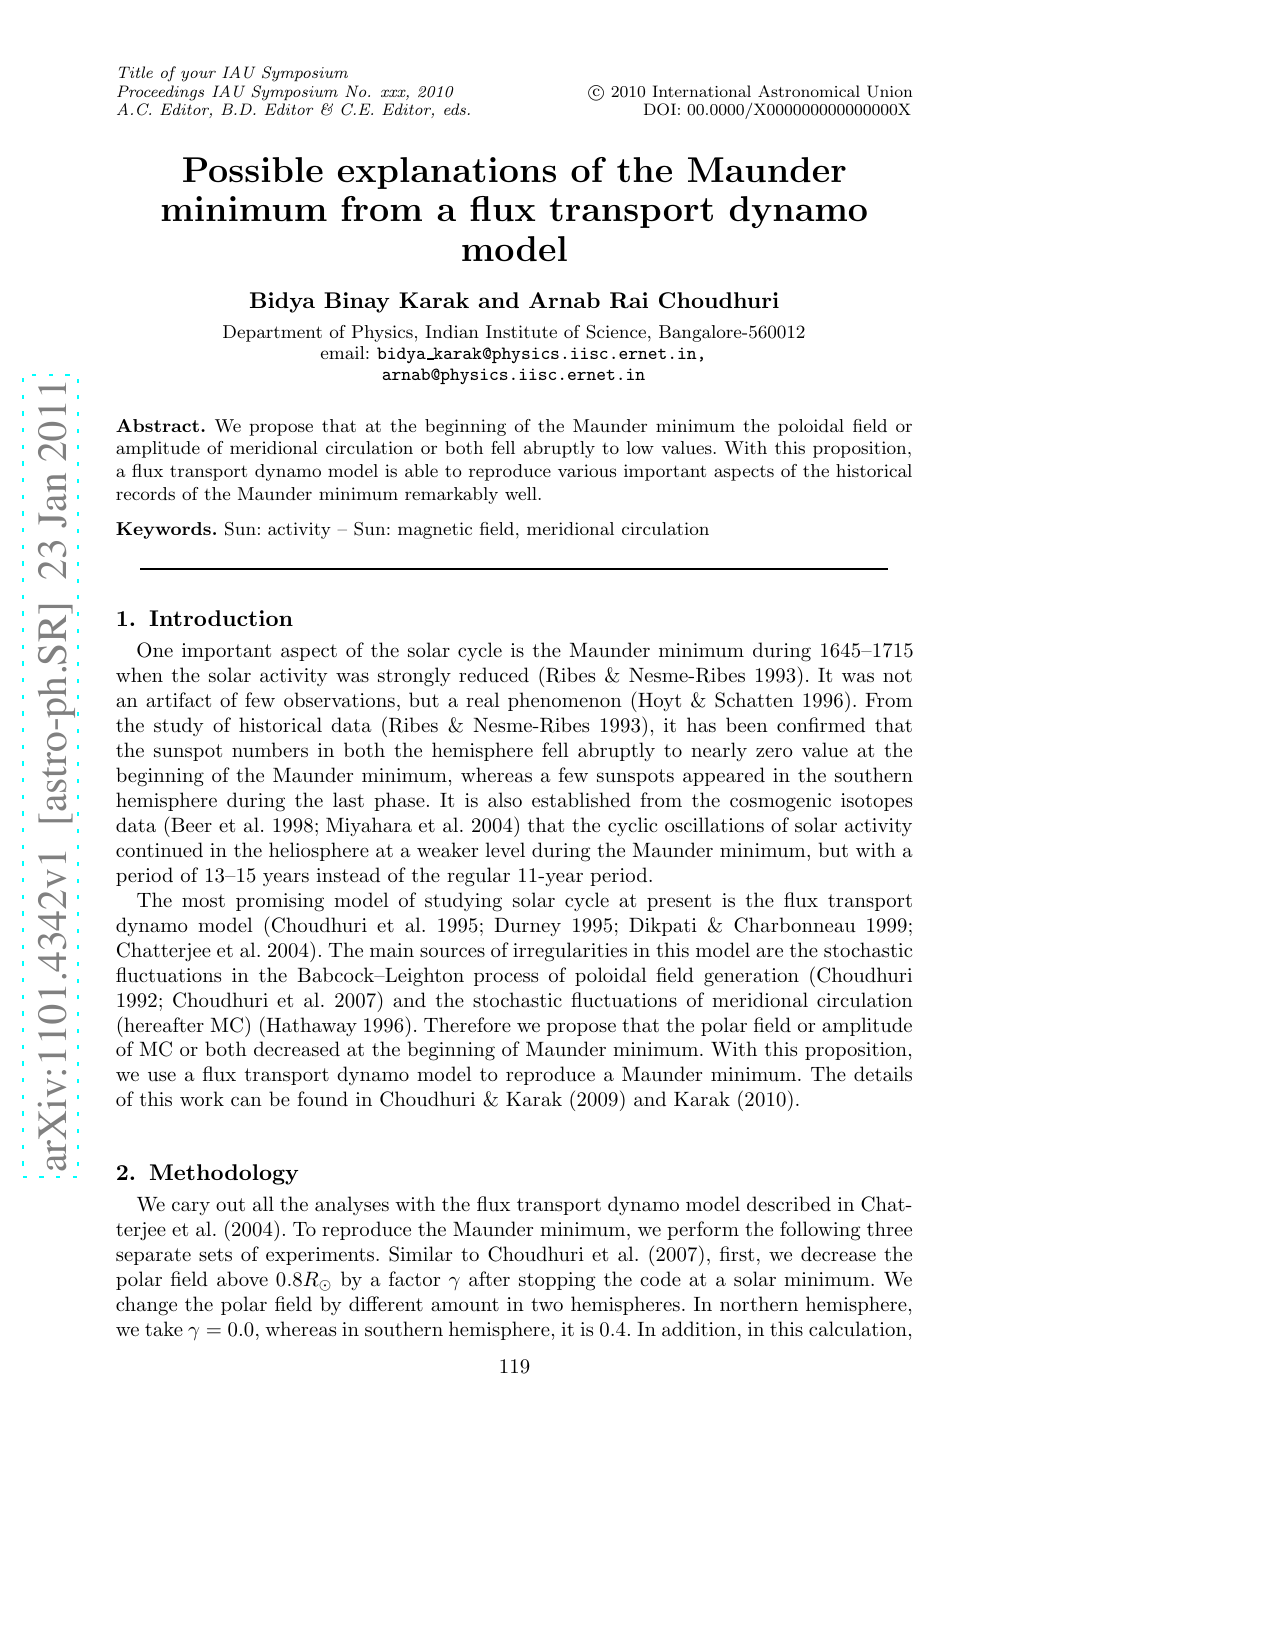
Figure 1. Results covering the Maunder minimum episode. (a) The butterfly diagram. (b) The
smoothed sunspot number. The dashed and dotted lines show the sunspot numbers in southern
and northern hemispheres, whereas the solid line is the total sunspot number. From Choudhuri
& Karak (2009).
we decrease the toroidal field by multiplying it everywhere by 0.8 to stop the eruption for
some time. This essentially reduces the strong overlap between two cycles in our model
(see figure 13 of Chatterjee et al. 2004). After making these changes, we run the model
for several cycles without any further change. In the second procedure for reproducing
the Maunder minimum, we decrease the amplitude of MC v0 abruptly to a very low
value. After keeping it at low value for few years, we again increase it to the usual value
but at different rates in two hemispheres. In the northern hemisphere, it is increased at
slightly lower rate than the southern hemisphere. Note that in this case we have varied
only v0 and no other parameters of the model. We have repeated this calculation in the
low diffusivity model of Dikpati & Charbonneau (1999) too. Last, we have included the
effect of the fluctuations of polar field along with the fluctuations of MC. We have run
the model for different values of γs from 0 to 1 at each values of v0 from a very low value
to the average value. Then we find out the critical values of v0 and the corresponding γ
factor for which we get a Maunder-like minimum.
3. Results
First, we discuss the results from the polar field reduction procedure. It is shown in
Fig. 1 (see the caption also). In order to facilitate the comparison with the observation
data, we have marked the beginning of Fig. 1 to be the year 1640. From this figure we
see that the sudden initiati
📸 Image Gallery
Reference
This content is AI-processed based on open access ArXiv data.