5,000,000 Delays -- Some Statistics
📝 Original Info
- Title: 5,000,000 Delays – Some Statistics
- ArXiv ID: 1102.0665
- Date: 2011-02-04
- Authors: Zinovy Malkin
📝 Abstract
5,000,000 VLBI delays are stored now in the IVS data base and available for scientific analysis. This is a remarkable result of more than 20 years of geodetic VLBI history. This paper presents some statistics related to the VLBI observations during almost 25 years of geodetic VLBI.💡 Deep Analysis
📄 Full Content
arXiv:1102.0665v1 [physics.geo-ph] 3 Feb 2011
5,000,000 Delays—Some Statistics∗
Zinovy Malkin†
Institute of Applied Astronomy, St. Petersburg, Russia
Abstract
5,000,000 VLBI delays are stored now in the IVS data base and available for sci-
entific analysis. This is a remarkable result of more than 20 years of geodetic VLBI
history. This paper presents some statistics related to the VLBI observations during
almost 25 years of geodetic VLBI.
At the end of 2004, the number of VLBI delays obtained in the framework of the geodetic
and astrometric VLBI programs reached 5,000,000! This is one of the major milestones in the
VLBI history resulting from almost 25 years of heroic efforts by astronomers and physicists,
engineers and programmers, network stations and correlator teams.
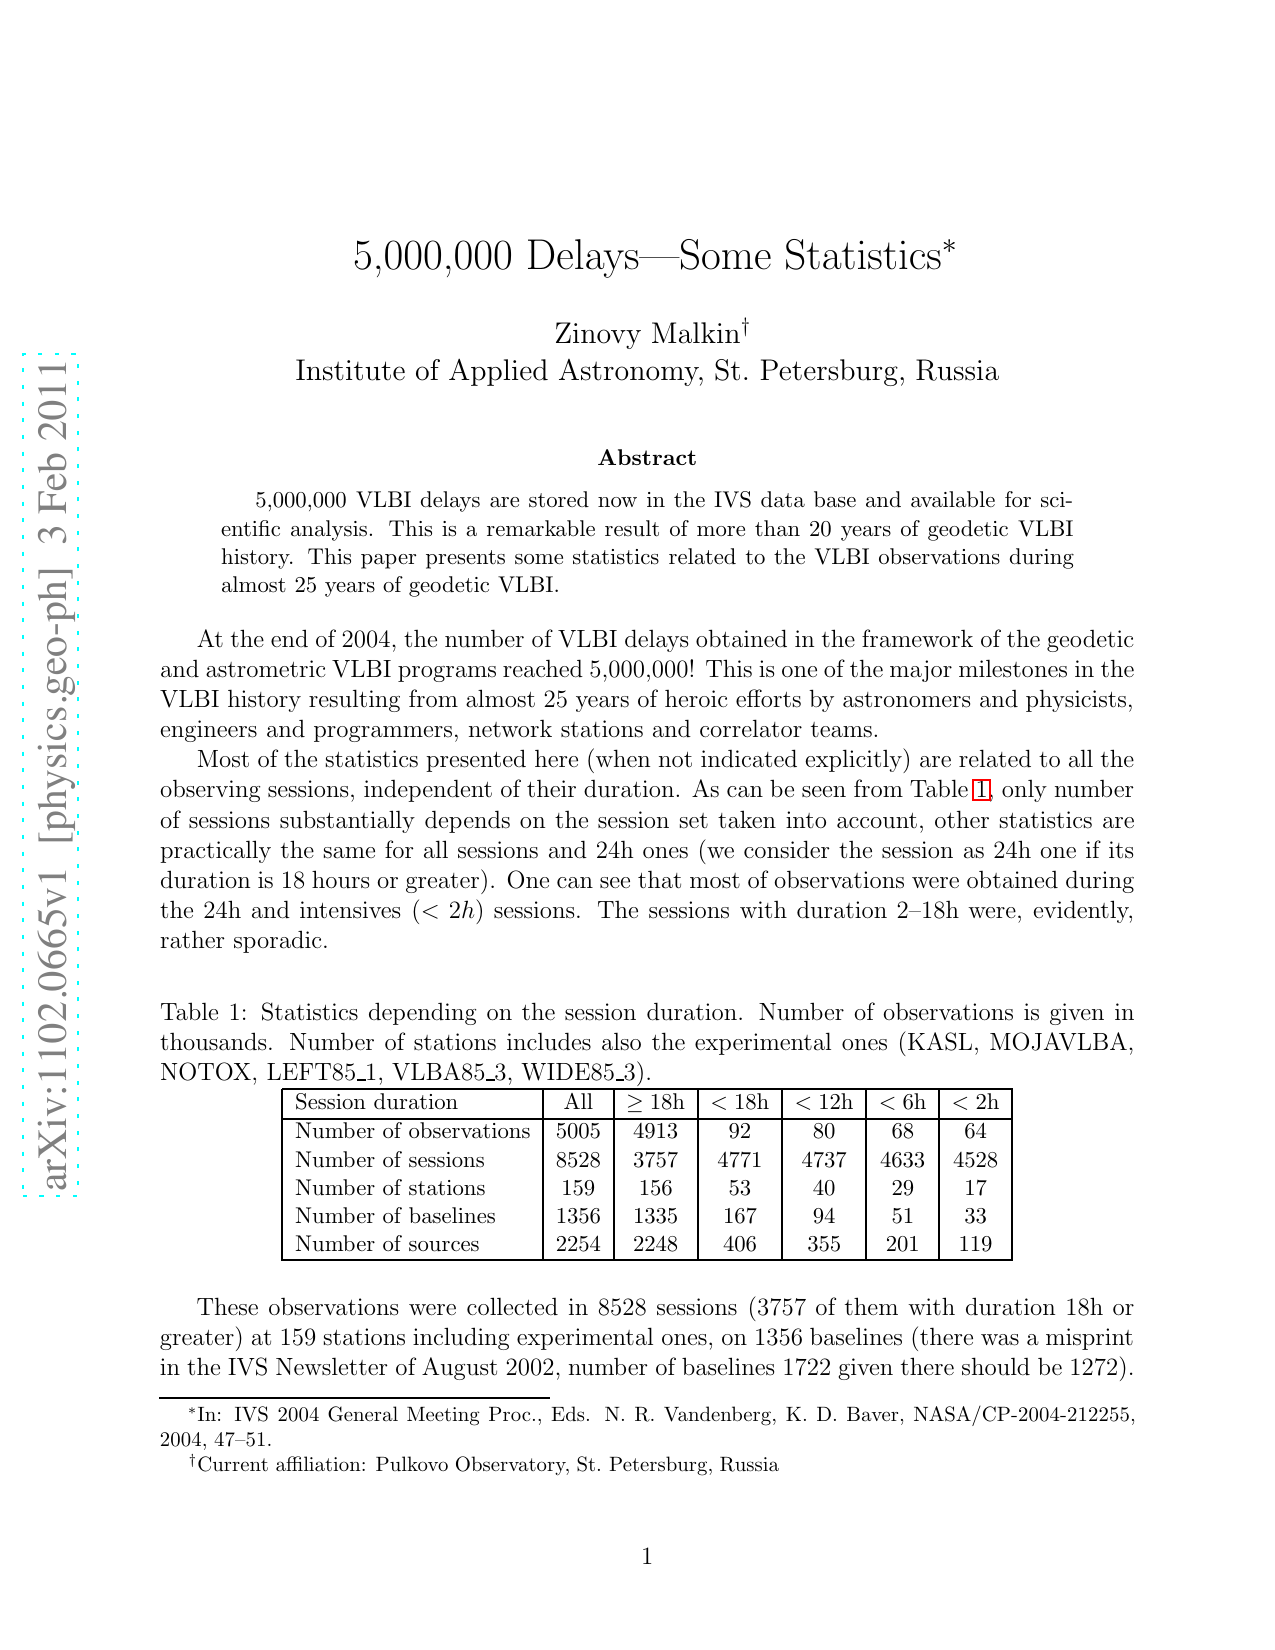
Most of the statistics presented here (when not indicated explicitly) are related to all the
observing sessions, independent of their duration. As can be seen from Table 1, only number
of sessions substantially depends on the session set taken into account, other statistics are
practically the same for all sessions and 24h ones (we consider the session as 24h one if its
duration is 18 hours or greater). One can see that most of observations were obtained during
the 24h and intensives (< 2h) sessions. The sessions with duration 2–18h were, evidently,
rather sporadic.
Table 1: Statistics depending on the session duration. Number of observations is given in
thousands. Number of stations includes also the experimental ones (KASL, MOJAVLBA,
NOTOX, LEFT85 1, VLBA85 3, WIDE85 3).
Session duration
All
≥18h
< 18h
< 12h
< 6h
< 2h
Number of observations
5005
4913
92
80
68
64
Number of sessions
8528
3757
4771
4737
4633
4528
Number of stations
159
156
53
40
29
17
Number of baselines
1356
1335
167
94
51
33
Number of sources
2254
2248
406
355
201
119
These observations were collected in 8528 sessions (3757 of them with duration 18h or
greater) at 159 stations including experimental ones, on 1356 baselines (there was a misprint
in the IVS Newsletter of August 2002, number of baselines 1722 given there should be 1272).
∗In: IVS 2004 General Meeting Proc., Eds. N. R. Vandenberg, K. D. Baver, NASA/CP-2004-212255,
2004, 47–51.
†Current affiliation: Pulkovo Observatory, St. Petersburg, Russia
1
Totally, 2254 sources were observed, more the half of them during the VLBA Calibrator
Survey program.
Figure 1 shows how the overall result was reached. It is interesting to see how much time
was needed to get each million observations (Table 2). Apparently, a limit of the capacity
of existing IVS network is reached in the late 1990s.
Table 2: Time taken to collect each million observations (∆T), the corresponding period of
observations (Tbeg −Tend), and number of sessions. Some inconsistencies between ∆T and
Tbeg−Tend are due to rounding.
Million
1st
2nd
3rd
4th
5th
∆T, years
11.9
3.9
3.3
2.6
2.6
Tbeg−Tend
1979.6–1991.5
1991.5–1995.5
1995.5–1998.7
1998.7–2001.4
2001.4–2004.0
# of sessions
3425
1873
1234
1002
976
# of 24h sessions
1628
901
444
348
432
Here are some extreme statistics with examples:
Maximum number of stations:
20
(991220XA)
Maximum number of baselines:
188
(991220XA)
Maximum number of sources:
263
(950715XV)
Maximum number of observations:
34221
(991220XA)
Maximum number of good observations:
30372
(991220XA)
Maximum number of bad observations:
4092
(940812XV)
Maximum percentage of good observations:
100.0
(860223X )
Maximum percentage of bad observations:
90.8
(911205MV)
The longest sessions, h:
99.2
(830520D )
Table 3 shows most active stations during the whole period of observations, and Ta-
bles 4–5 present statistics for sources and baselines.
The longest attempted baselines is
SESHAN25–TIGOCONC (12660 km), but no successful observations (zero quality code
in NGS files) was obtained. The longest baseline with successful observations is DSS65–
HOBART26 (12520 km). The shortest baselines was KAUAI–KOKEE (39 m)
Figures 2 and 3 show the evolution of some observational data and EOP uncertainty
(IAA EOP series) with time.
2
0
1
2
3
4
5
6
1980
1985
1990
1995
2000
2005
Number of observations, millions
0
0.1
0.2
0.3
0.4
0.5
1980
1985
1990
1995
2000
2005
Number of observations per year, millions
0
2000
4000
6000
8000
10000
1980
1985
1990
1995
2000
2005
Number of sessions
0
200
400
600
1980
1985
1990
1995
2000
2005
Number of sessions per year
0
1000
2000
3000
4000
1980
1985
1990
1995
2000
2005
Number of 24h sessions
0
100
200
300
1980
1985
1990
1995
2000
2005
Number of 24h sessions per year
0
1000
2000
3000
4000
1980
1985
1990
1995
2000
2005
Cumulative session durartion, days
0
100
200
300
1980
1985
1990
1995
2000
2005
Cumulative session durartion per year, days
0
50
100
150
200
1980
1985
1990
1995
2000
2005
Number of stations
0
20
40
60
1980
1985
1990
1995
2000
2005
Number of stations per year
0
500
1000
1500
2000
2500
1980
1985
1990
1995
2000
📸 Image Gallery
Reference
This content is AI-processed based on open access ArXiv data.