Galactic diffuse gamma-ray flux at the energy about 175 TeV
📝 Original Info
- Title: Galactic diffuse gamma-ray flux at the energy about 175 TeV
- ArXiv ID: 0905.3593
- Date: 2009-05-31
- Authors: Researchers mentioned in the ArXiv original paper
📝 Abstract
We present an upper limit of galactic diffuse gamma-ray flux, measured with the GAMMA experiment at energy about 175 TeV. The results were obtained using selection of muon poor extensive air showers at mountain level (700 g/cm^2, Mt. Aragats, Armenia) for 5 GeV muon energy threshold. An upper limit for the differential flux at energy E=175+/-25 TeV is equal to (5.8-7.0)x10^-12 [erg m^2 s sr]^-1 for 95% confidence level.💡 Deep Analysis
This research explores the key findings and methodology presented in the paper: Galactic diffuse gamma-ray flux at the energy about 175 TeV.We present an upper limit of galactic diffuse gamma-ray flux, measured with the GAMMA experiment at energy about 175 TeV. The results were obtained using selection of muon poor extensive air showers at mountain level (700 g/cm^2, Mt. Aragats, Armenia) for 5 GeV muon energy threshold. An upper limit for the differential flux at energy E=175+/-25 TeV is equal to (5.8-7.0)x10^-12 [erg m^2 s sr]^-1 for 95% confidence level.
📄 Full Content
In the very-high (TeV) energy region γ-ray flux was measured by ground-based systems and single Cherenkov telescopes (Whipple [2], CANGAROO [3], MAGIC [4], H.E.S.S. [5], MILAGRO [6]). The measurements in the ultra-high energy region (E > 100 TeV) are still poor and made only by extensive air showers (EAS) arrays at Chacaltaya [7], MSU [8], Tien-Shan [9], CASA-MIA [11], EAS-TOP [12], KASCADE [13] and Grapes-III [10].
This paper is devoted to measurements of the diffuse gamma-rays with GAMMA EAS array [14], [15] at Aragats mountain observatory, where correlation of observable shower parameters with primary energy is about 0.98. The primary nuclei (predominantly H) and γ-showers were discriminated using no-muon signal from underground muon scintillation carpet.
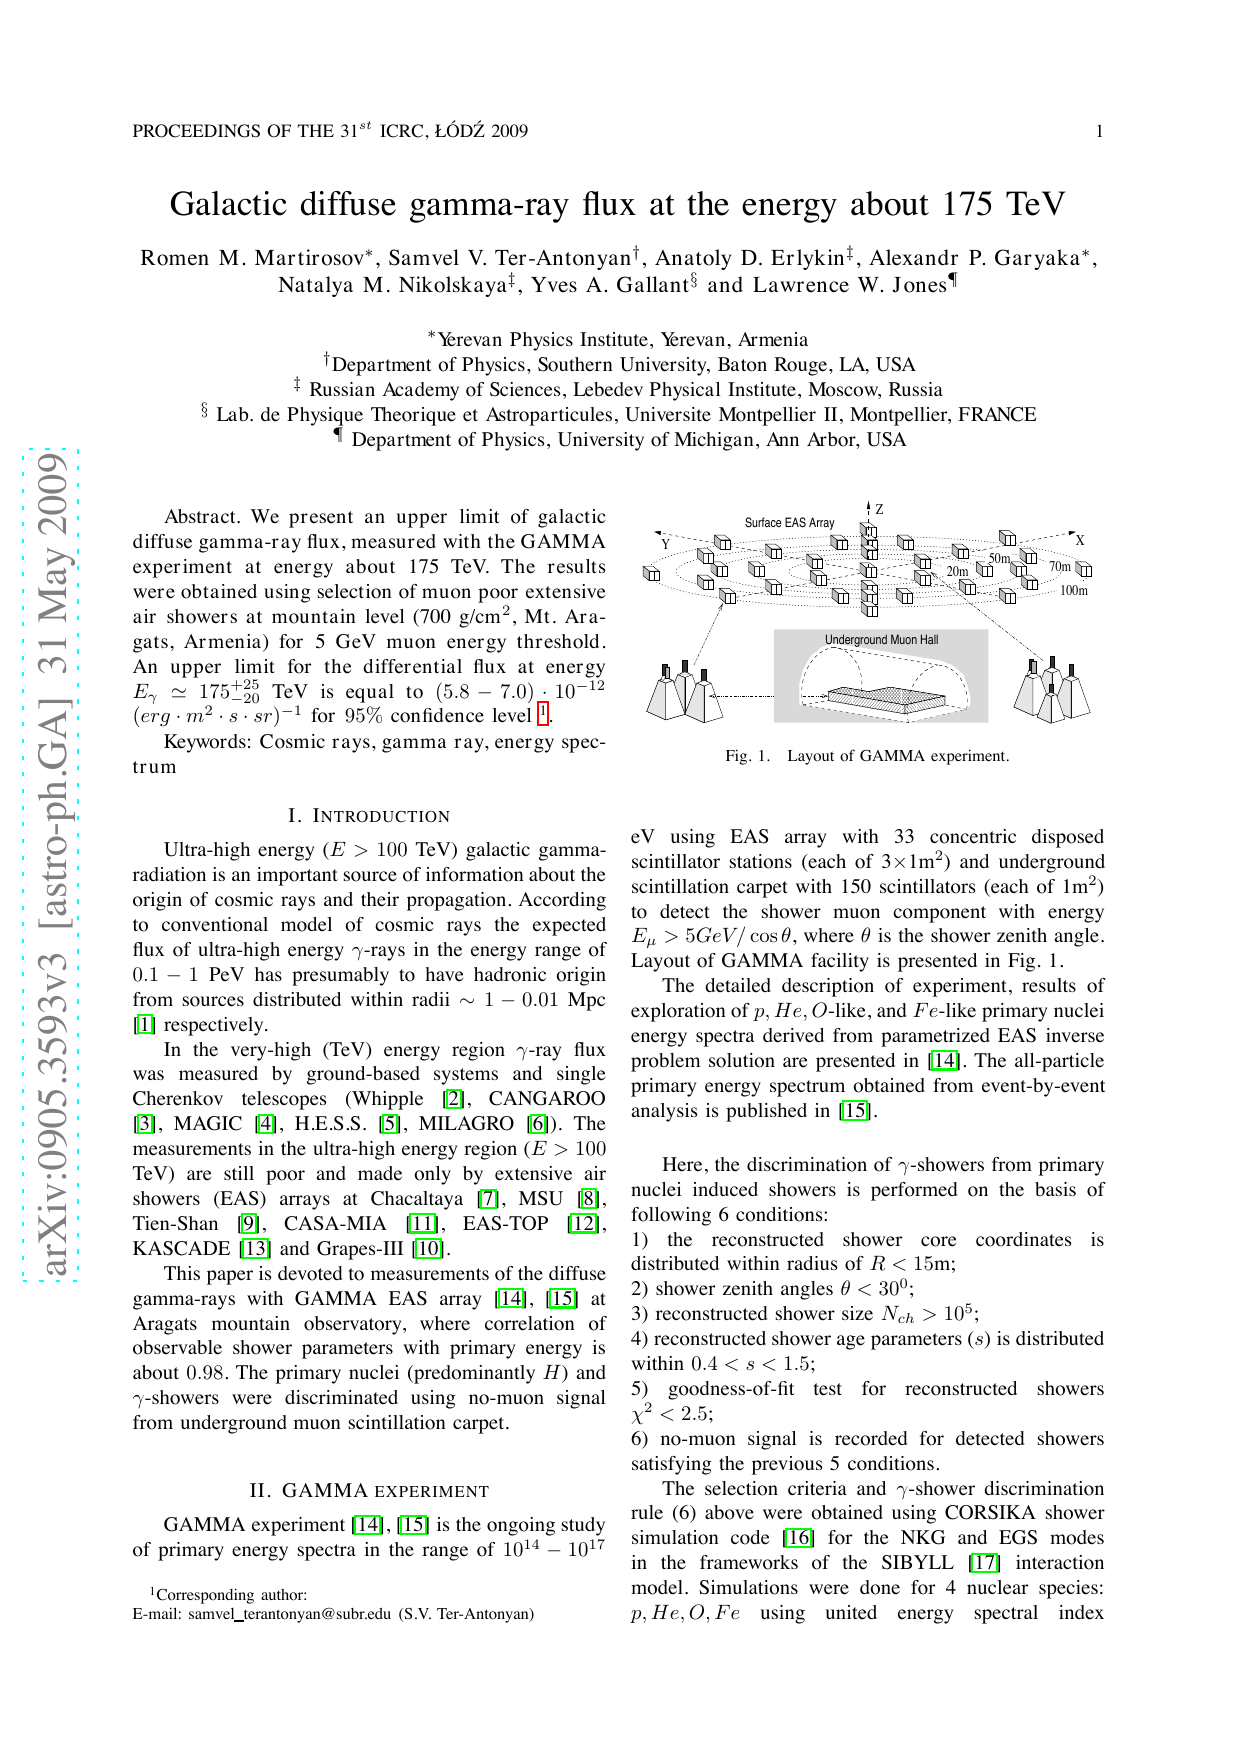
GAMMA experiment [14], [15] is the ongoing study of primary energy spectra in the range of 10 eV using EAS array with 33 concentric disposed scintillator stations (each of 3×1m 2 ) and underground scintillation carpet with 150 scintillators (each of 1m 2 ) to detect the shower muon component with energy E µ > 5GeV / cos θ, where θ is the shower zenith angle. Layout of GAMMA facility is presented in Fig. 1.
The detailed description of experiment, results of exploration of p, He, O-like, and F e-like primary nuclei energy spectra derived from parametrized EAS inverse problem solution are presented in [14]. The all-particle primary energy spectrum obtained from event-by-event analysis is published in [15].
Here, the discrimination of γ-showers from primary nuclei induced showers is performed on the basis of following 6 conditions: 1) the reconstructed shower core coordinates is distributed within radius of R < 15m; 2) shower zenith angles θ < 30 0 ; 3) reconstructed shower size N ch > 10 5 ; 4) reconstructed shower age parameters (s) is distributed within 0.4 < s < 1.5; 5) goodness-of-fit test for reconstructed showers χ 2 < 2.5; 6) no-muon signal is recorded for detected showers satisfying the previous 5 conditions.
The selection criteria and γ-shower discrimination rule (6) above were obtained using CORSIKA shower simulation code [16] for the NKG and EGS modes in the frameworks of the SIBYLL [17] interaction model. Simulations were done for 4 nuclear species: p, He, O, F e using united energy spectral index
, where α A and N 0,A parameters depend on primary particle (A). γ = -2.7 [14]. Simulated samples were equal 7.5 × 10 5 , 10 5 , 7 × 10 4 and 5 × 10 4 for p, He, O, F e nuclei and NKG mode of CORSIKA. The samples for the EGS mode of CORSIKA were equal to 2.5 × 10 4 for primary γ-quanta, 7.5 × 10 4 for primary protons and 3 × 5000 for He, 0 and F e primary nuclei. The simulation strategy and reconstruction method for shower size (N ch ), age parameter (s), core coordinates (x 0 , y 0 ) and shower zenith angle (θ) were the same as in [14].
The shower trigger efficiency and shower size reconstruction errors (∆ N ch and σ N ch ) are presented in Figs. 2,3 respectively. The observed differences of reconstructed shower size biases ∆ N ch for different primary particles (Fig. 3, lower panel) stems from differences of corresponding lateral distribution functions of shower particles.
The distribution of detected shower age parameters (GAMMA data) in comparison with expected distributions for primary p, He, O, F e nuclei are presented in Fig. 4 (left panel). The primary elemental composition and energy spectra were taken from solution of parametrized EAS inverse problem [14] in the frameworks of the SIBYLL interaction model (Fig. 5, shaded area [14]) and were extrapolated up to the 100 TeV energy region. The reliability of this extrapolations stems from data [18].
The right panel of Fig. 4 shows distribution of shower age parameters for selected no-muon signal events (shades GAMMA data area) in comparison with corresponding expected distributions from the simulated γ-showers and background proton showers. It is well seen, that the EAS age parameter is also a data carrier about primary particle (γ-showers are younger). However, we did not include yet the age parameter in the γ-showers selection criteria. Results in Fig. 4 we use only as indication of an agreement between simulated and corresponding detected distributions.
The detected muon number spectra in the normalization of probability density function for different shower size thresholds (N ch > 10 5 , 2 × 10 5 and 4 × 10 5 ) are presented in Fig. 6 (hollow symbols) in comparison with the corresponding expected spectra from different primary particles (γ, p, He, O, F e) and ) Fig. 5. Primary energy spectra and all-particle energy spectrum taken from [14] (shaded area) and corresponding extrapolations to the 100 TeV energy region. different simulation modes (NKG, EGS) of CORSIKA. Energy spectra and elemental composition of primary nuclei (Fig. 5) used in the Figs. 4,6 were taken from [14] and applied for the energy region E > 100 TeV.
The energy of primary particle is estimated using event-by-event method [15] according to the empirical expression: ln
, where E is in GeV, parameters A 1 , A 2 and A 3 are determined using goodness-of-fit test for simulated database and depend on primary particle A. distributions at observation level for 5000 primary protons (bold dot symbols) and 5000 γ (gray dot symbols). Hollow circles correspond to the proton showers with no-muon signal from underground muon carpet (Nµ = 0). Solid and dashed lines are the log-linear approximations (see text) for primary γ and p correspondingly. Inset histograms are Ep,γ /N ch distributions for primary proton and γ (shaded area).
The corresponding accuracies providing for χ 2 ≃ 1 is described by the log-linear functions σ(E A ) = ε A -δ A ln (E A /10 5 ), where ε ≡ 0.22, 0.30, 0.33 and δ ≡ 0.01, 0.02, 0.05 for primary γ, p and proton induced no-muon detected shower (p 0 ) respectively.
The primary energy reconstruction efficiencies are presented in Fig. 7 for different primary particles. The lines represent the log-linear empiric expression above for primary proton showers (dashed line) and γ-showers (solid line) respectively. It is seen, that the proton produced no-muon signal events (hollow circles) practically similar to γ-showers. The inset histogram shows the distribution of E p,γ /N ch ratio for p and γ primary particles respectively. III. GAMMA RAY FLUX 98000 shower events were selected for operation time T = 3970 h of GAMMA experiment. Number of detected shower events versus number of detected muons (N µ ) for different shower size thresholds N ch > 10 5 , 2 × 10 5 and 4 × 10 5 are presented in Fig. 8 (histograms with shaded area). The symbols in Fig. 8 are the corresponding expected number of events simulated using the CORSIKA code for primary energy spectra [14] presented in Fig. 5. The simulations were carried out for two modes of CORSIKA to get high accuracy of simulation (EGS mode) and large simulated sample (NKG mode).
The agreement of simulated and detected muon spectra in all measurement region and lack of statistically significant excess of no-muon signal events (Fig. 8) allowed us to estimate only an upper limit of γ-ray flux according to the expression
where M 0 is the number of no-muon detected showers, W γ,Nµ=0 is the probability to detect no-muon signal for γ-showers (see Fig. 6), W trg (E γ ) is the trigger efficiency (see Fig. 2), cos θ = 0.94 is the average shower zenith angle, S and Ω are the EAS core detection area and corresponding solid angle. The obtained upper limit of differential γ-ray flux in the energy range 100-300 PeV are presented in Fig. 9 (black downward triangle symbol) in comparison with CASA-MIA [11], KASCADE [13] and EAS-TOP [12] data.
An upper limit of γ-ray differential flux at energy E γ ≃ 175 +25 -20 TeV obtained with GAMMA experiment is equal to (5.8 -7.0) • 10 -12 (erg • m 2 • s • sr) -1 for 95% confidence level and it is in close agreement with the CASA-MIA data [11].
The lower limit for the primary energy spectra and elemental composition obtained with the GAMMA experiment [14] can be extended to the lower energy region up to about 100 TeV energies.
We are going to increase the underground muon carpet area up to 250 m 2 to improve γ/proton showers discrimination efficiency. ) Fig. 9. Upper limit of gamma ray flux derived from detected nomuon showers (black downward triangle symbol). The gray symbols are the CASA-MIA [11], KASCADE [13] and EAS-TOP [12] data taken from [13]. The lines are expected Galactic diffuse background flux from [19].
📸 Image Gallery