KGroups: A Versatile Univariate Max-Relevance Min-Redundancy Feature Selection Algorithm for High-dimensional Biological Data
This paper proposes a new univariate filter feature selection (FFS) algorithm called KGroups. The majority of work in the literature focuses on investigating the relevance or redundancy estimations of feature selection (FS) methods. This has shown pr…
Authors: Malick Ebiele, Malika Bendechache, Rob Brennan
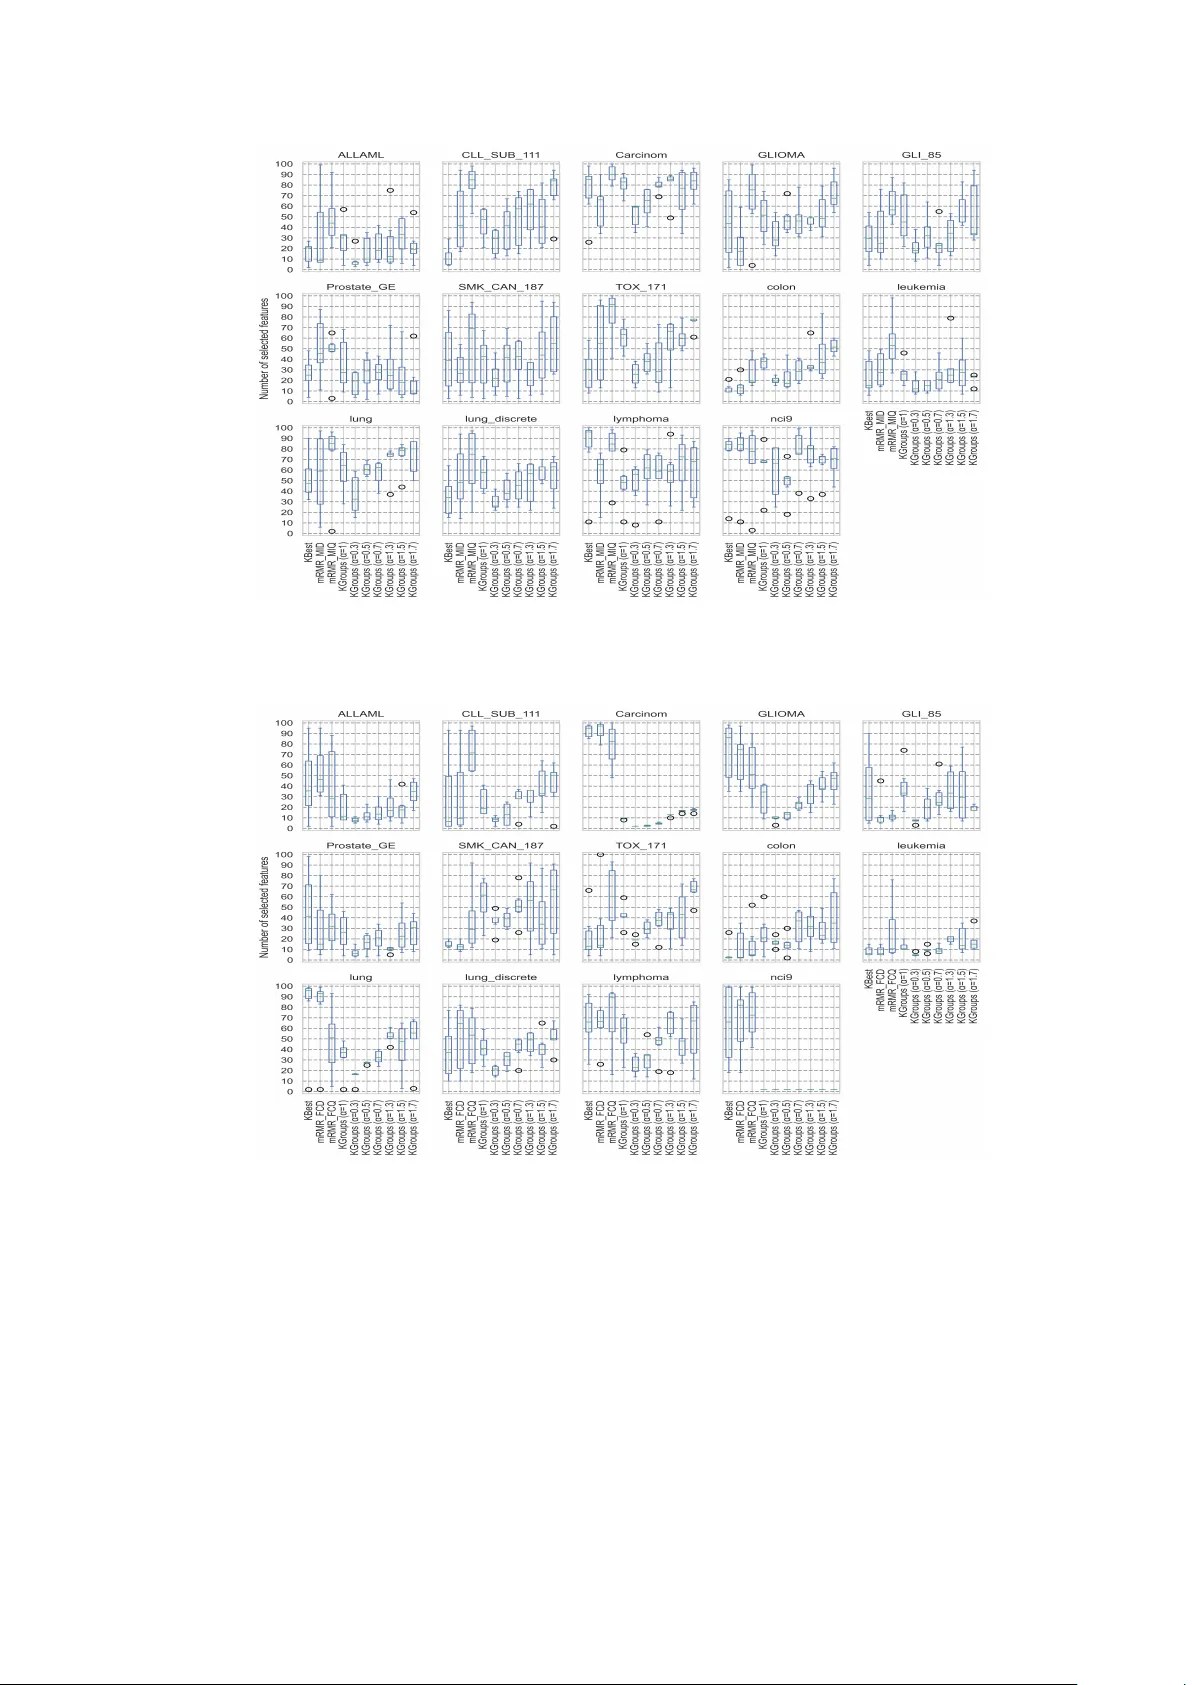
Under-review K Groups: A V ersatile Univ ariate Max-Relev ance Min-Redundancy F eature Selection Algorithm for High-dimensional Biological Data Malic k Ebiele 1,3* , Malik a Bendechac he 2,3 and Rob Brennan 1,3 1* Computer Science, Univ ersity College Dublin, Dublin, Dublin, Ireland. 2 Computer Science, Univ ersit y of Galwa y , Galw ay , Galwa y , Ireland. 3 AD APT Centre, Dublin, Dublin, Ireland. *Corresp onding author(s). E-mail(s): malick.ebiele@adaptcen tre.ie ; Con tributing authors: malik a.bendechac he@univ ersity ofgalw ay .ie ; rob.brennan@ucd.ie ; Abstract This pap er prop oses a new univ ariate filter feature selection (FFS) algorithm called K Groups. The ma jorit y of work in the literature focuses on inv estigating the relev ance or redundancy estimations of feature selection (FS) metho ds. This has shown promising results and a real improv ement of FFS metho ds’ predictive p erformance. Ho wev er, limited efforts hav e b een made to inv estigate alternativ e FFS algorithms. This raises the following question: ho w muc h of the FFS meth- o ds’ predictiv e p erformance dep ends on the selection algorithm rather than the relev ance or the redundancy estimations? The ma jority of FFS metho ds fall into t wo categories: relev ance maximisation (Max-Rel, also known as KBest) or simul- taneous relev ance maximisation and redundancy minimisation (mRMR). KBest is a univ ariate FFS algorithm that emplo ys sorting (descending) for selection. mRMR is a multiv ariate FFS algorithm that employs an incremental searc h algo- rithm for selection. In this paper, we propose a new univ ariate mRMR called K Groups that employs clustering for selection. Extensiv e exp eriments on 14 high- dimensional biological benchmark datasets sho w ed that KGroups ac hiev es similar predictiv e p erformance compared to multiv ariate mRMR while b eing up to 821 times faster. K Groups is parameterisable, which lea ves room for further predictive p erformance improv emen t through hyperparameter finetuning, unlike mRMR and KBest. KGroups outp erforms KBest. Keyw ords: F eature Selection, Clustering-based Filter Metho d, Univ ariate Max-Relev ance Min-Redundancy (mRMR), Data Mining, Knowledge Disco very 1 Under-review JEL Classification: C02 , C38 , C45 , C55 MSC Classification: 68T01 , 68T20 1 In tro duction F eature selection (FS) metho ds in machine learning (ML) and statistical analysis ha ve existed since at least the 1990s with an ever increasing interest [ 1 ]. The y define w ays of selecting a subset of features from the original dataset while maintaining a comp etitive predictive p erformance. F eature selection metho ds are imp ortan t in tac kling computational cost (in terms of training time) and resource requirements [ 2 ]. T oday , they are also imp ortant for addressing the energy consumption, efficiency , monetary cost of training, and the sustainabilit y of Artificial Intelligence (AI) mo dels [ 3 – 5 ]. There are three primary type of FS metho ds: filters, wrapp ers, and embedded. W rapp ers are considered the most predictively performant, while filters are considered the most computationally efficient. Filters are also considered the most generalisable to other mo dels (mo dels they were not initially trained for; see T able 1 in section 2 b elo w) [ 1 , 2 , 6 ]. With the rise of in terest in green AI initiatives, filter feature selection (FFS) metho ds are receiving more attention from researchers and practitioners b ecause they align with sustainable AI ob jectiv es [ 7 – 12 ]. This can also b e explained by the fact that FFS metho ds hav e only one drawbac k to address (lag in predictiv e p erformance) compared to t wo drawbac ks for wrapp ers (computational inefficiency and failure to generalise to other mo dels). FFS metho ds hav e b een widely applied to feature selection and dimensionality reduction tasks in heterogeneous domains including but not limited to biology , healthcare, marketing, information retriev al, h uman activit y recognition [ 13 – 18 , 18 – 22 ]. FS metho ds can b e classified in to tw o groups: v alue-based and non-v alue-based. V alue-based FS metho ds first assign a relev ance or a redundancy v alue to eac h feature then p erform the selection using either or b oth of the assigned relev ance and redundancy v alues. Max-Rel, mRMR, and K Groups are all v alue-based FFS. Non-v alue-based FS tec hniques p erform the selection task without assigning an y v alues to the features; they are in ma jority wrapp ers (see T able 1 in the background section). This pap er focuses on v alue-based FFS metho ds because they are computationally efficien t, hav e only one dra wback, and can be integrated with explainable AI [ 23 ]. V alue-based FFS estimate features relev ance using a similarit y measure from i) information theory (e.g. mutual information also known as information gain), ii) statistics (e.g. F-v alue also kno wn as F-statistics), or iii) machine learning mo dels’ built-in feature ranking metho ds also kno wn as em b edded FS techniques. Once a relev ance v alue is assigned to eac h of the feature, the features are sorted in descending order of relev ance and the top k are selected (thus the names Max-Rel, SelectKBest or KBest). As to multiv ariate FFS metho ds, a redundancy estimator is needed in addition to the relev ance estimator. They consist of maximising the difference b etw een or the quotient of the relev ance 2 Under-review Rel ( F i ) b y the redundancy Red ( F i ; S ) of the candidate feature F i with respect to the already selected features S using an incremen tal searc h algorithm (see section 3 , particularly Eqs. ( 5 ) and ( 7 )). These methods are referred to as mRMR meaning Min-Redundancy Max-Relev ance. This pap er prop osed a new v ersatile univ ariate algorithm, called KGroups, that sim ultaneously maximises the relev ance and minimises the redundancy using clustering. In other words, K Groups is a univ ariate mRMR. First, a relev ance v alue is assigned to eac h feature. Then, the features are clustered into k groups using binning. Finally , the feature with the maxim um relev ance v alue from eac h cluster is selected (for more details, see section 4 b elow). There are b een previous attempts to use binning-based clustering or discretisation for FS and dimensionality reduction [ 15 , 24 – 27 ]. K Groups extends the Sup ervised Cosine Similarit y Information Gain (SCSIG) prop osed by Dub ey and Saxena [ 15 ] . SCSIG w as originally designed for cosine similarit y-based binning and mutual information-based selection (see section 4 for more details). The pap er addresses the follo wing research question: T o what exten t can a univ ariate Max-Relev ance Min-Redundancy filter feature selection algo- rithm improv e the p erformance of feature selection metho ds in terms of classification accuracy and computational cost? T o answer the research question ab o ve, we performed extensive exp erimen tal analysis of K Groups with comp eting algo- rithms (KBest, and m ultiv ariate mRMR) on 14 high-dimensional biological b enc hmark datasets and rep orted their resp ective av erage 5-fold cross v alidation accuracy score and execution time (see section 6 ). This pap er has the following contributions: (1) Design and implemen tation of K Groups, a versatile univ ariate mRMR algorithm that comp etes with the state of the art multiv ariate mRMR FFS algorithm while b eing up to 821 times faster. (2) Extension of the SCSIG [ 15 ] FFS metho d into a flexible algorithm that supp ort an y t yp e of relev ance estimator. KGroups is parameterisable and introduces the concept of tie-breaking; unlik e SCSIG. (3) Comprehensiv e Analysis of K Groups, highligh ting its strengths, weaknesses, and p oten tials. The remainder of the pap er is as follo ws. The next section defines the cores concepts of FFS metho ds. In section 3 , we present the related w ork. Section 4 and 5 describ es our prop osed metho d and the exp erimen tal setting, resp ectively . The exp erimen tal results and discussion are presented in section 6 . The limitations and p otentials of the K Groups algorithm is presen ted in section 7 . Finally , the concluding remarks and future w ork is highlighted in section 8 . 2 Bac kground In this section, we provide the definitions of the core concepts of the F eature Selection (FS) domain. 2.1 F eature Selection Metho ds There are three primary types of FS metho ds: filters, wrappers, and em b edded [ 1 , 2 , 6 , 28 ]. T able 1 b elow gives a comparativ e analysis of the three primary t yp es of FS in terms of relative predictive p erformance, computational cost, and generalisation 3 Under-review [of the selected features] to other models. It also provides a brief description of eac h metho d and examples. T able 1 : Comparativ e analysis of the primary t yp es of feature selection metho ds (adapted from [ 6 ]) T yp e Predic- tiv e P erfor- mance Compu- tational Cost Genera- lisation to other mo dels Example Metho ds Short Description Filters Lo w Lo w High SelectKBest; SelectP er- cen tile - P erform feature selection at pre- pro cessing without relying on ML mo del - Use statistics, information theory , or geometry to measure relev ance and redundancy - Mo del-agnostic approac h W rapp ers High High Lo w F orward Selection; Bac kward Selection; Recursiv e Selection; Exhaustiv e Selection - In tegrate v ariable selection into train- ing pro cess - Ev aluate subsets based on predictiv e p erformance - Can use SHAP v alues, permutation imp ortance - Assigned v alues can be negative Em b edded Medium Medium Medium Gini and Information Gain Imp or- tance - Use ML mo dels with built-in feature selection - Tied to sp ecific mo dels (e.g. tree- based mo dels) - Assign importance v alues during training - Non-relev an t features often assigned zero 2.2 Filter F eature Selection Metho ds A ccording to T able 1 , FFS metho ds hav e only one shortcoming which is their low predictiv e p erformance compared to wrapper and em b edded methods. In this pap er, w e prop ose a v alue-based FFS algorithm that achiev es similar av erage 5-fold cross v alidation accuracy compared to competing algorithms across 14 b enchmark datasets (see T ables 4 and 5 ), three heterogenous relev ance estimators (see Eqs. ( 1 )-( 3 ) below), and 6 p opular classifiers (see section 5.1 for more details ab out the classification mo dels). 4 Under-review F or relev ance estimation, this paper employ ed m utual information, also known as information gain ( I ), F-v alue ak a F-statistics ( F ), and Random F orest Gini imp ortance (Gini), also kno wn as Mean Decrease in Impurity (MDI); see Eqs. ( 1 ), ( 2 ), and ( 3 ), resp ectiv ely . I ( X , Y ) = I ( Y , X ) = X x i ∈ X X y i ∈ Y P ( x i , y i ) log P ( x i , y i ) P ( x i ) P ( y i ) (1) F-v alue = Explained v ariance Unexplained v ariance = Bet ween-sample v ariability Within-sample v ariability , (2) The F calculation in volv es many steps which are to o long to present here. The formula ab o ve (Eq. ( 2 )) is just illustrative. A comprehensiv e and detailed explanation can be found in Siegel [ 29 ]. Gini x j = MDI x j = 1 T T X t =1 X nodes n split on x j p ( n ) [ I ( n ) − p left I ( left ) − p right I ( right ) ] (3) In the Gini importance formula (Eq. ( 3 )) , T is the num ber of trees in the forest; n the no de in tree t that splits on feature j ; p ( n ) the prop ortion of samples reaching no de n ; I ( n ) the impurity of no de n (in terms of the Gini index); p left and p right are the prop ortions of samples going to the left and righ t child, respectively; and I ( left ) , I ( righ t ) the impurity of the left and right children, resp ectiv ely . The Gini index is defined as G = 1 − X c j ∈{ Y } p ( c j ) 2 , with { Y } the set of unique classes in Y and p ( c j ) the probability of samples belonging to class c j in the no de or dataset. 3 Related W ork In this section, we review the existing FFS literature. Before doing so, we provide an o verview of the FFS metho ds as found in literature in Fig. 1 . Th is figure illustrates the k ey steps and decision p oin ts in volv ed in current FFS approac hes. Section 3.1 b elow giv es the general formulation of the state of the art FFS algorithms (Max-Rel and mRMR). The v ast ma jorit y of the FFS metho ds found in the literature is an instance of one of these general form ulation shown in Eqs. ( 4 )-( 7 ); independently from their resp ectiv e relev ance and redundancy estimators they use. 3.1 General formulation of Max-Rel and mRMR The equations ( 4 ) and ( 5 ) are the general formulation of the Max-Rel and mRMR feature selection problems. F is the set of all features, S is the set of selected features, F \ S is the set of non-selected features, and F i is the candidate feature. Rel ( F i ) is the relev ance v alue of F i and Red ( F i , S ) is the redundancy v alue of F i with respect to the already selected features. 5 Under-review The ob jective of Max-Rel is to add F i to S if and only if Rel ( F i ) is the maximum relev ance v alue of all the features in F \ S . T o do so, Max-Rel uses a descending sorting algorithm and return the top k of the features with k ≤ |F | . mRMR, on the other hand, aims to add F i to S if and only if F i maximises the difference or quotient b etw een its relev ance Rel ( F i ) and its redundancy Red ( F i , S ) with resp ect to the already selected features. The first formulation by Battiti [ 30 ] includes a redundancy regulation parameter β ∈ [0 , 1] . This parameter β is set to 1 in the subsequent studies, starting from Ding and Peng [ 31 ] . β = 1 is the standard in recen t mRMR-based FFS methods (Eq. ( 6 )). Ding and Peng [ 31 ] prop osed anothe r reform ulation of mRMR by replacing the subtraction op eration b etw een relev ance and redundancy by a division op eration (see Eq. ( 7 )). More details on mRMR-based metho ds are provided in the section 3.3 . max F i ∈F \S Rel ( F i ) (4) max F i ∈F \S Rel ( F i ) − β × Red ( F i ; S ) (5) max F i ∈F \S Rel ( F i ) − Red ( F i ; S ) (6) max F i ∈F \S Rel ( F i ) Red ( F i ; S ) (7) FFS metho ds can b e classified in to t w o main groups: univ ariate and m ultiv ariate . This classification mainly fo cus on the n umber of v ariable inv olv ed in the actual selection algorithm i.e. sorting or an incremental searc h algorithm i.e. sequen tial forw ard searc h. F or instance, a feature selection method using random forest Gini imp ortance (an em b edded FS metho d) can b e classified as univ ariate FFS even though the relev ance estimation in volv es many features and their in teractions [ 2 ]. On the other hand, m ultiv ariate FFS incorp orate an estimation of feature interaction (redundancy or complementarit y) and uses a search algorithm such as the sequential forward search (a greedy searc h algorithm) to select the optimal feature subset [ 30 – 33 ]. Figure 1 b elow giv e an o verview of FFS metho ds on a tabular data as found in the literature. 3.2 Univ ariate FFS This is the most used family of FFS metho ds because they are the most computational efficien t and easily adaptable from one relev ance estimator to another [ 4 , 34 , 35 ]. Descending sorting is the only searc h algorithm used for Max-Rel feature selection metho ds. Ev en though they are considered less predictively p erformant than multiv ariate FFS methods (mRMR), v ariance-based Max-Rel has been shown to outp erform mRMR and embedded FS metho ds (including random forest Gini imp ortance, P ermutation imp ortance, and Bo osting imp ortance from the eXtreme Gradien t Bo osting model) in a systematic benchmark study on high-dimensional biological datasets [ 34 ]. This kind of studies are missing in the extan t literature, esp ecially in recen t y ears. These results are not surprising but highlight the challenges of the FS task where every single 6 Under-review Fig. 1 : Ov erview of FFS metho ds on a tabular data as found in the literature. decision can p ositively or negatively impact the expected outcome. FS c hallenges and gaps are discussed in section 3.4 b elow. 3.3 Multiv ariate FFS The first Min-Redundancy Max-Relev ance (mRMR) FFS method was in tro duced b y Battiti [ 30 ] and called mutual information-based feature selection (MIFS) . It uses m utual information for b oth relev ance and redundancy estimation (see Eq. ( 8 )). Battiti [ 30 ] used an incremen tal search algorithm (a greedy algorithm) to solve the ob jectiv e function shown in Eq. ( 8 ). max X i ∈F \S I ( X i ; Y ) − β × X X j ∈S I ( X i ; X j ) , (8) where Rel ( X i ) = I ( X i ; Y ) and Red ( X i ; S ) = P X j ∈S I ( X i ; X j ) . Recen t mRMR-based FFS metho ds used one of the t wo form ulation prop osed b y Ding and P eng [ 31 ] sho wn in Eqs. ( 6 ) and ( 7 ). They also proposed a mo dified v ersion of the m utual information-based redundancy estimation such as Red ( X i ; S ) = 1 |S | P X j ∈S I ( X i ; X j ) . Ding and Peng [ 31 ] also prop osed a new relev ance and redundancy estimator using F-v alue and Pearson correlation co efficient, respectively . They also used an incremental search algorithm to solv e the ob jective functions of their prop osed 7 Under-review mRMR-based FFS metho ds. The four v ariants prop osed b y Ding and P eng [ 31 ] are sho wn in Eqs. ( 9 )-( 12 ). max X i ∈F \S I ( X i ; Y ) − 1 |S | X X j ∈S I ( X i ; X j ) (9) max X i ∈F \S I ( X i ; Y ) 1 |S | P X j ∈S I ( X i ; X j ) (10) max X i ∈F \S F-v alue ( X i ; Y ) − 1 |S | X X j ∈S ρ ( X i ; X j ) (11) max X i ∈F \S F-v alue ( X i ; Y ) 1 |S | P X j ∈S ρ ( X i ; X j ) (12) ρ ( X i ; X j ) = cov( X i ; X j ) σ X i σ X j is Pearson correlation co efficient; where co v ( X i ; X j ) is the co v ariance of X i and X j ; σ X i and σ X j are the standard deviations of X i and X j , resp ectiv ely . In the extant literature, most efforts are made on finding alternativ e relev ance or redundancy estimators [ 19 , 36 – 42 ]. F or instance, in a recen t study [ 43 ], the authors prop osed a relev ance estimator using the maximum information co efficient (MIC) and a redundancy estimator using the wa velet similarity , max X i ∈F \S M I C ( X i ; Y ) − 1 |S | X X j ∈S W T S im ( X j ; X i ) , (13) where Rel ( X i ) = M I C ( X i ; Y ) = max | X i | , | Y | 0 , called p ow er, is a real num b er used as the bin size regulation hyperparameter (preferably α ∈ [0 . 05; 3] ). K Groups has three main steps: i) relev ance estimation, ii) feature clustering based on their relev ance v alues, and iii) actual feature selection. Each step is describ ed b elow. 1. Relev ance Estimation. Lik e Max-Rel and mRMR, one has to select a relev ance estimator and calculate the relev ance Rel ( F i ) of each feature in the dataset. Any relev ance estimator from the state of the art can b e used (see section 3 ). 2. F eature Clustering. This step is built up on the last one and uses the relev ance v alues to cluster the features into k groups. Here, each feature F i is assigned to the cluster C j if and only if Rel ( F i ) ∈ ] f ( j − 1; α ); f ( j ; α )] ; noting that f (0; α ) = min Rel ( F ) (see Eq. ( 22 )). Once the feature clustering is complete, w e proceed to the actual feature selection step. 3. A ctual F eature Selection. The goal here is to select the feature with the maxim um relev ance v alue Rel ( F i ) within each cluster C j for j = 1 , 2 , .., k . In practice, there is often more that one feature with the highest relev ance v alue within a given cluster. There are man y w ays to address this issue. One is to return the first or last feature within the cluster with the highest relev ance v alue. Another w ay is to randomly 11 Under-review select one or to just select all of the them. The first three approaches (select first, last or one randomly) hav e one ma jor drawbac k which is repro ducibility . If the features are shuffled then the resulting feature will be totally different. The second issue is explainabilit y; wh y is that feature preferred ov er the others. As to selecting all the features with the highest relev ance v alue, it fails to effective reduce the n umber of features when the the distribution of the relev ance v alues is skew ed. T o address all of the issues highlighted in the abov e paragraph, w e introduced the concept of tie-breaking. It is a sequential pro cess which consists of using additional relev ance estimators, one at a time, until either all the ties are broken or the list of tie-breakers is exhausted. If all the ties are brok en b efore the exhaustion of the list of tie-breakers, the pro cess stops. On the other hand, if the list is exhausted and some ties are not broken, the remaining features are returned. This concept of tie-breaking adds a lay er of robustness to the K Groups algorithm; at the cost of a little extra computation time. 5 Exp erimen tal Setup The exp erimen ts are designed to ev aluate the three feature selection algorithms i.e. K Groups (ours), mRMR, and KBest, ability to extract low-dimensional data from high-dimensional datasets, the robustness across classifiers of the low-dimensional data extraction, and the time complexit y of the resp ective algorithms. Our experiments employ ed 14 high-dimensional biological feature selection b ench- mark datasets (see T able 2 ), 6 widely used classifiers (with 4 highly rep orted in the FS literature i.e. KNeighbors, RandomF orest, GaussianNB, and LinearSVC; see section 5.1 b elo w), and 3 relev ance estimators (mutual information, F-v alue, and Gini imp ortance). The experimental configuration includes KBest (Max-Rel), the tw o v arian ts of mRMR (sho wn in Eqs. ( 6 ) and ( 7 )), and seven v ariants of K Groups (for α ∈ { 0 . 3; 0 . 5; 0 . 7; 1 . 0; 1 . 3; 1 . 5; 1 . 7 } ; see Eqs. ( 22 ) and Eq. ( 23 )) for mutual information and F-v alue relev ance estimators. As to Gini imp ortance relev ance estimator, only one v arian t (the quotient v arian t prop osed b y Zhao et al. [ 16 ] ; see Eq. ( 7 )) of mRMR is a v ailable in public Python pac k ages 2 [ 53 ], th us only this one has b een included. W e p erformed hyperparameter finetuning for KGroups and mRMR algorithms. F or K Groups, we finetuned the p ow er hyperparameter α ∈ { 0 . 3; 0 . 5; 0 . 7; 1 . 0; 1 . 3; 1 . 5; 1 . 7 } . F or mRMR, we finetuned the op erator b etw een Rel ( F i ) and Red ( F i , S ) ; meaning b et ween the difference (mRMR_D, see Eq. ( 6 )) and quotient (mRMR_Q, s ee Eq. ( 7 )) form ulations of mRMR. KGroups is more suitable for hyperparameter finetuning b ecause it is fast compared to mRMR; in fact, on av erage (across the three rele- v ance estimators) one K Groups v arian t is 122 . 8 times faster than one of mRMR (see section 6.3 for more details, especially Fig. 5 and T able 8 ). In other words, the time complexit y of 123 v arian ts of K Groups (123 different v alues of the the p o wer hyperparameter α ) is equiv alent to one of mRMR (mRMR_D or mRMR_Q) . KBest has only one v ariant (no h yp erparameters). 2 https://feature- engine.trainindata.com/en/latest/user_guide/selection/MRMR.html 12 Under-review 5.1 Classifiers The 6 classifiers used are k -Nearest Neighbors Classifier (KNeighbors), Gaussian Naive Ba yes Classifier (GaussianNB), Random F orest Classifier (RandomF orest), eXtreme Gradien t Bo osting Classifier (X GB), Multi-La yer Perceptron Classifier (MLP), and Linear Support V ector machine Classifier (LinearSVC). The classifiers are a v ailable in p opular machine learning pack ages (X GB in X GBo ost [ 54 ] pac k age and the rest in the scikit-learn [ 55 ] pack age). The classifiers are used with their default parameters and no h yp er-parameter finetuning w as p erformed. The short name of the classifiers b etw een paren thesis has been automatically extracted from their resp ectiv e Python pac k ages. These short names are used when referencing the classifiers in the rest of this paper. KNeigh b ors, RandomF orest, GaussianNB, and LinearSV C hav e b een chosen b ecause they hav e b een used in recent feature selection pap ers [ 15 , 43 , 44 ] and hav e b een highly reported in the last tw o decades in FS literature. Another reason for selecting GaussianNB is b ecause it is a probabilistic mo del. These are all widely used for classification tasks and are considered effective. XGB has b een c hosen b ecause it is a robust tree-based mo del (compared to DecisionT ree also known as classification and regression trees or CAR T) and MLP b ecause it is a [simple] neural netw ork (F eed F orward Net w ork or FFS). These reasons aligned with the justifications giv en by Ebiele et al. [ 52 ] for selecting classifiers with different architectures and underlying learning principles. Cho osing these classifiers will allo w us to study the robustness of the FS metho ds and algorithms. It also simplifies the comparison with other FS metho ds. 5.2 Datasets The 14 high-dimensional biological b enc hmark datasets emplo yed in the experiments are from Li et al. [ 56 ] ’s feature selection repository . Li et al. [ 56 ] ’s paper is a highly cited systematic review of feature selection literature whic h identified a total of 29 feature selection benchmark datasets including biological, text, face image, and hand-written image datasets. The 14 datasets selected for our exp erimen ts are all the biological b enc hmark datasets a v ailable on Li et al. [ 56 ] ’s fe ature selection rep ository . In terms of tasks, there are binary and multiclass classification datasets with the maximum n umber of classes b eing 11 b y the dataset Carcinom. The datasets with the low est and highest dimensions are lung_discrete and GLI_85, resp ectively . In terms of sample size, these are all small datasets with the num b er of entries ranging from 50 to 203. SMK_CAN_187 is the largest dataset in terms of num b er of entries and features (dimensionalit y) combined with 187 en tries and 19993 features. All these details ab out the datasets are summarised in T able 2 b elow. The datasets are sorted alphab etically b y name (case sensitive sorting). This is v ery typical with tabular biological datasets, they are usually small size and high-dimensional [ 34 , 43 , 56 ]. This type of datasets (small size and high-dimensional) are not eligible for deep neural netw orks (DNNs) b ecause of their size. A dditionally , Grinszta jn et al. [ 57 ] ha ve demonstrated that tree-based mo del (e.g. RandomF orest, X GB) outp erform DNNs (including T ransformer mo dels) on tabular data, with muc h less computational cost, due to irregular patterns in the target function, uninformativ e features, and non rotationally-inv ariant data where linear com binations of features 13 Under-review misrepresen t the information. The failure of DNNs on tabular data has b een noticed b efore Grinszta jn et al. [ 57 ] and gav e birth to an en tirely new researc h area called tabular deep learning. This new researc h area aims to stimulate efforts to design and implemen t DNNs arc hitecture sp ecialised on learning from tabular data. T able 2 : The list of b enchmark datasets used in our exp erimen ts. Name #Instances #F eatures #Classes ALLAML 72 7129 2 CLL_SUB_111 111 11340 3 Carcinom 174 9182 11 GLI_85 85 22283 2 GLIOMA 50 4434 4 Prostate_GE 102 5966 2 SMK_CAN_187 187 19993 2 TOX_171 171 5748 4 colon 62 2000 2 leukemia 72 7070 2 lung 203 3312 5 lung_discrete 73 325 7 lymphoma 96 4026 9 nci9 60 9712 9 5.3 T raining Setup and Ev aluation F or k ∈ [2 , 100] , eac h classifier is trained using 5-fold cross v alidation. The classifiers hav e b een ev aluated using the accuracy metric for ease of comparison to related work. It is defined as: A ccuracy = TP+TN TP+TN+FP+FN (see confusion matrix in T able 3 ) (24) The classifiers were trained on a shared high p erformance computing (HPC) no de running a Red Hat Enterprise Linux (RHEL) 9.5 mac hine with 356 GB RAM and an In tel Xeon Gold 6152 CPU (30.25 MB L3 Cac he and 2.1 up to 3.7 GHz F requency). The datasets hav e b een scaled using the scikit-learn Standard scaler b efore training. F or K Groups, cosine similarity has b een employ ed as tie-breaker for Mutual information and Mutual information has b een employ ed as tie-break er for F-v alue and Gini imp ortance. 6 Exp erimen tal Results and Discussion The experimental results are shown and discussed below for a set of 3 FS related tasks. KGroups, KBest, and mRMR algorithms hav e b een compared on low-dimension feature extraction, their robustness across heterogeneous ML mo dels, and execution 14 Under-review T able 3 : Confusion matrix. Actual Positiv e (P) Negative (N) Predicted Positiv e (P) T rue P ositive (TP) F alse P ositive (FP) Negative (N) F alse Negativ e (FN) T rue Negativ e (TN) time. T o make comparison easier to understand and follo w, w e p erformed a pairwise comparision of the three FFS algorithms; meaning KGroups versus KBest, then K Groups v erus mRMR for the low-dimension feature extraction task and the robustness across heterogeneous ML mo dels of the extraction. 6.1 Lo w-dimension F eature Extraction The lo w-dimension feature extraction task consists of selecting a subset of k features from the original feature set such that k ≪ |F | ; here we c hose k = 100 . Therefore, for k ∈ [2 , 100] , w e trained 6 differen t classifiers using 5-fold cross v alidation and recorded the a verage and standard deviation accuracy score. T able 4 displays the b est ov erall exp erimental configuration p er relev ance estimator and dataset as a result of systematic search. The results rep orted b elow are the b est configurations among 594 p ossible results p er v ariant p er dataset (594 = 99 p ossible v alue of k × 6 classifiers). F or mRMR and K Groups, the v arian t (after hyperparameter finetuning) with the highest accuracy p er dataset is rep orted. K Groups versus KBest: KGroups with Gini imp ortance relev ance estimator got the best configuration on 7 datasets. KGroups with mutual information estimator got the b est configuration on 9 datasets. KGroups with F-v alue relev ance estimator got the b est configuration on 10 datasets. KGroups and KBest tied on 4, 3, and 1 datasets, for Gini imp ortance, m utual information, and F-v alue relev ance estimator, resp ectively . A cross the three relev ance estimators, KGroups achiev ed b est configuration on 11 datasets o verall, tying with KBest on 4 datasets (7 excluding ties). KBest ac hieved b est configuration on 2 datasets excluding ties. Both, KGroups and KBest failed to ac hieved the b est configuration on the TO X_171 dataset. K Groups versus mRMR: K Groups with Gini imp ortance relev ance estimator got the b est configuration on 9 datasets. KGroups with mutual information estimator got the b est configuration on 5 datasets. KGroups with F-v alue relev ance estimator got the b est configuration on 2 datasets. KGroups and mRMR tied on 2, 2, and 4 datasets, for Gini imp ortance, m utual information, and F-v alue relev ance estimator, resp ectively . A cross the three relev ance estimators, KGroups achiev ed b est configuration on 6 datasets o verall, tying with mRMR on 2 datasets (4 excluding ties). mRMR achiev ed b est configuration on 7 datasets excluding ties. Both, K Groups and mRMR failed to ac hieved the b est configuration on the TO X_171 dataset. Figures 2 - 4 b elow show the distribution of the num ber of features selected by the b est configurations per datasets and p er FS algorithms (and their respective v ariants). Ov erall, K Groups (and its v arian ts) select few er features than the tw o mRMR v arian ts and KBest. This is particularly visible for Gini imp ortance and F-v alue relev ance estimators. As to the m utual information relev ance estimator, some of K Groups v ariants 15 Under-review o ccasionally select more features than at least one mRMR v ariants or KBest. This is noticeable with the colon dataset on Fig. 3 . Ho wev er, there are no instances where the t wo mRMR v ariants and KBest select few er features than all the v ariants of KGroups. It is worth mentioning that the distribution of the n umber of selected features by K Groups v arian ts for F-v alue relev ance estimator on the nci9 dataset is abnormal and will be discussed in section 7 b elo w. T able 4 : Best ov erall configurations of KBest and KGroups across classifiers. The highest accuracy per relev ance estimator excluding ties (Win) is in bold . Tied highest accuracy scores (Dra w) are underlined . The star ( ∗ ) indicates b est configuration p er dataset. a indicates abnormally lo w accuracy . Gini imp ortance Mutual info. F-v alue Dataset All feat. KBest K Groups KBest K Groups KBest KGroups ALLAML 95.91 100.00* 100.00* 98.57 100.00* 98.57 100.00* CLL_SUB_111 73.82 88.26* 88.22 84.66 84.66 71.15 79.21 Carcinom 95.47 94.82 96.54* 95.38 95.39 92.52 77.01 GLIOMA 78.00 98.00* 96.00 90.00 94.00 88.00 90.00 GLI_85 84.62 95.29 98.82* 96.47 98.82* 95.29 97.65 Prostate_GE 89.68 97.00 96.10 96.05 97.05* 95.10 97.05* SMK_CAN_187 70.18 76.49 78.61* 76.49 75.43 75.39 74.82 TOX_171 91.15* 83.09 84.29 69.03 73.66 70.20 76.00 colon 84.74 90.00 91.79 93.33 95.00* 90.13 93.59 leukemia 97.73 100.00* 100.00* 100.00* 100.00* 100.00* 100.00* lung 94.10 97.04 98.01* 97.52 97.54 94.60 96.55 lung_discrete 89.55 93.14 95.90* 91.71 90.48 93.14 94.38 lymphoma 91.38 95.84* 95.84* 95.79 94.79 87.53 94.79 nci9 52.22 a 78.33* 78.33* 48.33 a 66.67 78.33* 23.33 a Win / Draw 3 / 4 7 / 4 2 / 3 9 / 3 3 / 1 10 / 1 6.2 Robustness of F eature Extraction The FS task in volv es man y c hoices that can each impact the resulting feature subset considerably as discussed in Guy on and Elisseeff [ 2 ] . One of those c hoices is the classifier used; another is the num b er features k to b e returned (this can b e set manually or systematically giv en a range of p ossible v alues of k as we did). W e examined 6 p opular classifiers, each trained indep endently and recorded the best configurations for KBest, mRMR and KGRoups using the three relev ance estimators (Gini imp ortance, m utual information and F-v alue). Calculating the av erage (and standard deviation) accuracy of the top configurations p er classifier allows us to study the robustness of the feature selection algorithms. High a verage accuracy means the algorithm is reliable in returning feature subset with the highest accuracy indep endently of the classifier. Lo w standard deviation indicates high con vergence across classifiers; another sign of reliabilit y . T ables 6 and 7 highligh t the results of the studies of the robustness of the three feature selection algorithms included in this paper. 16 Under-re view T able 5 : Best o verall configurations of mRMR and K Groups across classifiers. The highest accuracy p er relev ance estimator excluding ties (Win) is in b old . Tied highest accuracy scores (Dra w) are underlined . The star ( ∗ ) indicates best configuration p er dataset. a indicates abnormally lo w accuracy . Gini imp ortance Mutual info. F-v alue Dataset All feat. mRMR K Groups mRMR K Groups mRMR KGroups ALLAML 95.91 100.00* 100.00* 100.00* 100.00* 100.00* 100.00* CLL_SUB_111 73.82 91.86* 88.22 90.04 84.66 85.57 79.21 Carcinom 95.47 95.98 96.54 96.55* 95.39 95.97 77.01 GLIOMA 78.00 94.00 96.00* 90.00 94.00 88.00 90.00 GLI_85 84.62 96.47 98.82* 97.65 98.82* 97.65 97.65 Prostate_GE 89.68 96.05 96.10 98.00* 97.05 97.05 97.05 SMK_CAN_187 70.18 76.49 78.61 73.81 75.43 81.28* 74.82 TOX_171 91.15* 85.95 84.29 77.78 73.66 80.13 76.00 colon 84.74 90.00 91.79 93.46 95.00* 93.33 93.59 leukemia 97.73 100.00* 100.00* 100.00* 100.00* 100.00* 100.00* lung 94.10 97.04 98.01 98.02* 97.54 97.52 96.55 lung_discrete 89.55 94.57 95.90* 91.81 90.48 94.57 94.38 lymphoma 91.38 98.95* 95.84 96.84 94.79 97.89 94.79 nci9 52.22 a 76.67 78.33 46.67 a 66.67 85.00* 23.33 a Win / Draw 3 / 2 9 / 2 7 / 2 5 / 2 8 / 4 2 / 4 Fig. 2 : Distribution of num b er of features selected b y KBest, mRMR, and K Groups using Gini imp ortance relev ance estimator and KNeighbors, GaussianNB, Random- F orest, X GB, MLP , and LinearSVC classification mo dels. 17 Under-re view Fig. 3 : Distribution of num b er of features selected b y KBest, mRMR, and K Groups using m utual information relev ance estimator and KNeighbors, GaussianNB, Ran- domF orest, X GB, MLP , and LinearSVC classification mo dels. Fig. 4 : Distribution of num b er of features selected b y KBest, mRMR, and K Groups using F-v alue relev ance estimator and KNeighbors, GaussianNB, RandomF orest, X GB, MLP , and LinearSV C classification mo dels. 18 Under-review K Groups versus KBest: KGroups with Gini imp ortance relev ance estimator got the b est configuration on 12 datasets. KGroups with mutual information estimator got the best configuration on 13 datasets. KGroups with F-v alue relev ance estimator got the b est configuration on 11 datasets. KGroups and KBest hav e not tied on an y of the three relev ance estimators. Across the three relev ance estimators, KGroups achiev ed b est configuration on 13 datasets (excluding ties). Both, KGroups and KBest failed to ac hieved the b est configuration on the TO X_171 dataset. K Groups versus mRMR: K Groups with Gini imp ortance relev ance estimator got the b est configuration on 8 datasets. KGroups with mutual information estimator got the b est configuration on 7 datasets. KGroups with F-v alue relev ance estimator got the b est configuration on 5 datasets. KGroups and mRMR tied on 2, 0, and 0 datasets, for Gini imp ortance, m utual information, and F-v alue relev ance estimator, resp ectively . A cross the three relev ance estimators, KGroups achiev ed b est configuration on 7 datasets o verall, tying with mRMR on 2 datasets (5 excluding ties). mRMR achiev ed b est configuration on 7 datasets excluding ties. Another thing noticeable when looking at the boxplots on Figs. 2 - 4 ab ov e is their difference in range ( max − min , excluding outliers). In general, KGroups v arian ts b o xplots are narrow er than KBest and the t wo v ariants of mRMR across the three relev ance estimators, esp ecially for Gini imp ortance and F-v alue. In other words, the n umbers of keys features selected b y KGroups v ary little from one classifier to another. This is a additional sign of robustness of the KGroups algorithm. 6.3 Execution Time In this section, we study the time complexity of the three feature selection algorithms during the feature extraction using their resp ective Central Pro cessing Unit (CPU) execution time. CPU time is the total duration any of the CPU cores sp ends activ ely executing instructions for a specific task or program. This excludes system interruptions, time sp en t waiting for input or output op erations, netw ork requests, or the system en tering a low-pow er or idle state. CPU time is equiv alen t for sequential, parallel or distributed tasks or programs. F or our experiments, we recorded b oth CPU and W all times, and they are equiv alent. Ho wev er, the CPU time has b een chosen ov er W all time to b e rep orted b elow for the reasons mentioned ab ov e. Figure 5 and T able 8 b elow displa y the CPU time in seconds of three FS algorithms across the three relev ance estimators. Time complexity of mRMR v ariants are equiv alent so are KGroups v arian ts, for a giv en relev ance and redundancy estimators. The time complexity of KBest and KGroups v arian ts is equiv alen t for different relev ance estimators e.g. Gini imp ortance, m utual information, and F-v alue (see Fig. 5 below). Ho wev er, mRMR time complexity heavily dep ends on the time complexity of the redundancy estimator. That is why the time complexity of mRMR is the same for Gini imp ortance and F-v alue but dramatically different for m utual information. In fact, time complexity of mRMR is on a verage 8 . 2 times slow er for m utual information compared to Gini imp ortance and F-v alue. These results aligned with the one rep orted b y Zhao et al. [ 16 ] (see section 3.3 ). T able 8 shows the CPU execution time in seconds of the three algorithms p er dataset and relev ance estimator. Overall, K Groups is sligh tly faster that KBest and 19 Under-review T able 6 : A verage ± standard deviation of the b est configurations of KBest and K Groups (KG) across classifiers. The highest av erage accuracy per relev ance estimator excluding ties (Win) is in bold . Tied highest av erage accuracy scores (Draw) are underlined . The star ( ∗ ) indicates b est configuration p er dataset. a indicates abnormally low accuracy . Gini imp ort. Mutual info. F-v alue Dataset All feat. KBest K G KBest K G KBest K G ALLAML 87.88 98.36 99.56* 97.43 99.33 96.98 98.33 ± 7.31 ± 1.37 ± 1.09 ± 2.21 ± 1.12 ± 2.03 ± 1.41 CLL_SUB_111 65.39 85.28 85.99* 78.96 80.00 65.62 73.36 ± 6.38 ± 2.50 ± 1.68 ± 4.41 ± 2.64 ± 4.58 ± 4.19 Carcinom 85.13 86.88 90.41* 87.26 89.82 81.93 69.05 ± 7.27 ± 9.89 ± 6.06 ± 10.71 ± 6.61 ± 14.66 ± 10.44 GLIOMA 62.67 90.33 90.67* 85.67 87.67 78.67 84.67 ± 16.54 ± 6.74 ± 2.42 ± 3.44 ± 4.97 ± 6.41 ± 3.72 GLI_85 77.63 94.90 96.27 94.90 96.86* 93.72 95.10 ± 8.39 ± 0.60 ± 0.89 ± 1.42 ± 0.61 ± 0.96 ± 0.88 Prostate 81.34 95.23 94.61 95.41 95.72* 94.60 95.42 ± 11.16 ± 1.29 ± 1.03 ± 0.79 ± 0.81 ± 0.51 ± 0.80 SMK_CAN_187 67.52 74.59 75.68* 71.66 73.43 74.83 72.80 ± 2.57 ± 1.44 ± 0.80 ± 3.08 ± 1.25 ± 0.67 ± 1.33 TO X_171 78.94* 77.50 76.83 66.47 69.41 66.49 71.21 ± 7.46 ± 3.91 ± 2.56 ± 2.70 ± 2.10 ± 2.62 ± 2.85 colon 77.11 87.93 90.11 91.26 91.90* 89.10 91.48 ± 6.14 ± 1.61 ± 0.94 ± 1.68 ± 2.01 ± 0.80 ± 1.31 leuk emia 87.88 99.56 99.78* 99.08 99.78* 98.89 99.78* ± 6.98 ± 0.69 ± 0.54 ± 1.69 ± 0.54 ± 1.00 ± 0.54 lung 84.02 95.72 96.47* 94.98 95.97 92.03 93.75 ± 15.75 ± 1.69 ± 0.65 ± 2.91 ± 1.48 ± 4.93 ± 4.29 lung_discrete 77.58 88.35 89.02* 87.11 86.79 87.52 87.70 ± 15.61 ± 7.97 ± 5.92 ± 6.74 ± 4.39 ± 6.02 ± 7.31 lymphoma 75.06 86.70 89.15 89.13 89.15 82.90 89.62* ± 19.38 ± 11.29 ± 7.27 ± 8.62 ± 5.69 ± 6.91 ± 6.07 nci9 43.33 a 68.33 70.56 41.11 a 57.50 71.39* 22.50 a ± 8.80 ± 9.25 ± 6.97 ± 8.21 ± 7.66 ± 5.91 ± 1.39 Win/Dra w 2/0 12/0 1/0 13/0 3/0 11/0 20 Under-review T able 7 : A verage ± standard deviation of the b est configurations of mRMR and KGroups (K G) across classifiers. The highest a verage accuracy per relev ance estimator excluding ties (Win ) is in b old . Tied highest av erage accuracy scores (Draw) are underlined . The star ( ∗ ) indicates b est configuration p er dataset. a indicates abnormally low accuracy . Gini imp ort. Mutual info. F-v alue Dataset All feat. mRMR K G mRMR K G mRMR K G ALLAML 87.88 98.16 99.56* 99.10 99.33 98.13 98.33 ± 7.31 ± 1.45 ± 1.09 ± 0.70 ± 1.12 ± 2.11 ± 1.41 CLL_SUB_111 65.39 88.12* 85.99 85.14 80.00 81.05 73.36 ± 6.38 ± 2.75 ± 1.68 ± 3.35 ± 2.64 ± 5.67 ± 4.19 Carcinom 85.13 90.41* 90.41* 90.22 89.82 89.82 69.05 ± 7.27 ± 5.96 ± 6.06 ± 8.84 ± 6.61 ± 10.71 ± 10.44 GLIOMA 62.67 88.00 90.67* 83.00 87.67 83.33 84.67 ± 16.54 ± 5.66 ± 2.42 ± 7.77 ± 4.97 ± 4.32 ± 3.72 GLI_85 77.63 94.70 96.27 94.71 96.86* 95.69 95.10 ± 8.39 ± 2.07 ± 0.89 ± 2.44 ± 0.61 ± 1.92 ± 0.88 Prostate 81.34 94.92 94.61 95.74* 95.72 95.25 95.42 ± 11.16 ± 0.95 ± 1.03 ± 0.79 ± 0.81 ± 1.14 ± 0.80 SMK_CAN_187 67.52 74.22 75.68 69.96 73.43 78.59* 72.80 ± 2.57 ± 1.76 ± 0.80 ± 2.23 ± 1.25 ± 2.25 ± 1.33 TO X_171 78.94 80.81* 76.83 74.27 69.41 75.68 71.21 ± 7.46 ± 4.00 ± 2.56 ± 2.77 ± 2.10 ± 2.38 ± 2.85 colon 77.11 88.22 90.11 91.86 91.90* 90.90 91.48 ± 6.14 ± 1.78 ± 0.94 ± 2.01 ± 2.01 ± 1.99 ± 1.31 leuk emia 87.88 99.78* 99.78* 99.10 99.78* 98.89 99.78* ± 6.98 ± 0.54 ± 0.54 ± 1.65 ± 0.54 ± 1.00 ± 0.54 lung 84.02 95.56 96.47* 96.06 95.97 95.80 93.75 ± 15.75 ± 1.76 ± 0.65 ± 1.68 ± 1.48 ± 2.15 ± 4.29 lung_discrete 77.58 88.98 89.02 87.89 86.79 89.70* 87.70 ± 15.61 ± 6.46 ± 5.92 ± 5.16 ± 4.39 ± 6.31 ± 7.31 lymphoma 75.06 91.31* 89.15 90.69 89.15 90.18 89.62 ± 19.38 ± 8.96 ± 7.27 ± 6.93 ± 5.69 ± 8.96 ± 6.07 nci9 43.33 a 70.00 70.56 40.00 a 57.50 76.11* 22.50 a ± 8.80 ± 10.06 ± 6.97 ± 7.82 ± 7.66 ± 8.41 ± 1.39 Win/Dra w 4/2 8/2 7/0 7/0 9/0 5/0 21 Under-review significan tly faster than mRMR. One can notice that the execution time p er dataset of K Groups and KBest changes little across the three relev ance estimator; confirming that the choice of the relev ance estimator has limited effects on the time complexit y of these tw o algorithms. How ev er, the choice of the relev ance and particularly of the redundancy estimators has a high impact on the time complex it y of mRMR algorithm. Fig. 5 : Bo xplots of the execution time in se conds of KBest, mRMR, and KGroups. 7 K Groups Limitations and P otentials In this section, we are going to discuss the limitations and p otentials of the KGroups algorithm. 7.1 K Groups Limitations Based on initial exploratory analysis of the distribution of the feature relev ance v alues (indep enden tly of the relev ance estimator), K Groups w orks b etter when the range is relativ ely large and the feature relev ance v alues are fairly distributed across the range (not to o many empty groups or clusters). F or instance, the F-v alue relev ance estimation of the nci9 dataset yielded only tw o non-empty clusters for k ∈ [2 , 100] . As a result, KGroups manages to select no more than t wo features during the lo w-dimension feature extraction task (see Fig. 4 ) and performed p o orly (see T ables 4 - 7 ). F urther study will b e required to determine the exact or a more accurate estimation of the limits. How ev er, for no w, we can state that KGroups has tw o main limitations: the range and distribution of the feature relev ance v alues. The second limitation seems to b e the most imp ortant. One wa y to address it is to simply change the relev ance estimator. 22 Under-review T able 8 : Execution time in seconds of the three FFS algorithms, K Groups (K G, on the left), KBest (KB, on the righ t), and mRMR (ev erything in betw een) p er relev ance estimator. The lo west execution time p er relev ance estimator is in b old . The last letter indicates the v arian t of mRMR: D for Difference and Q for Quotient. The other letters indicate the relev ance and redundancy estimators e.g. RF CQ for RandomF orest P earson Correlation Quotien t, MID for m utual information (for b oth relev ance and redundancy) Difference, and FCQ for F-v alue Pearson Correlation Quotien t. Gini imp ort. Mutual info. F-v alue Dataset K G RFCQ KB KG MID MIQ KB KG F CD FCQ KB ALLAML 180 5,952 186 186 52,448 52,432 192 184 5,878 5,864 176 CLL_SUB_111 234 9,600 275 253 94,996 94,983 271 233 9,434 9,425 245 Carcinom 552 8,307 917 752 96,504 94,879 746 28 8,004 7,998 660 GLIOMA 196 3,757 188 204 31,009 30,729 206 189 3,695 3,691 193 GLI_85 193 18,635 239 204 168,077 167,806 237 203 18,261 18,257 191 Prostate 194 5,136 205 202 49,347 48,072 209 195 5,050 5,045 196 SMK_CAN_187 259 17,323 378 277 209,722 199,394 308 273 16,945 17,019 260 TO X_171 281 5,163 343 309 58,694 56,592 320 290 4,962 4,958 300 colon 181 1,860 174 190 14,564 14,644 185 187 1,794 1,790 184 leuk emia 176 5,945 172 178 59,081 55,889 183 176 5,849 5,853 168 lung 276 3,287 324 311 36,602 37,106 307 270 3,096 3,086 290 lung_disc 208 612 191 216 2,505 2,828 205 214 538 534 204 lymphoma 231 3,517 221 239 33,646 33,130 251 235 3,424 3,436 226 nci9 216 7,869 217 232 81,428 76,530 274 178 7,849 7,778 209 7.2 K Groups P oten tials Despite the limitations discussed in the abov e section, K Groups has t wo ma jor adv an- tages: sp eed and parameterisation; this mak es K Groups suitable for hyperparameter finetuning. F rom a limited brute force h yp erparameter finetuning p erformed in this study , w e demonstrated that KGroups predictive p erformance can b e improv ed from that pro cedure. Therefore, KGroups p otentials can b e divided in to tw o: predictiv e p erformance optimisation and researc h opp ortunities. Predictiv e p erformance optimisation. If predictiv e performance is the main concern, then one can do a more complete brute force h yp erparameter finetuning for α ∈ ]0; 3] with a step of 0.1 or 0.05, for example. One would hav e to train 30 and 60 v arian ts of KGroups, respectively . Instead of a fixed step v alue of 0.1 or 0.05, one can use dynamic steps with larger v alues when close to 1 and smaller v alues when close to 0 or ab ov e 2. One can also finetune the bin size smo othing hyperparameter, a b o olean v ariable . This b o olean v ariable has tw o effects: (a) reduces the bins size of lo w relev ance v alues for v ery small α and increase the bins size of lo w relev ance v alues for large α (see Fig. 6 ) and (b) conv erts fixed step into dynamic step v alues. This will raise the num ber of v arian ts of KGroups to 60 and 120, resp ectiv ely . This whole pro cess is still computationally cheaper than one v ariant of mRMR; as aforementioned one v arian ts of mRMR is equiv alen t to 123 v ariants of KGroups in terms of time complexit y . KGroups predictive p erformance can also b e improv e further by trying a handful of tie-breakers for additional computational cost. 23 Und er-revie w Researc h opp ortunities. Instead of a brute force approac h of hyperparameter finetuning, researchers can inv estigate more efficient w ays to achiev e comp eting predic- tiv e p erformance with less computation. F or instance, the choice of the tie-breaker(s) and the v alue(s) of α according to the distribution of the relev ance estimator. Finding smarter and cheaper wa ys of making those tw o c hoices can mak e a h uge difference. Figure 6 b elow shows the impact of α and the smo othing v ariable on the bins size for k = 20 . Mutual information relev ance estimator on the ALLAML dataset is used as example. On the top row is display ed mutual information ( α = 1 , on the left) and cosine similarity (the tie-break er, on the righ t) relev ance v alues. One can notice that the distribution mutual information rele v ance v alues is righ t-skew ed (but with no empt y clusters); how ever, the distribution of the cosine similarit y relev ance v alues is normally distributed. F or α = 1 , all the bins of the histogram ha ve the same size. On the b ottom row is shown the distribution of smo othed and non-smo othed bins for α = 0 . 5 and α = 1 . 5 , resp ectively , from left to right. F or α < 1 , more features with high relev ance v alues are selected. In versely , more features with low relev ance v alues are selected for α > 1 . Fig. 6 : Impact of α and the smo othing v ariable on the bins size for k = 20 ; example of m utual information relev ance estimator on the ALLAML dataset. 8 Conclusion In this pap er, w e proposed KGroups, a new versatile univ ariate Max-Relev ance Min- Redundancy algorithm that can easily b e applied to an y type of relev ance estimator. 24 Under-review K Groups is fast (up to 821 times faster that multiv ariate mRMR; 123 times faster on a verage) and parameterisable. This mak e it suitable for h yp erparameters finetuning. Based on intensiv e and systematic exp erimen tations, we demonstrated K Groups sup eriorit y compared to KBest. w e also show ed that a full hyperparameters finetuning of mRMR is equiv alen t to a limited brute force hyperparameters finetuning of KGroups in terms of predictive performance measured in av erage 5-fold cross v alidation accuracy . Next, w e highligh ted and discussed KGroups limitations and potentials. F or future work, we aim to inv estigate wa ys to address K Groups limitations and harness its p oten tials. W e also wan t to extend the exp erimen ts p erformed in this pap er to additional datasets, esp ecially to other types or mo dalities of data, such as images. Supplemen tary information. The entire pro ject, from the co de files to the raw and pro cessed exp erimen tal results, is released and publicly av ailable on GitHub at h ttps://github.com/malic k- jaures/KGroups_Bio.git for ease of repro duction and to stim ulate further researc h in this research area. A ckno wledgemen ts. This research was conducted with the financial supp ort of T aighde Eíreann – Research Ireland under Gran t Agreemen t No. 13/R C/2106_P2 at the AD APT Cen tre at Univ ersity College Dublin. References [1] Theng, D., Bhoy ar, K.K.: F eature selection techniques for mac hine learning: a surv ey of more than tw o decades of research. Kno wledge and Information Systems 66 (3), 1575–1637 (2024) h ttps://doi.org/10.1007/s10115- 023- 02010- 5 . A ccessed 2024-07-30 [2] Guy on, I., Elisseeff, A.: An introduction to v ariable and feature selection. Journal of mac hine learning research 3 (Mar), 1157–1182 (2003). Accessed 2025-02-13 [3] V erdecchia, R., Cruz, L., Sallou, J., Lin, M., Wick enden, J., Hotellier, E.: Data- Cen tric Green AI An Exploratory Empirical Study. In: 2022 In ternational Conference on ICT for Sustainability (ICT4S), pp. 35–45 (2022). https://doi.org/ 10.1109/ICT4S55073.2022.00015 . https://ieeexplore.ieee.o rg/do cument/9830097/ A ccessed 2025-02-10 [4] Omar, R., Muccini, H.: Energy Efficiency of AI-P ow ered Components: A Com- parativ e Study of F eature Selection Methods. In: 2024 10th International Conference on ICT for Sustainabilit y (ICT4S), pp. 99–108 (2024). h ttps://doi.org/ 10.1109/ICT4S64576.2024.00019 . https://ieeexplore.ieee.o rg/do cument/10805260/ A ccessed 2025-02-10 [5] Cottier, B., Rahman, R., F attorini, L., Maslej, N., Ow en, D.: The rising costs of training frontier AI mo dels. arXiv (2024). h ttps://doi.org/10.48550/arXiv.2405. 21015 . http://arxiv.org/abs/2405.21015 Accessed 2025-02-10 25 Under-review [6] Jiao, R., Nguyen, B.H., Xue, B., Zhang, M.: A Survey on Evolutionary Mul- tiob jective F eature Selection in Classification: Approaches, Applications, and Challenges. IEEE T ransactions on Evolutionary Computation, 1–1 (2023) https: //doi.org/10.1109/TEV C.2023.3292527 . A ccessed 2024-07-30 [7] P edrycz, W.: T ow ards green machine learning: challenges, opp ortunities, and dev elopments. Journal of Smart Environmen ts and Green Computing 2 (4), 163– 174 (2022) https://doi.org/10.20517/jsegc.2022.16 . A ccessed 2025-02-15 [8] T abbakh, A., Al Amin, L., Islam, M., Mahmud, G.M.I., Chowdh ury , I.K., Mukta, M.S.H.: T o wards sustainable AI: a comprehensive framew ork for Green AI. Dis- co ver Sustainability 5 (1), 408 (2024) https://doi.org/10.1007/s43621- 024- 00641- 4 . A ccessed 2025-02-15 [9] Bolón-Canedo, V., Morán-F ernández, L., Cancela, B., Alonso-Betanzos, A.: A review of green artificial intelligence: T o w ards a more sustainable future. Neuro- computing 599 , 128096 (2024) h ttps://doi.org/10.1016/j.neucom.2024.128096 . A ccessed 2025-02-15 [10] Salehi, S., Schmeink, A.: Data-Centric Green Artificial Intelligence: A Surv ey. IEEE T ransactions on Artificial Intelligence 5 (5), 1973–1989 (2024) h ttps://doi. org/10.1109/T AI.2023.3315272 . Accessed 2025-02-10 [11] Järv enpää, H., Lago, P ., Bogner, J., Lewis, G., Muccini, H., Ozk ay a, I.: A Syn thesis of Green Architectural T actics for ML-Enabled Systems. In: Pro ceed- ings of the 46th International Conference on Softw are Enginee ring: Softw are Engineering in So ciet y . ICSE-SEIS’24, pp. 130–141. Association for Computing Mac hinery , New Y ork, NY, USA (2024). https://doi.org/10.1145/3639475.3640111 . https://dl.acm.o rg/doi/10.1145/3639475.3640111 A ccessed 2025-02-10 [12] W u, C.-J., Raghav endra, R., Gupta, U., Acun, B., Ardalani, N., Maeng, K., Chang, G., Aga, F., Huang, J., Bai, C., Gsch wind, M., Gupta, A., Ott, M., Melnik ov, A., Candido, S., Bro oks, D., Chauhan, G., Lee, B., Lee, H.-H., Akyildiz, B., Balandat, M., Spisak, J., Jain, R., Rabbat, M., Hazelw o o d, K.: Sustainable AI: Environmen tal Implications, Challenges and Opp ortunities. Proceedings of Mac hine Learning and Systems 4 , 795–813 (2022). Accessed 2025-02-10 [13] Buś, S., Jędrzejewski, K., Guzik, P .: Using Minimum Redundancy Maximum Relev ance Algorithm to Select Minimal Sets of Heart Rate V ariabilit y P arame- ters for Atrial Fibrillation Detection. Journal of Clinical Medicine 11 (14), 4004 (2022) h ttps://doi.org/10.3390/jcm11144004 . Publisher: Multidisciplinary Digital Publishing Institute. Accessed 2025-08-19 [14] Do ew es, A., Swasono, S.E., Harjito, B.: F eature selection on Human Activ- it y Recognition dataset using Minimum Redundancy Maxim um Relev ance. In: 2017 IEEE International Conference on Consumer Electronics - T aiwan (ICCE- TW), pp. 171–172 (2017). https://doi.org/10.1109/ICCE- China.2017.7991050 . 26 Under-review https://ieeexplo re.ieee.org/abstract/document/7991050 Accessed 2025-08-19 [15] Dub ey , V.K., Saxena, A.K.: A Cosine-Similarit y Mutual-Information Approach for F eature Selection on High Dimensional Datasets. J. Inf. T echnol. Res. 10 (1), 15–28 (2017) https://doi.org/10.4018/JITR.2017010102 . A ccessed 2025-02-18 [16] Zhao, Z., Anand, R., W ang, M.: Maximum Relev ance and Minimum Redun- dancy F eature Selection Metho ds for a Marketing Mac hine Learning Platform. In: 2019 IEEE International Conference on Data Science and Adv anced Ana- lytics (DSAA), pp. 442–452 (2019). https://doi.org/10.1109/DSAA.2019.00059 . https://ieeexplo re.ieee.org/abstract/document/8964172 Accessed 2025-08-19 [17] A tef, M., Ouf, S., Seoud, W., Gabr, M.I.: A nov el approach using explainable prediction of default risk in peer-to-p eer lending based on machine learning mo dels. Neural Computing and Applications (2025) https://doi.org/10.1007/ s00521- 025- 11489- 8 . A ccessed 2025-08-19 [18] Billah, M., W aheed, S.: Minimum redundancy maximum relev ance (mRMR) based feature selection from endoscopic images for automatic gastrointestinal p olyp detection. Multimedia T o ols and Applications 79 (33), 23633–23643 (2020) h ttps://doi.org/10.1007/s11042- 020- 09151- 7 . Accessed 2025-08-19 [19] Rado vic, M., Ghalwash, M., Filip ovic, N., Obradovic, Z.: Minim um redundancy maxim um relev ance feature selection approach for temp oral gene expression data. BMC Bioinformatics 18 (1), 9 (2017) https://doi.org/10.1186/s12859- 016- 1423- 9 . A ccessed 2025-08-19 [20] Ma, X.-H., Chen, Z.-G., Liu, J.-M.: W a velength selection metho d for near-infrared sp ectroscop y based on Max-Relev ance Min-Redundancy. Sp ectrochimica Acta P art A: Molecular and Biomolecular Sp ectroscopy 310 , 123933 (2024) https: //doi.org/10.1016/j.saa.2024.123933 . Accessed 2025-08-19 [21] Shirzad, M.B., Keyv anp our, M.R.: A feature selection method based on minimum redundancy maximum relev ance for learning to rank. In: 2015 AI & Rob otics (IRANOPEN), pp. 1–5 (2015). https://doi.org/10.1109/RIOS.2015.7270735 . https://ieeexplo re.ieee.org/abstract/document/7270735 Accessed 2025-08-19 [22] Huang, M., Sun, L., Xu, J., Zhang, S.: Multilabel F eature Selection Using Relief and Minim um Redundancy Maxim um Relev ance Based on Neigh b orho o d Rough Sets. IEEE A ccess 8 , 62011–62031 (2020) h ttps://doi.org/10.1109/ACCESS.2020. 2982536 . Accessed 2025-08-19 [23] Cheng, X.: A Comprehensive Study of F eature Selection T echniques in Mac hine Learning Mo dels. Social Science Researc h Net work, Rochester, NY (2024). https://doi.org/10.2139/ssrn.5154947 . https://papers.ssrn.com/abstract= 5154947 A ccessed 2025-08-29 27 Under-review [24] Liu, X., Xue, J.: Spatial Cluster Analysis by the Bin-Pac king Problem and DNA Computing T ec hnique. Discrete Dynamics in Nature and Soci- et y 2013 (1), 891428 (2013) https://doi.org/10.1155/2013/891428 . _eprint: h ttps://onlinelibrary .wiley .com/doi/p df/10.1155/2013/891428. Accessed 2025-07- 29 [25] Muth ukumaran, S., Mary , A.V.A., V alli, M.: A Nov el Approach to Data Dis- cretization Using Clustering T echniques in Mining of High Dimensional Data (2016) [26] Sanders, J.S., F abian, A.C.: A daptive binning of X-ray galaxy cluster images. Mon thly Notices of the Ro yal Astronomical Society 325 (1), 178–186 (2001) h ttps://doi.org/10.1046/j.1365- 8711.2001.04410.x . Accessed 2025-07-29 [27] Zhang, Y., W u, J., Cai, J.: Compact Representation for Image Classification: T o Cho ose or to Compress? In: 2014 IEEE Conference on Computer Vision and P attern Recognition, pp. 907–914. IEEE, Columbus, OH, USA (2014). https: //doi.org/10.1109/CVPR.2014.121 . https://ieeexplo re.ieee.org/document/6909516 A ccessed 2025-09-01 [28] Moslemi, A.: A tutorial-based survey on feature selection: Recent adv ancements on feature selection. Engineering Applications of Artificial In telligence 126 , 107136 (2023) h ttps://doi.org/10.1016/j.engappai.2023.107136 . Accessed 2024-07-30 [29] Siegel, A.F.: Chapter 15 - ANO V A: T esting for Differences Among Man y Samples and Muc h More. In: Siegel, A.F. (ed.) Practical Business Statistics (Sev enth Edition), pp. 469–492. Academic Press, ??? (2016). https://doi.org/10.1016/B978- 0- 12- 804250- 2.00015- 8 . https://www.sciencedirect.com/science/a rticle/pii/B9780128042502000158 A ccessed 2025-05-13 [30] Battiti, R.: Using Mutual Information for Selecting F eatures in Sup ervised Neural Net Learning. Neural Net works, IEEE T ransactions on 5 , 537–550 (1994) https: //doi.org/10.1109/72.298224 [31] Ding, C., Peng, H.: MINIMUM REDUNDANCY FEA TURE SELECTION FR OM MICR OARRA Y GENE EXPRESSION D A T A. Journal of Bioinformat- ics and Computational Biology 03 (02), 185–205 (2005) h ttps://doi.org/10.1142/ S0219720005001004 . Accessed 2025-09-05 [32] Li, C., Luo, X., Qi, Y., Gao, Z., Lin, X.: A new feature selection algorithm based on relev ance, redundancy and complemen tarity . Computers in Biology and Medicine 119 , 103667 (2020) h ttps://doi.org/10.1016/j.compbiomed.2020.103667 . A ccessed 2025-08-19 [33] Ihianle, I.K., Machado, P ., Ow a, K., Adama, D.A., Otuk a, R., Lotfi, A.: Minimising redundancy , maximising relev ance: HR V feature selection for stress classification. 28 Under-review Exp ert Systems with Applications 239 , 122490 (2024) h ttps://doi.org/10.1016/j. esw a.2023.122490 . A ccessed 2025-08-19 [34] Bommert, A., W elc howski, T., Schmid, M., Rahnenführer, J.: Benc hmark of filter metho ds for feature selec tion in high-dimensional gene expression surviv al data. Briefings in Bioinformatics 23 (1), 354 (2022) https://doi.org/10.1093/bib/bbab354 . A ccessed 2025-07-16 [35] Bugata, P ., Drotar, P .: On some asp ects of minimum redundancy maximum relev ance feature selection. Science China Information Sciences 63 (1), 112103 (2019) h ttps://doi.org/10.1007/s11432- 019- 2633- y . Accessed 2025-08-19 [36] Jo, I., Lee, S., Oh, S.: Impro ved Measures of Redundancy and Relev ance for mRMR F eature Selection. Computers 8 (2), 42 (2019) https://doi.org/10.3390/ computers8020042 . Publisher: Multidisciplinary Digital Publishing Institute. A ccessed 2025-08-19 [37] Che, J., Y ang, Y., Li, L., Bai, X., Zhang, S., Deng, C.: Maximum relev ance minim um common redundancy feature selection for nonlinear data. Informa- tion Sciences 409-410 , 68–86 (2017) https://doi.org/10.1016/j.ins.2017.05.013 . A ccessed 2025-08-19 [38] Sena wi, A., W ei, H.-L., Billings, S.A.: A new maximum relev ance-minim um m ulticollinearity (MRmMC) metho d for feature selection and ranking. Pat- tern Recognition 67 , 47–61 (2017) https://doi.org/10.1016/j.patcog.2017.01.026 . A ccessed 2025-09-08 [39] Mandal, M., Mukhopadhy ay , A.: An Improv ed Minim um Redundancy Maxim um Relev ance Approach for F eature Selection in Gene Expres sion Data. Pro cedia T ec h- nology 10 , 20–27 (2013) https://doi.org/10.1016/j.protcy .2013.12.332 . A ccessed 2025-08-19 [40] Y ang, J., Zhu, Z., He, S., Ji, Z.: Minimal-redundancy-maximal-relev ance feature selection using different relev ance measures for omics data classification. In: 2013 IEEE S ymposium on Computational Intelligence in Bioinformatics and Compu- tational Biology (CIBCB), pp. 246–251 (2013). h ttps://doi.org/10.1109/CIBCB. 2013.6595417 . https://ieeexplore.ieee.o rg/abstract/do cument/6595417 Accessed 2025-08-19 [41] Lin, D., T ang, X.: Conditional Infomax Learning: An Integrated F ramework for F eature Extraction and F usion. In: Leonardis, A., Bischof, H., Pinz, A. (eds.) Computer Vision – ECCV 2006, pp. 68–82. Springer, Berlin, Heidelb erg (2006). h ttps://doi.org/10.1007/11744023_6 [42] K wak, N., Choi, C.-H.: Input feature selection for classification problems. IEEE T ransactions on Neural Netw orks 13 (1), 143–159 (2002) https://doi.org/10.1109/ 72.977291 . Accessed 2025-09-08 29 Under-review [43] Y uan, G., Li, X., Qiu, P ., Zhou, X.: F eature selection metho d based on w av elet similarit y combined with maximum information co efficient. Information Sciences 699 , 121801 (2025) https://doi.org/10.1016/j.ins.2024.121801 . Accessed 2025-05- 09 [44] Y uan, G., Zhai, Y., T ang, J., Zhou, X.: CSCIM_fs: Cosine similarit y coefficient and information measurement criterion-based feature selection metho d for high- dimensional data. Neuro computing 552 , 126564 (2023) https://doi.org/10.1016/j. neucom.2023.126564 . Accessed 2025-02-18 [45] Lop ez-P az, D., Hennig, P ., Sc hölkopf, B.: The Randomized Dep endence Coefficient. In: Adv ances in Neural Information Pro- cessing Systems, v ol. 26. Curran Asso ciates, Inc., ??? (2013). https://p ro ceedings.neurips.cc/pap er/2013/hash/aab3238922b cc25a6f606eb525ffdc56- Abstract.html A ccessed 2025-09-08 [46] Szék ely , G.J., Rizzo, M.L.: Brownian distance co v ariance. The Annals of Applied Statistics 3 (4), 1236–1265 (2009) h ttps://doi.org/10.1214/09- A OAS312 . Publisher: Institute of Mathematical Statistics. Accessed 2025-10-09 [47] Zhang, P ., Gao, W., Hu, J., Li, Y.: A conditional-weigh t join t relev ance metric for feature relev ancy term. Engineering Applications of Artificial Intelligence 106 , 104481 (2021) https://doi.org/10.1016/j.engappai.2021.104481 . A ccessed 2025-04-28 [48] Zhang, P ., Gao, W.: F eature selection considering Uncertaint y Change Ratio of the class lab el. Applied Soft Computing 95 , 106537 (2020) https://doi.org/10. 1016/j.aso c.2020.106537 . Accessed 2025-09-08 [49] W ang, Y., Li, X., Ruiz, R.: F eature Selection With Maximal Relev ance and Minimal Sup ervised Redundancy. IEEE T ransactions on Cyb ernetics 53 (2), 707–717 (2023) h ttps://doi.org/10.1109/TCYB.2021.3139898 . A ccessed 2025-08-28 [50] Ramírez-Gallego, S., Lastra, I., Martínez-Rego, D., Bolón-Canedo, V., Benítez, J.M., Herrera, F., Alonso-Betanzos, A.: F ast-mRMR: F ast Minimum Redundancy Maxim um Relev ance Algorithm for High-Dimensional Big Data. International Journal of Intelligen t Systems 32 (2), 134–152 (2017) h ttps://doi.org/10.1002/ in t.21833 . _eprint: h ttps://onlinelibrary .wiley .com/doi/pdf/10.1002/int.21833. A ccessed 2025-09-01 [51] Berrendero, J.R., Cuev as, A., T orrecilla, J.L.: The mRMR v ariable selec- tion metho d: a comparativ e study for functional data. Journal of Statistical Computation and Sim ulation (2016). Publisher: T aylor & F rancis. A ccessed 2025-08-19 [52] Ebiele, M., Bendec hac he, M., W ard, M., Geary , U., Byrne, D., Creagh, D., Brennan, R.: The Impact of Data V aluation on F eature Imp ortance in Classification Models. 30 Under-review In: F ortino, G., Kumar, A., Swaroop, A., Sh ukla, P . (eds.) Pro ceedings of Third In ternational Conference on Computing and Communication Net works vol. 917, pp. 601–617. Springer, Singap ore (2024). h ttps://doi.org/10.1007/978- 981- 97- 0892- 5_ 47 . https://link.springer.com/10.1007/978-981-97-0892-5_47 A ccessed 2025-05-08 [53] Galli, S.: F eature-engine: A Python pack age for feature engineering for mac hine learning. Journal of Op en Source Soft ware 6 (65), 3642 (2021) https://doi.org/10. 21105/joss.03642 . Accessed 2025-10-15 [54] Chen, T., Guestrin, C.: XGBoost: A Scalable T ree Bo osting System. In: Pro ceed- ings of the 22nd ACM SIGKDD International Conference on Knowledge Discov ery And Data Mining. KDD ’16, pp. 785–794. ACM, New Y ork, NY, USA (2016). h ttps://doi.org/10.1145/2939672.2939785 . even t-place: San F rancisco, California, USA. http://doi.acm.o rg/10.1145/2939672.2939785 [55] P edregosa, F., V aroquaux, G., Gramfort, A., Michel, V., Thirion, B., Grisel, O., Blondel, M., Prettenhofer, P ., W eiss, R., Dub ourg, V., V anderplas, J., P assos, A., Cournap eau, D., Bruc her, M., Perrot, M., Duchesna y , E.: Scikit-learn: M ac hine Learning in Python. Journal of Machine Learning Research 12 , 2825–2830 (2011) [56] Li, J., Cheng, K., W ang, S., Morstatter, F., T revino, R.P ., T ang, J., Liu, H.: F eature Selection: A Data P ersp ective. ACM Comput. Surv. 50 (6), 94–19445 (2017) h ttps://doi.org/10.1145/3136625 . Accessed 2025-05-07 [57] Grinszta jn, L., Oyallon, E., V aroquaux, G.: Why do tree-based mo dels still outp erform deep learning on t ypical tabular data? In: Pro ceedings of the 36th In ternational Conference on Neural Information Pro cessing Systems. NIPS ’22, pp. 507–520. Curran Asso ciates Inc., Red Ho ok, NY, USA (2022) 31
Original Paper
Loading high-quality paper...
Comments & Academic Discussion
Loading comments...
Leave a Comment