Longitudinal Digital Phenotyping for Early Cognitive-Motor Screening
Early detection of atypical cognitive-motor development is critical for timely intervention, yet traditional assessments rely heavily on subjective, static evaluations. The integration of digital devices offers an opportunity for continuous, objectiv…
Authors: Diego Jimenez-Oviedo, Ruben Vera-Rodriguez, Ruben Tolosana
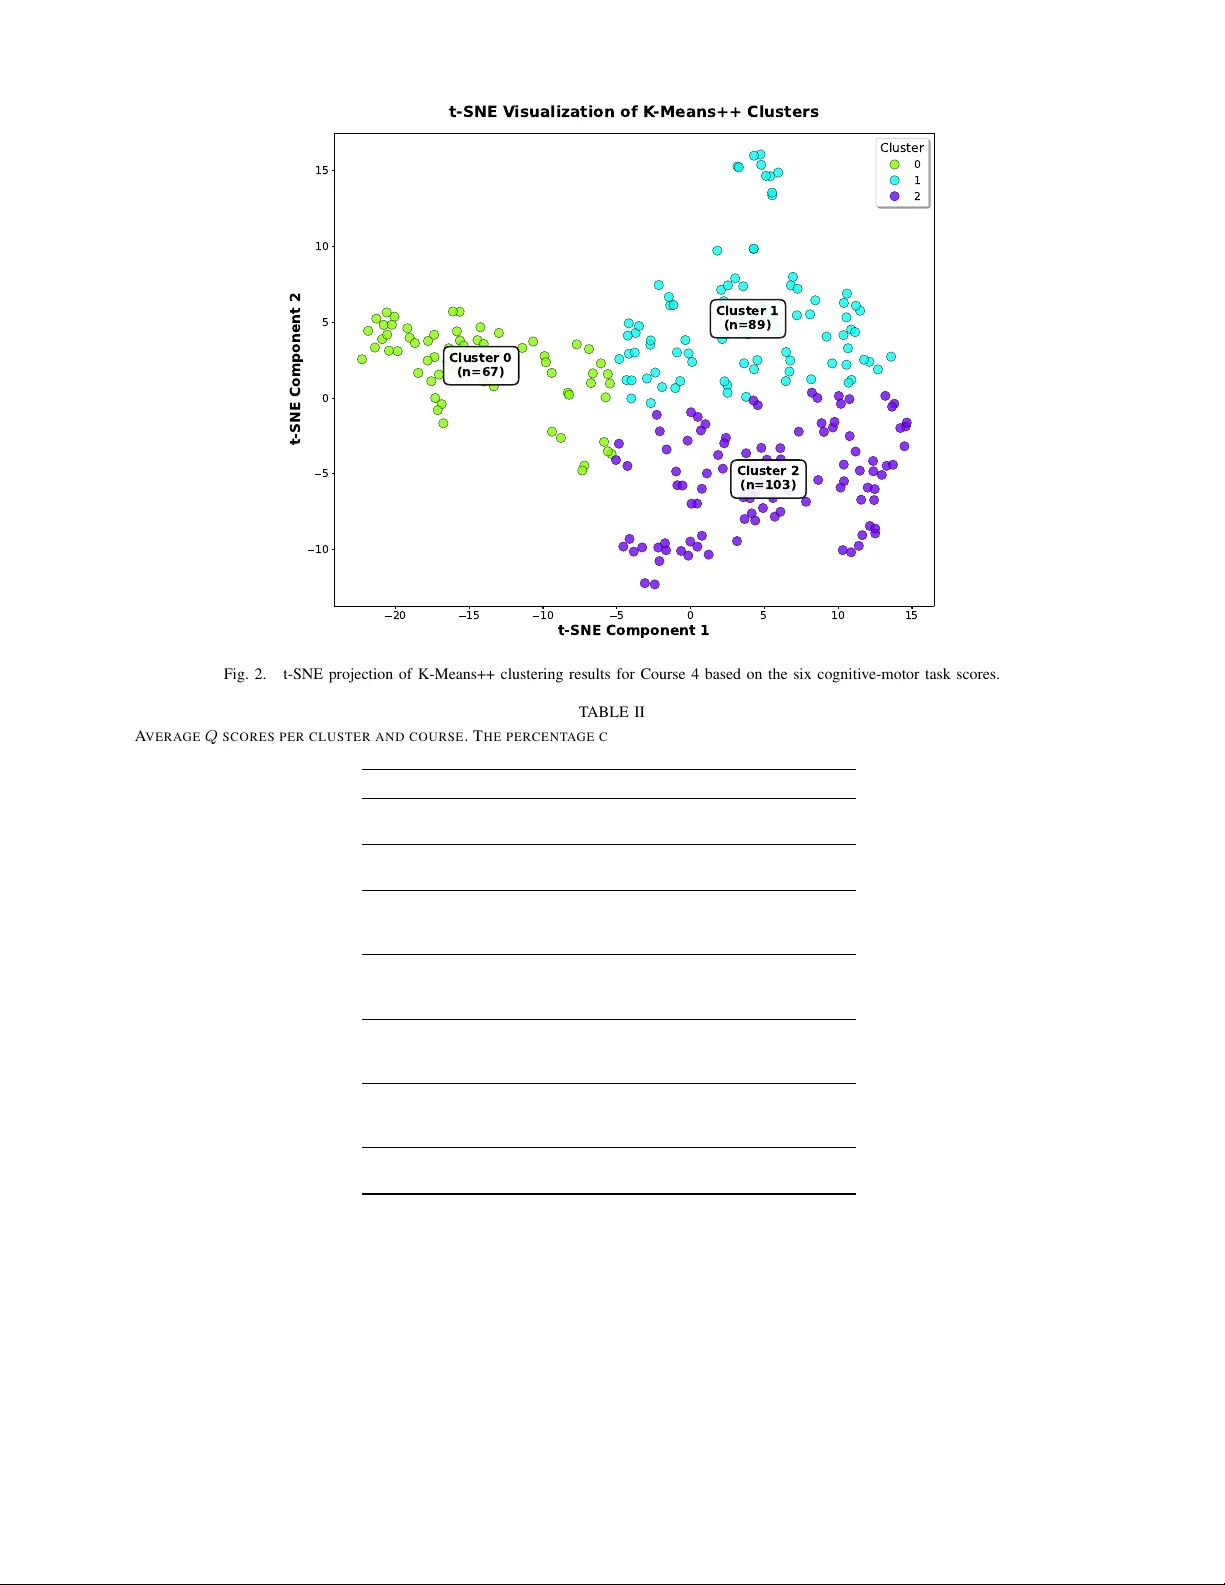
Longitudinal Digital Phenotyping f or Early Cognitiv e-Motor Screening Diego Jimenez-Oviedo 1 , Ruben V era-Rodriguez 1 , ∗ , Ruben T olosana 1 , Juan Carlos Ruiz-Garcia 1 , and Jaime Herreros-Rodriguez 2 1 BiometricsAI, Univ ersidad Autonoma de Madrid, 28049 Madrid, Spain 2 Hospital Univ ersitario Infanta Leonor , 28031 Madrid, Spain *Corresponding author: ruben.vera@uam.es Abstract — Early detection of atypical cognitive-motor de- velopment is critical for timely intervention, yet traditional assessments rely heavily on subjective, static evaluations. The integration of digital devices offers an opportunity for contin- uous, objective monitoring through digital biomarkers. In this work, we propose an AI-driven longitudinal frame- work to model developmental trajectories in children aged 18 months to 8 years. Using a dataset of tablet-based interac- tions collected over multiple academic years, we analyzed six cognitive-motor tasks (e.g., fine motor control, reaction time). W e applied dimensionality reduction (t-SNE) and unsuper - vised clustering (K-Means++) to identify distinct developmental phenotypes and tracked individual transitions between these profiles ov er time. Our analysis rev eals three distinct profiles: low , medium, and high performance. Crucially , longitudinal tracking highlights a high stability in the low-performance cluster ( > 90% retention in early years), suggesting that early deficits tend to persist without intervention. Con versely , higher -performance clusters show greater variability , potentially reflecting engagement fac- tors. This study validates the use of unsupervised learning on touchscreen data to uncover heterogeneous developmental paths. The identified profiles serve as scalable, data-driven proxies for cognitive growth, offering a foundation for early screening tools and personalized pediatric interventions. Index T erms —Cognitive development, Longitudinal anal- ysis, Child-computer interaction, Clustering, T ouchscreen data. I . I N T RO D U C T I O N Early detection of atypical cognitive dev elopment in chil- dren is crucial for implementing timely and effecti ve educa- tional or clinical interventions. Howe ver , current assessment approaches are often static, limited to isolated measurements, and heavily dependent on subjectiv e ev aluations. With the growing integration of digital devices in early childhood education, there is an opportunity to collect rich, objective, and continuous data about children’ s cognitiv e and motor behavior . In this work, we present a longitudinal modeling frame- work that uses unsupervised learning to track cognitive dev elopment based on interaction data gathered from young children during structured tablet-based activities. Over sev- eral academic years, children completed a series of digital tasks designed to assess a range of cognitiv e-motor func- tions. The resulting performance data allow for quantitative profiling of de velopmental stages and trajectories. W e apply dimensionality reduction and clustering methods to segment children into dev elopmental profiles and then analyze how these profiles evolv e ov er time. Our goal is not to classify children into diagnostic categories, but rather to uncov er naturally emerging patterns of cognitive growth and change. This approach enables a deeper understanding of de velopmental variability and provides a foundation for scalable, data-dri ven monitoring in early education and pe- diatric research. I I . R E L A T E D W O R K Longitudinal studies examining children’ s interaction with mobile devices hav e traditionally relied on indirect data sources such as parental questionnaires, structured inter- views, and media diaries [5], [6]. While informativ e, these approaches often suf fer from limited frequency of measure- ment and subjecti ve bias. Recent research has begun to incorporate automated data collection methods, offering more granular insights into cognitiv e and motor de velopment. For instance, Radesky et al. [7], [8] and Pedersen et al. [9] lev eraged mobile interaction logs and embedded game-based assessments to ev aluate executi ve functions and cognitive abilities in early childhood. These ef forts demonstrate the potential of touch interaction data—such as gesture accuracy , timing, and error rates—as proxies for neuropsychological metrics. Further advancements include the use of multimodal sen- sor data from tablets and wearable devices, enabling fine- grained analysis of pressure, movement, and physiological states during interaction [10], [11]. Such approaches facilitate a more holistic understanding of child–de vice engagement and support the de velopment of adaptiv e educational tech- nologies. Howe ver , most existing datasets cover limited age ranges or of fer sparse temporal resolution. In contrast, this work builds upon the dense, automated, and sensor-based lon- gitudinal ChildCIdb dataset [4] covering children from 18 months to 8 years of age, with repeated measurements across multiple academic years. I I I . M E T H O D S A. Dataset The dataset consists of longitudinal interaction data col- lected from children between the ages of 18 months and 8 years old, enrolled in an early education program at J. C. Ruiz-Garcia et al.: Longitudinal Analysis and Quantitative Assessment of Child Development FIGURE 1. Graphical representation of the different int er faces designed in ChildCIdbLong, which comprises 6 different data acquisitions from January 2 02 0 to October 2 02 2. T wo main acquisition blocks are considered: i) touch, and ii) stylus. their children’ s e xposure to mobile de vices to enhance their de v elopment through educational digital acti vities and potential bonding through joint use [5] . Ho we v er , parent- reported duration of mobile de vice use in young children has been found to hav e lo w accurac y , highlighting the need for objecti v e measures in future research [6] . In addition, parents tend to let their children use mobile de vices in man y situations, such as before going to sleep, after home w ork, or to k eep them calm in public places, among man y others [1] . Despite this massi v e interaction of children with mobile de vices, further research is needed to better understand the impact of mobile de vice use on young children’ s learning and de v elopment. In this re g ard, Herodotou analysed in [7] a total of 19 studies that reported learning and de v elopment ef fects on children aged 2 to 5 years old. Most studies reported positi v e ef fects on mathematics, problem-solving, literac y de v elopment, and self-learning [8] . Ho we v er , more longitudinal studies are needed to analyse the e v olution of other aspects of children, such as their correct motor and cogniti v e de v elopment [9] . The present article aims to adv ance in the Child-Computer Interaction (CCI) research line by proposing a quantitati v e metric able to automatically measure the motor and cogniti v e de v elopment of children through their interaction with the dif ferent tests presented in our unique ChildCIdbLong database. In particular , the main contrib utions of the present article are: • An in-depth analysis of the state of the art in topics related to: i) the interaction of children of dif ferent ages with mobile de vices; ii) the e xisting longitudinal studies and public databases related to children’ s e xposure to mobile de vices and their correct de v elopment; iii) the v ariety of gestures that children can perform with mobile de vices depending on their age; and iv) the most popular tools for measuring the correct motor and cogniti v e de v elopment of children during their gro wth. • The release of a no v el longitudinal database named ChildCIdbLong 1 . As f ar as we kno w , this is the 1 https://github .com/BiD Alab/ChildCIdbLong lar gest publicly av ailable longitudinal database to date for research in this area. ChildCIdbLong comprises o v er 600 children aged 18 months to 8 years old, acquired continuously o v er 4 academic years (2019/20 to 2022/23). As a result, ChildCIdbLong is composed of o v er 12K test acquisitions o v er a tablet de vice, using both touch and stylus interactions. Fig. 1 pro vides a graphical representation of the tests considered in ChildCIdbLong. • The proposal of a quantitati v e metric called T est Quality (Q) to automatically measure the motor and cogniti v e de v elopment of children through their interaction with a tablet de vice o v er time. In order to pro vide a better comprehension of the proposed Q metric, popular percentile-based gro wth figures are introduced for each test, pro viding a tw o-dimensional space to compare children’ s de v elopment with respect to the typical age skills of the population. • A complete e xperimental analysis of the potential of ChildCIdbLong database to measure the motor and cogniti v e de v elopment of children as the y gro w up, di vided into tw o approaches: i) a general analysis, and ii) a longitudinal analysis. The remainder of the article is or g anised as follo ws. Sec. II summarises an o v ervie w of recent studies on children’ s mobile de vice interaction and their proper de v elopment. Sec. III describes all the details of the no v el ChildCIdbLong database. Sec. IV describes the proposed Q metric and ho w to calculate it for each ChildCIdbLong test. In Sec. V , we compute the potential of the Q metric for measuring the correct motor and cogniti v e de v elopment of children o v er time. Finally , Sec. VI presents the conclusions and future research. II. RELATED WORKS A. C H I LD- COM PUTE R I NTE R A CTION (CC I) In recent years, se v eral studies hav e analysed the interaction of children with dif ferent mobile de vices and interaction tools (e.g., fingers, k e yboard, v oice, and pen stylus). In the present article, we focus on studies on w orks in which VOLUME 12, 2024 117437 Fig. 1. Overview of the longitudinal data collection and processing pipeline used in the study . T ABLE I R E LAT IO N S HI P B E TW E E N E D U CAT IO NA L L E VE L S ( C O U RS E S ) A N D A GE R A NG E S . Educational Level Age Range Course 2 18 Months - 2 Y ears Course 3 2-3 Y ears Course 4 3-4 Y ears Course 5 4-5 Y ears Course 6 5-6 Y ears Course 7 6-7 Y ears Course 8 7-8 Y ears the school Las Suertes in Madrid, Spain. Each participant interacted with a tablet device during annual cognitive-motor assessment sessions spanning up to five academic years. The tests were conducted in a controlled setting using the same device model (Samsung Galaxy T ab A 10.1) and standard- ized instructions to ensure consistency across sessions. The cohort represents a general population of students from a regular education center , with no prior exclusion criteria based on neuro-developmental diagnoses, thus capturing the natural variability of cognitiv e-motor growth in a school setting. The database comprises structured interaction data from ov er 940 children aged between 18 months and 8 years, grouped into sev en educational lev els (Groups 2 to 8) in alignment with the Spanish education system, as sho wn in table I. As shown in Figure 1, each child completed six digital tasks from the ChildCIdb database [4] designed to assess motor and cognitiv e abilities. Interaction data were automat- ically logged and conv erted into quantitative performance metrics, including time-to-completion, gesture accuracy , and error rates, which were used to compute normalized scores for each test (Q1–Q6). Each academic year is treated as a distinct time point, and data are available for varying numbers of sessions per child. B. Data Pr eparation The performance was scored using the formulas estab- lished by Ruiz-Garcia et al. [1]. [1]. These formulas compute a Q score between 0 and 100 for each test, where 100 represents optimal performance. Each formula uses different task-specific features—such as reaction time, precision, or cov erage—depending on the nature of the interaction. The resulting Q1–Q6 scores form the input features used for clustering and longitudinal analysis. C. Dimensionality Reduction and Clustering T o visualize and cluster the data, a two-step approach was applied: 1) t-SNE (t-distributed stochastic neighbor embed- ding) was used to reduce the six-dimensional test score vector to two dimensions while preserving local structure. This facilitated interpretation and cluster separation. 2) K-Means++ clustering was then applied on the t-SNE embeddings to partition participants into cognitive pro- files for each academic year . The optimal number of clusters was determined using the elbow method. Clusters were interpreted as representing low , medium, and high lev els of performance, based on their av erage test scores across dimensions. Because t-SNE prioritizes local neighborhood preservation rather than global distance fidelity , the resulting clusters are interpreted as descriptiv e groupings of relativ e performance within each cohort, rather than strict metric partitions of the original feature space. D. Longitudinal Analysis Cognitiv e progression was studied by tracking how each participant transitioned between clusters across consecuti ve academic years. T ransition matrices were computed to cap- ture movement between performance lev els (e.g., from lo w to medium cluster). These matrices were used to characterize dev elopmental trajectories, including stable gro wth, improv e- ment, stagnation, or decline. This cluster-based tracking approach enables us to model heterogeneous cogniti ve de velopment paths without requiring predefined outcome labels, making it suitable for early-stage screening and monitoring. • Q1 – T ap and Reaction Time: T apping moving targets to measure reaction time, precision, and attention. • Q2 – Drag and Drop: Dragging objects to targets, ev aluating hand-eye coordination, movement control, and goal-directed planning. • Q3 – Zoom In: Enlarging an image with a two- finger gesture to fit a boundary , assessing bimanual coordination and force modulation. • Q4 – Zoom Out: Reducing an image using a pinch gesture, ev aluating similar motor and perceptual skills. • Q5 – Spiral T est: T racing a spiral with a stylus within boundaries to measure precision, stability , and fine motor control. • Q6 – Drawing T est: Coloring a figure within a time limit to reflect attention, spatial aw areness, planning, and motor coordination. I V . C O G N I T I V E P R O FI L E S P E R C L U S T E R T o better understand the underlying behavioral profiles of the participants, a clustering analysis was performed separately for each academic year . The clustering was based on the normalized scores obtained in the six tablet-based cognitiv e-motor tasks (Q1–Q6), allowing us to identify dis- tinct patterns of performance within each cohort. The number of clusters for each academic year was determined using the elbo w method, which identifies the most appropriate number of clusters by analyzing the within- cluster variance. For students in courses 3 through 7, three clusters were found to best capture the variability in perfor- mance. In contrast, for courses 2 and 8, two clusters were sufficient. This pattern likely reflects the dev elopmental and skill-related characteristics of the cohorts: course 2 students show more homogeneous performance due to limited expe- rience and foundational skills, whereas course 8 students are generally more uniformly proficient. As an illustrative example, Figure 2 shows a 2D projection of the clustering results for Course 4. This visualization was generated using dimensionality reduction (t-SNE) to plot the distribution of participants across clusters in a reduced feature space. Follo wing this example, T able II shows the average scores obtained by children in each cluster across all six tasks (Q1–Q6), for every academic year from Course 2 to Course 8. The percentage column indicates the proportion of partic- ipants in each cluster within a gi ven course. A. Cluster Interpr etation and Cognitive Pr ofiles Each cluster represents a distinct cogniti ve profile that reflects the v ariability in children’ s cogniti ve-motor abil- ities. These profiles provide valuable insights into their dev elopmental stages and can help in tailoring educational interventions to better address their specific needs. • Cluster 0 – Low performance: Children in this cluster exhibit the lowest a verage scores across all six tasks. Their cognitive-motor profiles suggest difficulties in motor coordination, slo wer reaction times, and a lower ability to perform more complex gestures such as zoom- ing, drawing, or multitouch tasks. These children tend to struggle with tasks that require fine motor control or rapid responses. This profile might indicate that the children are in the early stages of cognitive-motor dev elopment, where foundational skills are still being established. The overall lo w performance across all tasks suggests that these children may benefit from fo- cused interventions that tar get basic motor and cognitiv e skills, helping them to improve coordination, reaction times, and task engagement. • Cluster 1 – Medium performance: Children in this group show moderate scores, reflecting emerg- ing cogniti ve-motor abilities. They perform better than those in Cluster 0 but still face challenges, partic- ularly with tasks that require precise motor control, like multitouch gestures. These children demonstrate a developing ability to complete simpler tasks with greater ease, but they may struggle when tasks become more complex or require more adv anced coordination. The medium performance suggests that these children are in a transitional phase, where their cognitive and motor skills are dev eloping but may need additional support to handle increasingly dif ficult tasks. This group represents children who show promise but may require more focused attention to fully dev elop their cognitiv e- motor capabilities. • Cluster 2 – High performance: This cluster consists of children with the highest scores across all tasks, indicat- ing strong cognitive-motor abilities. These children are able to complete all six tasks with speed, accuracy , and confidence. Their high performance reflects advanced cognitiv e processing, rapid reaction times, and well- coordinated motor skills. These children excel at tasks requiring complex motor control, such as multitouch gestures, and demonstrate a strong understanding of task demands. This profile indicates that these children hav e reached an advanced stage in their cognitiv e-motor dev elopment, showing strong abilities in both simple and complex tasks. Their high scores suggest they are capable of handling more challenging cognitive and motor tasks, which makes them ideal candidates for enrichment programs aimed at further de veloping their skills. These cognitive profiles are crucial for understanding the individual differences in children’ s cognitive-motor dev elop- ment. Identifying these profiles allows for a more targeted approach to education, where children can be provided with the appropriate lev el of challenge and support based on their specific needs. By recognizing the unique characteristics of 20 15 10 5 0 5 10 15 t-SNE Component 1 10 5 0 5 10 15 t-SNE Component 2 Cluster 2 (n=103) Cluster 1 (n=89) Cluster 0 (n=67) t-SNE V isualization of K -Means++ Clusters Cluster 0 1 2 Fig. 2. t-SNE projection of K-Means++ clustering results for Course 4 based on the six cognitive-motor task scores. T ABLE II A VE R AG E Q S C O RE S P ER C L U ST E R A N D C O U R SE . T H E P E RC E N T AG E C O LU M N I N D I CATE S T H E D I ST R I BU T I O N O F S A M PL E S I N E AC H C L U S TE R . Cluster Q1 Q2 Q3 Q4 Q5 Q6 % Course 0 2.39 6.26 0.03 2.34 17.04 29.44 67.31 02 1 52.99 5.07 0.00 3.81 16.51 20.42 32.69 02 0 2.82 5.86 0.50 2.00 16.34 28.04 40.80 03 1 60.60 14.64 4.68 11.88 23.36 36.78 59.20 03 0 2.49 7.37 0.33 2.84 17.96 29.66 25.36 04 1 63.20 15.77 1.21 8.86 26.43 42.90 40.71 04 2 74.33 52.65 23.25 44.33 63.27 78.00 33.93 04 0 4.93 8.35 0.43 3.17 17.41 30.94 20.30 05 1 69.92 34.46 6.20 20.97 31.24 58.25 38.01 05 2 80.62 64.87 32.68 47.05 71.94 84.97 41.70 05 0 53.03 18.98 3.23 13.79 22.72 35.64 21.62 06 1 74.20 74.86 17.29 28.41 58.64 89.13 38.61 06 2 86.26 62.97 42.43 56.83 77.18 88.21 39.77 06 0 73.90 42.02 7.16 25.23 43.23 66.43 28.57 07 1 73.15 83.89 30.77 37.76 43.77 89.15 27.62 07 2 86.23 69.84 38.19 50.13 86.44 90.97 43.81 07 0 85.13 60.09 25.69 30.11 62.34 86.77 58.93 08 1 78.41 88.39 31.53 52.10 77.35 91.77 41.07 08 each cluster , educators can adapt their teaching strategies to foster better outcomes for all children, regardless of their dev elopmental stage. B. Condensed Analysis of Cluster T ransitions T o summarize the dynamics of dev elopmental change over time, two tables are presented that capture both the overall transition patterns and the relative stability of each cognitiv e cluster . Overall Cluster T r ansition Summary: T able III categorizes transitions between consecutiv e academic years into three types: Stable , Improving , and Declining . These percentages are based on the number of children who remained in, progressed to, or regressed from their original cluster . W e observe a general trend of high stability , particularly in the early years (Courses 2–4). Declines are more prominent than improvements in most transitions, especially between Courses 4 and 5. This asymmetry highlights the inertia of T ABLE III S U MM A RY O F C LU S T E R M O B IL I T Y AC RO S S C OU R S E T R A NS I T I ON S . P E RC E N T AG E S I N D I CAT E T H E P RO P O RTI O N O F C HI L D R EN W H O SE C L US T E R S TA T US R E MA I N E D S T A B L E , I M P ROV E D , O R D E C LI N E D . Course T ransition Stable (%) Improving (%) Declining (%) Course 2 → 3 94.1 5.9 0.0 Course 3 → 4 85.7 9.4 4.9 Course 4 → 5 78.6 0.0 21.4 Course 5 → 6 73.2 11.0 15.8 Course 6 → 7 69.4 14.3 16.3 Course 7 → 8 82.0 7.0 11.0 T ABLE IV S T A B I LI T Y R ATE S ( %) O F E A CH C L US T E R A CR OS S C OU R S E T R AN S I T IO N S . H I G H P E R CE N TAG E S R E FLE C T C O N S IS T E NT D E VE L O P ME N TAL P RO FI LE S Y E AR - OV E R - Y E A R . Course T ransition Cluster 0 Cluster 1 Cluster 2 Course 2 → 3 100.0 88.0 – Course 3 → 4 92.7 80.1 66.6 Course 4 → 5 94.1 77.4 60.0 Course 5 → 6 91.3 68.2 62.4 Course 6 → 7 89.5 70.4 66.1 Course 7 → 8 68.5 95.1 – cognitiv e profiles once established. Cluster-Specific Stability Rates: T o further understand which cognitive profiles are most stable over time: T able IV shows the proportion of children who remained in the same cluster from one year to the next, disaggreg ated by initial cluster . These results clearly show that: • Cluster 0 (low perf ormance) is the most stable group across all years, often exceeding 90% retention. • Cluster 1 exhibits moderate stability , b ut shows both upward and downward transitions. • Cluster 2 (high performance) is the least stable group, with more children transitioning to lower clusters ov er time, particularly between Courses 4 and 6. V . C O N C L U S I O N A. Conclusion of Results Our analysis rev ealed important insights into the cognitiv e dev elopment of young children, particularly in terms of the stability and ev olution of their dev elopmental profiles. A key finding is the high stability observed in the low-performance cluster (Cluster 0), especially during the early academic years. The near 100% stability from Course 2 to Course 3 and consistent high stability throughout subsequent transitions indicate that children in this group tend to maintain a rela- tiv ely low level of performance over time. This finding has significant implications for early educational practices, as it suggests that children with low cognitive-motor performance at an early age may require more sustained and targeted interventions. The high stability within this cluster implies that, without early intervention, children may continue to struggle with foundational cognitive skills, which could impact their long-term academic success. Con versely , the medium (Cluster 1) and high-performance (Cluster 2) clusters exhibit notable fluctuations, with a mix of stable, improving, and declining trajectories across the academic years. This suggests that while many children in these clusters demonstrate continuous growth, a subset may experience periods of stagnation or regression. These variations highlight the importance of personalized and adap- tiv e educational strategies that cater to the div erse needs of children. By closely monitoring these transitions, educators and clinicians can identify children who may benefit from additional support or enrichment, ensuring that they remain on track for optimal cogniti ve dev elopment. Additionally , the observed transition patterns between clusters underscore the heterogeneity of early cognitive de- velopment. While most children remain in their original cluster , some move between performance levels, indicating that cognitiv e growth is not a linear process. These findings further support the idea that personalized monitoring and interventions are crucial, as a one-size-fits-all approach may not be suitable for all children. Regarding the transitions observed in high-performance clusters, the moderate decline in stability—particularly be- tween Courses 4 and 6—does not necessarily imply a re- gression in neurodevelopmental capabilities. Instead, these fluctuations likely reflect the influence of non-cognitive factors, such as varying lev els of task engagement or a ceiling effect in the metrics as children mature. This contrast further emphasizes the clinical relev ance of Cluster 0, where the high persistence of low performance suggests a more stable dev elopmental phenotype that may require prioritized screening and intervention B. Futur e Researc h Future research could expand upon our findings by in- corporating other dimensions of child dev elopment, such as social and emotional growth, to better understand the factors influencing cognitiv e trajectories. Exploring ho w children’ s interactions with peers or caregi vers af fect their cognitiv e development could provide a more holistic view . Additionally , integrating more diverse data types, such as behavioral assessments or neuroimaging data, could offer deeper insights into the underlying mechanisms dri ving the observed dev elopmental patterns. Another interesting direction for future work is to examine the impact of specific interventions on the cognitiv e progres- sion of children, particularly those in the lo w-performance clusters. Understanding which educational or clinical inter - ventions are most effecti ve at improving performance in these children could inform the dev elopment of targeted strategies for early intervention. It would also be v aluable to in vestigate whether certain types of interventions lead to changes in the stability of cogniti ve profiles or facilitate transitions from lo w to medium or high-performance clusters. Moreov er , given the high stability observed in the low- performance cluster , future research could explore the ef- fectiv eness of adaptiv e and personalized educational tools. These tools could adjust the complexity of tasks or pro- vide scaf folding based on the individual child’ s cogniti ve progress, potentially improving engagement and outcomes for children who might otherwise fall behind. Finally , extending this study to include a lar ger and more div erse sample of children across dif ferent cultural and socio- economic backgrounds would help determine whether the observed trends are generalizable. In vestigating ho w context- specific factors influence cognitive dev elopment could en- hance the applicability of this approach in real-world set- tings, such as schools or clinics, and ensure that early intervention strategies are tailored to the needs of various populations. AC K N OW L E D G M E N T This project has been supported by PowerAI+ (SI4/PJI/2024- 00062 Comunidad de Madrid and U AM), C ´ atedra ENIA U AM-V eridas en IA Responsable (NextGenerationEU PR TR TSI-100927-2023-2), and TR UST -ID (PID2025-173396OB-I00 MICIU/AEI and the EU). Also, we acknowledge the computer resources provided by Centro de Computaci ´ on Cient ´ ıfica-Univ ersidad Aut ´ onoma de Madrid (CCC-U AM). R E F E R E N C E S [1] J. C. Ruiz-Garcia, R. T olosana, R. V era-Rodriguez, A. Morales, J. Fierrez, J. Ortega-Garcia, and J. Herreros-Rodriguez, “Longitudinal Analysis and Quantitativ e Assessment of Child Development through Mobile Interaction, ” IEEE Access , vol. 12, pp. 116245–116260, 2024. doi: 10.1109/A CCESS.2024.3446455 [2] J. C. Ruiz-Garcia, R. T olosana, R. V era-Rodriguez, J. Fierrez, and J. Herreros-Rodriguez, “ChildCI Framework: Analysis of Motor and Cognitiv e Dev elopment in Children–Computer Interaction for Age Detection, ” Cognit. Syst. Res. , vol. 86, pp. 101230, 2024. doi: 10.1016/j.cogsys.2024.101230 [3] J. C. Ruiz-Garcia, C. Hojas, R. T olosana, R. V era-Rodriguez, A. Morales, J. Fierrez, J. Ortega-Garcia, and J. Herreros-Rodriguez, “Children Age Group Detection based on Human–Computer Inter- action and Time Series Analysis, ” Int. J. Doc. Anal. Recognit. , vol. 27, pp. 125–138, 2024. doi: 10.1007/s10032-024-00462-1 [4] R. T olosana, J. C. Ruiz-Garcia, R. V era-Rodriguez, J. Herreros- Rodriguez, S. Romero-T apiador , A. Morales, and J. Fierrez, “Child– Computer Interaction with Mobile Devices: Recent W orks, New Dataset, and Age Detection, ” IEEE T r ans. Emerg . T opics Comput. , v ol. 10, no. 4, pp. 1653–1665, 2022. doi: 10.1109/TETC.2022.3150836 [5] G. McHarg, A. D. Ribner, R. T . Devine, and C. Hughes, “Screen T ime and Executiv e Function in T oddlerhood: A Longitudinal Study , ” F r ont. Psychol. , vol. 11, p. 570392, 2020. doi: 10.3389/fpsyg.2020.570392 [6] E. A. V ande water , V . J. Rideout, E. A. W artella, X. Huang, J. H. Lee, and M. S. Shim, “Digital childhood: electronic media and technology use among infants, toddlers, and preschoolers, ” P ediatrics , vol. 119, no. 5, pp. e1006–e1015, 2007. doi: 10.1542/peds.2006-1804 [7] J. S. Radesky , H. M. W eeks, R. Ball, A. Schaller, S. Y eo, J. Durnez, M. T amayo-Rios, M. Epstein, H. Kirkorian, S. Coyne, and R. Barr, “Y oung Children’ s Use of Smartphones and T ablets, ” P ediatrics , vol. 146, no. 1, p. e20193518, 2020. doi: 10.1542/peds.2019-3518 [8] J. S. Radesky , N. Kaciroti, H. M. W eeks, A. Schaller , and A. L. Miller , “Longitudinal Associations Between Use of Mobile Devices for Calming and Emotional Reactivity and Executiv e Functioning in Children Aged 3 to 5 Y ears, ” JAMA P ediatr . , vol. 177, no. 1, pp. 62–70, 2023. doi: 10.1001/jamapediatrics.2022.4793 [9] M. K. Pedersen et al. , “Measuring Cognitiv e Abilities in the W ild: V alidating a Population-Scale Game-Based Cogniti ve Assessment, ” Cognit. Sci. , vol. 47, no. 6, p. e13308, 2023. doi: 10.1111/cogs.13308 [10] T . Baltrusaitis, C. Ahuja, and L. P . Morency , “Multimodal Ma- chine Learning: A Survey and T axonomy , ” IEEE Tr ans. P attern Anal. Mach. Intell. , vol. 41, no. 2, pp. 423–443, 2019. doi: 10.1109/TP AMI.2018.2798607 [11] S. Suneesh, “Multimodal Explainability in Child-Robot Interaction, ” in Pr oc. 24th Interact. Des. Child. (IDC) , 2025, pp. 1199–1202. doi: 10.1145/3713043.3731609.
Original Paper
Loading high-quality paper...
Comments & Academic Discussion
Loading comments...
Leave a Comment