Tiny-ViT: A Compact Vision Transformer for Efficient and Explainable Potato Leaf Disease Classification
Early and precise identification of plant diseases, especially in potato crops is important to ensure the health of the crops and ensure the maximum yield . Potato leaf diseases, such as Early Blight and Late Blight, pose significant challenges to fa…
Authors: Shakil Mia, Umme Habiba, Urmi Akter
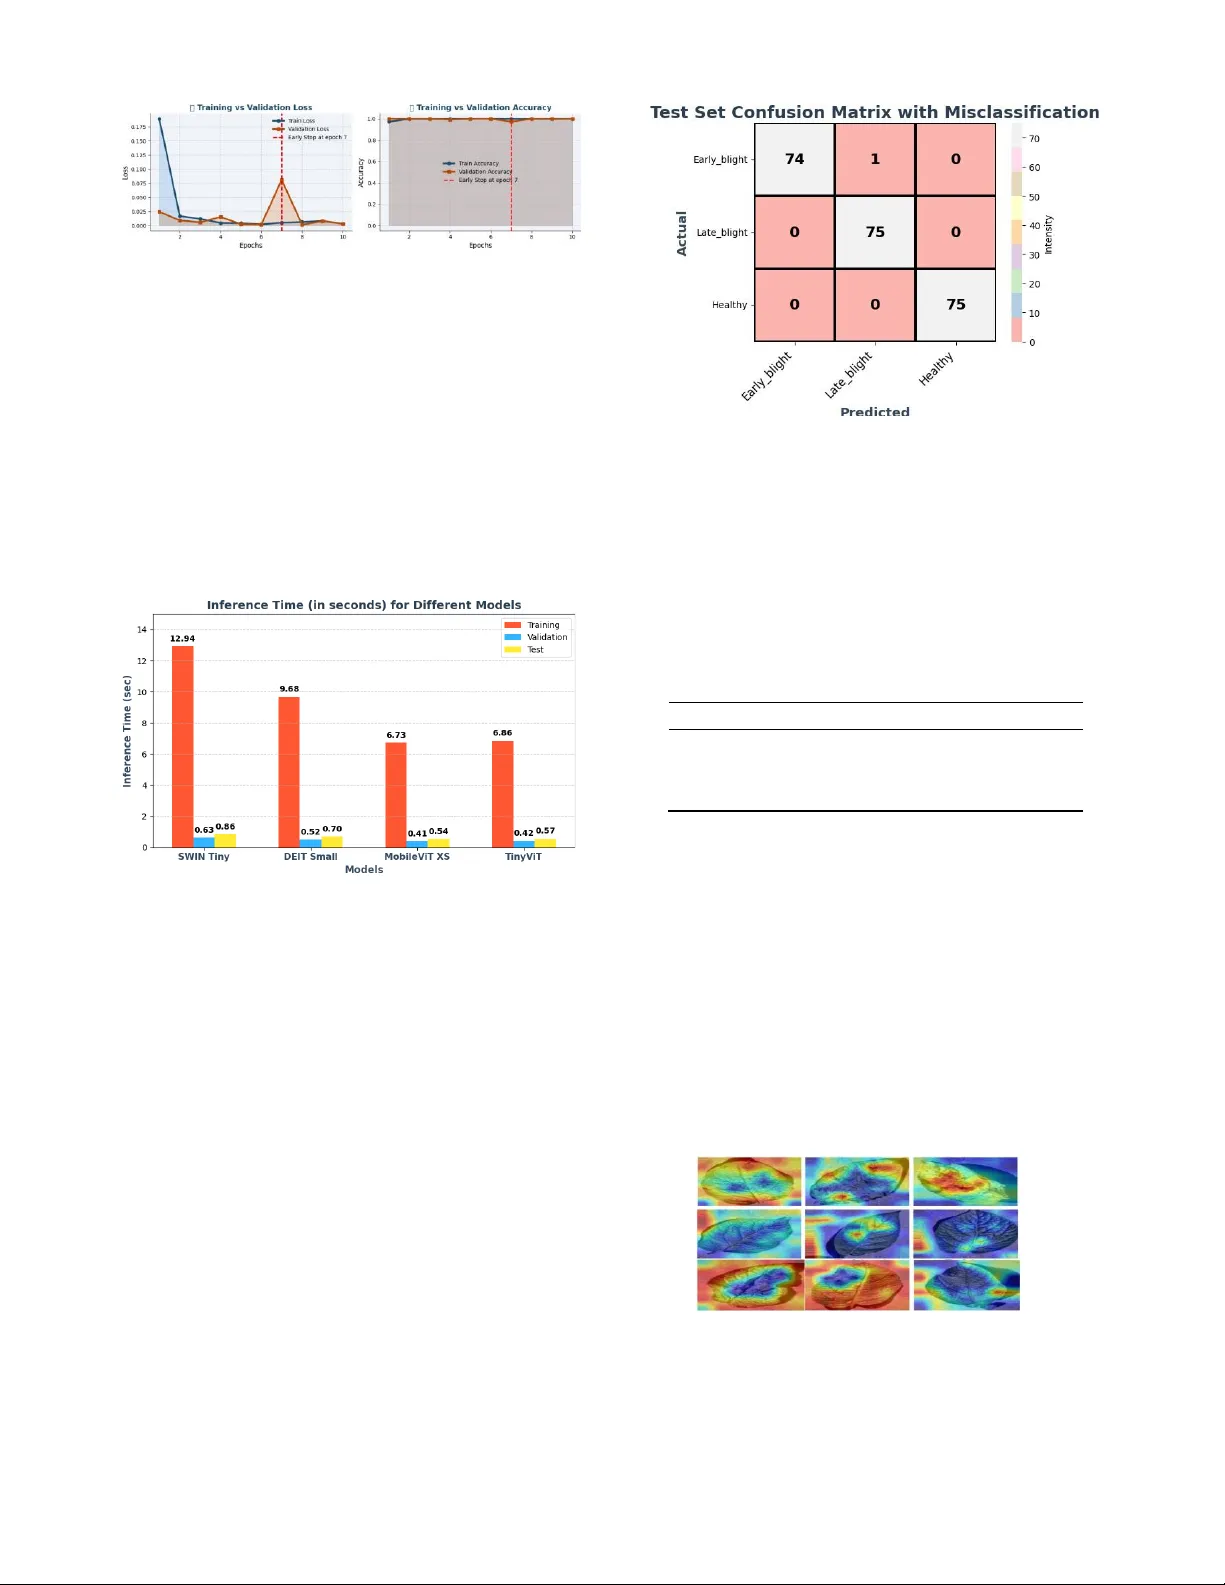
2026 IEEE International Conference on Electrica l, Computer Tele communication Engineering (ICECTE 2 026) 29 – 31 January 2026, Rajshahi-6204, Bangladesh Tiny-ViT: A C ompact Vision Transform er for Efficient a nd Explainable Pot ato Leaf Disea se Classification Shakil Mi a Dept. of C S E Daffodil I nternational University Dhaka, Banglade sh sha k ilm ia9 092 3@gm ai l. com Umme Hab ib a Dept. of E E E American International University- Bangladesh (AI UB) Dhaka, Bang lades h habibamahin61@gmail .com Urmi Akt er Dept. of E E E American International University- Bangladesh (A I UB ) Dhaka, Bang lad esh urmiakter6686@gmail .com SK Rezwana Quadir Rai sa Dept. of H ort ic ul tur e Sher-e-Bangla Agric ultural Univ ersity Dhaka, Banglades h skrezwanaquadir20@g mail.co m Jeba Mal ih a Dept. of C S E Ahsanullah University of Science and Technology (A US T) Dhaka, Bang lades h malihajebasqa@gmail .com Md. Iqbal Hoss ain Dept. of CSE Uttara Universi ty Dhaka, Ban glades h iqbal.cse4.bu@gmail .com Md. Shakhauat Hossan S um on* Dept. of ECE North South University Dhaka, Bang lades h sumon.eee.cse@gmail .com Abstract — Early and pr ecise identif ication of plant diseases , especially in potato crops is important to ensure the health of the crops a nd ensur e the maximu m yield. Potat o l eaf diseas es, such as Early Blight and Late Blight, pose significant ch allenges to farmers, oft en resulting in yield losses and increased pesticide us e. Tradition al methods of detection are not o nly time-consuming, but a re al so subject to human error, which is why automated and efficient methods are required. The paper introduces a new method of potato leaf disease classification Tiny -ViT mo del, which is a small a nd effective Vision Transformer (ViT) deve loped to be used in resource-limited systems. The model is tested on a dataset of three classes, namely Early Blight, Late Blight, and Hea lthy leaves, and th e preprocessing procedur es include resizing, CLAHE, and Gaussian blur to improve the qu ality of the image. Tiny -ViT model has an impressive test accuracy of 99.85% and a mean CV accuracy of 99.82% which is better than bas eline mo dels such as DEIT Small, SWIN Tiny, and MobileViT XS. In addition to this, the model has a Matthews Correlation Coefficient (MC C) o f 0.99 90 and narrow conf i dence int e rvals (C I) of [0.9980, 0.9995], which indicates high reliability and genera lization. The training and testing inference time is competitive, a nd the model exhibits low c omputationa l e xpenses, thereby, making it applicable in real-time applications. Moreover, interpret ability of the model is improved w ith the help o f GRAD-CAM, which identifies diseased a reas. Altogether , the proposed Tiny- ViT is a so lution wit h a high leve l of robust ness, efficien cy , and explainabi lity to the p roblem of plant d isease class ification. Index Terms — Tin y-ViT, Plant D i sease Cl assification, P otato Leaf Diseases, Vision Transformer ( ViT), Expl ainable AI (XA I). I. I NT ROD UC TION The overall development of d eep learning technologies has been rapidly changing different industries, and the agric ultural sphere is not an exception. Specifically, auto mated plant disease d etection is now a major research direction and may provide a solution to early disease detection and minimize the use of th e traditional methods that are labor-intensive [1], [2]. Potato leaf diseases like Early Blight and Late Blight have b een a thre at to potato farmers whereby they experience serious losses in their yields [3]. These diseases can be prevented prior to spreading and reduce the damage to crops when detected in a timely and correct manner, ho wever, th e problem with the machine lea rning technique is t hat it is still tough to d o it with an extremely high d egree of accuracy. Although, the deep learning methods of plant disease classification have ad vanced, most models have constraints that limit the aspect of implementation in practical agricultural applications. Generalization is commonly n ot present in current models b ecause of the lack of cross -validation and small controlled datas ets [4], [5]. M oreover, numerous sta te- of -the- art models are b lack boxes, which provide l ittle informati on about the decision-making process, and it is hard to rely on their predictions. Lastly, these models are costly to compute a nd therefore cannot be impleme nted in resource-limited systems, including those in the field. The p roposed work seeks to fill these g aps by suggesting a modified form of Tiny-ViT arc hitecture, wh ich strikes a balance between the high performance and low computation cost. We also add explainability into the model by ap plying Grad-CAM, which is a popular method when it comes to visualizing which parts o f the image the model is th e most influenced by. With such improvements, we aim at developing a model that is not only precise and effective but also readable and generalizable. We base our strategy on the fact that models that are both effecti ve on varied datasets and computationally efficient and understanda ble are needed. We suggest an architecture that uses the advantage of Vision Transformers (ViT) but is adjusted to the needs of po tato leaf disease classification . With th ese improvements, our model provides a p otential a nswer to the issue of real-world implementation in the field of agriculture. This study makes several important cont ri bu tio ns: 1) We p ropose a customized version of th e Tiny -ViT model, which is optimized for potato leaf disease classificatio n, offerin g high accuracy while maintaining low computational cost. 2) We introduce a comprehensive evaluation framework that includes multiple metrics such as accuracy, cross-validation scores, and Matthews Correlation Coefficient (MCC), en suring robust performance across different datasets and conditions. 3) The model in corporates E xplainable AI (XAI) through G rad- CAM visualization, enhancing model transparency and p rovid - ing valuable insights into the features that drive predictions. 4) We demonstrate t he real-world applicability of o ur model by validating it using cross-validation and on au gmented datasets, showing its ability to generalize beyond controlled data. 5) The model’s efficiency is underscored by its low computational cost, making it suitable for deployment on resource-constrained devices in real-time agricultural applications. The p aper is structured in the fo llowing mann er: Section 2 will review th e literature on plant disease classificatio n, i ncluding s ome of the current challenges. The methodology is provided in Section 3, with the experimental results discussed in Section 4, and finally, conclusions and future work in Section 5. II. L IT ER AT UR E R EVIE W In this part, we d iscuss the past research on plant d isease classification, both in terms of me thodologies and the challenges associated with them. Although considerable advances have bee n achieved, constraints such as overfitting, non -interpretability, and excessive computational power still exist in existing models. Tambe et al. [6] introduce a CNN to c lassify Early Bl ight, Late Blight, and Healthy leaves with 99.1% test accuracy Even though it is good at separating se vere in fections, it is not cross-validated and interpretable, which raises overfitting c oncerns. Computational price is average, but there is a lack of efficiency a nalysis. Thus, even though the re sults are encouraging, additional confirmation of the work on external data is required to guarantee generalization. Alhammad et al. [7] use VGG16 in transfe r learning with Grad-CAM, achieving 98%test accuracy. Even though Grad-CAM is interpretable, the pre-trained network is hefty and the use of one dataset restricts the extrapolation. No cross- validation is described which is indicative of overfitting. Also, the process is computationally heavy and takes 50 e p ochs. Therefore, it is not a g ood method that might be applicable to the re al world. Dame et al. [8] suggest an e nhanced CNN to disease and se verity classificatio n to 99% a n d 96% accuracy, respectively. Neverth eless, the datas et is small and region -specific, an d there is no cross-validation that can result in o verfitting. Fu rtherm ore, there is no explainabilit y and confusion arises between the levels of moderate severity. The model is not efficient in bench marking its c omputations. In turn, though it performs well, it is not yet clear how widely it can be used. In their study, Sinamenye et al. [9] develop an EfficientNetV2B3ViT model based on a hybrid approach, and it can p roduce an accuracy of $85.06% ona real-world image. The CNN is less efficient at capturi ng global features, whereas ViT models fewer local features, which enhances the fusion of features. Ho wever, there are no cross- validation and explainability and the architecture is computationally costly. False identifications of Pest and Fungi are seen, and the generalization of data sets is n ot tested. Thus, the method enhances free image performance, but it is complicated an d resourcedemanding. Arshad et al. [10] create PLDPNet, which uses U-Net segmentation , feature fusion, an d a multi -head Vision Transformer, with 98.66% accuracy. Segmentation concentrates on leaf areas, which improve learning, but without cross-validation and XAI. The pipeline is b oth com p utationally cumbersome and very complex. As it is being tested on clean images of PlantVillage, it is still unclear ho w robu st in the real wo rld the results will be and th ere is stil l th e issue of overfitting, which constrains its use in practice. Jllasi et al. [11] also fine-tune MobileNetV2 using data reweighting and augmentation to achieve an accuracy of 98.6% and G rad-CAM interpretability. The lightweight network minimize s the cost of computation. Nonetheless, th ere is no cross-validation, and the testing is done on a curated dataset, and explanations of decisions rely on qualitative XAI only parti ally. There are still issues with overfitting and generalization, especially on real -world images. Thus, it is efficient and easily interpret able, but its scope of application is questionable. Kumari et al. [12] op timize CNNs on a mixed dataset; in this case, a shallow CNN mod el has 98.8% accuracy. The small number of parame ters permits rapid inference, but the small size of the dataset and not reported overfitting to cross- validation indicate the risk of overfitting. It does not deal wit h explainability, and three classes are tak en in to account. The method is, therefore, computationally powe rful and accurate, although real- world accuracy is small. Jain et al. [13] produce a Bayesian-optim ized set of CNNs with fuzzy p reprocessing, with 97.94 percent accuracy. Ensemble diversity minimizes the risk of overfitting, though there is no explainability or even externa l validation. Bayesian optimization is computationally intense to train a numb er of CNNs. Therefore, inasmuch as t here is h igh perf ormance, practical de ployment a nd interpretability is constrained and generalization is not certain. S anga et al. [14] propose EfficientNet -LITE that uses chan nel attention and KE -SVM with which they reach an accuracy of 99.54 per cent on lab images and 87.82 per cent on field data (10.3389/fpls.2025.1499909). Lightweight architecture has ameliorated calculati on, though cross- validation is absent, and there is no XAI. An acc uracy drop means that it is ov erfitting to the controlled data. As a result, th e strategy is effective and works well under lab conditions, but not strong under real-life conditions. According to Dey et al. [15], an improved CNN is used to detect potato leaf disease and the accuracy is reported to be 92-93%. I nformation o n techniques and d ata is scarce. Pro bably, it is evaluated based o n one dataset, an d no XAI or cross -validation is employed, which means that it can overfit. The modern CNN layers can result in h igh model efficiency, but it is not clear how robust they are. As a result, the strategy p roposes the op timization of CNN, which should be validated further. 1) Summary of Gaps: The studies reviewed have a high level of accuracy in the classification of potato leaf disease, altho ugh a majority of them do not have cross-valid ation and external data analysis, which can lead to o verfitting and generalization. Such explainability techniques as Grad-CAM or XAI are not applied uniformly, which restricts the interpretability of model d ecisions. Also, some of them are computationally expensive or b enchmarked on curated datasets, wh ich decreases their practicality and re lia bilit y. III. M E THO DOLOG Y In this section, we outline the method used for detecting potato leaf diseases. The overa ll workflow of the proposed approach is illustrated in Figure 1, wh ich includes the key steps from data acquisition to the final disease classification. Fig. 1. Over all Workflow of the Potato Leaf Disease Detection Methodol ogy. The figure illustrates the process from data acquisition and preprocessin g to dataset splittin g, augmentati on, model train ing, and evalu ation. A. Acquisition of Da ta The data u tilized in this re search was ob tained in Kaggle, an d it involves images obtained in c ontrolled conditions [16]. There are 1,500 image files in the dataset; it comprises three different classes of Early Bli ght, Late Bli ght, and Healthy plants. There a re 500 images in each o f th e classes, adding up to 1,500 images. The aim o f collecting these images was to determine common plant diseases and h ealthy plants in agricultural habitats. The following table I provides a detailed description of each class, along with example visualizations: TA BLE I D ESCRIPTION OF C LASSES IN THE D ATASET WITH S AMPLE I MAGE S Cla ss De scr ip ti on Sample Ima ge Ear ly Blig ht Images of plants infected with early blight disease, characterized by dark spots on the leaves. La te Blig ht Images o f plants infected with late blight disease, showing lesions and a fuzzy appearan ce on leaves. Fig. 2. Visualization of Dataset Spl itting. The dataset is d ivided into 75% for training, 10% for validation, and 15% for testing, ensuring an appropriate distribution for model trainin g and evaluati on. Healthy Images of plants without any signs of di seas e, exhibiting healthy leaves and no v isible damag e. B. Preprocessing and Feature E nh an ce me nt The images were prepro cessed through v arious p rocedures to improve their qu ality and appropriateness in model training. First, the images were made standard ized by reducin g their size to the sa me size. Adaptive Histogram Equalization (CLAHE) was applied next to enh ance the image contrast and thus highlight promin ent features at the lowest noise re duction. The images we re smoothed wit h a Gaussian blu r, which minimized n oise and gave the mod els priority on the important structures. Last ly, th e p ixel values were scaled to an interval [0, 1], which ensures that the pixel v alues are similarly scaled throughout the dataset. C. Dataset Sp litting and Training Set Augm entati on The dataset was sp lit into three parts: training, vali dation, and testing, according to 75%, 10%, and 15%. In p articular, 75% of the entire d ataset was assigned to th e training set to enable the model to be trained on a wi d e v ariety of samples. T he v alidation set was set aside 10% percent of the data, and it was used to fine-tune th e hyperparameters and to track the p erformance of the model throughout training. The remaining 15% was reserved as the test set that is an independent mea sure of the overall generalization ability of the model o nce it is trained. The statistics of images in these sub sets are illustrated in Figure 2. Following the split, image augmentations were applie d to the training set to enhance mo del generalization. The applied augmentations included random fli pping, random rotation, random zoom, and random brightness adjustments. These transformations were appl ied to each image, generating three augmented versions per original image, result ing in 1,500 images per class in the training set. D. Baseline Cla ss if ie rs In the case of the baseline classification task, several effective models have been chosen to compare th eir performance in the classification of potato leaf diseases. The models are as follows: • TinyViT 5M: A miniaturized version of the Vision Transformer (ViT) with 5 million parameters, designed to achieve a balance between performance and computational efficiency. • MobileViT XS: A model optimized for mobile and edge de - vices, built to b e li ghtweight and ensure a short inference time, although at the cost of slightly reduced accuracy. • Tiny ViT (Patch16 224): A small ViT model, created through data-efficient mechanisms to optimize the efficiency of self- attention with reduced parameters, u sing 16x16 patches and 224x224 input size. • Swin Transformer Tiny (Patch4 Window7 224): A hierarchi- cal vision transformer that divides images in to non-overlapp ing windows and uses a window-shifting mechanism, which im- proves p erformance and reduces computational expenses. This model is especially suitable for tasks with lo wer computational needs, such as potato leaf disease classifica tion. These baseline classifiers have been used t o provide a ho listic baseline on wh ich the performance of the proposed model can be assessed in terms o f d etecting and classifying diseases affecting the potato leaf. 1) Proposed Customized TinyViT: The proposed model is a customized form of the TinyViT architecture, with two extra layers added to it to improve the abil ity to identify potato leaf disease. Th e initial added layer is an additional transformer layer to produce more detailed features, whereas th e second is an additional feedforward layer to improve the model to learn non -linear decision boundaries. These changes e nable the model to acc ommodate the finer differences in the pictures of leaves to enhance its precision without affecting the computing speed. The Customized TinyViT is therefore the most appropriate in real-world, resource-limited cases where disease classification is required at an efficient rate. F igure 3 shows the modified architecture of Tiny-ViT. E. Use of Explainable AI The predictions of the Proposed Ti ny-ViT model were interpreted using GRAD-CAM. It emphasizes the areas in the input image that contribute most to the choice of the model and makes sure that it targets the areas affected by the disease. This renders t he Fig. 3 . Architecture of the p roposed Custom ized TinyVi T mode l for potato leaf disease classifi cation. model more op en and credible, indicating that th e predictions of the model are guided by pertinent cha racteristics. GRAD-CAM is used to increase the interpretability and reliability o f our model in practical app lic ation s. F. Evaluation Metri cs To evaluate the p erformance of the Proposed Tiny -ViT model, the model was evaluated by some of t he key e valuation m etrics: accuracy, cross-validation (CV) score, compu tational cost, Matthews correlation coefficient (MCC), and confidence interval (CI). IV. R ESULTS AND D ISCUS SION In this section, we present the comprehensive evaluation of the Proposed Tiny-ViT model along with other models, highlighting its performance across various metrics. We will discuss the key results from our experiments, including accuracy, c ross-valid ation scores, and computational efficiency. A. Training, Testing, and Cross V alidation Per forma nce The model p erformance in Potato Leaf Disease Classification is provided in Table II a nd gives the performance of the model on the training and test set in terms of accuracy. The training accuracy and test accuracy were 99. 63% and 99.48%, respectivel y, showing that the features were extracted efficiently and g eneralized well. Nevertheless, there is a minor decrease in the accuracy of the tests, which indicates a slight sensitivity to unseen data. Similarly, th e training acc uracy an d test accuracy of the model were 99.50% a nd 99.30%, respectively, indicating th at the model g eneralized well. Nonetheless, th ere is a slight decrease in test accuracy, wh ich could suggest its responsiveness to new information. Co nversely, the highest training accuracy was recorded at 99.75% with a test accuracy of 99.55% due to the u se of the M obileViT XS model. Th is indicates a strong balance between the training and test performance, meaning that the model works well on b oth seen and unseen data. Lastly, the performance of the p roposed customized Ti nyViT model, which was specifically trained for this task, was close to that of a nearly p erfect model, with a training accuracy of 99.90% and a test accuracy of 99.85%. This finding highlights the value of customizing specialized architectures to target specific tasks. We also used 5 -fold stratified cross-validation to furt her assess the generalizability of these models. These cross -validation results, presented in the figure below, provide a more detailed analysis of the model’s stabil ity and performance wh en different d ata splits are use d. Figure 2 below 4 i ndicates the mean test accuracy of th e models with 5-fold cross-validation. The findings suggest that the Proposed Customized TinyViT model is more effective than th e other models since it has the highest ac curacy of 99.82%. Mob ileViT XS model is closely b ehind the accuracy of 99.67% which shows its high le ve l TA BLE II M ODEL P ERFORMANCE E VALUATION FOR P OTATO L EAF D ISEASE C LA SS IF ICA TIO N Mod el Train S e t Ac cur acy Test S e t Ac cur acy DEIT Sm al l 0.9 96 3 0.9 94 8 SWIN Ti n y 0.9 95 0 0.9 93 0 MobileViT XS 0.9 97 5 0.9 95 5 Proposed Customized Tin yV iT 0.9 99 0 0.9 98 5 of generalization. DEIT Small and SWIN Tiny models demonstrate a very slightly lower accuracy of 99.57 and 99.45 percent, respectively, indicating that they are doing a good job but wi th sli ght v ariations in their capacity to extrapolate through the test sets. These findings highlight the success of fine-tuned, specialized mo dels such as the Proposed Customized TinyViT in classification with high performan ce . Fig. 4. Mean Test Accuracies from 5-Fold Cross-Validatio n for Various Models in Potato Le af Diseas e Classifica tion B. Validation and Loss Curve Analysis of Proposed Tiny Vi T The validation and loss curves of th e P roposed TinyViT mod el are shown in Figure 5 in the training process. The graph shows the output of the model during several epochs in the context of the validation loss and validation accuracy. As observed in the figure, the mod el exhibits steady changes in validation accuracy with a significant reduction in validation loss, especially during the initial epochs. It means th at the model is su ccessfully acquiring the current trends in the d ata, and it will bec ome better at g eneralization as it is b eing trained. The low variation and the regularity of the curves is also positive indicators of the strength o f the model in working with the validation set. It is worth noting that the loss in validation has reduced significantly towards the later epo chs, indicating that the model is efficiently converging to an optimal solution demonstrating good indications of avoiding overfitting. C. Analysis of Inference ti m e Figure 6 shows the inference time of all evaluated models u sed in the classification of potato leaf disease: S WIN Tin y, DEIT Small, MobileViT XS, and the Proposed Customized TinyViT model. SW I N Fig. 5. Tiny has the highest inference times, and training has a time of 12.94 seconds and v alidation 0.63 second,s and test has 0 .86 seconds which reflects it s cost of computation. Comparatively, DEI T Small records a margin ally lo wer time with training at 9.68 seconds and test at 0.70 seconds, as it was designed with greater efficiency. MobileViT XS also performs even better in inference time, getting 6 .73 seconds to train and 0.54 seconds to test, and is thus more app licable in the real-world scenario. Lastly, the Pr oposed Customized TinyViT mod el has th e shortest inference times with the d etach training time o f 6.86 seconds and the test time of 0.57 seconds, as it is a great compromise in terms of accuracy and efficiency to be deployed. Fig. 6. Comparison of inference times (in seconds) for various models during training, valida tion, and testi ng phases. D. Misclassification Analysis of Proposed Tiny ViT Figure 7 presents a co nfusion matrix of the Proposed TinyViT model that demo nstrates how t he model performed in classifying three classes, which are Early blight, Late blight, and Healthy. In the case of Early blight, the model correctly id entified 7 4 samples as Early blight, however there was 1 sample that was wrongly identified as Late blig ht. The model in Lateblight co rrectly identified all 75 samples without any misclassifications. In the case of Healthy, 75 samples were correctly predicted, but 1 sample of Healthy was falsely predicted as Early blight. As this confusion matrix shows, the Proposed TinyViT model works well with the least misclassification, which is between Early blight a nd Late blight, as well as between Healthy and Early blight. E. MCC and Confidence Interval Analy sis The Matthews Co rrelation Coefficient a nd C onfidence Intervals (CI) o f the models are presented in table III. The Proposed Cus- tomized TinyViT model h as the highest MCC of 0.9990, meaning a h igh p erformance, and CI is narrow, implying a high degree of reliability. Mobil eViT XS and DEIT Small are also goo d with MCC of 0.9941 and 0. 9934, respective ly. Although it has a slightly l ow Fig. 7. Confusion matrix for the Proposed TinyViT mod el. value of 0.9923, the SWIN Tiny mo del is also performing well and has a low degree of uncertainty in its CI. F. MCC and Confidence Interval Analy sis TA BLE II I M ATTHEWS C ORRELATION C OEFFICIENT (MCC) AND C ONFIDENCE I NTERVAL (CI) FOR A LL M O DELS Mod el M C C Confidence Interval (C I) DEIT Sm al l 0.9 93 4 [0.9901, 0.9 962 ] SWIN Ti n y 0.9 92 3 [0.9885, 0.9 952 ] MobileViT XS 0.9 94 1 [0.9917, 0.9 966 ] Proposed Tin y ViT 0.9 99 0 [0.9980, 0.9 995 ] G. Pro posed Model Interpretability using GRAD-Ca m Visual izati on The GRAD-Cam v isualization of the Proposed TinyViT Model is displayed in Figure 8. The method u nderlines those areas of the input image that had the biggest impact on th e decision-making process of the model. The regions highlighted in the visualization indicate the regions of the image that t he mode l paid attention to when classifying . In particular, our model accurately targets the diseased regions of the potato leaf, which are essential in d efining the various diseases of the leaf. This specific attention to the features in q uestion makes the predictions of th is model n ot only accurate bu t also interpretable, showing th e way in which the model can give more prio rity to the regions of disease to make a more effective decision. Fig. 8. GRAD-Cam Visualization of the Proposed TinyViT Model. The highlighted regions represent the a reas in the image that contributed most to the model’s dec ision, pr oviding in sights into the model’s focus during clas sific a tio n. H. Comparison with Previous stu dy Table IV p resents a comparison o f various p lant disease classifi- cation models, detailing their accuracy and limitations. Tambe et al . [6] achieved 99.1% accuracy with a CNN but lacked cross-validation and faced overfitting. Alhammad et al. [7] used VGG16 with transfer learning, achieving 98% accuracy, but the method is computationally expensive and lacks cr oss-validation. Dame e t al. [8] pro posed a custom CNN, attain ing 99% accuracy, but it suffers from a small dataset, no cross-validation, and h igh computational cost. Sinamenye et al. [9 ] used Efficien tNetV2B3 + ViT with 85.06% accuracy, but the model struggles with misclassifications and generalization. In con- trast, our Tiny-ViT model not only a chieves 9 9.85% ac curacy but also integrates explainability (XAI), ensures low computational cost, and employs high cross-validation, demonstrating superior performance and robustness. TA BLE IV S UMMARY OF M ODEL A CCURACY AND L I MITATI ONS Stud yMod el Accu racy Limit at ions CN N 99.1 % No cross-vali dation; overf ittin g; allow a seamless, on -site detection o f the disease. Fin ally, it would be an in teresting venture to develop the model to categorize other plant diseases to increase its use in agricultural automation. R EF E RENCE S [1] M. Javaid, A. Haleem, R. P. Singh, and R. Suman, “Enhancing smart farming through the applications of agriculture 4.0 technologies,” International Journal of Intelligent Networks , vol. 3, pp. 1 50 – 164, 2022. [Online]. A v ailable: https:/ /doi.org/10.1 016/j.ijin.20 22.09.004 [2] M. E. Haque, M. T. H. Saykat, M. Al -Imran, A. H. Siam, J. Uddin, a n d D. Ghose, “An atten tion enhanced cnn e nsemble for interpretable and accurate cotton leaf disease classification, ” Scientific Reports , vol. 16, p. 4476, 2026. [3] S. Tafesse, E. Damtew, B. van Mierlo, R. L ie, B. Le maga, K. Shar ma, C. Leeuwis, and P. C. S truik, “Farmers’ knowledge and practices of potato dise ase ma nagement in ethiopia,” NJAS - W ageningen Journal of Life Sciences , v ol. 86 – 87, pp. 25 – 38, 2018. [Online]. Available: htt ps :// doi.or g/10. 1016/ j.nja s. 20 18. 03.0 04 [4] M. M. Rahaman, S. Umer, M. Azharuddin, a nd A. Hassan, “Image -based b light diseas e detec tion in cr ops usin g ensemble deep neural networks for agricultural applications,” Journal o f Natural Pesticide Research , vol. 12, p. 100130, 2025. [Online]. Available: htt ps :// doi.or g/10. 1016/ j.nap er e. 20 25. 1001 30 [5] M. E. Haque, F. A. Farid, M. K. Siam, M. N. Absur, J. Uddi n, [6] [7] [8] moderate computat ional cost. VG G 16 98% No cross-validat ion; h eavy pre - trained network; comput ationally inte nsi ve. Custom C N N 99%, 96% Sma ll data se t; no cr oss - vali dati on; no exp lain abi lity; high compu tational cost. and H. Abdul Karim, “Leafsig htx: an explainable attentio n- enhanced cnn fusion model for apple leaf disease identification,” Frontiers in Artificial Intellige nce , vol. Volume 8 - 2025, 2026. [O nline]. A vailable: https://www.frontiersin.or g/journals/ar tificial- inte llige nce/ ar ticl es/1 0.3 389/f ra i. 20 25. 16898 65 [6] U. Y. Tambe, S. Tambe, a nd S. P. Chatterjee, “P otato leaf disease classification using deep l earning: A convolutional n eural network approach,” arXiv preprint a rXiv: 2311.02338 , 2023. [Online]. Ava ilable: htt ps :// doi.or g/10. 4855 0/a rX iv.23 11.0 233 8 [9] Ef fi cie ntN e tV2 B3 + ViT 85.0 6% No cross-validat ion; misclassifi - cations; p oor generalizatio n. [7] S. M. Alhammad, W. El -Shafie, T. M. Albehairi , K. K. Ban iata, an d S. A. A. Ebrahim, “Deep lear ning and explai nable AI for c lassificati on of potato leaf diseas es,” Frontiers in Artificial Intelligence , vol. 7, p. [10] Ou r Study PLDPN et 98.6 6% No cross-vali dation; no XA I; complex pipeline; overfitting risk . Tiny-V i T 99.85% the proposed model was eval u- ated on a single dataset, which may restrict its generali zability to other dat asets or conditi ons V. C ON CLUS ION 1449329, 202 4. [8] T. A. Dame, T. Hassan, B. Arega, N. Asmare, and Y. Borumand, “Deep learning-based potato leaf disease classification and s e verity assessment,” Discover Appli ed Sciences , vol. 5, no. 3, pp. 1 – 12, 2025. [9] J. H. Sinamenye, A. Chatterjee, and R. Shrestha, “Pota to p lant disease detection: leverag ing hybrid deep learni ng models,” BMC Plant B iology , vol. 25, p. 647, 2 025. [10] F. Arshad, C. Choe, and J. Kim, “Pld pnet: End - to -end hybrid deep learning framework for pot ato leaf disease prediction,” Alexandria Engineering Jou rnal , vol. 78, p p. 406 – 418, 2023. [11] W. Barhoumi, A. Jlassi, A. Elaoud, and H. Ghazo uani, “ Potat o l eaf dis - We have introduced the Tiny-ViT in this paper to classify potato leaf diseases, which include Earl y Bli ght, Late Blight, and Healt hy leaves. Our experiments sho wed that Tiny-ViT is b etter when com- pared with existing b aseline models since it has a test accuracy of 99.85 per c ent, a mean cross-validation ac curacy of 99.82% an d MC C of 0.9990. The model is also characterized by rapid inferences a nd low computational cost, thus suitable for real-time usage in resource- constrained environments. Moreover, the applica tion of GRAD -CAM made the model interpretation more transp arent, p roviding in forma- tion regarding the area of t he leaf that was affected by the disease, therefore, making better predictions of the model more credible. A key limitation of this study is th at the proposed model was evaluated on a sin gle dataset, which may restrict its generalizability t o other datasets or conditions. Althou gh the outcomes are encou raging, there is roo m to further improve and study. First, th e perfo rmance o f the mod el would be fu rther tested on external datasets in order to be sure about its robu stness and applicability to different environmental conditions. Moreover, it can be im proved by including a wider variety of data, including images taken in different lighting conditions, with different b ackgrounds, etc. so that the model could better cope with real-world cond itions. In the future, it might also be investigated how the model could be combined with mobile or embedded systems to ease classificat ion using transfer learning and r eweighting-base d training with imbalance d data,” SN Comp uter Science , vol. 5, p. 987, 2024. [12] C. U. Kumari, S. J. Pr a sad, and G. Mounika, “Optimizatio n of deep convolution for potato disea se d etection,” Potato Research , v ol. 68, pp. 3253 – 3270, 20 25. [13] A. Ja in, A. K. Dubey, V. S. - H. Pan, S. Mahfoudh, T. A. Al tha qafi, V. Arya, W. Alhalabi, S. K. S ingh, V. Jain, A. Pan war, S. Kumar , C. - H. Hsu, and B. B. Gupta, “Bayesian optimized cnn ensemble for efficie nt potato blight detection using f uzzy i mage e nhancement,” Scientific Reports , vol. 15, p. 31259, 2025. [Online]. Available: htt ps :// doi.or g/10. 1038/ s 41 598 -025 -15 940-7 [14] G. Sangar and V. Rajasekar, “Optimized classification of potato leaf d isease using efficientnet-lite and ke-svm in d iverse environments,” Frontiers in Plant Science , vol. Volume 16 - 2025, 2025. [Online]. Available: https://ww w.frontiersin.or g/journals/pla nt - sci enc e/art ic les /10. 33 89/ fp ls. 2025 .1 49 990 9 [15] T. K . Dey, J. Pradhan, and D. A. Khan, “ Optimi zed potato leaf disease detection with an enhance d conv olutiona l neural network,” IETE Journal of Research , vol. 71, no. 5, pp. 1777 – 1790, 2025. [16] M. A. Put ra , “P otato lea f dis eas e d a ta se t, ” htt ps ://w ww.k ag gl e.c om/d ata s ets /m uham mad ar di pu tra /p ota to-le af- disease-dataset, 2 019, accesse d: 2025- 10 -10.
Original Paper
Loading high-quality paper...
Comments & Academic Discussion
Loading comments...
Leave a Comment