Translating MRI to PET through Conditional Diffusion Models with Enhanced Pathology Awareness
Positron emission tomography (PET) is a widely recognized technique for diagnosing neurodegenerative diseases, offering critical functional insights. However, its high costs and radiation exposure hinder its widespread use. In contrast, magnetic reso…
Authors: Yitong Li, Igor Yakushev, Dennis M. Hedderich
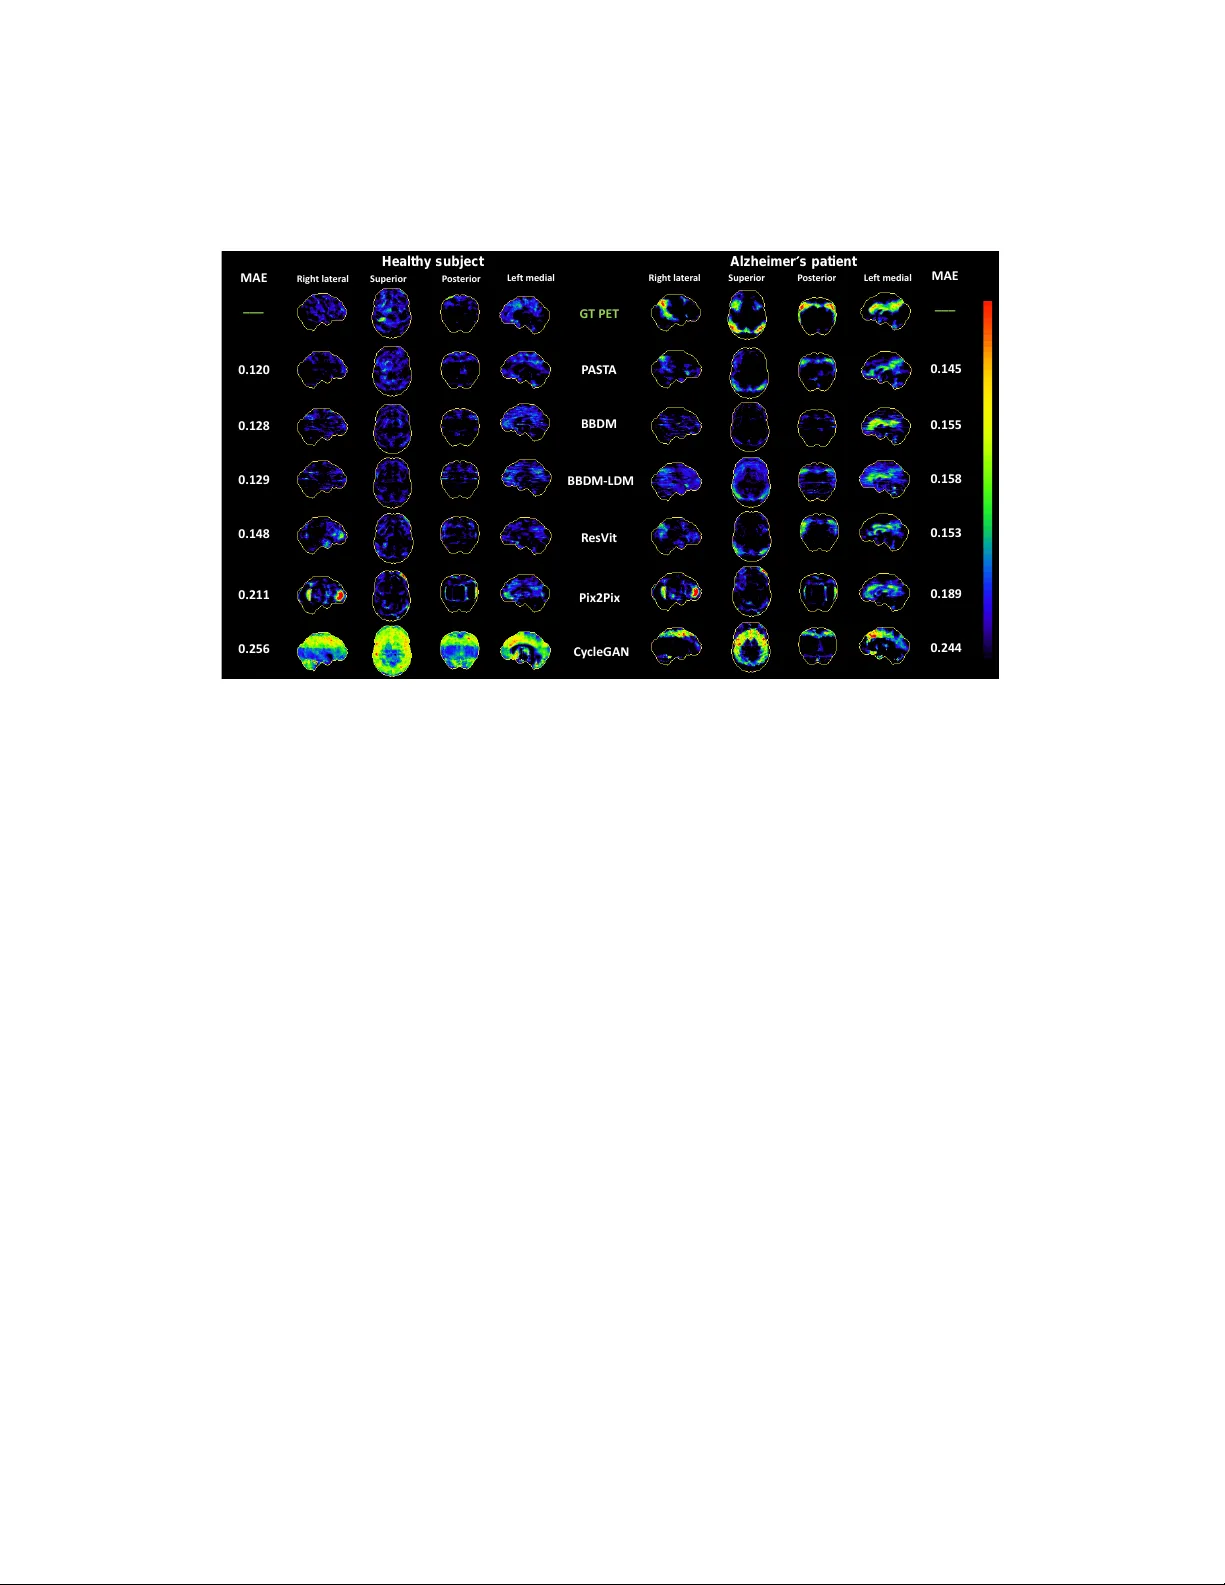
T ranslating MRI to PET through Conditional Diffusion Mo dels with Enhanced P athology A w areness Yitong Li a,b, ∗ , Igor Y akushev c , Dennis M. Hedderic h d , Christian W ac hinger a,b a L ab for Artificial Intel ligenc e in Me dic al Imaging, Institute for Diagnostic and Interventional R adiolo gy, Scho ol of Me dicine and He alth, TUM Klinikum, T e chnic al University of Munich (TUM), Munich, 81675, Germany b Munich Center for Machine L e arning (MCML), Munich, Germany c Dep artment of Nucle ar Me dicine, Scho ol of Me dicine and He alth, TUM Klinikum, Munich, 81675, Germany d Dep artment of Neur or adiolo gy, Scho ol of Me dicine and He alth, TUM Klinikum, Munich, 81675, Germany Abstract P ositron emission tomograph y (PET) is a widely recognized tec hnique for diagnosing neuro degenerativ e diseases, offering critical functional insights. Ho wev er, its high costs and radiation exposure hinder its widespread use. In con trast, magnetic resonance imaging (MRI) does not inv olv e such limita- tions. While MRI also detects neuro degenerativ e changes, it is less sensitiv e for diagnosis compared to PET. T o o vercome such limitations, one approach is to generate syn thetic PET from MRI. Recent adv ances in generativ e mo dels ha ve pa ved the wa y for cross-modality medical image translation; ho w ever, existing metho ds largely emphasize structural preserv ation while neglecting the critical need for pathology aw areness. T o address this gap, w e propose P AST A, a no v el image translation framew ork built on conditional diffusion mo dels with enhanced pathology a wareness. P AST A surpasses state-of-the- art metho ds by preserving b oth structural and pathological details through its highly in teractiv e dual-arm arc hitecture and multi-modal condition in te- gration. A dditionally , we in tro duce a no v el cycle exc hange consistency and ∗ Corresp onding author Email addr esses: yi_tong.li@tum.de (Yitong Li), igor.yakushev@tum.de (Igor Y akushev), dennis.hedderich@tum.de (Dennis M. Hedderich), christian.wachinger@tum.de (Christian W ac hinger) v olumetric generation strategy that significan tly enhances P AST A’s abilit y to produce high-qualit y 3D PET images. Our qualitativ e and quantitativ e results demonstrate the high qualit y and pathology a wareness of the syn the- sized PET scans. F or Alzheimer’s diagnosis, the p erformance of these syn- thesized scans improv es ov er MRI by 4%, almost reac hing the p erformance of actual PET. Our co de is a v ailable at https://github.com/ai- med/PASTA . Keywor ds: Diffusion mo dels, cross-modality translation, brain, MRI, PET. 1. In tro duction Alzheimer’s disease (AD) is a progressiv e neuro degenerativ e disorder and the leading cause of dementia; early detection is vital for timely therap eutic in terven tions. A ccurately diagnosing a patient’s neurological condition re- quires m ultidisciplinary diagnostic to ols, including magnetic resonance imag- ing (MRI), p ositron emission tomograph y (PET), cognitiv e assessmen ts, and genetic tests [1]. Structural MRI provides detailed anatomical information ab out the brain, facilitating the iden tification of regional atroph y , a hallmark of AD [2]. In contrast, PET with 18-Fluoro deo xyglucose (FDG 18 -PET) mea- sures glucose metab olism in the brain. In AD and other neurodegenerative disorders, glucose uptak e is severely reduced in sp ecific brain regions [3]. By sensitiv ely capturing functional abnormalities, PET is highly effectiv e for as- sessing early dementia symptoms and distinguishing AD from other types of demen tia, suc h as fron totemp oral and Lewy b o dy dementia [4]. As a re- sult, PET is widely regarded as ha ving a higher diagnostic and prognostic accuracy for AD [5]. Despite its considerable clinical v alue, PET is inaccessible to numerous medical cen ters worldwide due to its high cost and the inherent risks asso- ciated with radiation exp osure [6]. MRI, while b eing more widely av ailable and non-inv asive, lac ks the functional insigh ts pro vided by PET, making it less sensitive for suc h diagnostic purp oses [7]. T o address this limitation, one promising approach is to translate MRI data into syn thetic PET im- ages, thereby improving access to functional brain imaging and facilitating early , accurate AD diagnosis. Ho wev er, a ma jor c hallenge in suc h cross- mo dalit y translation is faithfully preserving and generating accurate patho- logical features in the target imaging mo dality . Introducing artificial or incor- rect pathology will compromise the reliability of syn thetic images, rendering 2 No rmal Su bj ect Al zh e im e r ´ s Di se a se MRI G T PET Lo w up take Hi gh uptake 18 F − FDG MRI G T PE T Sy n PET SOT A DM Sy n PET P AST A (Ours ) Figure 1: F or Alzheimer’s disease, PET rev eals distinctly reduced glucose uptake in the temp oroparietal lob e (b ottom circles), mirroring atrophy on MRI with higher sensitivit y . Compared to the ground-truth (GT) PET, state-of-the-art diffusion mo dels (SOT A DM) fail to reco ver s uc h pathology in the synthesized (Syn) PET from MRI input. In con trast, P AST A shows improv emen t in preserving disease-sp ecific pathology . them unsuitable for clinical applications and increasing the risk of misdiag- nosis. Therefore, ensuring p atholo gy awar eness in cross-mo dalit y translation is essen tial for its safe and effective use in healthcare. Recen tly , generative mo dels, particularly diffusion mo dels (DM) [8], hav e gained significant attention for their exceptional capabilities in high-quality image generation and translation [9, 10, 11], making them a comp elling choice for cross-mo dalit y medical imaging translation. Ho w ever, curren t DM-based approac hes predominantly emphasize main taining structural in tegrity , often neglecting the preserv ation of pathology , as shown in Fig. 1. T o address this problem, we presen t P athology-A w are croSs-mo dal T rAns- lation (P AST A), a nov el end-to-end DM-based framework for clinically mean- ingful volumetric MRI to PET translation. It is based on a symmetric dual- arm architecture consisting of a conditioner arm, a denoiser arm, and inter- mediate adaptive conditional mo dules to in tegrate m ulti-mo dal conditions . The conditioner arm pro cesses the MRI input and generates a task-sp ecific represen tation, passed on to condition the denoiser arm through adaptive conditional mo dules, together with the provided clinical data. The denoiser arm utilizes the conditions to generate corresp onding PET scans from com- plete noises. In addition, P AST A introduces a memory-efficient volumetric generation paradigm, which leverages 2D bac kb ones to create high-quality scans without any inconsistencies or artifacts in the 3D representation. Fi- nally , w e in tro duce a cycle exchange consistency training strategy for P AST A to enforce the information exchange within the dual-arm architecture, fur- 3 ther lifting the generation qualit y . As illustrated in Fig. 1, P AST A represents a significan t step forward in supp orting AD diagnosis through high-qualit y syn thetic PET imaging. In summary , w e make the following con tributions: • A nov el end-to-end framew ork for cross-mo dalit y MRI to PET transla- tion with pathology-a ware conditional diffusion mo dels for volumetric image generation. • In tegration of multi-modal conditions through adaptive normalization la yers to facilitate high-qualit y PET synthesis enabling pathology aw are- ness. • A cycle exchange consistency strategy for informative training of con- ditional diffusion mo dels. • Quan titative and qualitativ e exp erimen ts demonstrate that P AST A not only achiev es low reconstruction errors but also preserves AD pathology to b oost diagnosis accuracy . 2. Related W ork 2.1. Image T r anslation in Me dic al Domains Previous w orks on cross-mo dality MRI to PET translation mainly based on generativ e adversarial netw orks (GAN) [12, 13, 14, 15, 16, 17, 18]. W ei et al. [12] prop osed a sketc her-refiner sc heme with tw o cascaded GANs to first generate coarse syn thetic images and then refine them. Shin et al. [18] in tro duced GAND ALF to generate PET from MRI for Alzheimer’s diagno- sis. Zhang et al. [14] prop osed BPGAN to synthesize brain PET images. Hu et al. [15] designed a 3D end-to-end synthesis mo del called bidirectional mapping GAN, in which the image con text and the laten t vector w ere jointly optimized. Dalmaz et al. [17] prop osed a GAN-based residual vision T rans- formers framework for multi-modal medical image synthesis. RegGAN was in tro duced by Kong et al. [52] for unpaired medical image-to-image trans- lation b et ween MR T1- and T2-weigh ted images, with an additional regis- tration net w ork to fit the misaligned noise distribution adaptiv ely . Lin et al. [50] adopted a 3D Rev ersible GAN (RevGAN) to synthesize missing PET from MRI, so that incomplete multimodal data could b e fully utilized in a 3D CNN classification mo del to p erform AD diagnosis. A Plasma-CycleGAN 4 w as prop osed b y Chen et al. [47] to syn thesize PET images from MRI using blo od-based biomarkers. In an epilepsy study conducted by Zotov a et al. [49], training an unsu pervised anomaly detection mo del on synthetic FDG-PET scans from GAN-based mo dels achiev ed lesion detection p erformance on par with using real PET. 2.2. Diffusion Mo dels Diffusion mo dels (DM) excel at modeling complex distributions by lever- aging parameterized Mark ov c hains to optimize the low er v ariational bound on the likelihoo d function [19, 8]. They hav e ac hieved superior p erformance o ver GANs in generation fidelity and diversit y [9]. Recently , DMs hav e b een widely adopted for medical imaging, whic h mainly fo cus on unconditional medical image synthesis or cross-con trast MRI translation [20, 21, 22][53]. A diffusion-based framework, Mak e-A-V olume, was presen ted by Zh u et al. [20] for cross-mo dality Brain MRI Synthesis, which extended the 2D latent dif- fusion mo del to a v olumetric v ersion with v olumetric la y ers in the 2D slice- mapping mo del follo wed b y fine-tuning with 3D data. Peng et al. [21] trained a 2D conditional Diffusion Probabilistic Mo del to generate unconditional re- alistic brain MRIs b y progressively generating MRI slices based on previously generated slices. Based on adversarial diffusion mo deling, Özb ey et al. [22] prop osed SynDiff for multi-con trast MRI and MRI-CT translation in an un- sup ervised setup. Kim et al. [53] proposed a latent diffusion mo del that lev erages switc hable blo c ks for m ulti-mo dal 3D MRI image-to-image trans- lation. Considering their remark able achiev emen ts, harnessing DMs for cross-mo dalit y MRI to PET translation presen ts a promising a ven ue. Re- cen t w ork b y Xie et al. [23] prop osed a Joint Diffusion A ttention Mo del (JD AM) to syn thesize PET from high-field and ultra-high-field MR images. Y u et al. [51] in tro duced a F unctional Imaging Constrained Diffusion (FICD) framew ork for brain PET image syn thesis with paired structural MRI as in- put condition, through a new constrained diffusion mo del. Chen et al. [48] prop osed using a diffusion model to syn thesize FDG-PET views from T1- w eighted MRI views and incorp orate b oth one-wa y and t w o-wa y syn thesis strategies. With such recen t ongoing researc h, diffusion mo dels are b ecoming a more p o w erful to ol for generating syn thetic PET with enhanced accuracy , complemen ting or even surpassing GAN-based approaches. A preliminary v ersion of this work has b een presen ted at a conference [24]. Here, w e extend it by providing more tec hnical details with new arc hitectural 5 impro vemen ts, extending the exp erimen tal ev aluation on more datasets, in- cluding more analysis on the Neurostat 3D-SSP maps from the generated images, adding analysis on the influence of individual clinical data on the generativ e p erformance, and including additional ablation studies with error maps to sho wcase the impact of v arious critical designs. 3. Metho ds Cross-mo dalit y image translation aims to learn a mapping from one mo dal- it y to another in a paired manner, given datasets X A and X B from mo dalities A and B, resp ectiv ely . In medical image translation, it is crucial that the generated images closely follo w the ground truth and preserve pathologi- cal features. Existing DM-based image translation metho ds [25, 26] fo cus on transferring image st yle and preserving structural information; how ev er, these approac hes are insufficient for medical image translation in the align- men t of pathology details, as sho wn in Fig. 1. P AST A addresses this limita- tion in translating 3D brain MRI scans to PET using conditional denoising diffusion probabilistic mo dels (DDPM). In the following section, w e first re- view the fundamental concepts of DDPM for data generation, then in tro duce P AST A and its efficient strategy for generating pathology-aw are 3D PET scans from corresp onding MRIs. 3.1. Pr eliminaries of DDPMs A T -step DDPM [8] comprises a forward diffusion pro cess and a rev erse denoising pro cess. Denoting the distribution of training data as p ( x 0 ) , the diffusion process is a Mark o vian Gaussian transition that gradually adds noise with different scales to a real data p oin t x 0 ∼ p ( x 0 ) to obtain a series of noisy laten t v ariables { x 1 , x 2 , ..., x T } : q ( x t | x 0 ) = N ( x t ; α t x 0 , σ 2 t I ) , x t = α t x 0 + σ t ϵ, (1) where ϵ ∈ N (0 , I ) , σ t is the noise sc hedule denoting the magnitude of noise added to the original data at timestep t , increasing monotonically . W e adopt the standard v ariance-preserving diffusion pro cess, where α t = p 1 − σ 2 t . The rev erse pro cess gradually denoises the laten t v ariables and restores the clean data x 0 from x T b y approximating the p osterior distribution p θ ( x t − 1 | 6 x t ) , parameterized as a Gaussian transition. The denoising pro cess goes through the en tire Marko v c hain from timestep T to 0 , given b y: p θ ( x 0: T ) : = p ( x T ) T Y t =1 p θ ( x t − 1 | x t ) , (2) p θ ( x t − 1 | x t ) : = N ( x t − 1 ; ˆ µ θ ( x t , t ) , ˆ Σ θ ( x t , t )) , (3) where ˆ µ and ˆ Σ are b oth predicted statistics. Ho et al. [8] find that instead of learning ˆ Σ( x t , t ) , they can fix it to a constant σ 2 t I or ˜ σ t 2 I , corresp onding to upp er or lo w er b ounds for the true rev erse step v ariance. ˆ µ θ can b e decomp osed in to the linear com bination of x t and a noise approximation mo del ˆ ϵ θ . They find that instead of directly parameterizing µ θ ( x t , t ) as a neural net work, using a mo del ϵ θ ( x t , t ) to predict input noise ϵ yields better p erformance in practice, leading to a simplified ob jective: L t simple ( θ ) = E x 0 ,ϵ [ ∥ ϵ − ˆ ϵ θ ( α t x 0 + σ t ϵ ) ∥ 2 2 ] . (4) Most works [27, 9] adopt thi s strategy . Later works [28, 29] also use another reparameterization that trains the denoising model x θ ( x t , t ) to predict the noiseless state x 0 as it giv es b etter empirical results for sp ecific models: L t simple ( θ ) = E x 0 ,ϵ [ ∥ x 0 − ˆ x θ ( α t x 0 + σ t ϵ ) ∥ 2 2 ] . (5) Despite their different prediction targets, these ob jectives are mathemati- cally equiv alen t [28]. In this pap er, we stick to the strategy of training the denoising mo del x θ with the ob jectiv e in eq. (5), for its empirically b etter p erformance. 3.2. Conditional PET Gener ation fr om MRI Denoting the training data as D T rain = ( M i T rain , P i T rain ) N i =1 , which com- prises N pairs of MRI M ∈ R H × W × D and its corresp onding PET P ∈ R H × W × D , our ob jectiv e is to learn a mo del G ( · ) on D T rain , such that given an y unseen MRI input M T est / ∈ D T rain , its PET coun terpart is inferred as P T est = G ( M T est ) . W e prop ose a conditional DDPM to mo del G ( · ) , which is tailored to closely capture the inheren t structural and pathological corre- lations present in the MRI data, with the integration of multi-modal con- ditions, to strive for a pathology-aw are MRI to PET translation. W e aim to establish a strong in teraction with the input MRI by conditioning on its 7 En c Enc Dec D ec Ada GN En c Enc Dec D ec Ada GN Ada GN GN M LP M LP FC FC AdaG N F or w ar d Dif fusion Pr oce ss GN MLP FC V olume tric Gene r a ti on Figure 2: P AST A features a symmetric dual-arm structure with a conditioner arm ( ϕ ω ), a denoiser arm ( x θ ), and adaptiv e conditional modules (A daGN). Through A daGN, P AST A conditions the feature maps h from x θ on timestep t , clinical data c , and task represen tation h m from ϕ ω . It achiev es high-quality 3D PET synthesis through a v olu- metric generation strategy . features at multiple scales. Thus, P AST A deploys a symmetric dual-arm ar- c hitecture, as shown in Fig. 2. The framew ork consists of three main parts: the conditioner arm, the denoiser arm, and the in termediate adaptive condi- tional mo dules. Both the conditioner and denoiser arms adopt a symmetric UNet [30] lay out. The in teraction b etw een the tw o arms and the fusion of additional conditions are ac hieved through the adaptive group normalization la yers (A daGN) [9]. This symmetric design ensures that matching blo c ks across the t wo arms share the same spatial resolution, enabling multi-scale feature map in teractions. 3.2.1. Conditioner A rm The MRI input M is first pro cessed through the conditioner arm to gen- erate m ulti-scale task-sp ecific represen tations, denoted as h m : ˆ M = ϕ ω ( M ; h m ) , (6) 8 where ϕ ω ( · ) represents the conditioner mo del parameterized b y ω , the task- sp ecific representations h m = { h 1 m , . . . , h n m } consist of intermediate feature maps from ϕ ω ( · ) at m ultiple scales, with n denoting the n umber of resid- ual blo c ks in the conditioner arm. These representations pla y a key role in facilitating the PET syn thesis pro cedure in the other arm. The conditioner arm is designed to p erform predefined tasks to transform the MRI input in to meaningful multi-scale features. These predefined tasks include MRI reconstruction, MRI-to-PET translation. Different tasks imp ose distinct training ob jectives on the conditioner arm. F or instance, when MRI- to-PET translation is selected as the predefined task, the conditioner arm is trained by minimizing the pixel-wise distance b et ween the original PET and the conditioner output: L task ( ω ) = E M , P dist ( ϕ ω ( M ) , P ) , (7) where dist ( · ) denotes the distance function used to measure the similarity b et w een ϕ ω ( M ) and P , suc h as L 1 or L 2 norm. MRI-to-PET translation is primarily c hosen as the predefined task for the conditioner arm due to its sup erior empirical p erformance. A dditionally , w e explore the efficacy of alternativ e task paradigms in Section 4. 3.2.2. A daptive Conditional Mo dule The in teraction b et w een the tw o arms is facilitated b y the adaptiv e group normalization lay ers (AdaGN) [9]. These lay ers integrate multi-modal con- ditions in to the feature maps h = { h 1 , . . . , h n } within eac h residual blo ck from the denoiser arm. These A daGN la yers adapt conditions include: 1) Timestep t in the diffusion pro cess; 2) T ask-sp ecific representations h m from the conditioner arm at corresp onding scales; 3) Clinical data c ∈ R c × n of an individual sub ject. Our A daGN is given by: A daGN ( h , t, c , h m ) = c s ( h m ( t s GroupNorm ( h ) + t b ) , (8) in whic h ( t s , t b ) ∈ R 2 × c = MLP ( pos ( t )) is the output of a m ultilay er p ercep- tron (MLP) with a sinusoidal enco ding function pos ( · ) applied to timestep t , and c s = MLP ( c ) . When incorp orating the task-sp ecific representations h m , we omit the linear pro jection but directly apply the feature maps af- ter the timestep condition. The adaptive conditional mo dule can b e further enhanced with slice-p osition aw areness by incorp orating through-plane p osi- tional information as an additional conditioning signal into A daGN, in the 9 same manner as the timestep and other conditions. This extension yields the Slice-A w are Adaptiv e Group Normalization (SA-AdaGN) mo dule, which explicitly enco des the slice p osition into the conditioning pro cess, aiming to impro ve the inter-slice consistency during generation. A detailed descrip- tion of SA-AdaGN is provided in App endix B. These adaptive conditional mo dules are applied throughout the dual-arm arc hitecture. T o enhance the net w ork’s capability to preserve detailed pathological ev- idence in the syn thesized PET scans, w e integrate clinical data as a supple- men tary condition during the translation pro cess. As a default, we selected six v ariables for the clinical data c : demographic v ariables (age, gender, ed- ucation level), cognitiv e scores (MMSE [31], AD AS-Cog-13 [32]), and the AD-related genetic risk factor ApoE4 [33]. T o accoun t for v ariables that are not alwa ys a v ailable, we address missing v alu es using a strategy inspired b y Jarrett et al. [34], where binary indicators are app ended to denote whether the data is missing or not for eac h clinical v ariable, except age, gender, and education level as they ha ve no missing v alues. This allo ws the net- w ork to leverage incomplete data while recognizing patterns of missingness. The resulting clinical d ata includes nine features. In this w ay , the adaptive conditional mo dule fuses the multi-modal data ranging from structural to pathological evidence, enhancing the accuracy and reliability of the medical image syn thesis in the following denoiser arm. 3.2.3. Denoiser A rm The denoiser arm implemen ts the reverse pro cess of DDPM, aiming to restore the clean PET scan P 0 from the noised input. Starting from the Gaussian noise ϵ at timestep t = T , it generates PET images P t at each timestep t = T , T − 1 , . . . , 0 , conditioned on m ulti-mo dal v ariables through A daGN mo dules: P 0: T = P T T Y t =1 x θ ( P t − 1 | h m , c ) , (9) where x θ ( · ) denotes the denoising mo del parameterized by θ . The symmetric la yout of P AST A enables feature maps in the denoiser arm at each resp ectiv e scale to b e conditioned b y task-specific representations from the conditioner arm at corresp onding scales. This design fosters stronger interactions with the conditioning mo dality , thereby strengthening its impact on the denoising pro cess. T o further enhance the pathology aw areness during the synthesis process, 10 w e incorp orate MetaROIs [35] as pathology priors, guiding the mo del to fo cus on key hypometab olic regions asso ciated with abnormal metab olic changes in AD patien ts. As concluded b y Landau et al. , MetaR OIs are a set of pre- defined regions of interest, derived from frequently cited co ordinates in other PET studies comparing AD patien ts to normal sub jects. The final MetaROIs consist of fiv e regions: the left and righ t angular gyrus, the bilateral p osterior cingular, and the left and righ t inferior temp oral gyrus. W e transform the MetaR OIs in to a loss weigh ting map for the denoiser arm, denoted as λ R ∈ R H × W × D , with a constan t weigh t factor λ R on the MetaROIs area. During training, this weigh ting map emphasizes the MetaR OIs within the denoised PET images, assigning higher p enalties to deviations from the ground-truth PET in these critical regions. The resulting training ob jective for the denoiser arm is: L t dif f ( θ ) = λ R · E P 0 ,ϵ [ ∥P 0 − x θ ( α t P 0 + σ t ϵ, c , h m ) ∥ 2 2 ] . (10) This training pro cess can b e further augmented with an in-lo op auxiliary classifier that enforces disease-lab el consistency on the clean PET images predicted b y the denoiser arm. By in tro ducing this auxiliary sup ervision, w e couple a discriminative signal directly into the generation process, guiding the syn thesis tow ard pathology-aw are and semantically faithful outputs while also offering p oten tial b enefits for in terpretability . A detailed description of this auxiliary classifier consistency loss is pro vided in App endix C. 3.2.4. Cycle Exchange Consistency The P AST A framework further go es through a cycle exc hange consistency (CycleEx) training strategy as shown in Fig. 3. The CycleEx stems from the cycle consistency loss prop osed by Zhou et al. [36], where it is claimed that the learned translation mapping functions should b e cycle-consisten t: for eac h image M i from the MRI domain, giv en t wo mappings G p : M → P and G m : P → M , the image translation cycle should be able to bring M i bac k to its original input, i.e. M i → G p ( M i ) → G m ( G p ( M i )) ≈ M i , as forward cycle consistency . Similarly , for each image P i from the PET domain, G p and G m should also satisfy bac kward cycle consistency: P i → G m ( P i ) → G p ( G m ( P i )) ≈ P i . In our CycleEx, the mapp ing G m shares the same net work arc hitecture as G p , differing only in the swapped conditioner and denoiser arms. Therefore, during the forw ard cycle M → P → M , the conditioner arm used to map input MRI to task-sp ecific represen tations h m during mapping G p , will b e reused as the denoiser arm to syn thesize MRI 11 ℳ ෨ 𝑃 ෩ ℳ 𝜖 𝜖 𝑃 x 𝜃 𝜙 𝜔 𝑮 𝒑 𝑮 𝒎 𝓛 𝒄𝒐𝒏𝒔 𝒊𝒔 𝑷 𝓛 𝒄𝒐𝒏𝒔 𝒊𝒔 𝑴 𝜖 ෩ ℳ 𝜖 ෨ 𝑃 C on d iti on in g C on di tion in g C on d iti on in g C on d iti on in g Den ois in g De n oi sin g Den ois in g Den ois in g 𝜙 𝜔 𝜙 𝜔 𝜙 𝜔 x 𝜃 x 𝜃 x 𝜃 𝑮 𝒑 𝑮 𝒎 Figure 3: Cycle exchange consistency (CycleEx) strategy of P AST A. The tw o translation mappings G p : M → P and G m : P → M maintain cycle consistency . In addition, their netw ork architectures are mirrored: b oth con tain the same conditioner arm ϕ ω and denoiser arm x θ , but with an exc hanged p osition. This strategy ensures information sharing b et ween the tw o arms. during mapping G m ; the denoiser arm used to generate clean PET during mapping G p will b e reused to map input PET to task-sp ecific representations h p in mapping G m . The backw ard cycle P → M → P acts similarly . Thanks to the symmetric nature of the conditioner and denoiser arms in P AST A, this exc hange can b e ac hiev ed seamlessly . This design ensures that a single U-Net is dedicated to pro cessing one specific mo dality consistently . The CycleEx pro cedure in tro duces three more conditional diffusion pro- cesses, without adding additional learnable mo del parameters. Eac h cycle in tro duces an additional cycle-consistency loss, bringing the training ob jec- tiv e: L cy cle ( ω , θ ) = L M consist + L P consist = E M dist ( G m ( G p ( M )) , M ) + E P dist ( G p ( G m ( P )) , P ) , (11) where dist ( · ) can b e L 1 or L 2 norm. This setup enforces the information shar- ing b et ween the t w o arms, bringing additional sup ervision and regularization to the image translation. Finally , the com bined training ob jective of P AST A is: L = λ task ∗ L task + λ dif f ∗ L dif f + λ cy cle ∗ L cy cle , (12) 12 where λ task , λ dif f , and λ cy cle are constant m ultiplication factors that deter- mine the relative imp ortance of differen t losses. This joint training enables P AST A to learn task-sp ecific representations that preserve b oth structural and pathological details from the provided input mo dalit y , facilitating the generation of unseen mo dalit y with enhanced pathology-a wareness. More- o ver, CycleEx elev ates translation quality by promoting the extraction of more informative features through effective dual-arm information exc hange. The efficacy of individual parts will b e sho wn in Section 5.7. 3.2.5. V olumetric Gener ation A 2.5D generation strategy is in tro duced in P AST A for memory-efficient 3D medical v olumetric syn thesis. Although a full 3D netw ork offers com- prehensiv e spatial understanding with inheren t learning of in ter-slice dep en- dency , it has limitations due to its high computational demands. More- o ver, the limited av ailability of paired, multi-modal medical data hinders the prop er training of a large-v olume 3D netw ork. T o strike a balance b et ween training efficiency and consistent 3D PET generation, w e adopt 2D conv olu- tional la yers in the neural net work pro viding 2D slices as input, but cater the input c hannel with N consecutiv e neighboring slices of the input slice along the same direction. After training, the net work pro duces the target slice and its N neigh b ors for eac h designated slice p osition. All neigh b oring slices are assigned a w eight based on their distance from the target p osition, with cen- tral slices weigh ted highest and decreasing linearly for farther slices. After summing these w eighted slices, we av erage the o verlapping accumulations for eac h slice p osition. As all PET scans were resampled during prepro cessing to a standardized template with isotropic v oxel dimensions along all axes, the inter-slice spacing is uniform in physical space, ensuring that the output scans accurately reflect true anatomical separation, resulting in a balanced and consistent final 3D scan. This strategy enables the mo del to pro cess and recognize inter-slice relationships, efficiently mitigating the slice inconsisten- cies from the 2D net work. 4. Exp erimen tal Setup 4.1. Datasets and Pr epr o c essing W e use paired T1-weigh ted MRI and PET scans from tw o different datasets for ev aluation: 1) 1,248 sub jects from the Alzheimer’s disease neuroimaging initiative 13 Le � Angular G yrus Righ t Angular G yrus Righ t In f erior T empor al G yrus Le � In f erior T empor al G yrus P os t Cingula t e G yrus Me t aR OIs Figure 4: MetaROIs illustration on a brain MRI. (ADNI) database [37] (adni.loni.usc.edu), including cognitiv ely normal (CN, n = 379) sub jects, sub jects with mild cognitive impairment (MCI, n = 611), and Alzheimer’s disease (AD, n = 257). 2) 253 sub jects from a well-c haracterized, single-site in-house clinical dataset from TUM Klinikum, Munic h, Germany . It includes 143 CN and 110 AD samples. All scans are additionally pro cessed using SPM12 1 . PET scans are nor- malized and registered to the MNI152 template with 1 . 5 3 mm 3 v oxel size. W e further p erform skull-stripping on all PET scans using Syn thstrip [38] and MRI scans using F reesurfer [39]. All data are min–max rescaled to the image in tensit y v alues b et ween 0 and 1. All MRI scans are registered to the corresp onding PET scans. The rigid registration b etw een MRI and PET is p erformed individually within eac h sub ject to align the mo dalities, without registration parameters sharing b etw een different samples, av oiding leak age of spatial priors. The final image size for b oth mo dalities is 113 × 137 × 113 . T o eliminate most blank bac kgrounds, w e further center-crop all scans to 96 × 112 × 96 . W e choose the axial direction of the brain scan as input. The MetaR OIs mask is also registered to the MNI152 template with 1 . 5 3 mm 3 v oxel size. W e demonstrate the five hypometab olic sensitiv e regions from the MetaR OIs on a brain MRI in Fig. 4. F or the ADNI data, the clinical data c includes six v ariables: age, gender, education, cognitive examination scores MMSE and ADAS-Cog-13, and genetic risk factor ApoE4. F or the in-house clinical data, only age and gender are av ailable. Each group of v ariables is 1 h ttps://www.fil.ion.ucl.ac.uk/spm/softw are/spm12 14 further standardized to a mean of 0 and a standard deviation of 1, prior to in tegration into the netw ork. W e split the data into train, v alidation, and test sets, including only one single scan p er sub ject, acquired at the baseline visit, ensuring a strict sub ject-level separation b et w een training, v alidation, and test sets. W e also ensure that diagnosis, age, and gender are balanced across sets. W e adapt the data splitting metho d from ClinicaDL [40], where the balance of a split is first assessed by computing the prop ensit y score — the probabilit y of a sample b elonging to the training set — using a logistic regression mo del consisting of the known confounders. The p ercen tiles of the prop ensit y score distributions across the training, v alidation, and test sets are then compared, with the maximum deviation across all p ercen tiles serving as a measure of im balance [41]. This pro cedure is rep eated for 1,000 randomly selected partitions, and the partition with the lo west imbalance is ultimately selected. As a result, for ADNI data, w e hav e 999 paired scans in the training set, 126 in the v alidation set, and 123 in the test set; for the in-house data, we use 165 for training, 39 for v alidation, and 49 for testing. T o preven t an y bias due to the single split on the limited in-house data, we conducted and rep orted the results of full 5-fold cross-v alidation. How ever, for the larger ADNI dataset, w e rep orted the results using one balanced split generated with the random seed of 666, to limit computational o verhead. 4.2. Mo dels and Hyp erp ar ameters W e adopt the ADM arc hitecture [9] for both the conditioner and the denoiser arms in P AST A. F rom highest to low est resolution, the UNet stages use [ C , 2 C, 3 C , 4 C ] channels, resp ectiv ely . W e set C = 64 , depth = 4 , and timestep T = 1000 with a cosine noise scheduler. W e use global atten tion at do wnsampling factors [16 , 8 , 4] , whic h corresp onds to atten tion on spatial resolutions 24 × 28 , 12 × 14 , and 6 × 7 , given a 96 × 112 axial-direction input slice. W e set the num b er of input neighboring slices N = 15 , λ task = 0 . 1 , λ dif f = 1 , λ cy cle = 1 for the training ob jective after an exhaustiv e search. L 1 loss is used for b oth the denoising and the predefined task loss. The mo del results in 89 M parameters. W e use the Adam W optimizer with a learning rate of 5 × 10 − 4 , a weigh t deca y of 10 − 6 , ( β 1 , β 2 ) = (0 . 9 , 0 . 999) , a batch size of 6 , and an exp onen tial mo ving av erage (EMA) o ver mo del parameters with a rate of 0 . 999 . W e adopt the DDIM [42] strategy with 100-step sampling. W e train the netw ork with an NVIDIA A100 GPU for 72K iterations, with a duration of 96 hours. F or the classification task, w e use a 3D ResNet for all mo dalities input. The 15 classifier is trained using the A dam W optimizer with a learning rate of 0 . 005 , a w eight decay of 10 − 6 , and a batc h size of 32 for 5K iterations. 4.3. Baselines Our baseline metho ds include Pix2Pix [43], CycleGAN [36], RegGAN [52], ResVit [17], BBDM [10], and BBDM-LDM [10]. ResVit [17] is a GAN-based metho d that in tegrates ResNet and ViT as bac kb ones, designed for medical image translation. Unfortunately , other GAN-based MRI to PET transla- tion approaches do not pro vide open-source co de [16, 18, 12]. T o ensure the inclusion of represen tative GAN-based metho ds in our comparison, w e implemen ted the widely-used image translation tec hniques Pix2Pix [43] and CycleGAN [36], as w ell as RegGAN [52], a medical image translation ap- proac h designed primarily for multi-con trast MRI translation. While none of the state-of-the-art DM-based translation metho ds has b een prop osed for MRI to PET translation, BBDM [10], a method mo deling image translation as a sto c hastic Brownian Bridge pro cess, stands out for its exceptional repli- cabilit y and p erformance. Thus w e select it for adaptation and comparison. W e also include its v ariation BBDM-LDM, whic h is based on the latent dif- fusion models (LDM) [28]. W e use the same training and ev aluation data in all baseline metho ds as P AST A. 4.4. Evaluation Setup W e conduct a comprehensive ev aluation of all metho ds b oth qualita- tiv ely and quan titatively . The following metrics b et w een the GT and syn- thesized PET are computed: mean absolute error (MAE ↓ ), mean squared error (MSE ↓ ), p eak signal-to-noise ratio (PSNR ↑ ), and structure similarit y index (SSIM ↑ ). T o further v alidate the preserv ation of pathology on the syn thesized PET, w e implement a do wnstream AD classification task with 5-fold cross-v alidation. W e use balanced accuracy (BA CC), F1-Score, and area under the R OC curv e (A UC) to ev aluate the classification results. F or qualitativ e assessmen t, we presen t our generativ e results, additional results on 3D-SSP maps, as well as the clinical ev aluation from our collab orated ph ysicians. W e further in vestigate the impact of individual clinical data and fairness ev aluation. The ev aluation of the computational costs of all metho ds can b e found in Appendix A. 16 B B D M G T P ET P A S T A ( O u r s ) R e s V i t P i x 2P i x C y c l e G A N M R I N o r m a l A D B B D M - L D M Figure 5: Qualitative comparison of cross-mo dalit y synthesis metho ds. The first row shows images from a normal control sub ject with no obvious pathology , and the second row shows an AD patient with obvious hypometab olism in the temp oroparietal lob e (b ottom left and righ t parts). The left temp oroparietal lob e is magnified in the third ro w. F or the normal sub ject, most baselines reco ver the structure and metab olic information w ell; for the AD sub ject, P AST A demonstrates sup erior generation fidelity and pathology preserv ation. 5. Results and Discussion 5.1. Qualitative R esults and Clinic al Evaluation Fig. 5 presents qualitative comparisons of MRI to PET translation re- sults for P AST A and state-of-the-art baseline metho ds on the ADNI dataset. These visual results, analyzed in co operation with our clinical exp erts, clearly sho w that P AST A pro duces PET scans with higher fidelit y and closer resem- blance to the ground truth (GT) PET than other metho ds. F or metho ds Pix2pix and CycleGAN, the generated scans deviate significantly from the GT PET scans, with noticeable artifacts and inconsistencies. F or AD pa- tien ts, the generated PET scans from P AST A accurately capture the reduced metab olism in the temp oroparietal lob e, a key region highly asso ciated with AD, as observed in the GT PET scan. Another DM-based mo del, BBDM, effectiv ely preserves the structural details but struggles to correctly translate pathological information. Its LDM-based v ariation, BBDM-LDM, also falls short in main taining pathology . ResVit, a mo del developed sp ecifically for medical translation, improv es pathology aw areness but sacrifices accuracy in anatomical structures. Ov erall, P AST A demonstrates superior p erfor- mance, achieving a remark able balance b et ween preserving b oth structural and pathological details consisten t with the GT scans. 17 T o v alidate P AST A’s clinical efficacy , w e sought feedbac k from our clinical collab orators regarding the fidelit y and pathological accuracy of the gener- ated PET scans. According to their ev aluations, our generated PET scans are realistic and comparable to the real PET. While the generated scans app ear generally smo other, this is not considered a concern in clinical prac- tice, as n uclear physicians commonly apply filters to PET images, and AD diagnosis do es not rely on high-resolution edge details [44]. The syn thesized PET scans for AD patien ts show pathological patterns consistent with ac- tual data, alb eit less pronounced. This is exp ected, as PET synthesis relies on structural MRI, a mo dalit y less sensitiv e to functional neuro degenerativ e abnormalities. Nonetheless, th e syn thesized PET s still exhibit higher patho- logical sensitivity for AD diagnosis compared to their corresp onding MRI inputs. 5.2. Quantitative R esults W e rep ort the quantitativ e metrics measuring the absolute errors and structural similarities b et w een GT and syn thesized PET for differen t meth- o ds in T able 1 and T able 2. On the ADNI dataset, consisten t with the qualitativ e results, P AST A generates PET scans with the highest quality , obtaining the lo west MAE (0.0345 ± 0.0051), MSE (0.0043 ± 0.0010), and highest PSNR (24.59 ± 0.88), SSIM (86.29 ± 1.19%), represented as the mean ± standard deviation of the quan titative metrics across the whole test sam- ples. The DM-based metho d BBDM consisten tly has the second-b est results, with its LDM-based v ariation BBDM-LDM similar p erformance. Ho wev er, the other GAN-based baselines, esp ecially CycleGAN, cannot reac h on-par p erformance. The results on the in-house dataset are generally sligh tly lo wer compared to the ADNI dataset, likely due to the limited amoun t of training data a v ailable. T o prev en t an y bias due to the single split on the limited in-house data, w e further conducted a 5-fold cross-v alidation on different metho ds. Results sho wn in T able 3 deliv er similar o verall trend as observed in the ADNI dataset, with P AST A obtaining the low est MAE of 0.0430 ± 0.0008, MSE of 0.0061 ± 0.0002, and the highest PSNR of 23.20 ± 0.06, SSIM of 85.4 ± 0.4%. Compared to the other baseline metho ds, P AST A also ac hieved the smallest v ariation among differen t folds across four metrics, in- dicating its stable and robust p erformance. P airwise statistical comparisons w ere p erformed b et w een P AST A and all baseline metho ds using the tw o-sided Wilco xon signed-rank test on all quan titativ e metrics. Across b oth datasets, the results consisten tly yielded a p -v alue < 0 . 0001 , demonstrating that the 18 Data Metho d MAE ( × 10 − 2 ) ↓ MSE ( × 10 − 2 ) ↓ PSNR ↑ SSIM(%) ↑ ADNI CycleGAN [36] 9.83 ± 0.92 2.61 ± 0.42 16.38 ± 0.66 47.48 ± 2.36 Reg-GAN [52] 8.66 ± 1.03 2.47 ± 0.48 16.66 ± 0.83 55.70 ± 1.31 Pix2Pix [43] 5.56 ± 0.43 1.15 ± 0.14 19.90 ± 0.49 73.23 ± 1.42 ResVit [17] 6.72 ± 0.72 1.74 ± 0.24 19.40 ± 0.59 69.83 ± 2.08 BBDM-LDM [10] 3.96 ± 0.69 0.54 ± 0.15 23.75 ± 1.01 84.25 ± 1.30 BBDM [10] 3.88 ± 0.47 0.56 ± 0.11 23.37 ± 0.76 84.55 ± 1.36 P AST A (Ours) 3.45 ± 0.51 0.43 ± 0.10 24.59 ± 0.88 86.29 ± 1.19 T able 1: Quantitativ e comparison betw een the baselines on the ADNI dataset. W e rep ort the mean ± standard deviation across the test set. Data Metho d MAE ( × 10 − 2 ) ↓ MSE ( × 10 − 2 ) ↓ PSNR ↑ SSIM(%) ↑ In-house CycleGAN [36] 15.10 ± 1.40 4.76 ± 1.06 15.29 ± 0.68 29.30 ± 2.50 Reg-GAN [52] 10.83 ± 1.52 2.47 ± 0.52 16.17 ± 0.91 42.02 ± 2.25 Pix2Pix [43] 9.27 ± 1.62 2.32 ± 0.93 18.50 ± 0.95 58.37 ± 5.68 ResVit [17] 6.05 ± 1.48 1.31 ± 0.93 19.18 ± 1.37 65.86 ± 5.17 BBDM-LDM [10] 4.66 ± 2.42 0.73 ± 0.50 22.71 ± 4.36 79.88 ± 7.25 BBDM [10] 4.85 ± 1.69 0.61 ± 0.39 23.03 ± 3.11 52.07 ± 16.9 P AST A (Ours) 4.22 ± 0.74 0.60 ± 0.19 24.42 ± 1.21 85.90 ± 2.02 T able 2: Quantitativ e comparison b et ween the baselines on the in-house dataset. W e rep ort the mean ± standard deviation across one balanced test split. p erformance impro vemen t gained by P AST A is statistically significan t ov er the baseline metho ds. These results confirm the p oten tial of diffusion mo dels in medical image translation. 5.3. Classific ation R esults for AD Diagnosis T o assess the v alue of generated 3D PET scans in AD diagnosis, we train AD classifiers on MRI, MRI with clinical data (MRI+ c ), GT PET, and syn thesized (Syn) PET scans, resp ectiv ely . W e use ResVit, BBDM and P AST A for the PET generation. A 3D ResNet is employ ed as the classifier to ev aluate all mo dalities input. T o mitigate p oten tial domain shift issues and ensure fair comparison, w e train and test classifiers on images from the same source. W e also use the same data splits for the classifier as for P AST A. T a- ble 4 rep orts the classification results on the ADNI dataset, and, as exp ected, 19 Data Metho d MAE ( × 10 − 2 ) ↓ MSE ( × 10 − 2 ) ↓ PSNR ↑ SSIM(%) ↑ In-house CycleGAN [36] 11.7 ± 1.91 2.88 ± 0.95 16.09 ± 1.14 31.8 ± 6.6 RegGAN [52] 10.8 ± 1.41 2.53 ± 0.65 16.91 ± 0.82 41.5 ± 2.6 Pix2Pix [43] 8.75 ± 0.40 2.03 ± 0.11 18.73 ± 0.19 58.3 ± 2.4 ResVit [17] 7.09 ± 0.74 1.87 ± 0.34 19.93 ± 0.48 68.3 ± 2.5 BBDM-LDM [10] 4.48 ± 0.17 0.66 ± 0.05 23.04 ± 0.37 78.9 ± 0.7 BBDM [10] 4.70 ± 0.62 0.69 ± 0.05 22.88 ± 0.67 71.0 ± 12.0 P AST A (Ours) 4.30 ± 0.08 0.61 ± 0.02 23.20 ± 0.06 85.4 ± 0.4 T able 3: Quantitativ e comparison b et ween the baselines on the in-house dataset with 5- fold cross-v alidation. W e rep ort the mean ± standard deviation across the fiv e test splits. GT PET has a higher p erformance than MRI across all metrics. The results for P AST A also improv e ov er MRI across all metrics with an increase of o ver 4%. Statistical significance testing further supp orts this improv emen t. The McNemar’s test on BA CC yielded a p -v alue of 0.022, with a b o otstrapped 95% confidence in terv al (CI) for the difference ranging from 1.61% to 10.6%. Similarly , the DeLong test on AUC scores pro duced a p -v alue of 0.00016, with a b o otstrapped 95% CI for the difference betw een 3.20% and 10.7%. The inclusion of clinical data only improv ed MRI’s BACC b y 2%, suggesting that P AST A’s enhanced pathology aw areness is likely attributed to its more effectiv e learning of the interaction b et ween MRI and clinical data. While the results for P AST A in BACC fall b et ween those of MRI and GT PET, it almost matches GT PET in F1-Score and achiev es the highest AUC. In con trast, results for BBDM are w orse than those of MRI, confirming its lim- Input BA CC ↑ F1-Score ↑ A UC ↑ MRI 79.23 ± 4.30 74.97 ± 5.95 85.88 ± 3.79 MRI+ c 81.51 ± 3.16 77.83 ± 3.83 89.19 ± 1.41 GT PET 87.02 ± 2.35 80.77 ± 2.62 89.04 ± 1.88 Syn PET (ResVit) 78.54 ± 4.15 74.41 ± 5.28 81.80 ± 4.95 Syn PET (BBDM) 72.93 ± 8.48 70.76 ± 6.02 83.29 ± 5.13 Syn PET (P AST A) 83.41 ± 2.67 79.98 ± 3.51 91.63 ± 2.21 T able 4: Classification results for Alzheimer’s disease classification with different input mo dalities. 20 Metho d MAE RO I ( × 10 − 4 ) ↓ MSE RO I ( × 10 − 4 ) ↓ PSNR RO I ↑ SSIM RO I (%) ↑ CycleGAN [36] 18.54 ± 4.94 4.51 ± 2.23 32.73 ± 2.13 99.41 ± 0.16 Reg-GAN [52] 21.06 ± 4.03 6.69 ± 1.86 30.88 ± 0.93 99.09 ± 0.10 Pix2Pix [43] 12.59 ± 2.14 2.29 ± 0.64 35.46 ± 1.21 99.52 ± 0.06 ResVit [17] 13.12 ± 2.20 2.86 ± 0.69 34.49 ± 1.34 99.42 ± 0.11 BBDM-LDM [10] 10.79 ± 2.36 1.63 ± 0.63 37.03 ± 1.69 99.67 ± 0.08 BBDM [10] 10.54 ± 2.24 1.66 ± 0.61 36.96 ± 1.70 99.64 ± 0.09 P AST A (Ours) 9.07 ± 2.21 1.24 ± 0.44 38.29 ± 1.65 99.74 ± 0.07 T able 5: Pathology-localized quantitativ e comparison on the ADNI dataset using ROI- based metrics computed within AD-related MetaR OI regions. W e rep ort the mean ± standard deviation across the test set. itations in pathology transfer, consisten t with the qualitative ev aluation in Fig. 5. The ResVit results sho w improv ed accuracy compared to BBDM, attributed to its b etter pathology aw areness demonstrated in the qualita- tiv e results, yet are still low er than for MRI. These results underscore the high p oten tial of P AST A for AD diagnosis and highligh t the necessity of pathology-a ware transfer. 5.4. Patholo gy-L o c alize d Evaluation T o assess pathology preserv ation b ey ond global image fidelit y , we ev al- uated all metho ds using pathology-lo calized metrics computed within AD- related MetaROIs [35] regions, namely MAE RO I , MSE RO I , PSNR RO I , and SSIM RO I . As sho wn in T able 5, P AST A consisten tly outp erforms all baseline metho ds across all ROI-based metrics on the ADNI dataset, ac hieving the lo west MAE RO I of 9 . 07 ± 2 . 21 × 10 − 4 , the highest PSNR RO I of 38 . 29 ± 1 . 65 and SSIM RO I of 99 . 74 ± 0 . 07 %. This demonstrates its sup erior generation fidelit y sp ecifically within disease-relev ant regions. Across all metrics, P AST A and its v ariants significantly outp erform comp eting baseline metho ds ( p -v alues < 0 . 0001 , tw o-sided Wilcoxon signed-rank test). 5.5. Influenc e of the Clinic al Data T o inv estigate the impact and sensitivit y of individual clinical v ariables from the ADNI dataset on the generation pro cess, w e conducted an addi- tional exp eriment during inference. F or eac h of the six clinical v ariables: Age, Gender, Education level (Edu), MMSE, AD AS-Cog-13 (AD AS), and 21 Ap oE4, w e retained its original v alue while neutralizing the other five b y setting them to their resp ectiv e mean v alues deriv ed from the dataset. The outcomes were then compared against the original configuration, where all v ariables were preserv ed (denoted as “All”). T o introduce a stronger p ertur- bation, CN sub jects are assigned the mean of the AD group and vice versa. T able 6 rep orts the mean absolute error (MAE, × 10 − 2 ) for the generation across the test set. T o quantitativ ely assess their pathology influence, we also presen t the MAE within the AD-related MetaROIs [35] regions (MAE RO I , × 10 − 4 ). AD AS emerges as the most influential v ariable, showing the small- est deviation from the baseline when preserved alone for b oth CN and AD sub jects, follow ed b y MMSE. While other v ariables, suc h as Age, Education, and Ap oE4, are comparativ ely less impactful. Age Gender Edu MMSE ADAS Ap oE4 All CN MAE ↓ 3.34 3.32 3.34 3.30 3.30 3.34 3.26 MAE ROI ↓ 9.82 9.61 9.68 9.10 8.46 9.58 8.42 AD MAE ↓ 3.57 3.57 3.57 3.55 3.57 3.57 3.57 MAE ROI ↓ 10.16 10.12 10.17 10.13 9.94 10.14 9.84 T able 6: Results of sensitivity analysis, keeping one clinical v ariable at a time while neutralizing the rest during inference on ADNI test set. The outcomes are compared against the original configuration, where all v ariables were preserved (All). (MAE: × 10 − 2 , MAE RO I : × 10 − 4 ) 5.6. Neur ostat 3D-SSP Maps for PET Sc ans Neurostat 3D-SSP (Neurological Statistical Image Analysis Soft ware 3D Stereotactic Surface) [45] is a statistical quantitativ e brain mapping to ol designed to in vestigate brain disorders and assist clinical diagnosis using PET. Widely adopted in clinical settings, it has contributed to iden tify- ing functional abnormalities in v arious brain disorders and supp orts accu- rate diagnoses. 3D-SSP ev aluates the statistical significance of differences in cortical metab olic activit y b et w een a patient and age-matc hed health y con- trols. The pro cess inv olves spatially transforming trans-axial brain images to match a 3D reference brain from a stereotactic atlas, extracting p eak cor- tical metab olic activit y v alues, and pro jecting them onto a surface rendition of the brain. The resulting pro jections are statistically compared pixel-wise against a database of PET scans in age-matc hed controls, pro ducing Z-score 22 G T PET P A S T A BB DM R esV it Pi x2 Pi x Cy c leG A N BB DM - LDM R i g h t l a t e r a l Sup e r i or P os t e r i or L e f t m e d i a l Righ t l a t e r a l Sup e r i or P o s t e r i o r L e f t m e d i a l Health y sub ject A lz heim er ´ s pat ient MAE M AE ___ ___ 0 . 1 2 0 0 . 1 2 8 0 . 1 2 9 0 . 1 4 8 0 . 2 1 1 0 . 2 5 6 0 . 1 4 5 0 . 1 5 5 0 . 1 5 8 0 . 1 5 3 0 . 1 8 9 0 . 2 4 4 Figure 6: Z-score maps pro duced by Neurostat 3D-SSP for a health y (left) and an Alzheimer’s patien t (right). W e present global metab olic Z-score maps for the ground- truth (GT) PET and synthesized PET scans from each metho d in different brain cortical areas. The mean absolute errors (MAE) b et ween the maps from synthesized PET s and the GT are displa yed alongside. maps that highligh t significan t deviations [46]. This to ol provides a reliable quan titative metho d for ev aluating the pathology consistency of synthesized PET scans. W e presen t the generated Z-score maps b y 3D-SSP for ground- truth (GT) PET, synthesized PET from P AST A and baseline metho ds, as w ell as the mean absolute error b et ween the GT Z-score maps and those from synthesized ones in Fig. 6. These maps are also used for clinical ev alua- tion b y our collab orating ph ysicians. F or a healthy control sub ject, P AST A, BBDM, and BBDM-LDM pro duce metab olic patterns closely matc hing the GT PET, whereas ResVit, Pix2Pix, and CycleGAN in tro duce abnormalities absen t in the actual data. F or an Alzheimer’s patien t, P AST A accurately iden tifies pathological regions consisten t with the GT PET, though with less pronounced patterns. Other DM-based mo dels, BBDM and BBDM-LDM, fail to reco ver these pathological features. ResVit sho ws impro ved patholog- ical reco very , yet its sub optimal p erformance in the health y control sub ject raises concerns regarding its reliability . Pix2Pix and CycleGAN exhibit sig- nifican t deviations from GT PET in b oth cases. Overall, the 3D-SSP Z-score 23 maps indicate that P AST A ac hieves sup erior pathology a wareness compared to other DM- and GAN-based image translation metho ds. 5.7. A blation Study 5.7.1. Imp ortant Designs in the Pr op ose d F r amework W e perform ablativ e exp erimen ts to v erify the effectiv eness of several imp ortan t designs in our framework, including the CycleEx, in tegration of pathology priors ( λ R ), and clinical data ( c ). Other ablation studies include: 1) a different wa y to integrate multi-modal conditions — simply concatenat- ing multi-scale features in the cond itional mo dule instead of using AdaGN for the m ulti-mo dal fusion, denoted as ConcatF eats; 2) a differen t predefined task in the conditioner arm, e.g., MRI reconstruction, denoted as M2M; 3) alternativ e in tegration p ositions for multi-modal conditions — either exclu- siv ely within the conditioner arm (denoted as CondCond), or in b oth the conditioner and denoiser arms (denoted as CondBoth), rather than solely in the denoiser arm; 4) different loss w eights ( λ task ) for the predefined task; 5) making the constant weigh t factor λ R on the MetaROIs area in the pathol- ogy priors λ R learnable, denoted as λ R learn; 6) a new adaptiv e condi- tional module with slice-a ware adaptiv e group normalization (denoted as SA-A daGN), injecting slice position as priors in to the generation pro cess (see detailed description in App endix B); 7) adding an auxiliary classifier consistency loss (denoted as CCL) in to the training ob jective to in tegrate discriminativ e signal from the disease lab el sup ervision (see detailed descrip- tion in App endix C). As sho wn in T able 7, CycleEx esp ecially elev ates the generation quality by a large margin. The choice of the predefined task in the conditioner arm and its loss w eighting parameter also exhibit a relativ ely high impact. SA-A daGN and CCL deliver p erformance largely comparable to the baseline. Incorp orating the learnable weigh t factor λ R within the MetaR OIs prior on top of the CCL mo dule offered a marginal improv ement, leading to a slight improv emen t in the MAE and SSIM compared to adding CCL alone. Although they exhibit sligh tly higher MAE, the accompanying SSIM improv ement suggests a p oten tial adv antage in preserving the struc- tural fidelit y of the translated PET. In addition, we present error maps of generated PET scans from ablation studies on differen t design elemen ts of P AST A for an AD-diagnosed sub ject, compared to its ground-truth PET, in Fig. 7. The results rev eal that mo d- ifications to P AST A consisten tly increase error magnitudes in regions with pathological features, particularly within the parietal lob e across the three 24 Ablation MAE ( × 10 − 2 ) ↓ MSE ( × 10 − 2 ) ↓ PSNR ↑ SSIM (%) ↑ w/o CycleEx 3.99 0.54 23.64 85.14 w/o λ R 3.67 0.48 24.19 85.95 w/o c 3.57 0.46 24.39 86.12 P AST A (ConcatF eats) 3.61 0.48 24.04 85.00 P AST A (M2M) 3.78 0.50 23.78 84.77 P AST A (CondCond) 3.55 0.45 24.32 86.11 P AST A (CondBoth) 3.61 0.46 24.29 86.09 P AST A ( λ task = 0.01) 3.65 0.49 24.01 85.49 P AST A ( λ task = 1) 3.70 0.49 24.11 85.71 P AST A ( λ task = 10) 3.81 0.48 24.04 83.24 P AST A ( λ R learn) 4.27 0.62 23.08 86.13 P AST A (SA-AdaGN) 3.81 0.52 23.77 87.74 P AST A (w/ CCL) 3.91 0.53 23.73 88.01 P AST A (w/ CCL, λ R learn) 3.89 0.53 22.95 88.39 P AST A 3.45 0.43 24.59 86.29 T able 7: Ablation studies on imp ortan t designs in P AST A. w/ o 𝒄 w/ o 𝝀 𝑹 P AS T A w/ o Cy cle Ex Conc a tF ea ts M2M Cond Cond Cond Both Axial Cor on al Sagit t al G T P ET Figure 7: Error maps for ablation studies on imp ortan t designs in P AST A, for an AD- diagnosed sub ject. W e show its ground-truth (GT) PET and the a veraged error maps of the scan along three directions resp ectively . Sp ecifically , we circle the areas that are highly influenced by AD in red. anatomical planes, highlighted with red circles. Among the v arious factors, the pathology priors ( λ R ) and the CycleEx strategy exert a particularly pro- nounced impact on the quality of the generated outputs. This observ ation emphasizes the critical role of differen t comp onen ts in P AST A for enhancing 25 N MAE ( × 10 − 2 ) ↓ MSE ( × 10 − 2 ) ↓ PSNR ↑ SSIM(%) ↑ 1 4.05 0.60 23.10 83.09 5 3.64 0.50 24.07 85.47 11 3.55 0.46 24.33 85.79 15 3.45 0.43 24.59 86.29 19 3.59 0.45 24.26 84.79 T able 8: Ablation on the num b er N of input neighboring slices. the mo del’s pathology a w areness. 5.7.2. Input Numb er of Neighb oring Slic es The 2.5D strategy for the volumetric generation in tro duced b y P AST A caters to the input channel with N consecutiv e neighboring slices of the input slice along the same direction. After training, the netw ork also pro duces the tar- get slice with its N neighbors for each slice p osition, and the accum ulated o verlapping slices are linearly av eraged for the final 3D scan. W e ev aluate the influence of the num b er N of input neigh b oring slices on the quality of generated PET scans. F rom the results shown in T able 8, increasing the v alue of N correlates with enhanced accuracy of the synthesized PET scans up to a certain threshold. How ever, b eyond this threshold, further incre- men ts in N lead to a decreased generation accuracy . This phenomenon ma y b e attributed to the observ ation from Figure 8 that as N increases, the ap- plied strategy enhances the in ter-slice consistency , alb eit it induces a more pronounced smo othing effect on the generated scans. An optimal threshold for high-qualit y generation is identified at N = 15 . F or N < 15 , the syn- thesized scans exhibit artifacts along the t wo additional axes (coronal and sagittal directions, giv en that w e use axial slices as input), due to the slice inconsistency during generation. Con versely , for N > 15 , the resulting scans are sub ject to excessive smo othing, leading to a loss of detailed information. 5.7.3. Dir e ctions of Input Slic es and Cr oss-Axis Consistency Three-dimensional brain scans encompass three anatomical planes: axial, coronal, and sagittal planes. Our framework primarily tak es slices from the axial plane as input. W e mak e an assessment of the impact when receiving input slices from the coronal and sagittal planes instead. F urthermore, we a verage the synthesized scans from these three distinct netw orks, eac h trained on one of these planes, and compare the results qualitativ ely . Figure 9 reveals 26 G T P ET MR I 𝑵 = 𝟏 𝑵 = 𝟓 𝑵 = 𝟏𝟏 𝑵 = 𝟏𝟓 𝑵 = 𝟏𝟗 Axial Co r onal Sa git t al Figure 8: Ablation on input n umber N of neigh b oring slices. W e demonstrate the syn the- sized PET scans with v arious N s in three directions (axial, coronal, and sagittal), given that axial slices are used as input to the netw ork. that the anatomical direction of input slices exerts only sligh t effects on the qualit y of the synthesized PET. F urthermore, the 3-direction av eraged scan also exhibits a minimal difference in quality . Quan titatively , reconstruction qualit y is consistent across all three orthogonal axes: taken the axial direction as input as an example, w e obtain the image qualit y scores across three directions on the ADNI dataset as follows: SSIM (axial/coronal/sagittal) = 86.29%/86.41%/86.31% and PSNR = 24.59/23.82/24.37 dB, respectively , indicating no axis-dep endent degradation or cross-axis incoherence. Figure 9 further shows minimal visual differences across planes and no artifacts or tearing; the 3-direction a veraged scan is comparable to an y single-axis mo del, reinforcing cross-axis spatial consistency . Ov erall, the results demonstrate the robustness and spatial coherence of the prop osed volumetric generation strategy in P AST A across v arious slice directions. 5.8. F airness Evaluation F airness is crucial in medical imaging. It is essential that deep learning mo dels emplo yed in medical applications exhibit few biases tow ards sp ecific demographic groups, including age, gender, or sp ecific patient categories. T o ev aluate fairness, we assessed P AST A’s p erformance across diverse patien t cohorts with v arying ages, genders, and diagnostic profiles on the test set. The results presented in T able 9 indicate that the errors of the synthesized PET across different groups exhibit minimal v ariance, with no statistically 27 G T PE T Inp u t A xial D ir e ctio n MRI Axia l Cor onal Sa git t a l Inp u t Cor on al D ir e ctio n Inp u t Sagit t al D ir e ctio n 3 - d ir e ction A v e r ag e Figure 9: Ablation on the directions of input slices and the av erage of syn thesized scans from the three directions. The influence of the input slice direction is minimal on the syn thesized PET scans. significan t differences. Using the Wilcoxon rank-sum test and Bonferroni cor- rection for m ultiple testing, all adjusted p-v alues exceed 0.05. These results indicate that P AST A main tains consisten t accuracy and p erforms equitably across all examined demographic categories. 6. Conclusion W e presented P AST A, a no vel framew ork for brain MRI to PE T transla- tion leveraging conditional diffusion mo dels. P AST A distinguishes itself from existing DM-based approaches by excelling in preserving b oth structural and pathological patterns in the target mo dalit y , which is enabled by its highly in teractive dual-arm arc hitecture with multi-modal conditioning. The inclu- sion of CycleEx and a v olumetric generation strategy further elev ated its capabilit y to produce high-qualit y 3D PET scans. Our comprehensiv e abla- tion study confirmed the effectiveness of these key designs. In AD diagnosis, P AST A achiev ed an improv ed AUC compared to real PET scans and sur- passes MRI in diagnostic accuracy . Its distinct pathology aw areness lik ely stems from the effectiv e integration of m ulti-mo dal conditions and pathology priors, together with the synergy b et ween its k ey comp onen ts. Sp ecifically , the incorp oration of relev ant clinical data alongside MRI enables the mo del 28 Demographics Groups MAE ( × 10 − 2 ) ↓ Age < 60 3.55 ± 0.55 60 - 70 3.30 ± 0.36 70 - 80 3.44 ± 0.50 > 80 3.66 ± 0.67 Gender Male 3.52 ± 0.57 F emale 3.35 ± 0.41 Diagnosis CN 3.26 ± 0.44 AD 3.57 ± 0.46 MCI 3.47 ± 0.56 T otal 3.45 ± 0.51 T able 9: The mean absolute error (MAE) of syn thesized PET on the test set among differen t demographics. to capture complementary cues that strengthen its sensitivity to disease- related changes. The use of MetaR OIs as pathology priors further directs the mo del’s focus to ward brain regions most affected b y Alzheimer’s dis- ease, such as key h yp ometab olic areas linked to abnormal metab olic activity . Finally , the CycleEx training strategy facilitates dual-arm information ex- c hange, allowing the net w ork to extract richer, task-sp ecific features while preserving b oth structural integrit y and pathological details during transla- tion. These design c hoices collectiv ely ensure that the generated PET images retain clinically meaningful pathological patterns, rather than merely repro- ducing structural information. A limitation of this study is the absence of a formal clinical reading study to quantitativ ely ev aluate the diagnostic utilit y of the syn thetic PET, which needs to b e addressed in future w ork. Ov erall, P AST A demonstrated high p oten tial in bridging the gap b et ween structural and functional brain degradation pro cesses, offering promising adv ancements for clinical applications. F unding: This w ork w as supp orted b y the German Researc h F oundation (DF G) and the Munich Center for Mac hine Learning (MCML). A c knowledgemen ts: W e gratefully ackno wledge the Leibniz Supercom- puting Cen tre for providing the computing resources. 29 App endix A. Computational Costs W e b enc hmarked the computational costs of different metho ds under iden tical hardware and training sc hedules (batch size = 6 ). Results are summarized in T able A.1. Among the baseline metho ds, BBDM requires 70 ms/step with 3.46 GB GPU memory , and BBDM-LDM requires 98 ms/step with 4.05 GB. ResViT incurs 308 ms/step with 6.94 GB. GAN-based mo dels suc h as Pix2Pix and CycleGAN remain faster and ligh ter, whereas Reg- GAN requires higher time p er step (214 ms) despite mo dest memory usage (3.78 GB). In this context, P AST A without CycleEx sits mid-pac k in terms of sp eed and memory , b eing slow er than BBDM and CycleGAN but faster than BBDM-LDM, with memory usage comparable to Pix2Pix. W e then compared P AST A in the setup with and without CycleEx. With- out CycleEx, P AST A requires 5.6 GB GPU memory and 82 ms/step. Incor- p orating CycleEx increases training step time by ∼ 3.68 × (+268%) and p eak GPU memory b y ∼ 3.29 × (+229%), yielding 302 ms/step and 18.40 GB mem- ory usage. This ov erhead arises from the three additional forw ard/backw ard passes of the CycleEx pathw a ys (without extra learnable parameters nor it- erativ e sampling during training). Imp ortan tly , inference time is unaffected since CycleEx is only inv oked during training as additional sup ervision. As sho wn in our ablation study (T able 5), CycleEx’s added computation trans- lates in to measurable accuracy impro vemen ts: MAE improv es b y more than 12% (0.0345 with CycleEx vs. 0.0399 without CycleEx), alb eit doubling the total training time (96 h vs. 48 h on the ADNI dataset), with zero inference p enalt y . Metho d GPU Memory (GB) Time (ms/step) CycleGAN [36] 4.70 67 RegGAN [52] 3.78 214 Pix2Pix [43] 5.02 25 ResViT [17] 6.94 308 BBDM-LDM [10] 4.05 98 BBDM [10] 3.46 70 P AST A (Ours, w/o CycleEx) 5.60 82 P AST A (Ours, w/ CycleEx) 18.40 302 T able A.1: Computational cost of different metho ds under identical setup (batch size = 6 ). 30 App endix B. Slice-A w are A daptive Group Normalization W e explored P AST A with Slice-A w are A daptiv e Group Normalization (SA-A daGN) to exp ose the diffusion mo del to through-plane position of the targeting generated slices. A normalized slice p osition z ∈ [0 , 1] is first em- b edded using MLP and, analogously to the timestep, pro duces p er-blo c k scale and shift parameters that mo dulate the group normalization in every ResNet blo c k across all UNet resolutions. The resulting conditional signal is com bined with the existing conditioning (timestep t , task-sp ecific represen- tations h m , and clinical data c ) as input to the adaptive conditional mo dule, resulting in an up dated SA-A daGN from Eq. 8 as b elo w: SA-A daGN ( h , t, c , h m , z ) = z s c s ( h m ( t s GroupNorm ( h ) + t b ) + z b , (B.1) ( z s , z b ) = MLP ( z ) . Conceptually , SA-A daGN aims to impro ve slice consistency in our prop osed 2.5D volumetric generation strategy , b y encoding the input slice p osition di- rectly in the feature space. In practice, as shown in T able 7, SA-AdaGN ac hieved p erformance broadly comparable to the original arc hitecture, show- ing a slight increase in MAE but an improv ement in SSIM, which p oin ts to a p oten tial benefit in preserving structural information. F urthermore, as sho wn in T able B.2, SA-A daGN reached a slightly b etter p erformance with regards to the pathology-localized metrics, indicating enhanced fidelity within disease-relev ant regions, even when global metrics show mixed b eha v- ior. Introducing the learnable w eight factor λ R within the MetaROIs prior on top of SA-A daGN pro vided only a marginal b enefit, resulting in a slight impro vemen t in the MAE in the ROI area ( 8 . 76 ± 3 . 14 × 10 − 4 compared to 8 . 96 ± 2 . 64 × 10 − 4 ), with no improv emen t observ ed across the remaining quan titative metrics. F or simplicity , we therefore recommend the baseline P AST A configuration. Nev ertheless, this presented arc hitectural mo difica- tion pro vides insights to inform future generativ e netw ork design in medical imaging for incorp orating additional through-plane positional priors. App endix C. Auxiliary Classifier Consistency Loss W e exp erimen ted augmen ting the training pro cess of P AST A with an in- lo op auxiliary classifier that enforces disease lab el consistency on the trans- lated PET images. Concretely , at each training step, the denoiser arm x θ predicts the clean PET scan ˆ P 0 from the noised input, whic h is fed to a 31 ResNet-18 classifier f ϕ to obtain logits f ϕ ( ˆ P 0 ) . W e use a cross-entrop y (CE) p enalt y with the ground-truth lab el y as an auxiliary classifier consistency loss as: L cls = CE f ϕ ( ˆ P 0 ) , y , (C.1) resulting in the final o verall training ob jective of P AST A as: L = λ task ∗ L task + λ dif f ∗ L dif f + λ cy cle ∗ L cy cle + λ cls ∗ L cls , (C.2) where λ cls is a constant v ariable controlling the con tribution of this auxiliary term, where w e set λ cls = 0 . 001 after the hyperparameter search. The clas- sifier f ϕ can b e initialized either from pretrained weigh ts (optionally frozen during training) or from random initialization and trained join tly with the diffusion mo del. W e ev aluated these alternatives and observed that training the classifier from scratc h achiev ed p erformance comparable to the pretrained v arian ts. F or simp licit y and repro ducibilit y , w e therefore adopted the joint training from scratc h as our default configuration. T o provide a stable sup er- vision signal, w e activ ate the auxiliary classifier consistency loss after a brief w arm-up p erio d, once the generated PET images are sufficiently realistic for reliable classification. This loss term addition aims to couple a discrimina- tiv e signal in the generativ e pro cess, which can guide the syn thesis tow ard pathology-a ware, semantically faithful outputs and may aid in terpretabilit y . Empirically , as sho wn in the ablation results T able 7, the added classifier consistency loss (CCL) yielded comparable results to our baseline P AST A setup, with a slight increase in pixel-wise error but an improv ement in SSIM, suggesting a p oten tial adv antage in preserving structural fidelity . In the pathology-lo calized metrics, as shown in T able B.2, CCL also reac hed com- parable results to the baseline P AST A, with a sligh tly b etter p erformance in Metho d MAE ROI ( × 10 − 4 ) ↓ MSE ROI ( × 10 − 4 ) ↓ PSNR ROI ↑ SSIM ROI (%) ↑ P AST A 9.07 ± 2.21 1.24 ± 0.44 38.29 ± 1.65 99.74 ± 0.07 P AST A (CCL) 9.03 ± 3.09 1.31 ± 0.69 38.21 ± 2.16 99.72 ± 0.10 P AST A (CCL, λ R learn) 8.75 ± 3.11 1.22 ± 0.71 38.51 ± 2.15 99.75 ± 0.09 P AST A (SA-AdaGN) 8.96 ± 2.64 1.17 ± 0.50 38.64 ± 1.75 99.76 ± 0.06 P AST A (SA-AdaGN, λ R learn) 8.76 ± 3.14 1.24 ± 0.78 38.46 ± 2.09 99.74 ± 0.09 T able B.2: Pathology-localized quantitativ e comparison on the ADNI dataset using ROI- based metrics computed within AD-related MetaR OI regions. W e rep ort the mean ± standard deviation across the test set. 32 MAE RO I . Incorp orating the learnable weigh t factor λ R within the MetaROIs prior on top of the CCL mo dule offered a marginal improv emen t, leading to a sligh t impro vemen t in the MAE in the R OI area ( 8 . 75 ± 3 . 11 × 10 − 4 compared to 8 . 96 ± 2 . 64 × 10 − 4 ), with no improv emen t observ ed across the remaining quan titative metrics. W e therefore recommend the original setup for sim- plicit y . Ho wev er, this mo dification is promising for future studies in further fostering pathology a wareness and in terpretability with discriminative learn- ing during medical image translation. 33 References [1] P . S. Aisen, J. Cummings, C. R. Jack, J. C. Morris, R. Sp erling, L. F rölich, R. W. Jones, S. A. Dowsett, B. R. Matthews, J. Raskin, P . Sc heltens, B. Dub ois, On the path to 2025: understanding the alzheimer’s disease con tinuum, Alzheimer’s research & therapy 9 (2017) 1–10. [2] L. Chouliaras, J. O’Brien, The use of neuroimaging tec hniques in the early and differential diagnosis of demen tia, Molecular psychiatry (2023). [3] N. Kyrtata, H. C. E msley , O. Sparasci, L. M. Park es, B. R. Dickie, A systematic review of glucose transp ort alterations in alzheimer’s disease, F ron tiers in Neuroscience 15 (2021) 626636. [4] C. Marcus, E. Mena, R. M. Subramaniam, Brain p et in the diagnosis of alzheimer’s disease, Clinical n uclear medicine 39 (2014) e413. [5] L. M. Bloudek, D. E. Spackman, M. Blank enburg, S. D. Sulliv an, Review and meta-analysis of biomark ers and diagnostic imaging in alzheimer’s disease, Journal of Alzheimer’s Disease 26 (2011) 627–645. [6] J. S. Keppler, P . S. Con ti, A cost analysis of p ositron emission tomog- raph y , American Journal of Ro en tgenology 177 (2001) 31–40. [7] G. B. F risoni, M. Bo cc hetta, G. Chételat, G. D. Rabinovici, M. J. de Leon, J. Ka ye, E. M. Reiman, P . Scheltens, F. Barkhof, S. E. Black, D. J. Bro oks, M. C. Carrillo, N. C. F o x, K. Herholz, A. Nordb erg, C. R. Jac k, W. J. Jagust, K. A. Johnson, C. C. Row e, R. A. Sp erling, W. Thies, L.-O. W ahlund, M. W. W einer, P . P asqualetti, C. DeCarli, F. I. N. P . I. Area, Imaging markers for alzheimer disease: whic h vs how, Neurology 81 (2013) 487–500. [8] J. Ho, A. Jain, P . Abb eel, Denoising diffusion probabilistic mo dels, in: NeurIPS, 2020. [9] P . Dhariw al, A. Nichol, Diffusion mo dels b eat gans on image synthesis, in: NeurIPS, 2021. [10] B. Li, K. Xue, B. Liu, Y. Lai, Bb dm: Image-to-image translation with bro wnian bridge diffusion mo dels, in: CVPR, 2023. 34 [11] C. Saharia, W. Chan, H. Chang, C. A. Lee, J. Ho, T. Salimans, D. J. Fleet, M. Norouzi, P alette: Image-to-image diffusion mo dels, in: ACM SIGGRAPH, 2022. [12] W. W ei, E. Poirion, B. Bo dini, S. Durrleman, N. A yac he, B. Stankoff, O. Colliot, Learning my elin con tent in m ultiple sclerosis from multi- mo dal mri through adv ersarial training, in: MICCAI, 2018. [13] H. Lan, A. D. N. Initiativ e, A. W. T oga, F. Sep ehrband, Three- dimensional self-attention conditional gan with sp ectral normalization for m ultimo dal neuroimaging synthesis, Magnetic resonance in medicine 86 (2021) 1718–1733. [14] J. Zhang, X. He, L. Qing, F. Gao, B. W ang, Bpgan: Brain p et syn- thesis from mri using generative adversarial net work for multi-modal alzheimer’s disease diagnosis, Computer Metho ds and Programs in Biomedicine 217 (2022) 106676. [15] S. Hu, B. Lei, S. W ang, Y. W ang, Z. F eng, Y. Shen, Bidirectional mapping generative adv ersarial net works for brain mr to p et synthesis, IEEE T ransactions on Medical Imaging 41 (2021) 145–157. [16] H.-C. Shin, A. Ihsani, S. Mandav a, S. T. Sreeniv as, C. F orster, J. Cha, A. D. N. Initiative, Gan b ert: Generativ e adv ersarial net w orks with bidirectional enco der representations from transformers for mri to p et syn thesis, arXiv:2008.04393 (2020). [17] O. Dalmaz, M. Y urt, T. Çukur, Resvit: Residual vision transformers for multimodal medical image synthesis, IEEE T ransactions on Medical Imaging 41 (2022) 2598–2614. [18] H.-C. Shin, A. Ihsani, Z. Xu, S. Mandav a, S. T. Sreeniv as, C. F orster, J. Cha, Gandalf: Generativ e adv ersarial netw orks with discriminator- adaptiv e loss fine-tuning for alzheimer’s disease diagnosis from mri, in: MICCAI, 2020. [19] J. Sohl-Dickstein, E. W eiss, N. Mahesw aranathan, S. Ganguli, Deep unsup ervised learning using nonequilibrium thermo dynamics, in: ICML, 2015. 35 [20] L. Zhu, Z. Xue, Z. Jin, X. Liu, J. He, Z. Liu, L. Y u, Mak e-a-volume: Lev eraging latent diffusion mo dels for cross-mo dalit y 3d brain mri syn- thesis, in: MICCAI, 2023. [21] W. Peng, E. Adeli, T. Bossc hieter, S. H. Park, Q. Zhao, K. M. P ohl, Generating realistic brain mris via a conditional diffusion probabilistic mo del, in: MICCAI, 2023. [22] M. Özb ey , O. Dalmaz, S. U. Dar, H. A. Bedel, Ş. Özturk, A. Güngör, T. Çukur, Unsupervised medical image translation with adv ersarial diffusion mo dels, IEEE T ransactions on Medical Imaging (2023). [23] T. Xie, C. Cao, Z.-x. Cui, Y. Guo, C. W u, X. W ang, Q. Li, Z. Hu, T. Sun, Z. Sang, Y. Zhou, Y. Zh u, D. Liang, Q. Jin, H. Zeng, G. Chen, H. W ang, Synthesizing p et images from high-field and ultra-high-field mr images using joint diffusion attention mo del, Medical Physics 51 (2024) 5250–5269. doi: https://doi.org/10.1002/mp.17254 . [24] Y. Li, I. Y akushev, D. M. Hedderich, C. W ac hinger, Pasta: P athology- a ware mri to p et cross-mo dal translation with diffusion mo dels, in: Med- ical Image Computing and Computer Assisted Interv ention – MICCAI 2024, Springer Nature Switzerland, Cham, 2024, pp. 529–540. [25] X. Su, J. Song, C. Meng, S. Ermon, Dual diffusion implicit bridges for image-to-image translation, in: ICLR, 2023. [26] G. Kw on, J. C. Y e, Diffusion-based image translation using disen tangled st yle and conten t representation, in: ICLR, 2023. [27] A. Q. Nichol, P . Dhariw al, Impro v ed denoising diffusion probabilistic mo dels, in: ICML, 2021. [28] R. Rombac h, A. Blattmann, D. Lorenz, P . Esser, B. Ommer, High- resolution image synthesis with latent diffusion mo dels, in: CVPR, 2022. [29] T. Salimans, J. Ho, Progressiv e distillation for fast sampling of diffusion mo dels, in: ICLR, 2022. [30] O. Ronneb erger, P . Fisc her, T. Brox, U-net: Con volutional net works for biomedical image segmen tation, in: MICCAI, 2015. 36 [31] M. F. F olstein, S. E. F olstein, P . R. McHugh, “mini-men tal state”: a practical metho d for grading the cognitive state of patien ts for the clin- ician, Journal of psyc hiatric research 12 (1975) 189–198. [32] R. C. Mohs, D. Knopman, R. C. Petersen, S. H. F erris, C. Ernesto, M. Grundman, M. Sano, L. Bieliausk as, D. Geldmacher, C. Clark, L. J. Thai, Developmen t of co gnitive instruments for use in clinical trials of antidemen tia drugs: additions to the alzheimer’s disease assessment scale that broaden its scope, Alzheimer Disease & Asso ciated Disorders 11 (1997) 13–21. [33] W. J. Strittmatter, A. D. Roses, Apolip oprotein e and alzheimer’s dis- ease, Ann ual review of neuroscience 19 (1996) 53–77. [34] D. Jarrett, J. Y o on, M. v an der Sc haar, Dynamic prediction in clinical surviv al analysis using temp oral conv olutional netw orks, IEEE journal of biomedical and health informatics 24 (2019) 424–436. [35] S. M. Landau, D. Harvey , C. M. Madison, R. A. Koepp e, E. M. Reiman, N. L. F oster, M. W. W einer, W. J. Jagust, Asso ciations b et ween cogni- tiv e, functional, and fdg-p et measures of decline in ad and mci, Neuro- biology of Aging 32 (2011) 1207–1218. [36] J.-Y. Zhu, T. Park, P . Isola, A. A. Efros, Unpaired image-to-image translation using cycle-consistent adversarial net workss, in: ICCV, 2017. [37] C. R. Jac k Jr., M. A. Bernstein, N. C. F ox, P . Thompson, G. Alexander, D. Harvey , B. Boro wski, P . J. Britson, J. L. Whit well, C. W ard, A. M. Dale, J. P . F elmlee, J. L. Gunter, D. L. Hill, R. Killiany , N. Sch uff, S. F o x-Bosetti, C. Lin, C. Studholme, C. S. DeCarli, G. Krueger, H. A. W ard, G. J. Metzger, K. T. Scott, R. Mallozzi, D. Blezek, J. Levy , J. P . Debbins, A. S. Fleisher, M. Alb ert, R. Green, G. Bartzokis, G. Glo ver, J. Mugler, M. W. W einer, The alzheimer’s disease neuroimaging initia- tiv e (adni): Mri metho ds, Journal of Magnetic Resonance Imaging 27 (2008) 685–691. [38] A. Ho op es, J. S. Mora, A. V. Dalca, B. Fischl, M. Hoffmann, Synthstrip: skull-stripping for an y brain image, NeuroImage 260 (2022) 119474. [39] B. Fisc hl, F reeSurfer, NeuroImage 62 (2012) 774–781. 37 [40] E. Thib eau-Sutre, M. Diaz, R. Hassanaly , A. Routier, D. Dormon t, O. Colliot, N. Burgos, ClinicaDL: an open-source deep learning soft ware for repro ducible neuroimaging pro cessing, Computer Metho ds and Pro- grams in Biomedicine 220 (2022) 106818. doi: 10.1016/j.cmpb.2022. 106818 . [41] D. E. Ho, K. Imai, G. King, E. A. Stuart, Matching as nonparamet- ric prepro cessing for reducing mo del dep endence in parametric causal inference, P olitical analysis 15 (2007) 199–236. [42] J. Song, C. Meng, S. Ermon, Denoising diffusion implicit mo dels, in: ICLR, 2021. [43] P . Isola, J.-Y. Zhu, T. Zhou, A. A. Efros, Image-to-image translation with conditional adv ersarial netw orks, in: CVPR, 2017. [44] J. M. Hoffman, K. A. W elsh-Bohmer, M. Hanson, B. Crain, C. Hulette, N. Earl, R. E. Coleman, F dg p et imaging in patien ts with pathologically v erified dementia, Journal of Nuclear Medicine 41 (2000) 1920–1928. [45] S. Minoshima, K. A. F rey , R. A. Koepp e, N. L. F oster, D. E. Kuhl, A diagnostic approac h in alzheimer’s disease using three-dimensional stereotactic surface pro jections of fluorine-18-fdg p et, Journal of Nuclear Medicine 36 (1995) 1238–1248. [46] P . Herscovitc h, A pioneering pap er that provided a to ol for accurate, observ er-indep enden t analysis of 18 f-fdg brain scans in neuro degener- ativ e demen tias, Journal of Nuclear Medicine 61 (2020) 140S–141S. doi: 10.2967/jnumed.120.252510 . [47] Y. Chen, Y. Su, C. Dumitrascu, K. Chen, D. W eidman, R. J. Caselli, N. Ash ton, E. M. Reiman, Y. W ang, Plasma-CycleGAN: Plasma biomark er-guided MRI to PET cross-modality translation using con- ditional CycleGAN, in: Proc. IEEE 22nd Int. Symp. Biomed. Imaging (ISBI), 1–5, 2025. [48] K. Chen, Y. W eng, Y. Huang, Y. Zhang, T. Dening, A. A. Hosseini, W. Xiao, A m ulti-view learning approac h with diffusion model to syn- thesize FDG PET from MRI T1WI for diagnosis of Alzheimer’s disease, Alzheimer’s & Demen tia 21 (2) (2025) e14421. 38 [49] D. Zotov a, N. Pinon, R. T rom b etta, R. Bouet, J. Jung, C. Lartizien, GAN-based syn thetic FDG PET images from T1 brain MRI can serv e to improv e p erformance of deep unsup ervised anomaly detection mo dels, Comput. Metho ds Programs Biomed. 265 (2025) 108727. [50] W. Lin, W. Lin, G. Chen, H. Zhang, Q. Gao, Y. Huang, T. T ong, M. Du, Alzheimer’s Disease Neuroimaging Initiative, Bidirectional map- ping of brain MRI and PET with 3D reversible GAN for the diagnosis of Alzheimer’s disease, F ron t. Neurosci. 15 (2021) 646013. [51] M. Y u, M. W u, L. Y ue, A. Bozoki, M. Liu, F unctional imaging con- strained diffusion for brain PET syn thesis from structural MRI, arXiv preprin t arXiv:2405.02504 (2024). [52] L. K ong, C. Lian, D. Huang, Y. Hu, Q. Zhou et al. , Breaking the dilemma of medical image-to-image translation, Adv. Neural Inf. Pro- cess. Syst. 34 (2021) 1964–1978. [53] J. Kim, H. P ark, A daptive latent diffusion mo del for 3D medical image to image translation: Multi-mo dal magnetic resonance imaging study , in: Pro c. IEEE/CVF Winter Conf. Appl. Comput. Vis. (W ACV), 7604– 7613, 2024. 39
Original Paper
Loading high-quality paper...
Comments & Academic Discussion
Loading comments...
Leave a Comment