SCALE:Scalable Conditional Atlas-Level Endpoint transport for virtual cell perturbation prediction
Virtual cell models aim to enable in silico experimentation by predicting how cells respond to genetic, chemical, or cytokine perturbations from single-cell measurements. In practice, however, large-scale perturbation prediction remains constrained b…
Authors: Shuizhou Chen, Lang Yu, Kedu Jin
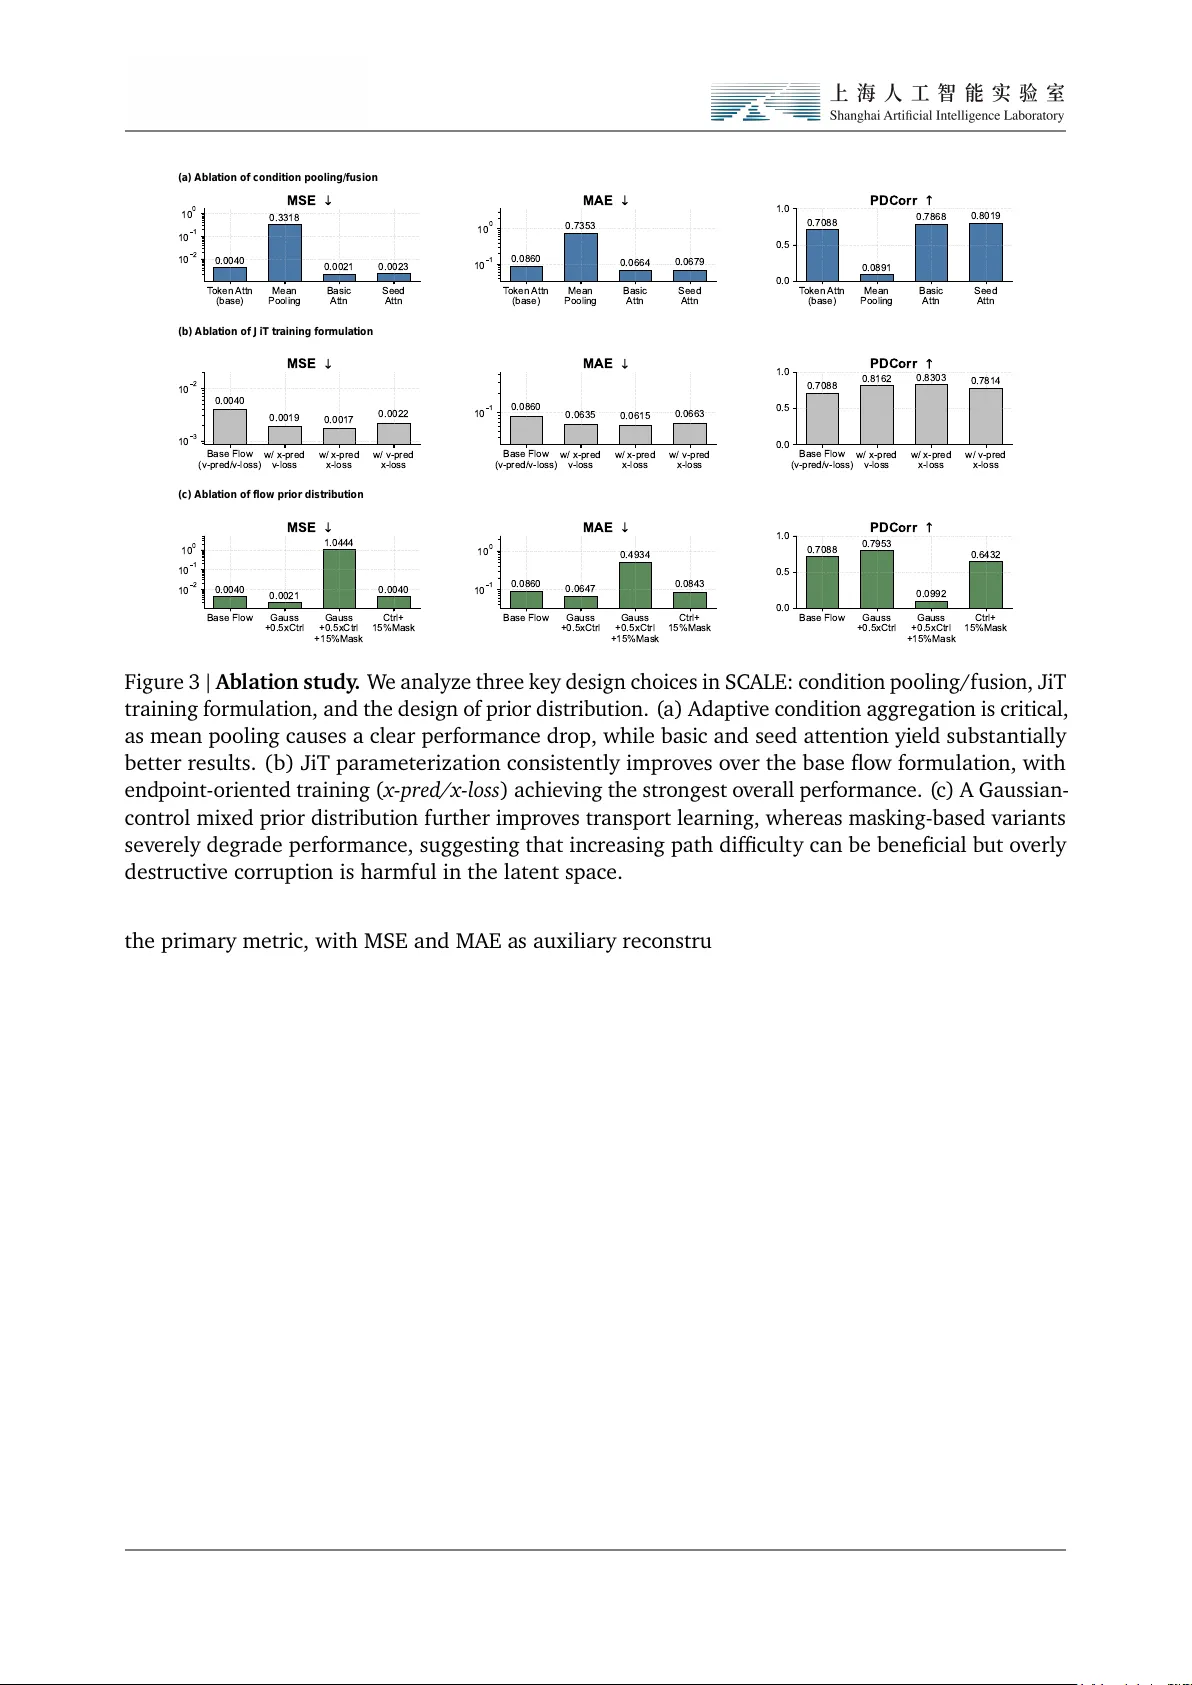
SC ALE: Scala b l e C o nditi ona l Atl a s-L ev el End po int trans port f or virtu a l cell perturbati o n predi cti on Shuizhou Chen 1,2 ♠ , L ang Yu 1, 4 ♠ , Ked u Jin 1,3 , Songming Zhang 1,5 , Hao Wu 1 , W enxu an Hu ang 1 , Sheng Xu 1 , Quan Qian 2 ♣ , Qin Chen 4 ♣ , L ei Bai 1 ♣ , Siqi Sun 1 ♣ and Z hangyang Gao 1 ♣ 1 Shanghai Artificial Intelligen ce Laboratory , 2 School o f Co mputer Engineering & Science, Shanghai U niversit y , 3 School o f Lif e Science and T echnology , China P harmaceutical Univ ersit y , 4 School o f Co mputer Scien ce and T echnology , E ast Chin a Normal Uni versit y , 5 F acult y of Computer Science and Control Engineering, Shenzhen Univ ersit y of Advanced T echnology , Shenzhen Virtual cell m odels aim to en ab le in silico experiment atio n by predicting how cells res pond to genetic, chemica l, or cytokine perturbations from single-cell measurements. In practice, how ev er , large-scale perturbatio n predicti on remains co nstrained by three coupled bottlenecks: in efficient training and inferen ce pipelines, unstab le m odeling in high-dimensio nal s parse expressio n s pace, and evaluati on protocols that o verempha size reconstructi on-like accuracy while underestimating biologi cal fidelit y . In this work we present a s peci alized l arge-scale fo undation m odel SCALE for virtu al cell perturbation predicti on that addresses the abo ve limit atio ns jointly . First, we build a BioNeMo-ba sed training and inferen ce framework that subst antially improv es dat a throughput, distributed scalabilit y , and deployment effici ency , yielding 12.51 × speed up on pretrain and 1.29 × on inference ov er the prior S OT A pipeline under matched system settings. Second, we form ulate perturbatio n predicti on as conditio nal trans port and implement it with a set-a ware flo w architecture that couples LLaMA-ba sed cellul ar encoding with end point-oriented supervision. This design yields more stabl e training and stronger reco very of perturbatio n effects. Third, we evaluate the model on T ahoe-100M using a rigorous cell-lev el protocol centered on biologica lly meaningf ul metrics rather than reconstru ctio n al one. On this benchmark, our m odel improv es PDCorr by 12.02% and D E Ov erl ap by 10.66% ov er ST A TE. T ogether , these results suggest that advan cing virtu al cells requires not only better generativ e objectiv es, but also the co-design o f scala ble infrastructure, stabl e transport m odeling, and biologi cally faithf ul evaluati on. 1. Introd ucti on Virtua l cell models aim to turn single-cell perturbation data into in silico systems for foreca sting ho w cellular st ates respo nd to genetic, chemical or cytokine interv entions[ 1 , 2 ]. Such models could accelerate hypothesis generation and mechanism-oriented screening by enab ling candidate perturbatio ns to be evaluated before costly wet-lab experiments[ 3 , 4 ]. In this context, perturbation predicti on is not simply a benchmark t as k but a fo undationa l abilit y for any usef ul virtual cell system: the m odel m ust faithf ully capture ho w cellular popul atio ns reorganize under interventi on[ 3 , 5 ]. P erturbation prediction from single-cell dat a is intrinsically difficult because the same cell cannot be observ ed both before and after interv entio n. The task is therefore not to reconstruct paired cell-lev el trajectories, but to infer ho w an untreated population is redistrib uted under perturbatio n. This population-l evel inf erence is cha llenging in single-cell transcripto mic space, which is high- dimensio nal, sparse and biologica lly heterogeneo us, while also being shaped by subst antial technica l variatio n across batches and experiment al contexts. As perturbation atlases continue to expand in scal e and div ersit y , these difficulties become more prono unced, creating a need for methods that remain comput ationa lly tractab le, learn st ab le population-l evel st ate transitio ns and are evaluated with metrics that reflect biologica l fidelit y rather than av erage expression reconstru ction alo ne. ♠ : Core Contrib utor ♣ : Corresponding Author Plea se send correspondence regarding this report to gaozhangyang@pjlab.org.cn Recon Cell Set (control) Recon Cell Set (perturbed) Shared parameter (a) Cell set (control) n genes m cells Cell set (perturbed) n genes m cells Perturbation types Drug treatment Chemical signal Gene knockout (b) Bi-level Set Encoder Bi-level Set Encoder Shared parameter Perturbation Velocity Field Network Set Decoder Set Decoder Cell Set (control) Cell Set (perturbed) Velocity loss Recon & MMD loss Set-aware latent space Figure 1 | Ov erview of SCALE. ( a) Conceptual form ulation o f virtual cell perturbatio n predi ction. Giv en control and perturbed single-cell popul atio ns measured under matched biologi cal context, the task is framed as conditi onal transport from control to perturbed cell st ates. Rather than assuming on e-to-one corresponden ce bet ween cells, the model learns popul atio n-level perturbatio n-indu ced transitio ns o ver unordered cellular sets. ( b) SCALE f or scalab le and bi ologica lly f aithf ul perturba- tio n predictio n. SCALE encodes cellul ar populations into a set-aware latent space and learns stab le end point-align ed transport under perturbation conditio ns. This design is coupled with sca l ab le train- ing infra structure and biologi cally grounded evaluati on to support large-scale virtu al cell modeling. Existing methods hav e made import ant progress, but key limit ations remain. Early approaches o ften relied on direct conditio n al mapping or randomly paired regression, which tend to empha siz e av erage perturbatio n effects and can miss heterogeneous cellular responses. More recent methods instead shift the objecti ve from cell-level matching to popul atio n-lev el predi ctio n: ST A T E highlights the importance of heterogeneit y-aware set m odeling and bi ologically grounded evaluati on, whereas P erturbDiff suggests that an observed perturbation may correspo nd to a f amily of pl ausib le response distrib utions shaped by unobserv ed l atent f actors. These advan ces broaden the modeling perspective, b ut they still largely rely on t w o-st age form ulations that separate l atent represent ation learning from perturbatio n generatio n. This creates a key mismatch: latent spaces optimiz ed for reconstructi on are not necessarily suited to m odeling perturbation-ind uced population shifts, and may even become trivial or ov erly inst ance-preserving. What is needed instead is an end-to-end f ormulati on that jointly learns set-level represent atio ns and perturbatio n-conditi oned st ate transitio ns. In this w ork, we propose SCALE, a large-scale foundati on model built around an end-to-end form ul a- tio n that jointly learns set-level represent ations and perturbation-co nditio ned state transitions. SCALE instanti ates this form ul ation with a LLaMA-st yle set encoder and a conditio nal flo w-matching architec- ture, enab ling st ab le predicti on o f perturbation-ind uced population shifts in sparse, high-dimensi onal single-cell space. T o support atl as-sca le training and deployment, we f urther implement the model within a BioN eMo-based framework for high-throughput data processing, distributed execution and effici ent inferen ce on T ahoe-100M. W e evaluate SCALE using a rigorous cell-level protocol centered on biologica lly meaningf ul recov ery o ver m ultiple perturbati on dat asets. On T ahoe-100M, our model improv es PDCorr by 12.02% and D E Overlap by 10.66% ov er ST A T E, indicating gains not only in expressio n predicti on but a lso in the reco very of perturbatio n effects. These results support a broader conclu sion: progress in virtual cell m odeling depends not only on m ore expressive generativ e objectiv es, but on the co-design o f scalab le systems, st ab le transport modeling, and biol ogically f aithf ul eva luation. Our contrib utions are threefold: • Scalab le virtu al-cell infrastructure. W e devel op a BioN eMo-based pretraining and inference framew ork for virtual cell perturbatio n predicti on, mean while a new sampling strategy for the perturb dataset, making atlas-scal e model devel opment practica l and deliv ering nearly 12 . 51 × 2 speed up ov er the pri or SOT A pipeline ST A TE under matched system settings. • End point-align ed conditio nal trans port for perturbatio n predictio n. W e f ormulate single- cell perturbatio n predicti on as conditi onal transport bet w een control and perturbed cellul ar populations in a learn ed set-aw are latent space, and instanti ate it with a LL aMA-st yle DeepSets encoder and JiT parameteriz atio n [ 6 ] under paired end point supervision. This f ormulatio n is designed to better match the supervisio n actu ally av ail ab le in perturbation dat asets, where only the initial and final population st ates are observ ed. • Meaningf ul gains on bi ologica lly grounded metrics. U nder rigorous cell-lev el evaluatio n on T ahoe-100M, SCALE improv es PDCorr by 12 . 02% and D E Ov erl ap by 10 . 66% ov er ST A TE, sho wing that the gains arise not only from better expression fitting, but from stronger reco very o f perturbatio n effects on biol ogically grounded metrics. 2. R el ated W ork Single-cell foundati on models for virtual cell. R ecent progress in l arge-scal e single-cell fo undation m odels [ 7 – 9 ] ha s accelerated the development of virtua l cells a s in sili co systems f or biologi cal experimentation. Models such as scGPT [ 8 ] demo nstrate that atlas-sca le pretraining can prod uce transfera b le representations for cellular analysis. Ho wev er , perturbation predictio n imposes a stricter requirement than representation learning alo ne: a usef ul virtual cell m odel mu st predict ho w cellular states change under interventi on across heterogeneo us biol ogical and experiment al contexts. Direct conditio nal mapping f or virtu al cell. A substantial line of prior w ork [ 10 – 14 ] f ormulates perturbatio n predictio n as a direct conditi onal mapping from control cells to perturbed outcomes. scGen [ 10 ] m odels perturbationa l effects as l atent shifts in a variatio nal framew ork, CP A [ 11 ] extends this paradigm to compositi onal perturbatio ns and cov ariates, and GEARS [ 12 ] incorporates gene–gene interactio n structure to improv e predictio n for unseen multi-gen e perturbatio ns. These methods estab lished strong and comput atio nally effici ent baselin es for the field. Neverthel ess, because single- cell perturbation dat a are inherently unpaired, direct cell-wise objectiv es can bias learning to ward av erage effects, making it difficult to recov er heterogeneou s population-lev el responses. This limitation is underscored by recent benchmarking work sho wing that current deep perturbatio n models do not yet consistently surpass strong linear baselines across settings [ 15 ]. P opul atio n-lev el perturbatio n models for virtual cell. T o address the limit ations o f random pairing and mean-effect regressio n, a more recent f amily of methods [ 4 , 16 – 21 ] model perturbation responses at the level of popul ations, sets, or transport maps. CellOT [ 16 ] frames perturbation predictio n through neural optimal transport bet w een control and perturbed populatio ns. ST A T E [ 22 ] extends this direction with transformer-ba sed set modeling, emphasizing heterogeneit y-aware predicti on across sets o f cells and eva luating models with biologi cally grounded cell-level metrics. Diffusio n- based approaches such as scPPDM [ 23 ] f urther extend this paradigm. PerturbDiff [ 24 ] pushes the form ul atio n f urther by treating cell distributi ons a s random varia bl es and defining diff usio n directly in RKHS , thereby modeling response varia bilit y ind uced by unobserved l atent factors. Closely rel ated recent work has also explored contin uou s-time or bridge-based generative f ormulatio ns, including CellFlo w [ 25 ] and U nlasting [ 26 ]. P ositio ning of SCALE. O ur work is m ost closely related to this l ast family of population and transport-ori ented methods, b ut differs in emphasis. C ompared with direct mapping methods, w e explicitly form ul ate perturbation predicti on as conditi onal transport rather than one-shot regression. Compared with set-based approaches such as ST ATE, w e place greater emphasis on l atent transport 3 learning as the modeling primitiv e. C ompared with distributi on-lev el diff usio n approaches such as P erturbDiff , our focu s is not only on expressiv e generative modeling, but on a practica l atlas-sca le framew ork that couples scalab le infrastru cture, st ab le and efficient perturbation transport learning, and perf ormance gains on biol ogically grounded metrics. 3. SCALE 3.1. Prob lem F ormulatio n W e study single-cell perturbatio n predictio n from paired cell-level observatio ns. E ach training sample consists o f a control cell set 𝑋 0 , a perturbed cell set 𝑋 1 , and a collection of observed conditi ons, including cellt ype 𝑐 , perturbation identit y 𝑝 , and experiment al batch 𝑏 : D = { ( 𝑋 0 , 𝑋 1 , 𝑐, 𝑝, 𝑏 ) } . (1) Here 𝑋 0 , 𝑋 1 ∈ ℝ 𝐵 × 𝑁 × 𝐺 denote batches of cell sets, where 𝐵 is the batch si ze, 𝑁 is the number o f cells sampled per example, and 𝐺 is the number o f genes. Within each example, cells are treated as an unordered set rather than a sequen ce. The key difficult y is that single-cell perturbatio n mea surements are inherently unpaired: the same cell cannot be observed both bef ore and after treatments. Therefore, the goa l is not to learn a on e-to-on e cell corresponden ce, b ut to model how a control population is redistrib uted under perturbation. F ormally , we seek to learn the conditio nal law ˆ 𝑋 1 ∼ 𝑝 𝜃 ( 𝑋 1 | 𝑋 0 , 𝑐, 𝑝, 𝑏 ) , (2) where the predictio n t arget is the post-perturbati on popul atio n conditi oned on the pre-perturbation population and observed met adata. This perspectiv e pl aces perturbatio n predicti on closer to a conditi onal popul ation trans port prob lem than to st andard cell-wise regressio n. The m odel must preserve perturbatio n-relevant variati on across cells while transf orming the control population into a perturbed on e under context-specific constraints. This is particularly chall enging in transcriptomi c space, which is high-dimensional, sparse, and no isy , making direct transport learning in the observ ed space difficult to optimize. The detailed mod ule o f our model can be seen in Figure 2 . 3.2. A Hierarchi cal Set-A ware Latent C ell-St ate Encoder T o make conditio nal transport tract ab le and stab le while preserving distrib utio n-lev el observatio ns, w e construct a hierarchica l l atent en coder rather than a gen eric cell-wise autoencoder . The key observati on is that each training example is an unordered set o f cells, whil e each cell itself is a high-dimensio nal gene-expressi on object. This m otivates a t w o-lev el factori zation of represent ation learning: w e first m odel within-cell gene dependencies, and then model across-cell distrib utio n. Gene-wise encoding within each cell. L et 𝑥 𝑖 ∈ ℝ 𝐺 denote the expression vector of the 𝑖 -th cell in a population. W e first apply a shared gene-wise encoder 𝑓 gene : ℝ 𝐺 → ℝ 𝑑 , (3) to each cell independently , yielding ℎ 𝑖 = 𝑓 gene ( 𝑥 𝑖 ) , 𝑖 = 1 , . . . , 𝑁 . (4) 4 (a) Hierarchical Set-Aware encoder Input cell s et Gene-wise sel f-attention [m, n] Gene embedding RMS norm [m, dim] Group multi-query attention RMS norm Feed forward *N Cell-wise aggregation Softmax score Phi Cell fusion layer dim [m, dim] Embedded cell set (b) Conditional JiT-based velocity fiel d network m cells n genes Conditions Cell type Perturbation Batch Condition encoder Seed attention Time Cell state (co ntrol) T Interpolation time Time encoder MLP Latent embedding [m cells, dim ] Concatenation Layer norm Multi-head cross attention Layer norm Feed forward Dit Block *M Multi-head c ross attention [m, dim] Cell embedding [dim] Conditions Q K V Softmax Ground-truth cell state (perturbed) Velocity loss Predicted cell state (perturbed) m cells Figure 2 | SCALE mod ule detail. ( a) Hierarchica l set-aware encoder . This m odul e firstly encodes gene-l evel cell inputs into latent cell embeddings through st acked set-transformer b locks and aggregate the cell-wise informati on with a set equivariant f usio n l ayer .(b) C onditi onal JiT -based v elocit y field net w ork. This mod ule integrates condition features, time encoding, and cell latent embeddings to m odel perturbatio n latent transport atio n and predict t arget embeddings through velocit y fitting. In our implementation, 𝑓 gene is instantiated as a LLaMA-st yle attention or a basi c attentio n m odul e operating ov er gen e-lev el f eatures within a single cell. Importantly , this st age does n ot perform cell-to-cell interaction: the same encoder is appli ed independently to every cell. As a result, with respect to permutatio ns o f cell order , this st a ge is naturally perm ut atio n equivariant: 𝐹 gene ( 𝑃 𝑋 ) = 𝑃 𝐹 gene ( 𝑋 ) , (5) where 𝑋 ∈ ℝ 𝐵 × 𝑁 × 𝐺 is a batch of cell sets, 𝑃 is a perm ut ation acting on the cell dimensio n, and 𝐹 gene ( 𝑋 ) returns cell-wise embeddings. F or the 𝑏 -th cell set, let 𝐻 ( 𝑏 ) = h ℎ ( 𝑏 ) 1 , . . . , ℎ ( 𝑏 ) 𝑁 i ∈ ℝ 𝑁 × 𝑑 ℎ , (6) where ℎ ( 𝑏 ) 𝑖 ∈ ℝ 𝑑 ℎ denotes the gene-lev el embedding o f the 𝑖 -th cell. For notationa l simplicit y , w e omit the batch index 𝑏 belo w and write ℎ 𝑖 ∈ ℝ 𝑑 ℎ . DeepSets aggregation across cells. The cell embeddings are then processed at the popul atio n lev el through a DeepSets l ayer ov er the cell dimensio n. Specifica lly , w e compute a permutatio n-invariant 5 population summary 𝑠 ( 𝑋 ) = 𝜌 1 𝑁 𝑁 𝑖 = 1 𝜙 ( ℎ 𝑖 ) ! ∈ ℝ 𝑑 𝑠 , (7) where 𝜙 : ℝ 𝑑 ℎ → ℝ 𝑑 𝜙 and 𝜌 : ℝ 𝑑 𝜙 → ℝ 𝑑 𝑠 are learnab le mappings. In batched form, st acking the set-lev el summaries across the 𝐵 samples yields 𝑆 ( 𝑋 ) ∈ ℝ 𝐵 × 𝑑 𝑠 . This summary is then fed back to refine each cell represent ation through a learnab le f usio n map 𝑧 𝑖 = 𝜓 ( ℎ 𝑖 , 𝑠 ( 𝑋 ) ) , 𝜓 : ℝ 𝑑 ℎ × ℝ 𝑑 𝑠 → ℝ 𝑑 , 𝑖 = 1 , . . . , 𝑁 , (8) so that 𝑧 𝑖 ∈ ℝ 𝑑 . St acking the refined cell embeddings giv es the final latent population 𝑍 = [ 𝑧 1 , . . . , 𝑧 𝑁 ] ∈ ℝ 𝑁 × 𝑑 , (9) and, in batched form, 𝑍 ∈ ℝ 𝐵 × 𝑁 × 𝑑 . By constructi on, 𝑠 ( 𝑋 ) is permutation inv ariant, while the refined cell represent ations remain perm ut a- tio n equivariant with respect to any reordering of the input cells. In this way , the encoder f aithf ully preserv es the intrinsic symmetry structure o f unordered cell sets, while still all owing informativ e globa l population-lev el context to mod ul ate and enrich each individua l cell embedding. Interpretation. This hierarchica l encoder separates t w o distinct modeling roles. The LL aMA-st yle gene encoder ca ptures intracellular transcriptional dependenci es, whereas the DeepS ets layer ca ptures population-l evel structure across cells. Therefore, the l atent representation is not merely a dimension- red uced cell embedding, b ut a set-a ware latent population represent ation that respects both the internal structure o f each cell and the unordered structure of the cell population. A utoencoding objective. Let the f ull encoder and decoder be denoted by 𝐸 𝑛 𝑐 𝜙 : ℝ 𝐵 × 𝑁 × 𝐺 → ℝ 𝐵 × 𝑁 × 𝑑 , 𝐷𝑒 𝑐 𝜓 : ℝ 𝐵 × 𝑁 × 𝑑 → ℝ 𝐵 × 𝑁 × 𝐺 , (10) where 𝐸 𝑛 𝑐 𝜙 denotes the hierarchi cal encoder described abo v e, operating on 𝐵 batch of cell sets of size 𝑁 with 𝐺 genes per cell. In batched form, the inputs and outputs are st acked ov er the batch dimensio n. Applied to the control and perturbed populations, we obt ain 𝑍 0 = 𝐸 𝑛𝑐 𝜙 ( 𝑋 0 ) , 𝑍 1 = 𝐸 𝑛𝑐 𝜙 ( 𝑋 1 ) , 𝑍 0 , 𝑍 1 ∈ ℝ 𝐵 × 𝑁 × 𝑑 , (11) where 𝑋 0 , 𝑋 1 ∈ ℝ 𝐵 × 𝑁 × 𝐺 . The decoder reconstructs expression cell-wise, ˆ 𝑋 0 = 𝐷𝑒 𝑐 𝜓 ( 𝑍 0 ) , ˆ 𝑋 1 = 𝐷𝑒 𝑐 𝜓 ( 𝑍 1 ) , ˆ 𝑋 0 , ˆ 𝑋 1 ∈ ℝ 𝐵 × 𝑁 × 𝐺 . (12) T o encoura ge both point-wise reconstructi on fidelit y and population-l evel distributi on alignment, we train the l atent space with a joint MSE-MMD objectiv e: L AE = L MSE + 𝜆 MMD L MMD , (13) where L MSE = 𝔼 𝑋 0 h ˆ 𝑋 0 − 𝑋 0 2 2 i + 𝔼 𝑋 1 h ˆ 𝑋 1 − 𝑋 1 2 2 i , (14) L MMD = 𝔼 MMD 2 ( ˆ 𝑋 0 , 𝑋 0 ) + 𝔼 MMD 2 ( ˆ 𝑋 1 , 𝑋 1 ) . (15) 6 Here, 𝜆 MMD balances local reconstructi on accuracy and global distrib utio n matching. The MMD term is defined as MMD 2 ( 𝐴, 𝐵 ) = 𝔼 𝑎,𝑎 ′ ∼ 𝐴 [ 𝑘 ( 𝑎, 𝑎 ′ ) ] + 𝔼 𝑏,𝑏 ′ ∼ 𝐵 [ 𝑘 ( 𝑏, 𝑏 ′ ) ] − 2 𝔼 𝑎 ∼ 𝐴, 𝑏 ∼ 𝐵 [ 𝑘 ( 𝑎, 𝑏 ) ] , (16) where 𝑘 ( · , ·) is a positiv e-definite kernel, e.g., a Gaussian kernel. 3.3. Conditi onal Latent Flo w Trans port under P aired End point Supervision Because training data provide paired control and perturbed cell sets but do not revea l the intermedi ate transitio n trajectory , we form ul ate perturbatio n predicti on as conditio nal latent transport bet w een t wo observed end points rather than as reconstructi on of a f ull stochastic reverse process. L et 𝑍 0 = 𝐸 𝑛𝑐 𝜙 ( 𝑋 0 ) , 𝑍 1 = 𝐸 𝑛𝑐 𝜙 ( 𝑋 1 ) , 𝑍 0 , 𝑍 1 ∈ ℝ 𝐵 × 𝑁 × 𝑑 (17) denote the set-aware l atent populations encoded from the control and perturbed cell sets. W e connect the t wo end points through a simple linear surrogate path 𝑍 𝑡 = ( 1 − 𝑡 ) 𝑍 0 + 𝑡 𝑍 1 , 𝑡 ∼ Unif orm ( 0 , 1 ) , (18) which serves as an observatio n-compatib le training constru ctio n rather than a literal model of biologica l dynamics. Here, 𝑡 is a scalar interpolation time sampled unif ormly from the unit interval. Giv en the interpol ated latent distributi on 𝑍 𝑡 , time 𝑡 , and observ ed conditi ons 𝐶 , the co nditio nal transport backbone produ ces hidden latent st ates 𝐻 𝑡 = 𝑔 𝜃 ( 𝑍 𝑡 , 𝑡 , 𝐶 ) , 𝐻 𝑡 ∈ ℝ 𝐵 × 𝑁 × 𝑑 . (19) Here, 𝑔 𝜃 ( ·) is the conditiona l transport flow m odel parameteri zed by 𝜃 . The final SCALE model is instanti ated through direct predictio n head: ˆ 𝑍 1 = ℎ 𝑥 ( 𝐻 𝑡 ) , (20) where ℎ 𝑥 ( ·) is the end point predicti on head and ˆ 𝑍 1 is the predicted perturbed l atent population, and is trained with the end point reconstru ctio n objectiv e L flo w = L 𝑥 = 𝔼 𝑡 h ˆ 𝑍 1 − 𝑍 1 2 2 i . (21) Here, 𝔼 𝑡 [ · ] denotes expect ation ov er the sampled interpolation time 𝑡 . It is obvious that we adopt JiT x-pred and x-loss training strategy . This end point-oriented form ul atio n matches the supervisi on av ail ab le in single-cell perturbation predicti on. During training, w e observe the control popul ation and the perturbed population only at the end points, while the intermediate contin uous transition is unobserv ed. Therefore, supervising the predicted perturbed end point provides the most f aithf ul wa y to align the learning objectiv e with the data actu ally availa bl e during training. JiT parameteriz atio n f amily . Bey ond the final deployed objective, we consider a broader JiT [ 6 ] parameteriz atio n f amily to an alyze how the choice of predicti on t arget affects optimiz atio n and final-state reco very . In particular , JiT includes both end point-st yle and velocit y/displacement-st yle parameteriz atio ns deriv ed from the same l atent transport framew ork. These variants are introdu ced for ab lation and analysis rather than deployment, with the goal of isolating how the choi ce of predicti on target and supervision space affects training under paired end point supervision. 7 L et the endpo int and displ acement heads be denoted by ˆ 𝑍 1 = ℎ 𝑥 ( 𝐻 𝑡 ) , (22) ˆ 𝑈 = ℎ 𝑣 ( 𝐻 𝑡 ) , (23) where ℎ 𝑣 ( ·) is the displacement predicti on head and ˆ 𝑈 is the predicted l atent displacement, with the correspo nding conv ersion ˆ 𝑍 1 = 𝑍 0 + ˆ 𝑈 , ˆ 𝑈 = ˆ 𝑍 1 − 𝑍 0 . (24) W e f urther define the end point and displ acement supervisio n spaces abstractly a s L 𝑥 = 𝔼 𝑡 h ˆ 𝑍 1 − 𝑍 1 2 2 i , (25) L 𝑣 = 𝔼 𝑡 h ˆ 𝑈 − 𝑈 ★ 2 2 i , (26) where 𝑈 ★ = 𝑍 1 − 𝑍 0 denotes the ground-truth l atent displacement, which yield fo ur JiT variants: x-pred / x-loss: ˆ 𝑍 1 = ℎ 𝑥 ( 𝐻 𝑡 ) , L = L 𝑥 , (27) x-pred / v -loss: ˆ 𝑍 1 = ℎ 𝑥 ( 𝐻 𝑡 ) , ˆ 𝑈 = ˆ 𝑍 1 − 𝑍 0 , L = L 𝑣 , (28) v-pred / x-loss: ˆ 𝑈 = ℎ 𝑣 ( 𝐻 𝑡 ) , ˆ 𝑍 1 = 𝑍 0 + ˆ 𝑈 , L = L 𝑥 , (29) v-pred / v -loss: ˆ 𝑈 = ℎ 𝑣 ( 𝐻 𝑡 ) , L = L 𝑣 . (30) These variants are studied to understand how the exposure of end point-v ersus displacement-st yle supervisio n affects optimiz ation. Empirically , the choi ce o f parameterization is not neutral: JiT variants substanti ally outperform the base flo w form ulation, and am ong the completed configuratio ns, end point predicti on with end point supervisi on giv es the strongest results in our setting. W e therefore adopt x-pred/x-lo ss as the default configurati on of SCALE unless otherwise st ated, while reporting the broader JiT comparison separately in the ab lation study . Practica l implicatio n. A flo w-based form ulation is therefore natural in our setting. Rather than reconstru cting an unobserved l atent stochasti c process, the model learns conditio nal transport bet w een supervised end points. The objectiv e is thus defined on end point qu antities availab le d uring training and aligns more naturally with end point-ba sed evaluati on. 3.4. Conditi oning represent atio n and injection W e conditi on on three discrete varia bl es: cell t ype 𝑐 , perturbati on t ype 𝑝 , and batch t ype 𝑏 . Each conditi on is represented as a one-hot vector: c ∈ { 0 , 1 } 𝐾 𝑐 , p ∈ { 0 , 1 } 𝐾 𝑝 , b ∈ { 0 , 1 } 𝐾 𝑏 where 𝐾 𝑐 , 𝐾 𝑝 , and 𝐾 𝑏 are the numbers o f cell t ypes, perturbation t ypes, and batch t ypes. Conditi on embedding. W e map each one-hot v ector to a dense embedding using a linear projectio n: 𝑒 𝑐 = c 𝑊 𝑐 ∈ ℝ 𝐵 × 𝑑 𝑐 , 𝑒 𝑝 = p 𝑊 𝑝 ∈ ℝ 𝐵 × 𝑑 𝑐 , 𝑒 𝑏 = b 𝑊 𝑏 ∈ ℝ 𝐵 × 𝑑 𝑐 , with 𝑊 𝑐 ∈ ℝ 𝐾 𝑐 × 𝑑 𝑐 , 𝑊 𝑝 ∈ ℝ 𝐾 𝑝 × 𝑑 𝑐 , and 𝑊 𝑏 ∈ ℝ 𝐾 𝑏 × 𝑑 𝑐 . W e stack the three embeddings into a token matrix: 𝐶 = 𝑒 𝑐 ; 𝑒 𝑝 ; 𝑒 𝑏 ∈ ℝ 𝐵 × 3 × 𝑑 𝑐 . 8 Conditi on injectio n by seed attention. L et 𝐻 ℓ ∈ ℝ 𝐵 × 𝑁 × 𝑑 denote the latent cell tokens at transformer b lock ℓ . W e first project the conditi on tokens into the model width, ˜ 𝐶 = Π ( 𝐶 ) ∈ ℝ 𝐵 × 3 × 𝑑 , (31) where Π : ℝ 𝐵 × 3 × 𝑑 𝑐 → ℝ 𝐵 × 3 × 𝑑 is a learned linear projecti on. Instead of directly concatenating all conditi on tokens with the cell tokens, we aggregate them into a single conditio n summary by a learnab le seed query . Specifica lly , let 𝑞 seed ∈ ℝ 𝑑 be a learned seed vector . W e compute 𝛼 = Softmax ( 𝑞 seed 𝑊 𝑄 ) ( ˜ 𝐶𝑊 𝐾 ) ⊤ √ 𝑑 ∈ ℝ 𝐵 × 1 × 3 , (32) and f orm the a ggregated conditio n token 𝑐 seed = 𝛼 ( ˜ 𝐶𝑊 𝑉 ) ∈ ℝ 𝐵 × 1 × 𝑑 . (33) W e then inject this seed-aggregated conditi on token by concatenating it with the cell tokens and applying st andard self-attenti on ov er the joint sequen ce: ˜ 𝐻 ℓ = [ 𝐻 ℓ ; 𝑐 seed ] ∈ ℝ 𝐵 × ( 𝑁 + 1 ) × 𝑑 , (34) foll o wed by the transformer update ˜ 𝐻 ℓ + 1 = ˜ 𝐻 ℓ + Attn ( LN ( ˜ 𝐻 ℓ ) ) + MLP ( LN ( ˜ 𝐻 ℓ ) ) . (35) After the update, we ret ain only the first 𝑁 cell tokens as the latent st ate for the next block: 𝐻 ℓ + 1 = ˜ 𝐻 ℓ + 1 [ : , 1 : 𝑁 , : ] ∈ ℝ 𝐵 × 𝑁 × 𝑑 . (36) Because no positio nal encoding is appli ed on the cell dimensio n and all token-wise parameters are shared across cells, this operation preserves permutation equivariance with respect to the cell token order , while allo wing the m odel to inject an adaptiv ely a ggregated conditi on represent ation. 3.5. Generati on in expressio n s pace Giv en a control set 𝑋 0 together with observ ed conditio n variab les ( 𝑐, 𝑝, 𝑏 ) , w e first compute the l atent control popul atio n 𝑍 0 = 𝐸 𝑛𝑐 𝜙 ( 𝑋 0 ) . W e then apply the trained conditio n al transport backbone under the chosen JiT parameteri zation to obt ain a predicted perturbed latent popul atio n ˆ 𝑍 1 , and decode it back to expression space: ˆ 𝑋 1 = 𝐷𝑒 𝑐 𝜓 ( ˆ 𝑍 1 ) . (37) This yields a deterministic predictio n of the post-perturbati on popul ation in expressio n space under the observ ed biol ogical context. 4. Experiments T o comprehensiv ely assess the capa bilities of SC ALE, we cond uct experiments on a diverse set o f chall enging benchmarks. 9 4.1. Experiments Setup Ev aluatio n Benchmarks. W e evaluate SCALE on three represent ativ e single-cell perturbatio n benchmarks spanning complementary biologica l regimes: PBMC f or cytokine signaling perturba- tio n predicti on, T ahoe-100M for chemica l perturbatio n predicti on, and Repl ogle-Nadig for geneti c perturbatio n predictio n. Foll owing the current unified pipeline, all models are trained to predict log-expressi on on the top 2,000 highly variab le genes (H VGs), which serves as a standardi zed feature space across datasets [ 22 , 24 ]. • PBMC : a large-scale cytokine perturbati on benchmark built from peripheral bl ood mo non uclear cells collected from 12 don ors, comprising 90 cytokine perturbatio n conditio ns across 18 cell t ypes. Compared with drug and genetic perturbation benchmarks, PBMC provides a dense signaling-response setting with substanti al don or- and cell-t ype-dependent heterogeneit y , making it a usef ul testbed for context generalizatio n under imm une stim ulation [ 22 , 24 ]. • T ahoe-100M : a l arge-scale chemica l perturbation benchmark comprising m ore than 100 millio n single-cell expression profil es coll ected from 50 di verse cancer cell lines under o ver 1,100 treatment conditi ons inv olving hundreds of small-m olecule perturbations. Its scal e and cellular- context div ersit y make it a challenging testbed for evaluating context genera liz ation under broad chemica l interv entio n regimes [ 27 ]. • R eplogle-Nadig : a large-scale genetic perturbation benchmark built from geno me-scale CRISPRi P erturb-seq experiments across four human cell lines, with 2,024 genetic perturbatio ns ret ained after filtering perturbations with lo w on-target efficacy . Compared with l arge-effect chemi- cal perturbatio ns, this benchmark is particularly usef ul for assessing performan ce on subtler transcriptomi c perturbatio n signals [ 28 , 29 ]. Preprocessing and data s plits. F or PBMC and T ahoe-100M, w e foll ow the preprocessing protocol adopted in recent st andardi zed benchmarks: raw count matrices are first norma lized by per-cell library size, then transformed with log ( 1 + 𝑥 ) , and finally rescaled by a constant f actor of 10 before H VG selecti on [ 24 ]. After preprocessing, we extract the top 2,000 H V Gs using the standard Scanpy pipeline for downstream predicti on [ 24 ]. F or R eplogle-Nadig, we follo w ST A T E’s processed release: filtering by on-target knockdo wn efficacy , library-size normalization, log transformati on, and the same constant rescaling, then restricting the t ask to the shared 2,000-H VG space [ 22 , 24 ]. T o evaluate out-o f-context genera liz ation, we adopt dat aset-s pecific holdout strategies. F or PBMC, 4 o f the 12 donors are held out f or testing. T o assess predicti on under partial perturbation cov erage, 30% o f perturbatio ns from the held-out donors are mo ved into the training set, while the remaining 70% are reserv ed for test eva luation [ 22 , 24 ]. For T ahoe-100M, fiv e phenot ypically distinct cell lines are selected as a held-out test set based on PCA of pseudobulked expressio n profil es, and no data from these cell lines is used d uring m odel devel opment. F or R eplogle-N adig, f ollo wing the standardi zed eva luation protocol, on e cell line is held out as the test context while the remaining three cell lines are used for training and va lidatio n, together with a partial perturbation subset from the held-out context to evaluate cross-context transfer under incomplete perturbation cov erage [ 22 , 24 ]. 4.2. Experimental R esults SCALE achiev es state-of -the-art perf ormance for m ost of the metrics. Firstly , we align the pub lished ST A TE benchmark metrics with our intern al evaluatio n a s foll ow s: PR-R ecall as D E Precise , F C Spearman as DE Spearman fold change , and DE Ov erl ap Accuracy as D E Ov erl ap . F or consistency with this evaluati on t ab le, all results are displ ayed with three-decimal precision. F or benchmark baselin es, w e transcribed from the pub lished PerturbDiff eval result with the C ell E val besides the 10 ST A TE model. The results are presented in T a bl e 1 . T ab le 1 | Benchmark for few-s hot results on T ahoe-100M, PBMC and R eplogle dat asets under the Cell Ev al metric protocol. R o ws marked by † denote results reprodu ced in our implement atio n; all unmarked results are t aken from PerturbDiff . Specifica lly , SCALE results on T ahoe-100M, PBMC and R eplogle, together with ST ATE results on T ahoe-100M and R eplogle, are reprodu ced in our implementation. The best result in each metric within each dat aset is highlighted in bold, and the second-best result is underlined. Model MSE ↓ MAE ↓ PDCorr ↑ D EOver ↑ D EPrec ↑ LF CSpear ↑ DirAgr ↑ T ahoe-100M SCALE ( ours ) † 0.0002 0.006 0.953 0.806 0.765 0.876 0.949 ST ATE † [ 22 ] 0.0006 0.036 0.850 0.728 0.698 0.851 0.918 PerturbDiff [ 24 ] 0.0006 0.012 0.686 0.522 0.572 0.445 0.734 Mean 0.0031 0.026 0.205 0.430 0.504 0.280 0.595 CP A [ 11 ] 0.0009 0.011 0.425 0.502 0.504 0.466 0.710 Linear 0.0004 0.009 0.723 0.505 0.576 0.514 0.760 CellFlo w [ 25 ] 0.0031 0.027 0.269 0.183 0.313 0.298 0.638 Squidiff [ 30 ] 5.6270 2.244 0.011 0.420 0.581 0.276 0.501 Mean V ariant ( per Cell Type) 0.0007 0.010 0.461 0.504 0.508 0.578 0.688 Mean V ariant ( per Batch) 0.0031 0.026 0.185 0.427 0.504 0.270 0.587 Mean V ariant ( Overa ll) 0.0031 0.026 0.193 0.429 0.504 0.275 0.591 PBMC SCALE ( ours ) † 0.0320 0.118 0.979 0.810 0.831 0.516 0.682 ST ATE [ 22 ] 1.41e-4 0.005 0.796 0.512 0.547 0.602 0.789 PerturbDiff [ 24 ] 1.91e-4 0.006 0.816 0.564 0.581 0.519 0.751 Mean 8.49e-4 0.013 0.642 0.564 0.544 0.478 0.740 CP A [ 11 ] 1.10e-2 0.052 0.181 0.488 0.515 0.369 0.539 Linear 4.44e-4 0.009 0.646 0.549 0.581 0.366 0.666 CellFlo w [ 25 ] 3.58e-4 0.009 0.628 0.270 0.350 0.377 0.652 Squidiff [ 30 ] 4.387 2.062 0.033 0.359 0.547 0.022 0.379 Mean V ariant ( per Cell Type) 6.39e-4 0.009 0.400 0.506 0.542 0.247 0.635 Mean V ariant ( per Batch) 5.59e-4 0.007 0.517 0.554 0.542 0.489 0.727 Mean V ariant ( Overa ll) 1.01e-3 0.013 0.408 0.557 0.542 0.250 0.656 R eplogle SCALE ( ours ) † 0.0009 0.072 0.909 0.601 0.345 0.871 0.979 ST ATE † [ 22 ] 0.0064 0.055 0.437 0.196 0.193 0.506 0.778 PerturbDiff [ 24 ] 0.0147 0.081 0.340 0.190 0.174 0.342 0.702 Mean 0.0990 0.206 0.048 0.127 0.094 0.077 0.532 CP A [ 11 ] 0.0750 0.054 0.418 0.173 0.087 0.499 0.746 Linear 0.0130 0.074 0.058 0.068 0.074 0.056 0.535 CellFlo w [ 25 ] 0.0949 0.205 -0.003 0.110 0.093 -0.033 0.472 Squidiff [ 30 ] 4.6410 2.077 0.089 0.039 0.091 0.000 0.432 Mean V ariant ( per Cell Type) 0.0085 0.057 0.412 0.178 0.087 0.492 0.743 Mean V ariant ( per Batch) 0.0699 0.174 0.002 0.110 0.092 -0.024 0.475 Mean V ariant ( Overa ll) 0.0711 0.175 -0.001 0.111 0.093 -0.027 0.474 As sho wn in T ab le 1, SC ALE exhibits a clear decoupling bet w een biologi cal accuracy and global expressio n error . F or example, on the PBMC dat aset, our model achiev es a mu ch higher PDCorr (0.979) and D E Ov erl ap (0.810) than ST A T E [ 22 ] (0.796 and 0.512, respectiv ely). How ever , it yields a higher MSE (0.0320 vs. 1 . 41 × 10 − 4 ). This divergen ce is not a flaw , b ut a direct result of how perturbatio n respo nses are model ed and 11 T ab le 2 | Training and inference efficiency o f the BioNeMo-ba sed SCALE system. The t ab le reports training efficien cy under each framew ork’s nativ e epoch definition and inference-oriented throughput under cell-norma lized workloads. The training bl ock summarizes n ative epoch time and iteratio n throughput, whereas the inferen ce bl ock presents cell-norma liz ed throughput and the correspo nding speed up rel ative to ST A TE. Pretraining Inference Model Infra Nativ e epoch time ( s) ↓ Iter/s ↑ Speed up vs. S TA T E ( iter/s) ↑ Cells/epoch ↑ Cell-normalized throughput ( cells/s) ↑ Speed up vs. S TA T E (throughput) ↑ S T AT E -280M Original 1298.43 0.1540 1.00 × 4,705,402 21,584.40 1.00 × SCALE-184M BioNeMo 243.00 1.9259 12.51 × 5,187,584 27,818.20 1.29 × eva luated. W e attribute this to three main f actors. First, biologi cal perturbations usually affect only a small subset of genes [ 29 ]. MSE and MAE calculate errors across all 2,000 highly variab le genes ev enly . Therefore, a m odel that slightly shifts the baseline o f many unaffected background genes will get a worse MSE, even if it perfectly identifies the crucia l differentially expressed genes (DE Gs). Second, SCALE learns the perturbation as a transition vector [ 25 ]. Metrics like PDC orr eva luate the directio n and pattern o f this change. If the model correctly predicts the directio n o f gene expression shifts but slightly o verestimates the ma gnitude, the correlation remains very high, ev en though the absolute dist ance (MSE) increa ses. Fin ally , optimizing strictly f or MSE often leads to a "mean-effect" trap [ 24 ]. T o minimi ze ov erall error , baselin e models tend to predict a safe, av erage expression profil e. This redu ces MSE b ut sm ooths out the strong, heterogeneous signals needed to identif y true biologi cal respo nses. Instead of forcing the model to reconstruct an unobserv ed contin uou s trajectory or a generi c av erage st ate, SCALE directly learns the transitio n bet w een the observ ed st art ( control) and end ( perturbed) cell populations [ 22 , 24 ]. This approach av oids the mean-effect trap, prioritizing the reco very of meaningf ul biologi cal effects ov er simply fitting an av erage expressio n. BioN eMo-based training and inferen ce framework for virtual cell perturbation predicti on. T o red uce random I/O o verhead from l arge AnnData objects, we preprocess the dat aset into LMDB shards organized by experiment al conditio n. E ach perturbatio n sample is stored as a grouped entry together with a sparse matrix bl ock containing all cells under that perturbation, while control cells are stored separately in a dedicated LMDB for efficient retrieva l o f matched controls during training. Built on top o f this stora ge l ay out, w e implement the full SCALE training stack in BioNeMo to impro ve distributed executio n and end-to-end framework efficien cy at SCALE. W e also use batch-aware sampling as an auxiliary strategy to improv e hardware utiliz atio n under highly imbalanced perturbatio n groups. T ab le 2 sho ws that the dominant finding is end-to-end accelerati on from the BioN eMo-based frame- w ork. Under each framew ork’s native epoch definitio n, SC ALE redu ces wall-cl ock epoch time from 1298.43 s to 243.00 s, a 5.34 × red ucti on, and increases ra w iteration throughput from 0.1540 to 1.9259 iter/s, yielding a 12.51 × gain. Sin ce batch-aw are sampling changes the effectiv e num- ber of processed cells per epoch, we additio nally report cell-normalized throughput to provide a w orkload-align ed comparison across framew orks. Under this normalization, SCALE impro ves effectiv e throughput from 21,584.40 to 27,818.20 cells/s, correspo nding to a 1.29 × gain ov er the origin al ST A T E pipeline. W e emphasize that T ab le 2 reports end-to-end framework effici ency rather than a compo nent-wise attrib utio n; in particular , dat aloader-o nly speed up is not separately measured here. Ab l atio n dimensions. W e perf orm a systematic ab lation study to identif y which design choi ces are responsib le for the gains o f SCALE. Unl ess otherwise st ated, all ab l ations are cond ucted on the 184M-parameter backbone, eva luated on the same validati on split, and reported with PDC orr as 12 T oken Attn (base) Mean Pooling Basic Attn Seed Attn 1 0 2 1 0 1 1 0 0 0.0040 0.3318 0.0021 0.0023 M S E T oken Attn (base) Mean Pooling Basic Attn Seed Attn 1 0 1 1 0 0 0.0860 0.7353 0.0664 0.0679 M A E T oken Attn (base) Mean Pooling Basic Attn Seed Attn 0.0 0.5 1.0 0.7088 0.0891 0.7868 0.8019 P D C o r r Base Flow (v-pred/v-loss) w/ x-pred v-loss w/ x-pred x-loss w/ v-pred x-loss 1 0 3 1 0 2 0.0040 0.0019 0.0017 0.0022 M S E Base Flow (v-pred/v-loss) w/ x-pred v-loss w/ x-pred x-loss w/ v-pred x-loss 1 0 1 0.0860 0.0635 0.0615 0.0663 M A E Base Flow (v-pred/v-loss) w/ x-pred v-loss w/ x-pred x-loss w/ v-pred x-loss 0.0 0.5 1.0 0.7088 0.8162 0.8303 0.7814 P D C o r r Base Flow Gauss +0.5xCtrl Gauss +0.5xCtrl +15%Mask Ctrl+ 15%Mask 1 0 2 1 0 1 1 0 0 0.0040 0.0021 1.0444 0.0040 M S E Base Flow Gauss +0.5xCtrl Gauss +0.5xCtrl +15%Mask Ctrl+ 15%Mask 1 0 1 1 0 0 0.0860 0.0647 0.4934 0.0843 M A E Base Flow Gauss +0.5xCtrl Gauss +0.5xCtrl +15%Mask Ctrl+ 15%Mask 0.0 0.5 1.0 0.7088 0.7953 0.0992 0.6432 P D C o r r (b) Ablation of JiT training formulation (c) Ablation of flow prior distribution (a) Ablation of condition pooling/fusion Figure 3 | Ab l atio n study . W e an alyze three key design choi ces in SCALE: conditio n pooling/fusion, JiT training form ul atio n, and the design of prior distributi on. ( a) Adaptiv e conditio n aggregati on is critical, as mean pooling causes a clear performan ce drop, while basic and seed attention yield substantially better results. ( b) JiT parameterization consistently improv es o ver the base flo w f ormulatio n, with end point-oriented training ( x-pred/x-loss ) achieving the strongest o vera ll performan ce. ( c) A Gaussian- control mixed prior distrib utio n f urther improv es transport learning, whereas masking-ba sed variants sev erely degrade performan ce, suggesting that increasing path difficult y can be beneficial but ov erly destructiv e corruptio n is harmf ul in the latent space. the primary metric, with MSE and MAE as auxiliary reconstructi on metrics. T o redu ce conf ounding factors, each ab l ation changes only one compon ent at a time while keeping the remaining training setup fixed. W e study three orthogonal axes: (1) conditi on pooling / f usio n method in the conditi on encoder , (2) JiT training form ulation which defines the predictio n t arget and loss space, and (3) design of prior distrib ution for comparison bet w een control-anchored and Gaussian-mixed as the prior distributi on. This organiz atio n foll ow s the modeling decompositi on in the Method S ectio n: conditio n aggregati on determines how heterogeneo us perturbatio n and context cues are compressed, JiT variants determine ho w the transport target is parameteri zed, and st art-distributi on design determines how difficult the learn ed path is and whether the model is prone to fit a shortcut bet w een the control and perturb data distributi on. Conditi on pooling and f usio n. Let { ℎ 𝑖 } 𝑁 𝑖 = 1 denote token-lev el conditio n representations. W e write the pooled conditio n embedding as 𝑐 = 𝑁 𝑖 = 1 𝛼 𝑖 ℎ 𝑖 , 𝑁 𝑖 = 1 𝛼 𝑖 = 1 , (38) where diff erent f usio n backbon es correspond to different w eighting schemes. Mean pooling uses uniform weights 𝛼 𝑖 = 1 / 𝑁 , token attention learns token-wise adaptiv e w eights, and seed attentio n uses a learnab le seed query to aggregate conditio n tokens. This form ul atio n makes explicit the trade-off 13 bet ween simplicit y and adaptiv e weighting. Figure 3 ( a) sho ws that conditio n a ggregation is criti cal. Unif orm mean pooling causes a sharp performan ce drop, redu cing PDCorr from 0 . 7088 to 0 . 0891 , suggesting that naive av era ging destroys perturbatio n-specific signals. R epl acing the token-attention baselin e with basic attentio n impro ves PDCorr to 0 . 7868 , and seed attenti on f urther increases it to 0 . 8019 . These results indicate that adapti ve aggregati on is essential for perturbation predictio n, while seed-based aggregati on offers a stronger indu ctiv e bias than uniform pooling for compressing heterogeneous conditi on tokens. JiT ab lation. W e next ab l ate the JiT form ulation by varying both the predicti on t arget and the loss space. Specifi cally , the model predicts either the latent end point ˆ 𝑍 1 ( x-pred ) or the displacement field ˆ 𝑈 ( v-pred ), and is trained either in end point space ( x-loss ) or in displacement space ( v -loss ). This yields four possib le combinations, amo ng which the baseline Flo w corresponds to v-pred/v -loss . As shown in Figure 3 ( b) , all JiT variants outperf orm the ba seline form ulation, but the gains are highly asymmetri c. The strongest result is obtained by x-pred/x-loss , which impro ves PDCorr from 0 . 7088 to 0 . 8303 , together with low er MSE and MAE. x-pred/v-loss also perf orms strongly ( 0 . 8162 ), while v-pred/x-loss is subst anti ally wea ker ( 0 . 7814 ), though still abo ve the baselin e. This pattern suggests that, f or control-to-perturbati on transport in latent space, directly predicting the t arget end point is m ore st ab le than predicting an intermediate vel ocit y target derived from interpol ation. A m ore task-specifi c interpretation is that many perturbatio n responses in this benchmark correspond to rel ativ ely small and structured displacements from the control state. Under such scenario, learning the fin al perturbed end point may be a better match to the probl em geometry than learning a path- wise velocit y field alo ng interpolated states. The standard v -pred f ormulatio n requires supervision on intermediate points that are not themselves eva luation t argets, and may introduce unnecessary no ise or ambiguit y when the underlying control-to-perturbed transitio n is short. By contra st, direct end point prediction aligns the optimi zation objective m ore clo sely with the fin al predicti on t arget. This observation also raises a broader questio n: for perturbatio n regimes dominated by m odest state s hifts, it is not obvious that a multi-step flow-st yle form ul atio n is prefera b le to a simpler end-to-end mapping. Ho wev er , we empha si ze that flo w-based m odeling may still provide a stronger ind uctiv e bias in regimes with larger state dis pl acements, richer trajectory geometry , or expli cit dependence on time, do se, or compositi onal perturbation structure. In such settings, learning a shared vector field can capture transport regularities bey ond a single end point and may genera lize better than direct end point regression. Prior distributi on design. W e finally examine whether repl acing a control-an chored prior distri- b ution with a Gaussian-control mixed initializ atio n can mitigate shortcut behavi or . The intuition is that when the st art and end states are too similar , the model may ov erfit trivial shortcuts instead of learning a more genera l perturbati on transport rule. By increa sing the discrepancy bet ween the st art and target st ates, the Gaussian-mixed initi alization makes the transport prob lem less degenerate. The results are summarized in Figure 3 ( c) . Compared with the base Flo w model, a Gaussian + 0 . 5 × control initializatio n improv es PDCorr from 0 . 7088 to 0 . 7953 , while also red ucing MSE and MAE. This indicates that a partially randomized start can indeed regul arize the learning prob lem and mitigate shortcut behavi or . Ho wev er , mas king-based variants do not support a simil arly positi ve conclusi on. Applying a 15% mas k to the Gaussian-control st art causes a sev ere collapse in performan ce, and mas king the control initialization alo ne also red uces PDC orr to 0 . 6432 . These observati ons suggest that random mas king in the compressed latent space is too destructiv e for this t as k, likely because latent gene representations are already highly compressed and no lo nger exhibit the kind o f sparsit y that w ould make mas king benign. 14 Ov erall, the st art-distrib ution ab l ation supports a qualified conclusi on: increa sing path difficult y through Gaussian-control mixing can be benefi cial, but masking is not an effectiv e mechanism for impro ving genera liz ation in the current latent setup. T akeaw ay . The ab l atio n study rev eals that the gains o f SCALE do not come from introdu cing flo w matching al one. Instead, they arise from the interaction of three design choices: Key Design Principles. (1) adaptiv e conditi on aggregation , which is necessary to preserv e heteroge- neo us perturbation cues; (2) end point-ori ented JiT parameteri zation , which st abilizes optimi zation in l atent transport learning; and (3) a less degenerate st art distrib utio n , which can red uce shortcut learning when introdu ced caref ully . T ogether , these results support the view that l arge-scal e perturbatio n predicti on requires co-design across conditio n encoding, transport parameteri zation, and optimiz ation geometry , rather than a single architectural m odificati on. 4.3. Scaling Study W e an alyze model scaling from a strict Cell-Eva l compariso n , where w e eva luate the selected l arge m odels using the full h5ad-based cell-lev el evaluati on pipeline on T ahoe validati on and test splits. T ab le 3 | Scaling study of SCALE under strict Cell-Eva l on T ahoe using the f ull h5ad-based evaluatio n pipeline. Protocol Ev al Dataset P arams MSE ↓ MAE ↓ PDCorr ↑ D EOver ↑ LFCSpear ↑ Strict Cell-Eva l T ahoe val 184M 0.0020 0.0058 0.9589 0.8026 0.8876 Strict Cell-Eva l T ahoe val 280M 0.0020 0.0061 0.9556 0.7975 0.8742 Strict Cell-Eva l T ahoe test 184M 0.0020 0.0058 0.9526 0.8055 0.8758 Strict Cell-Eva l T ahoe test 280M 0.0020 0.0060 0.9502 0.8008 0.8669 Strict Cell-Ev al scaling on Ta hoe. W e then examine whether the gains observ ed in training-time proxy metrics translate into strict bi ologica l eva luation. F or this purpose, we compare the selected 184M and 280M SCALE models using the f ull Cell-Eva l pipeline on T ahoe val and test , including not only MSE/MAE/PDCorr but also D E-oriented metrics. Here, the results indicate clear saturation. On T ahoe val , the 184M model slightly outperforms the 280M model in PDCorr (0.9589 vs. 0.9556), D E Ov erl ap (0.8026 vs. 0.7975), and D E LF C Spearman (0.8876 vs. 0.8742). The same pattern holds on T ahoe test , where the 184M model achiev es 0.9526 vs. 0.9502 in PDCorr and 0.8055 vs. 0.8008 in D E Overlap. Although the 280M model remains highly competitiv e, these results sho w that under strict biologi cal evaluati on, the perf ormance gain saturates around the 184M regime. Interpretation. T aken together , these scaling results suggest a compute-effi cient pl ateau under the current recipe rather than clear evidence for continu ed biol ogica l gains from additio nal parameter gro wth. Increa sing model capacit y is beneficial up to a moderate SCALE in our completed runs, b ut the strict Cell-Ev al results indicate that mo ving from 184M to 280M does not yield a reliab le impro vement on the main biol ogical metrics. Practically , this means that, under the present data regime, optimization setup, and eva luation protocol, the 184M model already captures mo st of the observ ed benefit while remaining m ore efficient than the larger 280M alternativ e. 15 5. Discussi on Our findings m otivate a broader re-examin atio n of ho w virtual-cell perturbatio n m odels are eva luated, compared, and interpreted. Cell-Eva l remains biol ogica lly meaningf ul, b ut its practical use is still sensitive to implemen- tation details. Although Cell-Eva l is substantially m ore biol ogically informati ve than count-o nly reconstru ctio n metrics, our results suggest that it is not yet f ully stab le a s an eva luation instrument across codebases and executio n paths. In our experiments, reprod uced scores can differ across imple- mentations, and training-time proxy metrics do not alw ays a gree with the fin al file-based Cell-Eva l results obt ained from exported predictio ns. This implies that benchmark scores ma y depend not only on model qualit y , b ut also on hidden choices in preprocessing, aggregati on, seri alization, and eva luator code. W e theref ore believ e that f uture progress in virtual-cell benchmarking will require a m ore st andardiz ed and transparent eva luation pipeline, with stricter control ov er preprocessing, split constru ctio n, perturbation subsets, and eva luator implementation. The current flo w f ormulati on may be easi er to optimiz e than to genera lize. Second, our ab l ations raise the possibilit y that current flo w-based perturbation f ormulatio ns are vulnerab le to shortcut solutio ns. The improv ements of our method do not come from flo w matching in isolation, b ut from a specifi c combination of end point-oriented supervision, conditio n design, and path constructi on. Notab ly , the st andard control-to-perturbed setup appears ea sier to optimize than to generalize, especially when the start and target st ates are already close in represent atio n space. Under such conditi ons, a model may achiev e strong end point metrics through loca l interpolation-fri end ly heuristics without learning a robust perturbatio n transport rule. W e theref ore argue that f uture w ork should compare m ultiple transport-st yle models under a fully unified setting to determine whether the current flo w paradigm captures causal perturbation structure or merely exploits shortcut geometry . Cross-pa per benchmark comparisons remain only parti ally protocol-align ed. Third, many existing compariso ns [ 31 – 34 ] remain only partially align ed to the C ell-Eva l protocol used by ST A T E. Prior benchmark t ab les o ften combine reprodu ced baselin es with results reported from other works under different preprocessing and eva luation pipelines. Such practice is understandab le giv en the cost o f large-scale benchmarking, but it makes small numeri cal differen ces difficult to interpret. This prob lem becomes particularly acute when the eva luator itself is sensitiv e to implement atio n det ails. W e therefore believe that strict protocol parit y , including identical preprocessing, split constru ctio n, perturbatio n subsets, and eva luator code, is no w essential for reliab le progress claims. Likewise, our goal is not to reject flo w-based m odeling as a whole, but to highlight that the current form ul atio n o f control-to-perturbed transport may not yet be the m ost reli ab le wa y to capture per- turbatio n dynamics. W e try to suggest that the next bottleneck in virtual-cell predicti on may lie less in model scaling al one and m ore in rebuilding the eva luation and comparison framew ork around reprod ucibilit y , biol ogica l validity , and protocol alignment. 6. Conclu sio n In this work, w e hav e presented SCALE, an end point-a ligned conditi onal transport framew ork for single-cell perturbation predictio n under paired end point supervision. Rather than attempting to reconstru ct an unobserv ed intermediate biologi cal trajectory , SCALE m odels perturbatio n predicti on as transport bet ween observed control and perturbed cell popul atio ns in a set-aw are l atent space. This design combines a hierarchica l encoder that captures both within-cell transcriptional structure and across-cell popul ation context with a conditi onal transport backbone that predicts the perturbed end point in a tract ab le and observati on-consistent latent represent atio n. Empirically , our results sho w 16 that strong perf ormance in virtual-cell predictio n depends not only on model capacit y , but also on the co-design of scalab le infrastru cture, endpo int-matched supervision, and biol ogica lly grounded eva luation. T aken together , these findings suggest that end point-align ed latent transport provides a practica l and effecti ve foundati on for l arge-scal e virtual-cell modeling across div erse settings. Ov erall, SCALE provides a simple yet effectiv e view o f virtual cell predicti on: learn a conditio nal transport bet w een supervised biologica l end points, anchor the l atent manifold to measurab le gene expressio n, and decode the transported st ate back to expression space for evaluatio n and downstream analysis. These results suggest that end point-align ed l atent transport is a promising foundati on for scalab le perturbatio n modeling, and may off er a usef ul path to ward m ore general virtu al cell fo undatio n models across dat asets, perturbati on t ypes, and biologi cal contexts. R eferences [1] Charlotte Bunne et al. H ow to build the virtual cell with artificia l intelligence: pri orities and opportunities. Cell , 2024. [2] Jennifer E. R ood et al. T oward a fo undation m odel of causa l cell and tissue biology with a perturbatio n cell atlas. Cell , 2024. [3] Charlotte Bunne et al. L earning single-cell perturbation respo nses using neural optimal transport. Nature Methods , 20:1759–1768, 2023. [4] Kenji Kamimoto et al. Dissecting cell identit y via net w ork inf erence and in silico gene perturba- tio n. Nature , 2023. [5] Y usuf H . R oohani et al. Virtual cell challenge: T o ward a turing test for the virtual cell. Cell , 2025. [6] T ianhong Li and Kaiming He. Back to basics: L et denoising generativ e models denoise. arXi v preprint arXiv:2511.13720 , 2025. [7] R omain L opez et al. Deep generati ve modeling for single-cell transcriptomics. N ature Methods , 15:1053–1058, 2018. [8] Haotian Cui, Chloe W ang, Hassaan Ma an, Kuan P ang, F ei Luo, Nan Duan, and et al. scgpt: to ward building a foundati on model for single-cell multi-o mics using generativ e ai. Nature Methods , 21(8):1470–1480, 2024. doi: 10.1038/s41592- 024- 02201- 0. URL https://pubmed. ncbi.nlm.nih.gov/38409223/ . [9] Gefei W ang, Tianyu Liu, Jia Zhao, Y oushu Cheng, and Hongyu Z hao. Modeling and predicting single-cell multi-gen e perturbation responses with sclambda. Bioinf ormatics , 2024. [10] Mohammad L otfolla hi, F . Alexander W olf, and F abian J . Theis. scgen predicts single-cell pertur- batio n respo nses. Nature Methods , 16(8):715–721, 2019. doi: 10.1038/s41592- 019- 0494- 8. URL https://www.nature.com/articles/s41592- 019- 0494- 8 . [11] Mohammad L otfollahi et a l. Predicting cellul ar respo nses to complex perturbatio ns in high- throughput screens. Molecular Systems Biology , 19(6):e11517, 2023. doi: 10.15252/msb. 202211517. URL https://pubmed.ncbi.nlm.nih.gov/37154091/ . [12] Y usuf R oohani, Kexin Hu ang, and Jure L esko vec. Predicting transcriptional out- comes of no vel m ultigene perturbati ons with gears. Nature Biotechnol ogy , 2024. doi: 10.1038/s41587-023- 01905- 6. URL https://www.nature.com/articles/ s41587- 023- 01905- 6 . 17 [13] Ke W ei et al. scpregan: a generativ e adv ersarial net w ork for single-cell perturbation predictio n. Bio informati cs , 38(13):3377–3385, 2022. [14] Qun Jiang, Shengquan Chen, Xiaoyang Chen, and R ui Jiang. scpram accurately predicts single- cell gene expressio n perturbation response based on attention mechanism. Bioinf ormatics , 40 (5):btae265, 2024. doi: 10.1093/bioinf ormatics/btae265. [15] Constantin Ahlmann-Eltze, W olfgang Huber , and Sim on Anders. Deep-learning-ba sed gene perturbatio n effect predictio n does not yet outperf orm simple linear baselin es. Nature Methods , 22(8):1657–1661, 2025. doi: 10.1038/s41592- 025- 02772- 6. URL https://pubmed.ncbi. nlm.nih.gov/40759747/ . [16] Charlotte Bunne, Stefan G. Stark, Gabri ele Gut, and et a l. L earning single-cell pertur- batio n responses using neural optima l transport. Nature Methods , 20(11):1759–1768, 2023. doi: 10.1038/s41592- 023- 01969- x. URL https://www.nature.com/articles/ s41592- 023- 01969- x . [17] Alexander T ong et al. Cinema-ot: causa l inference of single-cell perturbatio n effects vi a optimal transport. Nature Methods , 2023. [18] Zhen Y ao et al. Perturbn et: L earning single-cell perturbation responses with gra ph n eural net w orks. In NeurI PS , 2022. [19] et al. W ang. screpa: represent atio n learning for single-cell perturbation analysis. Bri efings in Bio informati cs , 2025. [20] Kang Bi oinf ormatics L ab. Inferring perturbation responses in temporally sampled single-cell data. Briefings in Bio informati cs , 23(5), 2022. [21] Chenglei Y u, Chuanrui W ang, Bangyan Liao, and T ailin Wu. scdfm: Distributi onal flo w matching m odel for robust single-cell perturbation predictio n. arXiv preprint , 2026. [22] Ab hinav K. Adduri, Dhruv Gautam, Beatrice Bevil acqua, Alishba Imran, R ohan Sha h, et al. Predicting cellul ar responses to perturbatio n across div erse contexts with St ate. bioRxiv , 2025. doi: 10.1101/2025.06.26.661135. URL https://www.biorxiv.org/content/10.1101/ 2025.06.26.661135v2 . [23] Zhaokang Liang et al. scppdm: A diff usio n model for single-cell drug-response predictio n. arXiv preprint arXiv:2510.11726 , 2025. [24] Xinyu Y u an, Xixian Liu, Y a Shi Zhang, Zuobai Z hang, Ho ngyu Guo, and Jian T ang. Perturbdiff: Functi onal diff usion for single-cell perturbation modeling, 2026. URL abs/2602.19685 . [25] Dominik Klein, Jona s Simo n Fleck, Daniil Bobrovs kiy , Lea Z immermann, Sören Becker , et al. CellFlo w enab les generati ve single-cell phenot ype modeling with flo w matching. bioRxiv , 2025. doi: 10.1101/2025.04.11.648220. URL https://www.biorxiv.org/content/10.1101/ 2025.04.11.648220v1 . [26] Changxi Chi, Jun Xia, Y ufei Huang, Jingbo Z hou, Siyu an Li, Y unfan Liu, Chang Y u, and St an Z. Li. Unla sting: U npaired single-cell m ulti-perturbatio n estimation by d ual conditi onal diff usion implicit bridges, 2025. URL . 18 [27] Jesse Zhang, Airol A. Uba s, Richard de Borja, V alentin e Svensso n, Nicol e Thomas, Neha Thakar , Ian L ai, Aidan Winters, Umair Khan, Matthew G. Jo nes, et a l. T ahoe-100m: A giga-scal e single- cell perturbatio n atl as f or context-dependent gene f uncti on and cellular m odeling. bioRxiv , 2025. doi: 10.1101/2025.02.20.639398. [28] Jo seph M. R eplogle, Reuben A. Saunders, Angel a N . Pogso n, Jeffrey A. Hussmann, Alexander L enail, Aleksandra Guna, Laura Mascibroda, Emily J . W a gner , K yuho Adelman, Galia Lithwick- Y anai, et al. Ma pping informati on-rich genot ype-phenot ype l andscapes with genome-sca le perturb-seq. Cell , 185(14):2559–2575.e28, 2022. doi: 10.1016/j.cell.2022.05.013. [29] Ajay Nadig, Joseph M. R eplogle, Angel a N . Pogso n, Mukund h Murthy , Steven A. McCarroll, Jo nathan S . W eissman, Elise B. R obinson, and Luke J . O’Connor . T ranscriptome-wide analysis o f differential expression in perturbation atl ases. Nature Geneti cs , 57(5):1228–1237, 2025. doi: 10.1038/s41588- 025- 02169- 3. [30] Siyu He, Y uefei Zhu, Daniel Nav eed T a vakol, Haoti an Y e, Y eh-Hsing Lao, Z ixian Zhu, C ong Xu, Shrad ha Chauhan, Guy Gart y , Raju T omer , Gordan a V unjak-N ov ako vic, J ames Zou, Elham Azizi, and Kam W . L eong. S quidiff: predicting cellul ar devel opment and responses to perturbatio ns us- ing a diff usio n model. Nature Methods , 23(1):65–77, 2026. doi: 10.1038/s41592- 025- 02877- y. URL https://www.nature.com/articles/s41592- 025- 02877- y . [31] Y . Wu et al. P erturbench: Benchmarking machine learning models for single-cell perturbatio n predicti on. arXiv preprint , 2024. [32] A systemati c comparison of single-cell perturbatio n respo nse predicti on m odels. bioRxiv , 2025. [33] BM2 L ab. Benchmarking algorithms f or genera liz ab le single-cell perturbatio n predicti on. https: //bm2- lab.github.io/scPerturBench- reproducibility/ , 2024. [34] A benchmark for predictio n of transcriptomi c responses to perturbatio ns. In NeurI PS , 2024. 19 A. P erturbatio n Metrics W e adopt the evaluatio n protocol used in CellFlo w [ 25 ] and the Cell-Eva l framework (versio n 0.6.6) from ST ATE to assess perturbation predictio n perf ormance. A f undamental chall enge in single-cell perturbatio n predicti on is that individ ual cells cannot be matched to a specific ground truth due to biol ogical variability and the destructi ve nature of sequencing. Therefore, eva luation m ust rely on statistics computed at the popul atio n lev el. F or cl arit y , the eva luation metrics are organized alo ng t wo axes. Cell-lev el evaluati on. These metrics quantif y expressi on-lev el fidelit y by comparing statistical summaries bet w een predicted cell popul atio ns and the correspo nding ground-truth populatio ns. Gene-l evel evaluati on. These metrics assess biologica l signal consisten cy by examining whether predicted perturbation responses recov er the differentia l expression patterns observed in the ground truth. T o ensure fair comparison across methods, the same set o f control cells is used when computing both predicted and ground-truth statistics. As a result, performance differences reflect only the qu alit y o f the predicted perturbed-cell responses. Notatio n. Let 𝑀 denote the total number of perturbation conditio ns. For a perturbati on 𝜆 , l et { x pert 𝜆 , 𝑖 } 𝑁 𝜆 pert 𝑖 = 1 and { x ctrl 𝜆 , 𝑖 } 𝑁 𝜆 ctrl 𝑖 = 1 denote the ground-truth expression profil es o f perturbed and control cells. L et { ˆ x pert 𝜆 , 𝑖 } 𝑁 𝜆 pert 𝑖 = 1 denote the predicted perturbed cells. In practice, Cell-Eva l uses 𝑁 𝜆 ctrl = 𝑁 𝜆 pert . W e define pseudob ulk expressio n profil es as the mean expressio n across cells: ¯ x pert 𝜆 = 1 𝑁 𝜆 pert 𝑁 𝜆 pert 𝑖 = 1 x pert 𝜆 , 𝑖 , ¯ x ctrl 𝜆 = 1 𝑁 𝜆 ctrl 𝑁 𝜆 ctrl 𝑖 = 1 x ctrl 𝜆 , 𝑖 . (39) The pseudob ulk pro file f or predicted perturbed cells is ¯ ˆ x pert 𝜆 = 1 𝑁 𝜆 pert 𝑁 𝜆 pert 𝑖 = 1 ˆ x pert 𝜆 , 𝑖 . (40) The rel ative perturbation effect is defined a s the differen ce bet ween perturbed and control pseu- dob ulk profil es: Δ x 𝜆 = ¯ x pert 𝜆 − ¯ x ctrl 𝜆 , (41) Δ ˆ x 𝜆 = ¯ ˆ x pert 𝜆 − ¯ x ctrl 𝜆 . (42) These quantities are used throughout the evaluati on metrics belo w . A.0.1. A veraged Expressio n Accuracy • Coefficient of Determin ation ( R 2 ). The 𝑅 2 metric measures the fracti on of variance in the ground-truth dat a expl ained by the predicti ons relativ e to the empirica l mean ba seline: 𝑅 2 = 1 − Í 𝑖 ( 𝑦 𝑖 − ˆ 𝑦 𝑖 ) 2 Í 𝑖 ( 𝑦 𝑖 − ¯ 𝑦 ) 2 . 20 Higher va lues indicate better predicti ve accuracy . • P erturbation Discrimin ation S core ( PDS). PDS evaluates whether the predicted perturbation pro file is closest to its own ground truth compared with other perturbatio ns: PD S = 1 − 1 𝑀 𝑀 𝜆 = 1 𝑟 𝜆 𝑀 , 𝑟 𝜆 = 𝑝 ≠ 𝜆 1 𝑑 ( Δ ˆ x 𝜆 , Δ x 𝑝 ) < 𝑑 ( Δ ˆ x 𝜆 , Δ x 𝜆 ) . A va lue o f 1 indicates perfect discrimination, while a va lue clo se to 0 . 5 correspo nds to random performan ce. W e report three variants using different dist ance f unctio ns: L1 distance (PDS L1 ), L2 distance (PD S L2 ), and cosine distance (PD S cos ). • P earson Delt a Correl ation ( PDCorr). For each perturbatio n 𝜆 , the Pearso n correlation bet w een predicted and ground-truth perturbatio n effects is computed as PDCorr = 1 𝑀 𝑀 𝜆 = 1 P earsonR ( Δ ˆ x 𝜆 , Δ x 𝜆 ) . • Mean Absolute E rror (MAE). MAE measures the discrepancy bet ween predicted and ground- truth perturbatio n effects: MAE = 1 𝑀 𝑀 𝜆 = 1 ∥ Δ ˆ x 𝜆 − Δ x 𝜆 ∥ 1 . • Mean Squared Error (MSE). MSE pen alizes l arger devi atio ns more strongly by using the squared Euclidean dist ance: MSE = 1 𝑀 𝑀 𝜆 = 1 ∥ Δ ˆ x 𝜆 − Δ x 𝜆 ∥ 2 2 . A.0.2. Biol ogica lly Meaningf ul Differentia l P atterns T o assess biol ogical relevance, Cell-Eva l performs differential expression (DE) analysis using the Wil coxon rank-sum test. T o control f alse discov eries arising from multipl e testing across thousands o f genes, 𝑝 -va lues are adjusted using the Benjamini–Hochberg procedure, which controls the false disco very rate (FD R). D E an aly sis is perf ormed independently on ground-truth cells and predicted cells. Notatio n related to D EGs. L et G denote the set of the top 2,000 highly variab le genes (H VGs) used in perturbatio n predicti on. F or perturbatio n 𝜆 , a gene 𝑔 ∈ G is considered significantly differentia lly expressed if its adjusted 𝑝 -va lue satisfies 𝑝 adj < 0 . 05 . L et G D E 𝜆 denote the set of significant D E genes in the ground truth and ˆ G D E 𝜆 the corresponding set from predicted cells. Genes are ranked by absolute log-fold change: | log F C 𝜆 , 𝑔 | = log 2 ¯ x pert 𝜆 , 𝑔 + 𝜖 ¯ x ctrl 𝜆 , 𝑔 + 𝜖 . Predicted fold changes are computed analogo usly using predicted pseudobulk expressio ns. L et G 𝑘 𝜆 and ˆ G 𝑘 𝜆 denote the top- 𝑘 ranked D E genes from ground-truth and predicted cells. 21 • D E Overlap ( D EOver). D EOver 𝑘 = 1 𝑀 𝑀 𝜆 = 1 | G 𝑘 𝜆 ∩ ˆ G 𝑘 𝜆 | 𝑘 . Here 𝑘 = | G D E 𝜆 | . • D E Precision (DEPrec). D EPrec 𝑘 = 1 𝑀 𝑀 𝜆 = 1 | G 𝑘 𝜆 ∩ ˆ G 𝑘 𝜆 | | ˆ G 𝑘 𝜆 | . Here 𝑘 = | ˆ G D E 𝜆 | . • Directio n Agreement (DirAgr). L et G ∩ 𝜆 = ˆ G D E 𝜆 ∩ G D E 𝜆 . DirAgr = 1 𝑀 𝑀 𝜆 = 1 | { 𝑔 ∈ G ∩ 𝜆 : sgn ( log FC 𝜆 , 𝑔 ) = sgn ( log F C 𝜆 , 𝑔 ) } | | G ∩ 𝜆 | . • L og F old-change Spearman Correl atio n ( LFCSpear). LF C Spear = 1 𝑀 𝑀 𝜆 = 1 SpearmanR ( log F C 𝜆 , 𝑔 ) 𝑔 ∈ G DE 𝜆 , ( log FC 𝜆 , 𝑔 ) 𝑔 ∈ G DE 𝜆 . • R OC -AU C (A UR OC). Genes in G D E 𝜆 are treated as positiv es and the remaining genes as negativ es. Predicted significance scores are defined as the negativ e log-transformed adjusted 𝑝 -va lues. AUR OC is computed for each perturbatio n and a vera ged across perturbatio ns. • PR-A UC ( AUPRC). This metric is computed an al ogously to AUR OC but summari zes the precisio n–recall trade-off instead o f the R OC curve. 22
Original Paper
Loading high-quality paper...
Comments & Academic Discussion
Loading comments...
Leave a Comment