Analysis of molecular dynamics simulation data via statistical distances between covariance matrices
Molecular dynamics (MD) simulations are powerful tools for elucidating the macroscopic physical properties of materials from microscopic atomic behaviors. However, the massive, high-dimensional datasets generated by MD simulations pose a significant …
Authors: Yusuke Ono, Takumi Sato, Kenji Yasuoka
Analysis of molecular dynamics sim ulation data via statistical distances b et w een co v ariance matrices Y usuk e Ono 1 ∗ , T akumi Sato 2 † , Kenji Y asuok a 2 ‡ , and Lin yu Peng 2 § 1. Gr aduate Scho ol of Scienc e and T e chnolo gy, Keio University, Y okohama 223-8522, Jap an 2. Dep artment of Me chanic al Engine ering, Keio University, Y okohama 223-8522, Jap an Marc h 19, 2026 Abstract Molecular dynamics (MD) sim ulations are p o werful tools for elucidating the macroscopic phys- ical prop erties of materials from microscopic atomic b eha viors. Ho wev er, the massive, high- dimensional datasets generated by MD simulations p ose a significant c hallenge for analysis, ne- cessitating efficient dimensionality reduction and feature extraction tec hniques. While existing metho ds such as principal component analysis and unsup ervised learning hav e b een utilized, issues regarding data efficiency and computational cost remain. In this study , w e prop ose a statisti- cal analysis framework fo cusing on the analysis of the particle data distributions through their co v ariance matrices, corresponding to the second-order momen ts of MD tra jectory data. Discrep- ancies b et ween system states are quan tified using statistical distances b et ween these cov ariance matrices. By applying dimensionalit y reduction to the resulting distance matrix, we extract low er- dimensional features that c haracterize the systems’ dynamics. W e v alidate the prop osed metho d using Lennard-Jones (LJ) particle systems under different temp erature conditions, as w ell as sepa- rate bulk systems of ice and liquid w ater. The results of LJ particles demonstrate an appro ximately linear correlation b et ween the first principal comp onen t obtained through dimensionalit y reduction of the distance matrix and the diffusion co efficien t. This suggests that global physical prop erties can b e effectively inferred from lo cal statistical information, such as cov ariance matrices, offering a data-efficient alternative for analyzing complex molecular systems. F urthermore, in the case of separate bulk systems of ice and liquid water, the metho d successfully distinguishes b et ween the t wo phases, highligh ting its p oten tial for characterizing phase transitions and structural differences in molecular systems. 1 In tro duction Molecular dynamics (MD) simulations ha ve established themselves as indisp ensable to ols in mod- ern materials science and ph ysics. By numerically integrating the equations of motion of atoms and molec ules, MD simulations enable the in vestigation of material prop erties at atomic resolution, thereb y bridging the gap b et ween microscopic in teractions and macroscopic observ ables [2, 14, 22]. This approach has b een successfully applied to a wide range of systems, from simple fluids to complex biomolecules, allo wing the ev aluation of mechanical, thermal, electrical, and magnetic prop erties that are often difficult to access exp erimen tally [9, 36]. Ho wev er, adv ances in high-p erformance computing ha ve led to a rapid gro wth in the volume of MD data. Mo dern simulations routinely generate massiv e datasets containing the positions and v elo cities of thousands to millions of particles o ver long time ∗ Email: yuu555yuu@keio.jp † Email: sato8322@keio.jp ‡ Email: yasuok a@mec h.keio.ac.jp § Corresp onding author. Email: l.p eng@mec h.keio.ac.jp 1 scales. Extracting meaningful and in terpretable ph ysical insights from suc h high-dimensional data re- mains computationally demanding and nontrivial. Consequently , there is a pressing need for efficien t data analysis frameworks that can reduce the dimensionalit y of MD tra jectories while preserving the essen tial dynamics go verning macroscopic behavior. T o address the c hallenges p osed by high-dimensional data, v arious dimensionalit y reduction and feature extraction techniques hav e b een introduced in computational physics. These tec hniques are generally categorized as linear or nonlinear metho ds [12, 35, 37]. Classical linear approaches such as principal comp onen t analysis (PCA) hav e b een widely used to identify collectiv e motions in pro- teins and to c haracterize complex energy landscap es [3, 13, 24, 25, 28]. More recently , adv anced sig- nal pro cessing techniques, such as singular sp ectrum transformation, hav e shown promise in detect- ing changes in protein motion mo des [40]. In con trast, nonlinear metho ds, including t-distributed sto c hastic neighbor em b edding (t-SNE) [39], uniform manifold approximation and pro jection [30], and mo dern unsup ervised machine learning algorithms using v ariational auto encoders [23] and gen- erativ e adversarial net works [18], ha ve b een emplo yed to capture intricate, nonlinear relationships in MD data [11, 16, 17, 21, 38, 41]. A key adv antage of nonlinear approaches is their ability to preserve more complex structural information than linear metho ds when reduced to the same dimensionalit y . Despite these developmen ts, existing metho ds often face limitations in terms of data efficiency and in terpretability . Many data-driven approac hes op erate directly on ra w tra jectory data, w hic h can b e computationally exp ensiv e and ma y obscure the underlying ph ysical mec hanisms. Moreo ver, there is often a gap b et ween the geometric features extracted b y suc h algorithms and the thermo dynamic or transp ort prop erties of in terest. Developing a metho d that is b oth computationally efficient and ph ysically interpretable therefore remains an op en challenge. In this study , we prop ose an alternative statistical framework that fo cuses on co v ariance matri- ces deriv ed from MD data, such as particle p ositions or velocities, which corresp ond to the second- order moments of the underlying probability distributions. In statistical mec hanics, fluctuations— particularly velocity fluctuations—and their correlations are intrinsically related to thermo dynamic state v ariables and transp ort coefficients [26, 31]. Therefore, the cov ariance matrix provides a compact y et information-rich descriptor for capturing linear correlations within the system [20]. W e ackno wl- edge, as discussed in [27], that complex MD systems such as biomolecules also exhibit nonlinear correlations. Nev ertheless, since man y thermo dynamic quantities are directly link ed to second-order momen ts of v elo cit y , we adopt the co v ariance matrix as the primary descriptor in this work. Our metho dology cen ters on quan tifying the statistical distance b et ween cov ariance matrices de- riv ed from different time windows or system states. By constructing a distance matrix that captures the dissimilarity b et w een these states and applying dimensionality reduction to this distance matrix, w e obtain a low er-dimensional representation of the system’s evolution. This approach enables the iden tification of subtle differences in thermo dynamic states that ma y not b e apparent from conv en- tional co ordinate-based metrics. The main contributions of this study are summarized as follo ws: • W e in tro duce a no vel framew ork for analyzing MD simulation data based on statistical distances b et w een co v ariance matrices of particle time-series data. • W e demonstrate that this approach effectively captures the system’s dynamics and enables di- mensionalit y reduction while preserving essential ph ysical information. • W e v alidate the prop osed metho d using t wo types of MD datasets. First, we apply it to a Lennard-Jones (LJ) particle system and demonstrate a clear correlation b et w een the extracted lo wer-dimensional features and macroscopic transp ort prop erties, such as the diffusion co efficien t. Second, we inv estigate bulk systems of ice and liquid water, showing that the method effectively distinguishes b et ween differen t molecular phases. The remainder of this pap er is organized as follows. In Section 2, we presen t the theoretical foun- dation of the statistical distance framew ork and describ e the computational procedures and algorithms emplo yed. In Section 3, w e apply the prop osed method to LJ particle systems at v arious temperatures, as w ell as to separate bulk systems of ice and liquid water, and discuss the relationship b et ween the extracted features and ph ysical prop erties. Finally , Section 4 summarizes our findings and outlines p oten tial directions for future researc h. 2 2 Dimensionalit y reduction via statistical distances In this section, we introduce the prop osed metho d for analyzing MD data using statistical distances be- t ween estimated cov ariance matrices. T o establish its statistical foundation, we b egin with the method of moments, a class ical estimation framew ork in which the parameters of a probability distribution are obtained by equating sample momen ts with their theoretical counterparts [33]. Let W ∈ R d b e a random v ector with some probability density function f ( W ) . The n -th momen t of the distribution is defined as E [ W ⊗ n ] , (1) pro vided that the exp ectation exists, where E [ ⋅ ] is the statistical exp ectation and ⊗ denotes the tensor pro duct. In particular, the first-order momen t corresponds to the mean vector, E [ W ] , (2) while the second-order central momen t corresp onds to the cov ariance matrix E [( W − E [ W ])( W − E [ W ]) ⊺ ] . (3) No w let N observ ations { x 1 , x 2 , . . . , x N } b e giv en, where each x k ∈ R d . The first-order and second-order moments, i.e., the mean v ector and the co v ariance matrix, can b e estimated from the observ ations as µ = 1 N N ∑ i = 1 x i , (4) and Σ = 1 N N ∑ i = 1 ( x i − µ )( x i − µ ) ⊺ . (5) Under the assumption of m ultiv ariate normality , this sample co v ariance matrix (SCM) coincides with the maximum lik eliho od estimator of the co v ariance matrix [19]. A known limitation of the SCM is that its accuracy critically dep ends on the av ailability of a sufficiently large num b er of indep enden t and identically distributed (i.i.d.) observ ations [34]. In our framew ork, the estimators of the mean v ector and cov ariance matrix serve as fundamental statistical descriptors for the multidimensional analysis of MD tra jectories. W e no w describe ho w cov ariance matrices are constructed from time-series data obtained through MD simulations. Let x k = ( x 1 k , x 2 k , x 3 k ) ∈ R 3 (6) b e a series of data (i.e., p ositions or velocities) obtained from simulations or exp erimen ts; k means discrete time ph ysically , i.e., x k = x ( k ∆ t ) where ∆ t is the timestep. The series is divided into small pieces, referred to as sub-windo ws, each of length N , as follo ws {( x 1 , x 2 , . . . , x N ) , ( x N + 1 , x N + 2 , . . . , x 2 N ) , . . . , } . (7) Eac h small piece can be written as a 3 × N matrix (with v ectors in R 3 expressed as columns), and we assume that there are K num bers of them, namely X 1 = [ x 1 , x 2 , . . . , x N ] , X 2 = [ x N + 1 , x N + 2 , . . . , x 2 N ] , . . . , X K = [ x ( K − 1 ) N + 1 , x ( K − 1 ) N + 2 , . . . , x K N ] . Therefore, X m ∈ R 3 × N denotes the data matrix for the m -th segmen t (1 ≤ m ≤ K ). F or each segment X m , we omit the index m when no confusion arises and denote its comp onen ts as x 1 1 x 1 2 ⋯ x 1 j ⋯ x 1 N x 2 1 x 2 2 ⋯ x 2 j ⋯ x 2 N x 3 1 x 3 2 ⋯ x 3 j ⋯ x 3 N , (8) where x α j represen ts the v alue of the α -th spatial comp onen t with α = 1 , 2 , 3 corresp onding to x, y , z , and at the j -th time step within the m -th segmen t (1 ≤ j ≤ N ). Sp ecifically , the j -th column corresponds to 3 the data v ector x ( m − 1 ) N + j . The corresponding co v ariance matrix R m ∈ R 3 N × 3 N for the m -th segment, X m , is assembled b y arranging these blocks: R m = R xx R xy R xz R y x R y y R y z R z x R z y R z z . (9) F or eac h blo c k R αβ , we imp ose a T o eplitz structure. Although time-series data in practical applications is not necessarily stationary , it has b een widely demonstrated in signal pro cessing that enforcing a T oe plitz structure enhances the accuracy and robustness of co v ariance matrix estimation [4, 15, 42]. Motiv ated b y these findings, w e construct the N × N blo ck matrix R αβ in T o eplitz form as follows [5, 10]: R αβ = r αβ 0 ⋯ r αβ k ⋯ r αβ N − 1 ⋮ ⋱ ⋱ ⋱ ⋮ r β α k ⋱ r αβ 0 ⋱ r αβ k ⋮ ⋱ ⋱ ⋱ ⋮ r β α N − 1 ⋯ r β α k ⋯ r αβ 0 . (10) This definition implies that R αβ = R ⊺ β α , ensuring that R m defined in (9) is symmetric. The correlation function r αβ k b et w een spatial comp onen ts α and β ( α, β = 1 , 2 , 3) at lag k (0 ≤ k ≤ N − 1) is giv en by r αβ k = E x α l x β l + k , for an y 0 ≤ l ≤ N − k − 1 , (11) whic h can be estimated b y the observ ation data as r αβ k = 1 N N − k − 1 ∑ l = 0 x α l x β l + k , 0 ≤ k ≤ N − 1 . (12) Note that r αβ 0 = r β α 0 for all α, β . This then yields an estimate for each R αβ in (10) and, hence, R m in (9). Under standard conditions (e.g., non-degenerate sto c hastic excitation and sufficien tly rich data), it is p ositive definite and therefore full rank with probability one. The set of symmetric p ositiv e definite (SPD) matrices forms a Riemannian manifold, known as the SPD manifold (e.g., [7, 8]). In this study , for simplicity , w e adopt the Euclidean distance as the statistical distance b et ween t wo SPD co v ariance matrices R i , R j : d ( R i , R j ) = R i − R j F , (13) where R F = trace ( RR ⊺ ) is the F robenius norm. Accordingly , the Euclidean mean of the set of SPD matrices { R 1 , R 2 , . . . , R K } is defined as their arithmetic mean R 1 + R 2 + ⋯ + R K K . (14) T o analyze the MD data, w e c haracterize the state of the system b y computing statistical distances b et w een these matrices. The o verall procedure of the prop osed metho d is illustrated in Fig. 1. First, the raw time-series data are normalized to ensure numerical consistency . The entire dataset is then partitioned in to K segments of length N , and for each segmen t, a 3 N × 3 N blo c k co v ariance matrix is constructed. These matrices consist of nine N × N blo c ks that capture the temp oral cov ariances b et w een spatial comp onen ts, as defined in (10). T o obtain a robust statistical represen tation, the ensem ble (Euclidean) mean of these co v ariance matrices is computed ov er all K segmen ts as shown in Fig. 2. Subsequently , the dissimilarities b et ween differen t datasets are quan tified by calculating the Euclidean distances b et ween their resp ective mean matrices. Dimensionality reduction is then p erformed using PCA, pro jecting the data on to a tw o-dimensional space while preserving the result- ing distance matrix. The embeddings of the systems are thereby obtained. The low er-dimensional geometry of these embeddings captures the in trinsic v ariables driving the v ariations betw een systems. Finally , the physical significance of the em b edding space is inv estigated by correlating the principal comp onen ts with the physical prop erties of the system. 4 MD data PCA Figure 1: Sc hematic illustration of the prop osed metho d. 𝒙 ! ⋯ 𝒙 " ⋯ 𝒙 #$! " ⋯ 𝒙 #" ⋯ From 𝐾𝑁 data to 𝐾 number of 3𝑁 $× 3𝑁 matri ces mean Figure 2: Computation for the cov ariance m atrices. 3 Numerical results In this section, we apply the prop osed metho d to tw o systems: an LJ particle system and separate bulk systems of ice and liquid w ater, respectively . 3.1 Lennard-Jones systems The LJ p oten tial is one of the most widely used mo dels for describing interactions in monatomic fluids. In this study , w e v alidate the prop osed metho d b y analyzing time-series data obtained from MD sim ulations of a particle system gov erned by the LJ p oten tial. Sp ecifically , w e consider the LJ 12 − 6 p oten tial characterized b y the length scale σ and the energy scale ε , U ( r ) = 4 ε σ r 12 − σ r 6 . (15) All quan tities are expressed in reduced LJ units with σ = 1, ε = 1, and particle mass m = 1. The system consists of N = 4 , 000 particles, and the initial configuration is generated using a face-cen tered cubic (F CC) lattice. An equilibrated configuration is obtained by performing a preliminary simulation at temp erature T = 1 . 0 using a Langevin thermostat, during which the simulation b o x is allow ed to relax. After equilibration, the b o x length con verges to 17 . 1, corresp onding to a n umber density of ρ ≃ 0 . 8. This equilibrated configuration is used in the subsequen t pro duction runs. The time ev olution of the particles is computed using the velocity V erlet algorithm, with p eriodic b oundary conditions imposed in all three spatial directions. Sim ulations are p erformed at five nondi- mensional temp eratures, T = 0 . 80 , 0 . 85 , 0 . 90 , 0 . 95, and 1 . 00. F or each temp erature, velocity time series are collected in the micro canonical (NVE) ensemble and used as input data for the statistical distance analysis prop osed in this study . The time step is set to ∆ t = 0 . 005, and tra jectory data ov er 100 , 000 time steps are used for the analysis. In this exp erimen t, w e fo cus on analyzing the velocity data of particles obtained from the MD sim ulations b ecause of the stationarity of the velocity time series under the theoretical framework considered. The distance matrix ev aluated with N = 8 and K = 12 , 500 is shown in Fig. 3. It can b e observ ed that the distances increase as the differences b et w een the states b ecome larger. While this matrix represents the results for a single specific pair of tw o different molecules, a more statistically robust analysis was conducted b y randomly selecting 4 , 000 pairs for each temp erature, including T = 0 . 80 itself, with comparisons made relative to T = 0 . 80. The resulting histograms 5 Figure 3: Distance matrix b et ween co v ariance matrices at different temperatures. are sho wn in Fig. 4 and exhibit distinct distributions, indicating that temp erature v ariations can b e detected through these statistical distances. By em b edding the distance matrix in to a t w o-dimensional space by PCA, the result presented in Fig. 5 sho ws that the data p oin ts are ordered according to temp erature along the first principal comp onen t (PC1) axis. This demonstrates that the prop osed metho d successfully captures the key molecular b eha vior underlying the temp erature differences. Figure 4: The histograms of the distances b et ween T = 0 . 80 and the other temp eratures. Eac h color corresp onds to a sp ecific temp erature: T = 0 . 80 (blue), 0 . 85 (orange), 0 . 90 (green), 0 . 95 (red), and 1 . 00 (purple). T o further quan tify this relationship, we examine the correlation b et w een PC1 and the diffusion co efficien t calculated from the velocity data. As shown in Fig. 6, a clear linear relationship is observed b et w een PC1 and the diffusion co efficient. These results indicate that the diffusion coefficient of LJ particle systems across differen t temp eratures can b e effectively estimated from lo cal statistical information derived from only eigh t consecutive time steps. 3.2 Separate bulk systems of ice and liquid w ater In the second application, we analyze dip ole moment vectors obtained from MD simulations of tw o separate systems: bulk ice and bulk liquid water. The intermolecular in teractions b etw een w ater 6 Figure 5: The tw o-dimensional PCA pro jection of the distance matrix. Figure 6: The relationship b et ween the first principal comp onen t and the diffusion co efficien t. 7 molecules are describ ed using the TIP4P/Ice water model [1], a rigid and non-p olarizable w ater mo del that is known to repro duce the melting p oin t and phase b ehavior of ice. Eac h system consists of N = 1 , 024 w ater molecules placed in a cubic sim ulation b ox with p erio dic b oundary conditions imposed in all three spatial directions. All sim ulations were performed using GROMA CS 2024.6 1 . The initial configuration of the ice system w as generated using GenIce [29], whic h pro duces a proton-disordered ice Ih structure, as shown in Fig. 7(a). In contrast, the liquid w ater system is prepared b y randomly placing w ater molecules in the simulation b ox, as sho wn in Fig. 7(b). The systems w ere first equilibrated in the NPT ensem ble for 10 ns at T = 269 . 0 K and P = 0 . 1 MP a using the Nos´ e–Ho o v er thermostat and the C-rescale barostat. Pro duction sim ulations were then p erformed in the NVT ensem ble for 5 ns. The equations of motion w ere integrated using the velocity V erlet algorithm with a time step of ∆ t = 1 fs. Dip ole momen t vectors w ere recorded every 10 fs for subsequen t analysis. (a) Bulk ice (b) Bulk liquid water Figure 7: Initial configurations of the MD simulation systems. Eac h system consists of 1 , 024 TIP4P/Ice w ater molecules. Similarly , to ensure a statistically robust comparison, w e analyze histograms of the distances b et w een co v ariance matrices. Sp ecifically , these histograms are generated b y calculating the distances of 4 , 000 randomly selected pairs for all combinations of states. The histograms of the distances b et ween co v ariance matrices for the ice and liquid water systems, ev aluated with N = 8 and K = 12 , 500, are sho wn in Fig. 8. These results indicate that the tw o states can b e distinguished by the distances b et w een cov ariance matrices based on the distinct shap es and positions of these distance distributions when viewed from the persp ectiv e of the liquid water molecules. In con trast, the t w o states are nearly indistinguishable when viewed from the persp ective of the ice molecules. This lac k of distinction may b e attributed to the c haracteristic timescales of dip ole moment oscillations. In the ice phase, these oscillations o ccur at higher frequencies. Consequently , some pairs of ice molecules exhibit similar correlation patterns while others do not, resulting in a broader distribution of distances even within the same phase. How ev er, liquid water molecules exhibit low er-frequency oscillations that pro duce more uniform and consistent correlation patterns. As a result, the histograms are concentrated at smaller distance v alues, effectively blurring the b oundary b et w een the t wo states when ice is used as the reference. 4 Conclusion In this study , we in tro duced a statistical framew ork for analyzing MD tra jectories by quantifying the dissimilarity b et ween system states using cov ariance matrices estimated from observ ation data. Numerical v alidation with an LJ particle system demonstrated that the proposed metho d effectiv ely extracts essen tial dynamical features, revealing a strong linear correlation b etw een the latent repre- 1 https://www.gromacs.org 8 Figure 8: The three histograms sho w the distances b et w een the ice system and the liquid w ater system: distances b et ween ice molecules (blue), distances b et ween liquid w ater molecules (orange), and distances b et ween the t wo systems (green). sen tation obtained from the statistical distances and the macroscopic diffusion co efficien t. This result suggests that global transp ort prop erties are intrinsically enco ded in lo cal, short-term velocity fluctu- ations, enabling efficient estimation of macroscopic prop erties without requiring long-time tra jectory in tegration. The analysis of separate bulk systems of ice and liquid w ater further demonstrated the capabilit y of the prop osed framew ork to distinguish betw een differen t phases of matter. The results highlight the sensitivit y of the co v ariance-based statistical distance to structural and dynamical differences at the molecular level. Building on these findings, future studies will inv estigate phase transition phenomena in single-comp onent molecular systems, suc h as the melting and freezing pro cesses of w ater, as well as other materials exhibiting p olymorphism. Such inv estigations ma y pro vide deep er insights into the microscopic mechanisms gov erning phase transitions and supp ort the developmen t of predictive mo dels for complex molecular systems. In the presen t work, the Euclidean distance was employ ed as the statistical metric b et ween cov ari- ance matrices because of its simplicit y and computational efficiency . Ho wev er, the prop osed framework can naturally b e extended b y adopting metrics that resp ect the Riemannian manifold structure of SPD matrices. Examples include the Log-Euclidean metric, the affine in v arian t Riemannian metric, and the Bures–W asserstein metric; see, e.g., [6 – 8, 32]. Incorp orating such geometrically consistent distances ma y allo w the framew ork to capture both linear and nonlinear correlations in the underlying dynamics, pro viding a ric her representation of molecular b eha vior. F uture research could further extend the metho dology by incorp orating higher-order statistical descriptors, such as the skewness and kurtosis of particle v elo cities or p ositions, to capture subtle nonlinear dynamical effects. In addition, although the present study fo cused on MD sim ulation data, the prop osed framew ork is expected to b e applicable to experimental datasets, including time-resolved sp ectroscopic measurements and single-molecule trac king data. Extending the approach to experimen- tal systems w ould represent an imp ortant step to ward bridging molecular sim ulations and real-world observ ations, p oten tially enabling new data-driven approaches for c haracterizing complex molecular dynamics. Ac kno wledgmen ts YO w as partially supported b y JST SPRING (No. Y01GQ25189) and Keio Universit y (Do ctorate Studen t Grant-in-Aid Program from Ushio da Memorial F und (No. Y01JI25123)). TS was partially supp orted JSPS KAKENHI (No. JP25K23429). LP w as partially supported by JSPS KAKENHI (No. JP24K06852), JST CREST (No. JPMJCR24Q5), and Keio Universit y (F ukuzaw a F und and 9 Academic Developmen t F und). References [1] J. L. F. Abascal, E. Sanz, R. Garc ´ ıa F ern´ andez, and C. V ega. A potential mo del for the study of ices and amorphous water: TIP4P/Ice. The Journal of Chemic al Physics , 122(23):234511, 2005. [2] M. P . Allen and D. J. Tildesley . Computer Simulation of Liquids . Oxford Universit y Press, Oxford, 2nd edition, 2017. [3] A. Amadei, A. B. Linssen, and H. J. Berendsen. Essen tial dynamics of proteins. Pr oteins: Structur e, F unction, and Genetics , 17(4):412–425, 1993. [4] M. Arnaudon, F. Barbaresco, and L. Y ang. Medians and means in Riemannian geometry: Ex- istence, uniqueness and computation. In R. Bhatia and F. Nielsen, editors, Matrix Information Ge ometry , pages 169–198, 2012. [5] M. Arnaudon, F. Barbaresco, and L. Y ang. Riemannian medians and means with applications to radar signal pro cessing. IEEE Journal of Sele cte d T opics in Signal Pr o c essing , 7(4):595–604, 2013. [6] V. Arsign y , P . Fillard, X. Pennec, and N. Ayac he. Geometric means in a nov el vector space struc- ture on symmetric positive-definite matrices. SIAM Journal on Matrix A nalysis and Applic ations , 29(1):328–347, 2007. [7] R. Bhatia. Positive Definite Matric es . Princeton Universit y Press, Princeton, Oxford, 2007. [8] R. Bhatia, T. Jain, and Y. Lim. On the Bures–W asserstein distance b et w een p ositiv e definite matrices. Exp ositiones Mathematic ae , 37(2):165–191, 2019. [9] L. V. Bo c k, S. Gabrielli, M. H. Kol´ a ˇ r, and H. Grubm ¨ uller. Sim ulation of complex biomolecular systems: The rib osome c hallenge. Annual R eview of Biophysics , 52:361–390, 2023. [10] Y. Cabanes, F. Barbaresco, M. Arnaudon, and J. Bigot. T o eplitz Hermitian p ositiv e definite matrix machine learning based on Fisher metric. In Ge ometric Scienc e of Information: 4th International Confer enc e , pages 261–270, T oulouse, F rance, 2019. Springer. [11] W. Chen and A. L. F erguson. Molecular enhanced sampling with auto encoders: On-the-fly collectiv e v ariable discov ery and accelerated free energy landscap e exploration. Journal of Com- putational Chemistry , 39(25):2079–2102, 2018. [12] J. P . Cunningham and Z. Ghahramani. Linear dimensionalit y reduction: Surv ey , insights, and generalizations. Journal of Machine L e arning R ese ar ch , 16(89):2859–2900, 2015. [13] C. C. Da vid and D. J. Jacobs. Principal comp onen t analysis: A method for determining the essen tial dynamics of proteins. Metho ds in Mole cular Biolo gy , 1084:193–226, 2014. [14] R. O. Dror, R. M. Dirks, J. P . Grossman, H. Xu, and D. E. Shaw. Biomolecular sim ulation: A computational microscop e for molecular biology . A nnual R eview of Biophysics , 41:429–452, 2012. [15] X. Du, A. Aubry , A. De Maio, and G. Cui. T o eplitz structured co v ariance matrix estimation for radar applications. IEEE Signal Pr o c essing L etters , 27:595–599, 2020. [16] K. Endo, K. T omob e, and K. Y asuok a. Multi-step time series generator for molecular dynamics. Pr o c e e dings of the AAAI Confer enc e on A rtificial Intel ligenc e , 32(1):2192–2199, 2018. [17] K. Endo, D. Y uhara, K. T omob e, and K. Y asuok a. Detection of molecular b eha vior that charac- terizes systems using a deep learning approac h. Nanosc ale , 11:10064–10071, 2019. 10 [18] I. J. Go odfellow, J. P ouget-Abadie, M. Mirza, B. Xu, D. W arde-F arley , S. Ozair, A. Courville, and Y. Bengio. Generative adv ersarial nets. In Pr o c e e dings of the 28th International Confer enc e on Neur al Information Pr o c essing Systems , volume 2, pages 2672–2680, Cambridge, MA, 2014. MIT Press. [19] N. R. Go o dman. Statistical analysis based on a certain m ultiv ariate complex Gaussian distribu- tion. The A nnals of Mathematic al Statistics , 34(1):152–177, 1963. [20] J.-P . Hansen and I. R. McDonald. The ory of Simple Liquids: With Applic ations to Soft Matter . Academic Press, Oxford, 4th edition, 2013. [21] H. Hradisk´ a, M. Kureˇ ck a, J. Ber´ anek, G. T edeschi, V. Vi ˇ s ˇ no vsk´ y, A. K ˇ renek, and V. Spiwok. Ac- celeration of molecular simulations by parametric time-lagged tSNE metadynamics. The Journal of Physic al Chemistry B , 128(4):903–913, 2024. [22] M. Karplus and J. A. McCammon. Molecular dynamics simulations of biomolecules. Natur e Structur al Biolo gy , 9(9):646–652, 2002. [23] D. P . Kingma and M. W elling. Auto-Enco ding V ariational Ba y es. In 2nd International Confer enc e on L e arning R epr esentations , 2014. [24] A. Kitao. Principal comp onent analysis and related metho ds for inv estigating the dynamics of biological macromolecules. J – Multidisciplinary Scientific Journal , 5(2):298–317, 2022. [25] A. Kitao, S. Ha yw ard, and N. Go. Energy landscap e of a nativ e protein: jumping-among-minima mo del. Pr oteins: Structur e, F unction, and Genetics , 33(4):496–517, 1998. [26] R. Kub o. The fluctuation-dissipation theorem. R ep orts on Pr o gr ess in Physics , 29(1):255–284, 1966. [27] O. F. Lange and H. Grubm ¨ uller. Generalized correlation for biomolecular dynamics. Pr oteins: Structur e, F unction, and Bioinformatics , 62(4):1053–1061, 2006. [28] G. G. Maisuradze, A. Liwo, and H. A. Scheraga. Principal comp onen t analysis for protein folding dynamics. Journal of Mole cular Biolo gy , 385(1):312–329, 2009. [29] M. Matsumoto, T. Y agasaki, and H. T anak a. GenIce: Hydrogen-Disordered Ice Generator. Jour- nal of Computational Chemistry , 39(1):61–64, 2018. [30] L. McInnes, J. Healy , and J. Melville. UMAP: Uniform manifold approximation and pro jection for dimension reduction. arXiv pr eprint arXiv:1802.03426 , 2018. [31] D. A. McQuarrie. Statistic al Me chanics . Universit y Science Bo oks, Sausalito, California, 2000. [32] Y. Ono and L. P eng. The Comparison of Riemannian Geometric Matrix-CF AR Signal Detectors. IEEE T r ansactions on A er osp ac e and Ele ctr onic Systems , 60(2):1679–1691, 2024. [33] K. P earson. Contributions to the mathematical theory of ev olution. Journal of the R oyal Statis- tic al So ciety , 56(4):675–679, 1893. [34] I. S. Reed, J. D. Mallett, and L. E. Brennan. Rapid conv ergence rate in adaptive arrays. IEEE T r ansactions on A er osp ac e and Ele ctr onic Systems , AES-10(6):853–863, 1974. [35] S. T. Ro weis and L. K. Saul. Nonlinear dimensionalit y reduction by lo cally linear embedding. Scienc e , 290(5500):2323–2326, 2000. [36] J. ˇ Sp oner, G. Bussi, M. Krepl, P . Ban´ a ˇ s, S. Bottaro, R. A. Cunha, A. Gil-Ley , G. Pinamonti, S. P oblete, P . Jureˇ ck a, N. G. W alter, and M. Ot y epk a. RNA structural dynamics as captured b y molecular simulations: A comprehensive o v erview. Chemic al R eviews , 118(8):4177–4338, 2018. 11 [37] M. Sugiy ama. Nonlinear dimensionality reduction. In Intr o duction to Statistic al Machine L e arn- ing , pages 429–446. Morgan Kaufmann, 2016. [38] F. T rozzi, X. W ang, and P . T ao. UMAP as a dimensionalit y reduction to ol for molecular dynamics sim ulations of biomacromolecules: A comparison study . The Journal of Physic al Chemistry B , 125(19):5022–5034, 2021. [39] L. v an der Maaten and G. Hin ton. Visualizing data using t-SNE. Journal of Machine L e arning R ese ar ch , 9:2579–2605, 2008. [40] T. Y amashita and N. Sho ji. Singular sp ectrum transformation for detecting molecular motion mo de c hange of protein systems. AIP Confer enc e Pr o c e e dings , 2343(1):020010, 2021. [41] I. Y asuda, K. Endo, E. Y amamoto, and K. Y asuok a. Differences in ligand-induced protein dynam- ics extracted from an unsup ervised deep learning approach correlate with protein–ligand binding affinities. Communic ations Biolo gy , 5(1):481, 2022. [42] M. A. Zatman. ABF limitations when using either T o eplitz cov ariance matrix estimators or the parametric v ector AR tec hnique. In Confer enc e R e c or d of 35th Asilomar Confer enc e on Signals, Systems and Computers , v olume 2, pages 1111–1115, 2001. 12
Original Paper
Loading high-quality paper...
Comments & Academic Discussion
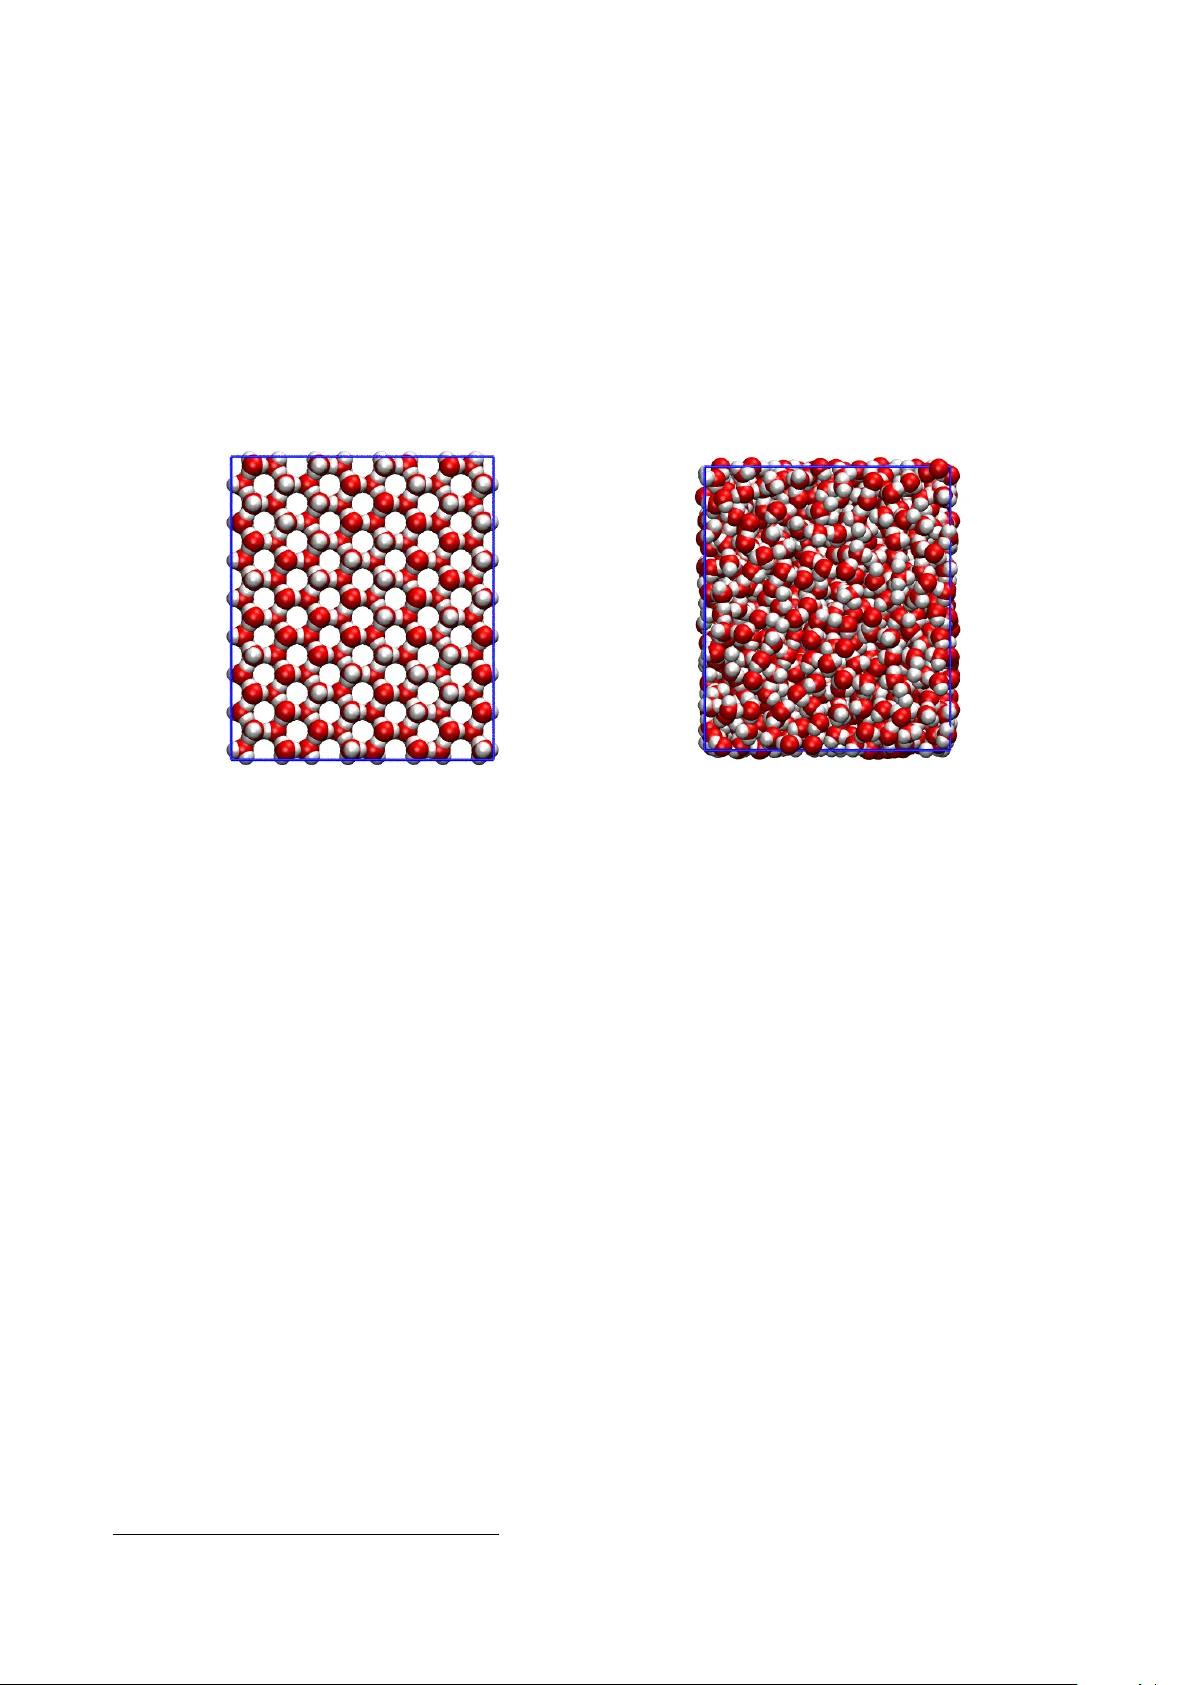
Loading comments...
Leave a Comment