Curated Wireless Datasets for Aerial Network Research
This Review consolidates publicly available aerial wireless measurement datasets collected using AERPAW. We organize signal-level, power-level, and KPI-level datasets under a unified taxonomy, harmonize metadata, and provide verified access with repr…
Authors: Amir Hossein Fahim Raouf, Donggu Lee, Mushfiqur Rahman
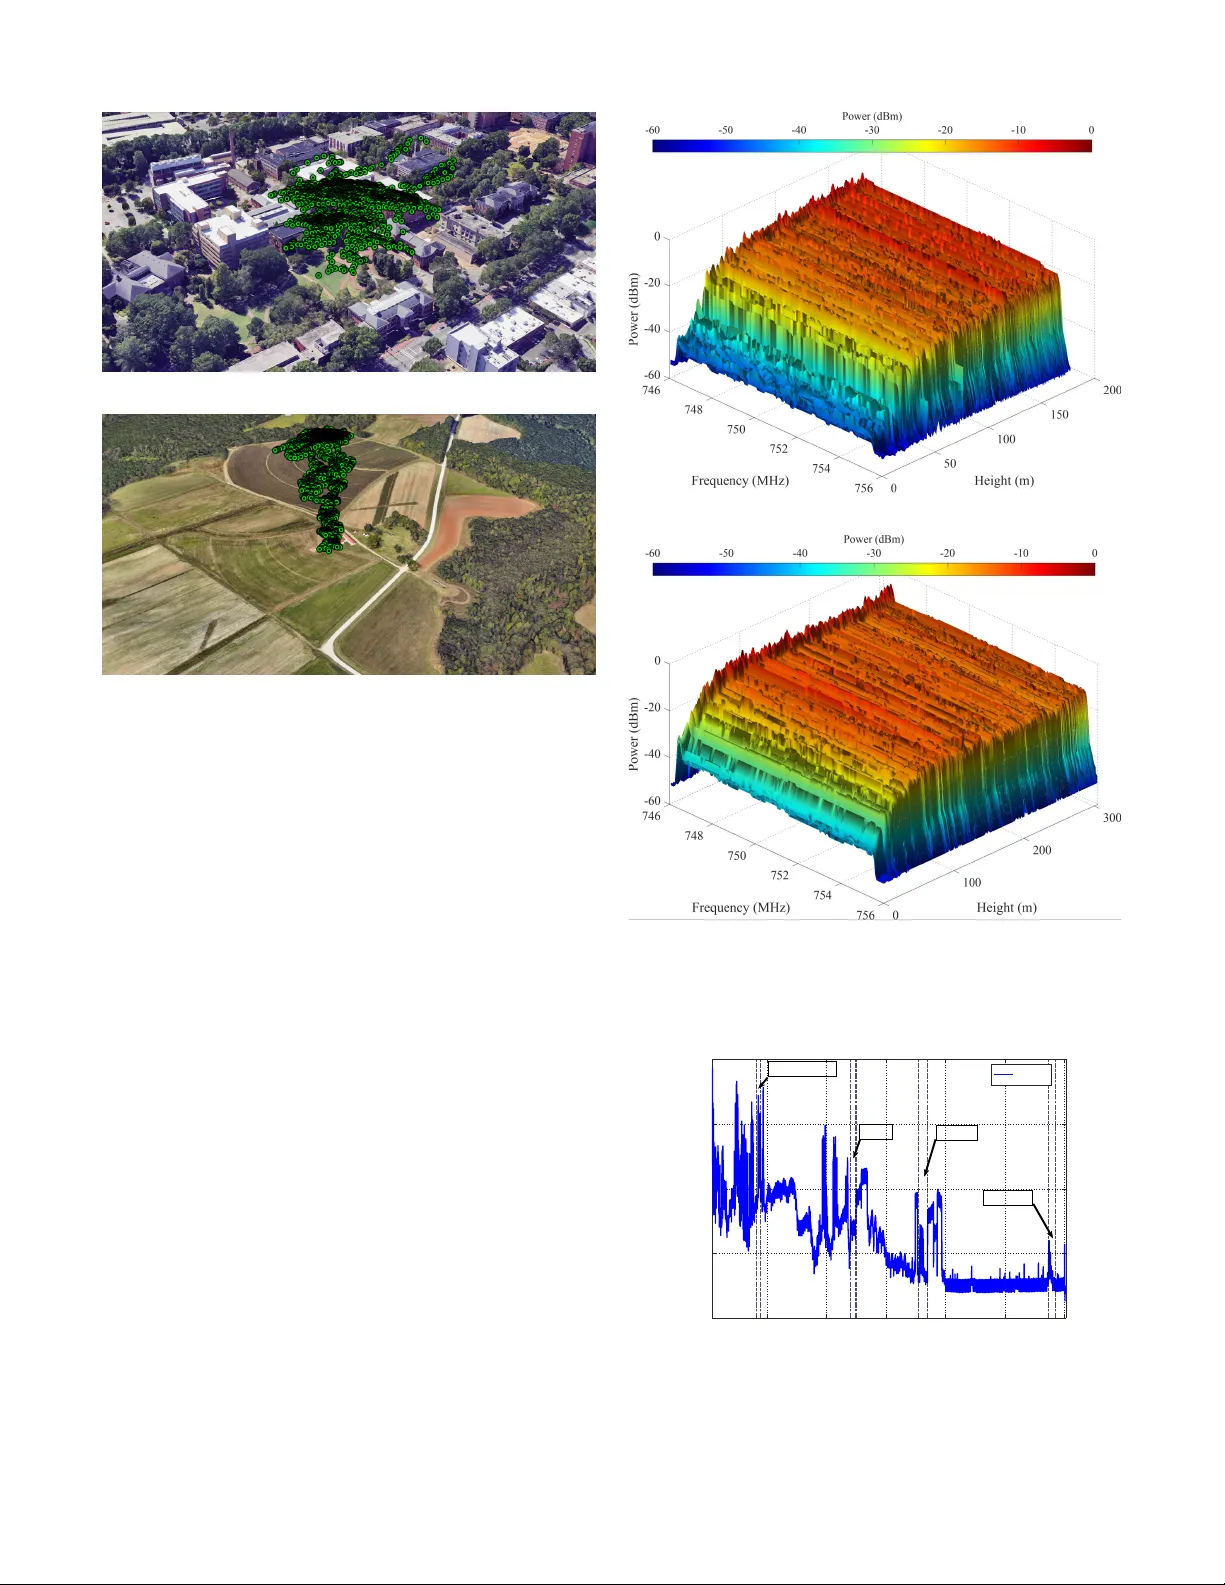
1 Curated Wireless Datasets for A erial Net w ork Researc h Amir Hossein F ahim Raouf, Donggu Lee, Mushqur Rahman, Saad Masrur, Gautham Reddy , Cole Dic kerson, Md Sharif Hossen, Sergio V argas Villar, Anıl Gürses, Simran Singh, Sung Jo on Maeng, Martins Ezuma, Christopher Rob erts, Mohamed Rab eek Sarbudeen, Thomas J. Za jk owski, Magreth Mushi, Ozgur Ozdemir, Ram Asokan, Ismail Guvenc, Mihail L. Sic hitiu, and R udra Dutta Abstract—This Review consolidates publicly av ailable aerial wireless measuremen t datasets collected using AERP A W. W e organize signal-level, pow er-level, and KPI-lev el datasets under a unied taxonomy , harmonize metadata, and pro vide veried access with repro ducible p ost-processing scripts. The curated catalog supp orts propagation modeling, machine learning, lo- calization, and system-lev el ev aluation for 5G-Adv anced and emerging 6G aerial netw orks. I. In tro duction As the global demand for seamless and high-capacit y wireless connectivit y con tinues to gro w, aerial plat- forms, particularly unmanned aerial vehicles (UA V s) hav e emerged as a promising complemen t to terrestrial infras- tructure in 5G-A dv anced and future 6G net works [ 1 ], [ 2 ]. UA V s oer unique opp ortunities for agile deploymen t, rapid cov erage extension, and spectrum monitoring in disaster-stric ken or hard-to-reach en vironments. Their altitude adv an tage ov er terrestrial transmitters and re- ceiv ers enables line-of-sight (LoS) links, supp orting appli- cations such as aerial base stations (BSs), edge caching, en vironmental monitoring, and emergency response [ 3 ]. A dv ances in sensing, p erception, and decision-making hav e enabled UA V s with autonomous na vigation capabilities to op erate with minimal h uman interv ention in complex and dynamic environmen ts. Recognizing this p otential, regulatory and standardiza- tion b o dies hav e b egun laying the groundwork for the in tegration of aerial users in to cellular net w orks. F or Corresponding author. Corresponding author email: amirh.fraouf@ieee.org This work was supported in part by the National Science F ounda- tion under Grants CNS-2332835 and CNS-1939334; in part by the Idaho National Lab oratory (INL) Lab oratory Directed Researc h and Developmen t (LDRD) Program under BMC No. 264247, Release No. 26 on BEA’s Prime Con tract No. DE-AC07-05ID14517; and in part by the National Science F oundation Graduate Research F ello wship Program under Grant DGE-2137100. Amir Hossein F ahim Raouf, Donggu Lee, Mushqur Rahman, Saad Masrur, Gautham Reddy , Cole Dick erson, Md Sharif Hossen, Sergio V argas Villar, Anıl Gürses, Simran Singh, Christopher Rob erts, Mohamed Rabeek Sarbudeen, Thomas J. Zajko wski, Magreth Mushi, Ozgur Ozdemir, Ismail Guvenc, Mihail L. Sichitiu, and R udra Dutta are with the Department of Electrical and Computer Engineering, North Carolina State Universit y , Raleigh, NC, USA. Sung Joon Maeng is with Hany ang Universit y , Ansan 15588, South Korea. Martins Ezuma is with Amazon Lab126, Sunnyv ale, CA, USA. Ram Asokan is with Wireless Research Center, W ake F orest, NC, USA. instance, the F ederal Communications Commission (FCC) has examined the use of licensed mid-band sp ectrum for UA V command-and-con trol (C2) links and emphasized the role of 5G in enabling unmanned aircraft systems (UAS) in tegration within cellular netw orks [ 4 ], [ 5 ]. In parallel, the 3rd Generation P artnership Pro ject (3GPP) has in- tro duced UA V-specic enhancements in Release 15 and subsequen t releases to address challenges such as interfer- ence mitigation, mobility management, and ight-relev an t k ey p erformance indicators (KPIs) for aerial user equip- men ts (UEs) [ 6 ]. The International T elecomm unication Union (ITU) has similarly recognized the p otential of UA V s in adv ancing global broadband connectivit y and enhancing disaster resp onse capabilities [ 7 ]. In addition to these regulatory and standardization eorts, industry stak eholders, e.g., Ericsson, Samsung, and Qualcomm, ha ve submitted joint contributions to 3GPP Radio Access Net work (RAN) W orking Group 4 (RAN4) aimed at ev aluating in terference scenarios b et ween aerial and ter- restrial users in the shared spectrum bands, highligh ting the critical role of empirical measurements in guiding standards developmen t and system design (e.g., see [ 8 ]). This shift to ward aerial connectivity has underscored the growing need for op en, w ell-do cumen ted, and repro- ducible wireless datasets captured from airb orne plat- forms. Such datasets serve as a critical enabler for v alidating theoretical mo dels, training machine learning algorithms, and guiding system-level simulations, pro- to col design, and deplo yment studies. Recen t airspace- in tegration eorts further reinforce this need. F or example, the F ederal A viation Administration (F AA) electronic conspicuit y white pap er outlines near-term pathw ays that lev erage existing terrestrial cellular infrastructure to sup- p ort UAS functions, such as command-and-control and electronic conspicuity , and highlights m ultiple open re- searc h questions that require op erationally representativ e testing rather than purely sim ulation-based ev aluation [ 9 ]. Consequen tly , curated datasets collected in real en viron- men ts are increasingly necessary to v alidate propagation assumptions, quantify KPI behavior at altitude, and inform deploymen t-relev an t designs. Moreo v er, the av ailability of publicly releasable aerial wireless datasets remains limited due to the practical chal- lenges of conducting controlled airb orne measurements, including wide-area interference considerations, sp ectrum 2 co ordination requirements, and the need for exp erimental authorizations. These constrain ts mak e it dicult to p erform rep eatable, large-scale measurement campaigns and highlight the importance of dedicated exp erimen tal platforms designed to safely and systematically supp ort real-w orld aerial data collection. T o tackle these c hallenges, platforms such as the Aerial Exp erimen tation and Research Platform for Adv anced Wireless (AERP A W) hav e emerged as critical enablers of aerial wireless research. AERP A W integrates a diverse suite of aerial data collection systems, including drones, helikites, and softw are-programmable radios, equipp ed with sync hronized GPS mo dules, wideband radio fre- quency (RF) sensing capabilities, and Signal Metadata F ormat (SigMF)-compliant data logging infrastructure. This multi-modal framework facilitates repro ducible and scalable exp erimentation across a broad range of wireless scenarios. These eorts ha v e pro duced high-resolution datasets that span I/Q signals, receiv ed p ow er, and commercial net work KPIs across a wide altitude range, helping researchers model three-dimensional (3D) prop- agation environmen ts and ev aluate LoS and non-line-of- sigh t (NLoS) transitions at scale [ 10 ]. It is emphasized that this man uscript is intended as a dataset descriptor pap er. The contribution do es not lie in rep orting new exp erimental ndings or previously unob- serv ed channel behaviors. Instead, the nov elty resides in the systematic integration, harmonization, and do cumen- tation of aerial wireless datasets that hav e already b een collected and publicly released. The pap er consolidates these datasets under a unied structure, standardizes their metadata and access mec hanisms, and provides repro ducible p ost-processing scripts to facilitate reuse b y the researc h comm unit y . As suc h, the primary ob jective is to low er the barrier to entry for aerial wireless research b y making diverse datasets more ndable, accessible, in terop erable, and reusable . The remainder of this pap er is organized as follows. The literature review and contributions discuss prior aerial wireless datasets and measurement eorts and identify k ey gaps motiv ating this work. The challenges for gener- ating datasets with aerial wireless systems summarize the tec hnical, logistical, and regulatory challenges of collecting repro ducible aerial wireless data. The integrated dataset catalog and access presen ts a unied dataset taxonomy and a consolidated catalog with veried access informa- tion. The dataset description sections present the curated AERP A W datasets in a standardized manner, highligh ting measuremen t scop e, representativ e trends, and supp orted use cases, with detailed le-level information provided in App endix A . The synthesis, impact, and research outlo ok consolidates cross-dataset insights, demonstrated research impact, and future research directions. Finally , the pap er concludes with concluding remarks. I I. Literature Review and Contributions There ha ve b een only some sp oradic eorts on sys- tematically capturing and disseminating aerial cellular datasets, with many studies constrained b y narro w de- plo yment scenarios, proprietary data formats, or limited repro ducibilit y . F or example, Mozn y et al. conducted an extensiv e p erformance ev aluation of Long-T erm Evolu- tion (L TE) and 5G netw orks for UA V services, high- ligh ting signicant degradation in downlink p erformance at higher altitudes, y et the corresponding data remains una v ailable for public use [ 11 ]. Similarly , Braunfelds et al. presented con trolled drone ight measuremen ts ov er a commercial L TE netw ork, analyzing KPIs such as Reference Signal Received Po w er (RSRP), Reference Sig- nal Receiv ed Qualit y (RSR Q), and Signal-to-In terference- plus-Noise Ratio (SINR) as functions of altitude, but without providing standardized or reusable datasets [ 12 ]. Other exp erimen tal studies hav e explored softw are- dened radio (SDR)-enabled aerial testb eds for deploy- ing L TE BSs on UA V s, demonstrating the feasibilit y of airb orne infrastructure for enhanced connectivity [ 13 ]. Separately , Ruseno et al. analyzed 4G signal quality in the con text of UA V Remote ID systems, leveraging mac hine learning techniques to mo del signal p erformance under v arying conditions [ 14 ]. While these studies contribute v aluable architectural and performance insigh ts, they do not oer altitude-resolved, metadata-rich datasets nec- essary for repro ducible research. F urthermore, Zulkiey et al. ev aluated the feasibilit y of L TE-based connectivity for small UA V s, showing that increasing altitude leads to substantial degradation in signal quality and increased latency due to non-optimized terrestrial deploymen ts [ 15 ]. In a complementary study , Ko v ács et al. p erformed aerial measuremen ts o v er liv e L TE net works and analyzed in- terference patterns, highligh ting the challenges p osed by sidelob e reception and elev ated interference levels in UA V op erations [ 16 ]. In parallel, studies on terrestrial and regional sp ectrum o ccupancy , such as that by Chennamsetty et al., hav e demonstrated the utility of passiv e sp ectrum monitoring across 4G and 5G bands, though such eorts remain dis- connected from the aerial domain [ 17 ]. While most prior ef- forts hav e fo cused on targeted aerial tests or single-purp ose deplo yments, a few ha ve in vestigated broader sp ectrum usage trends under real-world op erational conditions. F or instance, Kuester et al. presented a comprehensive study of radio spectrum o ccupancy during the COVID-19 pan- demic, capturing temp oral and spatial v ariations in 4G and 5G usage across multiple urban and suburban loca- tions using passive monitoring equipment [ 18 ]. Although not UA V-sp ecic, suc h work underscores the v alue of large- scale, repro ducible sp ectrum datasets in understanding wireless dynamics and informs the design of future aerial deplo yments. Ensuring future progress in aerial connectivity research requires sustained support for measurement platforms that emphasize op enness, do cumen tation, and multi- mo dal sensing capabilities. The comm unit y would b enet from initiatives that align with F AIR data principles (Findable, Accessible, Interoperable, and Reusable) [ 19 ], enabling standardized b enc hmarking and accelerating ad- 3 v ancemen ts tow ard 5G-A dv anced and 6G netw ork de- plo yments. In this work, the presented datasets follow these principles b y being ndable through publicly indexed rep ositories with persistent citations, accessible through op en do wnload links and accompan ying documentation, in terop erable via widely used data formats and analysis to ols such as MA TLAB and Python, and reusable through detailed metadata, exp erimen t descriptions, and provided pro cessing and sim ulation scripts. In contrast to prior surveys that fo cus primarily on analytical mo dels or isolated exp erimen tal campaigns, this w ork complemen ts the state of the art by emphasizing empirical data resources themselves. By situating existing datasets within a unied taxonomy and access framework, the manuscript provides a data-centric p ersp ective on the ev olution of aerial wireless research, highligh ting trends to ward cross-lay er measurement, heterogeneous platforms, and repro ducible exp erimen tation. A. Summary of Contributions The main con tributions of this dataset descriptor are summarized as follows: • Integrated dataset taxonom y: A unied categoriza- tion of otherwise fragmented aerial wireless datasets in to signal-level, p o w er-level, and key p erformance indicator-lev el data records, enabling consistent in- terpretation and cross-dataset comparison across het- erogeneous measurement campaigns. • Metadata harmonization: Standardized and consis- ten t do cumen tation of measuremen t parameters, in- cluding platform altitude, geographic context, carrier frequency , bandwidth, sampling conguration, and calibration status, addressing common in terop erabil- it y and reproducibility limitations in existing public datasets. • Accessible and repro ducible data access: Consoli- dation of publicly a v ailable datasets in to a single reference with veried access links or p ersisten t rep os- itories, accompanied by op en-source p ost-pro cessing and visualization scripts to supp ort repro ducible and transparen t reuse. • V alidation and usage guidance: Represen tative data visualizations and analysis examples provided as in tegrit y chec ks and practical guidance, clarifying in tended use cases and reuse potential for propagation mo deling, system ev aluation, localization, and data- driv en researc h. • F AIR-orien ted dataset design: Alignment with the principles of ndabilit y , accessibility , interoperability , and reusability to facilitate long-term b enchmarking and comparative research within the aerial wireless comm unit y . I II. Challenges for Generating Datasets With A erial Wireless Systems There are substantial diculties in collecting high- qualit y datasets for aerial wireless systems. In what follo ws, we will detail a few c hallenges that were en- coun tered and ov ercome by the AERP A W team. Some of the challenges are common across all the platforms for adv anced wireless researc h (P A WR), while some are unique to AERP A W. A. Programmable Radios Man y of the existing datasets a v ailable for aerial wireless systems used commercial o-the-shelf (COTS) equipment to collect wireless data; for example, wireless phones, or ev en a small 4G/5G mo dem connected to a single-b oard computer (SBC) like a Raspb erry Pi can b e used to collect some KPIs lik e RSRP , RSRQ, and cell ID. How ever, while ligh t and p ortable, suc h a setup can only collect those KPIs for those particular netw orking tec hnologies. The situation is similar for Wi-Fi, LoRa, or other COTS equipmen t. In contrast, in AERP A W we decided to build our radio system around some of the best SDRs a v ailable, namely the univ ersal soft w are radio p eripherals (USRPs) from National Instruments (NI). The main adv antage of a USRP setup is that they can imp ersonate any of the tec hnologies that a COTS radio can; furthermore, the USRPs can transmit and receive custom w av eforms for whic h there is no equiv alent COTS radio, thus allo wing an unpreceden ted degree of exibility and programmability , and hence a broad range of wireless exp eriments. The main challenge of using URSPs is the relatively large size of the resulting p ortable no de: although the USRPs themselv es can be relatively small and light (esp ecially true for the B200 series of USRPs), the sup- p orting hardware is large and heavy . In order to driv e the USRPs a relatively pow erful computer needs to b e emplo yed (a seven th-generation Intel NUC in our case), lters and pow er ampliers on the front ends, and even a custom-made GPS-DO for tight frequency and time sync hronization. This increases the size of a p ortable no de b y almost an order of magnitude (from a few hundred grams for a COTS p ortable node to 3.5 kg for a B210 no de whic h requires separate front ends for eac h of its c hannels). B. Outdo or Radio Infrastructure and Sp ectrum Supp orting outdo or exp eriments with drones and wire- less tec hnologies requires access to tow ers equipp ed with div erse radio systems and to exp erimental spectrum bands for testing new wa veforms and proto cols. While some studies and datasets rely on commercial cellular net works, suc h approac hes limit the scop e and exibility of exp erimen ts. The AERP A W platform addresses these c hallenges through the deploymen t of ve tow ers, tw o ro oftop sites, and one purp ose-built light p ole to host USRPs and other COTS wireless devices. All xed no des are b er-connected and dedicated exclusiv ely to AERP A W exp erimen tation. F urthermore, AERP A W is designated as one of the four F CC Inno v ation Zones in the United States, pro viding access to sp ecic frequency bands for wireless 4 exp erimen tation with drones [ 20 ]. Because airb orne trans- missions from drones can create signicant interference on the ground and with incumbent spectrum users, obtain- ing exp erimen tal frequencies is particularly c hallenging. AERP A W has secured access to the 900 MHz Industrial, Scien tic, and Medical (ISM) band, 1.7/2.1 GHz, and 3.3- 3.45 GHz bands to supp ort exp eriments inv olving USRPs, commercial 4G/5G equipmen t, and UA V s, and con tinues to expand its av ailable exp erimental sp ectrum. C. Programmable Drones The immediate consequence of having large p ortable no de based on USRPs is that the drones required to y the portable no des ha ve to b e m uch larger than a drone designed to carry p ortable nodes based on COTSs UEs. In turn, the larger drones are more expensive, and more dicult to design and implement than smaller drones. In AERP A W, we designed and implemented our large drones from rst principles. AERP A W could ha ve used COTS drones (or at least COTS frames) for their drones, but instead chose to design and implement them from readily a v ailable materials like carb on b er plates and carb on b er tub es. The main adv antage of this approac h is the repro ducibilit y of the AERP A W frames: all the COTS frames w e initially considered (including the DJI Matrix 600) are currently discontin ued. Another imp ortant choice for the AERP A W drones is the op en-source soft ware stack emplo y ed: in the interest of a fully programmable drone, the AERP A W vehicle con trol soft w are is fully open: the autopilot rm ware is ArduPilot [ 21 ], and the softw are is based on the MA VLink op en proto col [ 22 ]. The ground control station (GCS) used b oth in developmen t and operations is QGround- Con trol [ 23 ]. This allo ws for relying on a large base of existing soft ware while developing softw are that can be reused by other researchers. The soft w are employ ed by the AERP A W drones allows exp erimenters both high-level (e.g., preplanned trajectorie s) as w ell as low-lev el (e.g., o- b oard control) of the AERP A W drones, allowing for highly customized exp erimen ts. D. Dev elopment in Digital T wins A unique requirement for AERP A W, among all other P A WR platforms, is its digital twin (DT). In particular, the use of autonomous vehicles in AERP A W and the safet y requiremen ts for these vehicles mak e the developmen t of v ehicle softw are in the testb ed itself a ma jor c hallenge. Instead, for all canonical exp eriments, all exp erimen ters ha ve to dev elop their experiments in a custom-made DT of the physical testb ed. The AERP A W DT is deploy ed in the AERP A W data-compute store, which can host several h undred instances of the DT (the exact num b er dep ends on the complexity of the experiment instantiated). In the DT, all the softw are of the real testb ed is preserved while simulating three main hardware comp onents of the real testb ed: the frames of the drones, the USRPs, and the propagation b etw een the USRPs. The virtual USRPs op erate at I/Q sample level, thus allowing for the dev elopment of realistic channel models, including antenna patterns, Multiple-Input Multiple-Output (MIMO) radios, reections, and Doppler shifts. The drone emulation in- cludes a virtual mac hine running the same rm ware as the drones on the autopilots of the drones in the testb ed, resulting in identical resp onses to commands of both the drones in the testb ed and in the DT. The use of AERP A W DT allows exp erimenters to dev elop all their radio and drone softw are fully remotely , at their own pace, without needing to access any radio or drone hardw are. Once the exp erimen ters develop and test their softw are in the AERP A W DT, they can b e deploy ed quic kly in the real-world testb ed en vironment. AERP A W supp orts a large v ariety of sample exp eriments that are tested in the DT [ 24 ] and can b e accessed by experimenters to quickly initiate baseline exp eriments. E. Precise Lo calization and Roll/Y aw/Pitc h Information Finally , AERP A W developed an infrastructure that ac hieves high levels of precision for capturing high-quality datasets. F or example, to ac hieve centimeter-lev el accu- racy , we hav e deploy ed a Real‑Time Kinematic (R TK) BS at one of the xed no des, and we p erformed the precise p oin t p ositioning (PPP) pro cedure, resulting in an accuracy of a few millimeters for this BS. R TK up dates are then fed online for each of out vehicles (drones, rov ers, and the helikite), ensuring that all collected geographical information is captured with sub-centimeter accuracy . A dditionally , eac h xed no de and several p ortable no des are equipp ed with GPS receivers pro viding b oth time and frequency corrections to b oth the USRPs as w ell as the xed and p ortable no des, allo wing for tight time sync hronization, which in turn results in testb ed-wide sync hronized logs. The logs are b eing generated from m ultiple sources at each no de: the v ehicles generate vehicle information (e.g., latitude, longitude, altitude, roll, pitch, y aw, velocities, etc.), the low-lev el radio softw are (e.g., srsRAN) generates radio KPIs (e.g., RSRP , RSRQ, I/Q samples), and trac softw are generates trac KPIs (e.g., throughput, delay , error rates). All these logs are time- stamp ed with a testb ed-wide synchronized time-stamp, allo wing for coherent p ost-pro cessing. IV. In tegrated Dataset Catalog and A ccess This work consolidates multiple aerial wireless datasets that were collected across dierent campaigns, platforms, and exp erimental ob jectiv es, as summarized in T able I . T o facilitate integration and reuse, all datasets are organized under a unied taxonomy based on the lev el of abstraction at which the measurements are recorded. A t the low est lev el, signal-level datasets provide raw in-phase and quadrature samples suitable for detailed ph ysical-lay er analysis and custom receiver pro cessing. P ow er-level datasets capture receiv ed signal strength and path loss behavior as functions of altitude, distance, and en vironment. Key p erformance indicator-level datasets 5 T ABLE I Unied and veried summary of publicly av ailable aerial wireless datasets [ 10 ], including p ersisten t DOIs or access links, data formats, platforms, frequency bands, and representativ e prior usage to supp ort repro ducible research. Name DOI / Access Link F o cus of Dataset Data Types and F or- mats Platforms F requency Published Papers Wireless I/Q Datasets (Signal-Level) [ 25 ], [ 26 ] L TE I/Q sample col- lection for A2G prop- agation, channel esti- mation, sp ectrum o ccu- pancy , and UA V local- ization SigMF raw I/Q sam- ples; GPS logs; an tenna pattern metadata UA V with NI USRP B205mini; xed AER- P A W L TE eNB L TE [ 27 ]–[ 29 ] Wireless Sp ectrum Datasets (Po wer-Lev el) [ 30 ]–[ 35 ] Wideband aerial spectrum monitoring for propagation analysis and model calibration PSD (dBm); frequency- tagged logs; GPS meta- data Helikite with dual USRP B205mini-i; Intel NUC 87 MHz– 6 GHz [ 36 ], [ 37 ] 5G NSA Wireless KPI Datasets (KPI-Level) [ 38 ]–[ 40 ] Aerial L TE/NR KPI measurements on a 5G-NSA netw ork using UA V-moun ted no des KPI logs (RSRP , RSRQ, SINR, throughput); GPS and UA V telemetry (CSV/JSON) AERP A W SAM UA V; Quectel 5G mo dem; Er- icsson 5G RAN n77 [ 41 ] LoRa Propagation Datasets (Po wer-Lev el) [ 42 ] Aerial and ground LoRaW AN propagation for IoT cov erage and latency analysis RSSI/SNR; pack et metadata; latency metrics; GPS/IMU logs UA V, tethered helikite, ground v ehicles; Lo- RaW AN gatewa ys 915 MHz — Multipath Propagation Datasets (Signal-Level) [ 43 ] A2G multipath channel characterization via synchronized channel sounding Raw I/Q with meta- data; CIRs; path-loss traces; noteb ooks UA V and xed no de with USRP B210; GNSS-disciplined oscillators 2.4 GHz [ 44 ] Wireless Lo calization Datasets (TDOA-Based) (Signal-Level) [ 45 ] UA V localization and tracking using distributed RF sensors TDOA estimates; GPS ground truth; LoS/NLoS labels; error metrics Keysight RF sensors; UA V-moun ted SDR 2.4– 3.3 GHz [ 46 ] AF AR RF Source Localization Dataset (Po wer-Lev el) [ 47 ] UA V/UGV RF source localization across digi- tal t win and testbed en- vironments RSS/RSQ; UA V navigation; CIR- derived metrics; metadata UA V and UGV with USRP B205mini; AER- P A W digital twin and testbed Cellular [ 48 ]–[ 50 ] UA V Signal Classication Datasets (Signal-Level) [ 51 ] RF-based detection and classication of UA V controller signals RF captures (MA T); spectrograms; lab els; MA TLAB scripts Keysight oscilloscope; parabolic antenna; RF front-end 2.4 GHz [ 52 ], [ 53 ] UA V T ra jectory , RSRP , and Throughput Dataset (KPI-Level) [ 54 ], [ 55 ] T ra jectory-aw are KPI emulation and v alida- tion for L TE SISO links Time-stamped CSV; RSRP; SNR; throughput; UA V telemetry UA V L TE SISO; AERP A W digital twin; MA TLAB simulation L TE [ 56 ] Ray-T racing Measurement Comparison Dataset (Po wer-Lev el) [ 57 ] Comparison of mea- sured and ray-tracing- simulated RSS along UA V tra jectories Measured/simulated RSS; path co ecients; delays; MA TLAB scripts UA V transmitter; xed receivers; NVIDIA Sionna R T 3.3 GHz [ 58 ] con tain higher-la yer metrics such as throughput, latency , and pack et error rate, enabling system-level ev aluation. Eac h dataset is accompanied by a standardized meta- data record that includes measuremen t lo cation, altitude range, carrier frequency , bandwidth, antenna congura- tion, and temp oral resolution. Where applicable, data are pro vided in widely adopted formats to promote in- terop erabilit y , and conv ersion scripts are supplied when proprietary or campaign-sp ecic formats are used. All datasets and associated scripts are hosted in publicly accessible rep ositories with p ersistent links. This central- ized catalog structure enables users to ecien tly identify relev an t datasets, understand their characteristics, and in tegrate them into their o wn analysis pip elines. T o facilitate informed dataset selection and comparative ev aluation, T able I I pro vides a task-oriented comparison of the surv ey ed datasets. This comparison highlights practical considerations that emerge from the analysis, including the imp ortance of matching dataset abstrac- tion level to the in tended research ob jectiv e, recognizing trade-os b etw een ra w signal delit y and system-lev el scalabilit y , and accounting for dataset-sp ecic limitations suc h as spatial cov erage, technology dependence, and en vironmental sp ecicity when in terpreting results or com bining datasets. F or instance, w e explicitly recommend utilizing Signal-Level datasets for physical lay er algorithm dev elopment where phase information is critical, while advising the use of KPI-Level datasets for scalable net- w ork orchestration studies where storage eciency and pro cessing speed are paramount. Building on this unied catalog and comparative p er- sp ectiv e, we next turn to the individual datasets in detail. 6 V ehicle P ort able Node Fig. 1. Illustration of the AERP A W large multirotor-t yp e UA V setup for the exp eriment, where the UA V carries a p ortable no de. The following sections present a set of aerial wireless datasets collected at the NSF AERP A W, enabled b y the exp erimen tal capabilities and constraints describ ed earlier. F or each dataset, we summarize the measurement ob jectiv es, hardware and soft w are conguration, dataset format, and representativ e results. Public rep ository links and p ost-processing scripts are pro vided to supp ort re- pro ducibilit y and reuse, and selected application examples are included to illustrate relev ance to propagation anal- ysis, system ev aluation, and data-driven aerial wireless researc h. V. Wireless I/Q Dataset I/Q datasets represent the most fundamental la yer of wireless measuremen ts, providing a v ersatile foundation for supp orting research across a wide range of topics. F rom these ra w signals, numerous KPIs can b e deriv ed, making them esp ecially v aluable for b oth mo deling and exp erimen tal studies. In this section, we present I/Q datasets collected from an L TE netw ork at dieren t UA V igh t heigh ts ov er the Lake Wheeler Field Labs. A. Description of Hardware and Softw are The large multirotor-t yp e UA V from AERP A W was used to collect I/Q samples during the experiment. As sho wn in Fig. 1 , the UA V carries a p ortable payload that includes an NI USRP B205mini SDR. Python scripts run on the SDR and GPS mo dule to collect I/Q samples at the desired center frequency , sampling rate, and interv al, and to record the UA V’s lo cation and p osition. The UA V is equipp ed with a dipole-type an tenna (SA-1400-5900). Before the exp eriment, the UA V’s ight path, navigation sp eed, and p osition were pre-planned by placing w aypoints on the map, enabling automatic con trol of the UA V and rep eatable exp eriments. The released dataset includes the recorded I/Q samples and the corresp onding GPS logs. The raw data are stored in MA TLAB (.mat) format, while the GPS information is provided as text les (.txt) to facilitate p ost-process ing. (a) Campaign Lo cation (b) Base Station (c) AERP A W UA V (d) T rajectory Fig. 2. Campaign environmen t and UA V tra jectory for the I/Q measurement dataset: (a) Go ogle Earth view of the site, (b) BS or transmitter, (c) pre-planned UA V trajectory , and (d) AERP A W UA V for I/Q signal reception. An AERP A W xed radio no de at the Lak e Wheeler Road Field Labs (L WRFL) site (see Fig. 2a and Fig. 2b ) is congured as an L TE Evolv ed No de B (eNB) to transmit the L TE downlink signal. The srsRAN op en-source SDR soft ware is used to realize the L TE eNB, where the transmitter antenna gain, center frequency , and num b er of resource blo c ks are congurable. A USRP B205mini SDR with a wideband antenna (RM-WB1) is installed at the xed radio no de. B. Dataset F ormat The I/Q measurement campaign w as conducted using an L TE base station and a UA V platform (see Fig. 2c ), where the UA V follo wed a zigzag tra jectory at v e xed altitudes ranging from 30 m to 110 m in 20 m incremen ts, as illustrated in Fig. 2d . The resulting wireless I/Q samples and synchronized UA V GPS logs are publicly a v ailable on IEEE Datap ort [ 25 ], providing a high-delity resource for air-to-ground (A2G) propagation analysis, channel estimation, and signal-level mo deling. All measuremen ts are released in SigMF format [ 59 ], including standardized metadata that captures recording parameters, timing information, and measurement con- text. The I/Q recordings consist of consecutive 20 ms snapshots acquired at a 2 MHz sampling rate, while GPS logs provide time-stamp ed latitude, longitude, and altitude information at one-second interv als. These data enable precise alignment b etw een signal-level observ ations and UA V mobility . F or repro ducibility and ease of reuse, the dataset is accompanied by do cumentation and post-pro cessing util- ities that supp ort conv ersion to commonly used analysis formats such as MA TLAB and CSV. Detailed directory 7 T ABLE II T ask-oriented comparative analysis of aerial wireless datasets, with dataset categories annotated by manuscript section lab els to supp ort cross-dataset selection and reuse. Dataset Category (Section) Propagation / Channel ML / Data-Driven Localization / Sensing KPI / System-Level Key Limitations Wireless I/Q Datasets ✓ (high-delity I/Q) ✓ (feature extraction) △ (indirect) × Large data volume; requires synchronization and advanced signal pro cessing Wireless Spectrum Datasets ✓ (power statistics) △ (coarse features) × × Po wer-lev el abstraction; no phase or timing information Multipath Propagation Datasets ✓ (delay/Doppler) △ (model tting) × × Scenario-specic; limited netw ork-lay er metrics LoRa Propagation Datasets ✓ (long-range A2G) △ (technology-specic) × △ (IoT metrics) Narrowband characteristics limit generalization to broadband systems Ray-T racing Comparison Datasets ✓ (measurement vs. R T) △ (hybrid mo deling) × × Environmen t-sp ecic assumptions; accuracy dep ends on scene mo deling Wireless Localization Datasets (TDOA-Based) △ (signal-derived) △ (feature learning) ✓ (primary fo cus) × Localization-oriented; limited general channel characterization AF AR RF Source Localization Dataset △ (signal-derived) ✓ (supervised learning) ✓ (primary fo cus) × Challenge-driven scenarios; conclusions dep end on task design and environmen t UA V Signal Classication Datasets × ✓ (RF ngerprinting) × × F o cused on controller classication rather than propagation analysis 5G NSA Wireless KPI Datasets △ (aggregate trends) △ (KPI learning) × ✓ (netw ork ev aluation) No raw signal access; p erformance depends on op erator conguration T ra jectory– RSRP– Throughput Datasets △ (link-level trends) △ (KPI prediction) × ✓ (throughput analysis) Includes emulated comp onents; lacks raw I/Q measurements Legend: ✓ well suited, △ partially suited, × not suited. hierarc hy , le naming con v entions, and conv ersion script descriptions are provided in App endix A . C. Represen tative Results In this section, we present several representativ e results using the published p ost-pro cessing scripts [ 26 ], [ 27 ]. Since the I/Q samples in this dataset are L TE wa veforms and the measurement window is 20 milliseconds, w e can decode the L TE frame start time and extract a full 10 millisecond L TE frame from eac h I/Q measuremen t MA TLAB le. W e can then plot the L TE resource grid and estimate the c hannel using the reference signals, as shown in Fig. 3a and Fig. 3b , respectively . F rom eac h I/Q measurement le, w e can also obtain the RSRP v alue, and by m atc hing the Unix timestamp with the GPS logs, we can determine the corresp onding 3D lo cation of the UA V and plot the RSRP o ver the UA V tra jectory , as shown in Fig. 3c . A dditionally , from the GPS logs, we can plot the 3D distance from the BS to the UA V o ver time and calculate the UA V’s sp eed b y dieren tiating the p osition, as sho wn in Fig. 3d and Fig. 3e , resp ectiv ely . Finally , Fig. 3f accumulates the GPS logs and RSRP data along the Unix timestamp to plot the RSRP across the 3D distance, where the tted free-space and t w o-ray path loss mo dels incorp orating 3D antenna patterns are aligned with the measured RSRP b ehavior. D. P ossible Uses of Dataset A2G Propagation Mo deling: Articial intelligence (AI)- based A2G propagation models can b e dev elop ed using the provided I/Q datasets. AI-based training and testing mo dels can incorp orate m ultiple features, such as the 3D an tenna pattern, UA V altitude and p osition, BS tow er heigh t, communication frequency and bandwidth, UA V sp eed. Note that our dataset [ 60 ] includes 3D radiation pattern measurements of both the transmit and receive an tennas, obtained in an anec hoic cham b er. UA V Receiver Algorithm Design: The provided I/Q dataset can facilitate the developmen t of practical time and frequency sync hronization algorithms, cell search, c hannel estimation, and deco ding techniques optimized for UA V communication systems. Sp ectrum Occupancy and Interpolation: F or spectrum sharing and co existence betw een terrestrial and aerial 8 (a) L TE Resource Grid (b) Estimated time and frequency selective channel. (c) RSRP at ve altitudes. Time[s] 0 500 1000 1500 2000 Distance[m] 0 50 100 150 200 250 300 350 400 450 500 2Ddistan ce 3Ddistan ce (d) Time vs 3D Distance Time[s] 0 500 1000 1500 2000 UA Vspee d[m/s] 0 1 2 3 4 5 6 7 Measurement(70m) (e) Time vs UA V Sp eed 100 150 200 250 3 00 400 50 0 3Ddistance [m] -130 -120 -1 1 0 -100 -90 -80 -70 -60 RSRP[dBm] Measurement(70m) Two-ray ( 70m) freespace(70m ) (f) Measured and mo deled RSRP vs. 3D dis- tance. Fig. 3. Representativ e results from the Wireless I/Q dataset: (a) L TE resource grid, (b) estimated c hannel, (c) RSRP along UA V tra jectory , (d) time vs. 3D distance (UA V altitude: 70 m ), (e) time vs. UA V sp eed (UA V altitude: 70 m ), and (f ) 3D distance vs. RSRP with path loss tting (UA V altitude: 70 m ). The gure shows that RSRP decreases as cumulativ e distance increases, while the sp eed and distance traces conrm measurements were taken under well-con trolled mobility , supporting statistically consistent path-loss and fading analysis. net works, UA V-based sp ectrum monitoring and interpo- lation techniques hav e b een widely inv estigated. Our I/Q dataset includes a single zigzag trajectory at multiple altitudes, enabling altitude-dep enden t sp ectrum analysis and the study of sp ectrum interpolation techniques. In our preliminary w orks [ 28 ], [ 61 ], we prop ose sp ectrum in terp olation approac hes based on the 3D Kriging [ 28 ] and matrix completion [ 61 ] using the I/Q dataset. UA V Lo calization and T racking: The detection, lo caliza- tion, and tracking of signal sources by UA V s are key tec hniques for ensuring priv acy and enabling netw ork co existence. By classifying malicious UA V s or incumbent signal sources, UA V-based systems can enhance situa- tional aw areness and supp ort secure and reliable sp ectrum op erations. Our I/Q dataset pro vides receiv ed signal strength (RSS) measurements along the UA V tra jectory across the exp erimen t site, enabling the developmen t and ev aluation of source lo calization and tracking algorithms. In our preliminary w ork, we propose a UA V lo calization tec hnique based on the tw o-ray path loss mo del, incorp o- rating 3D antenna radiation patterns [ 29 ]. VI. Wireless Sp ectrum Dataset Empirical spectrum measurements are essential for analyzing wireless channel b eha vior under practical con- ditions. Such datasets oer insight into signal v ariations across frequency , altitude, and environmen t, and serve as a basis for v alidating analytical and sim ulation mo dels. This section describes the measurement setup, including the hardware platform and data collection pro cedures used to obtain the rep orted results. Currently , ve distinct sp ectrum measuremen t datasets are av ailable on the AERP A W dataset page [ 10 ] and Dryad [ 30 ]–[ 34 ]. In this w ork, we focus on the Pac kapalo oza 2024 dataset [ 30 ]; ho wev er, the other datasets follo w the same le format and directory structure. A. Description of Hardware and Softw are The measurement setup consists of several comp onents selected to ensure reliable data acquisition and analysis. The main platform is a Helikite equipp ed with an SDR system. The Helikite provides stable ight at altitudes up to 300 meters, enabling spectrum measurements ov er a wide area with limited obstruction. The SDR system comprises a USRP device and an antenna, forming the core of the data collection unit. The p ortable no des utilize the NI USRP B205mini- i [ 62 ], the smallest USRP featuring a Xilinx Spartan 6 X C6SLX150 FPGA [ 63 ] and an Analog Devices AD9361 RFIC direct-conv ersion transceiver [ 64 ]. This device sup- p orts frequencies from 70 MHz to 6 GHz and oers up to 56 MHz of instantaneous bandwidth 1 (61.44 MS/s quadrature) for full-duplex op eration. As the core of 1 Instantaneous bandwidth is the maximum width of a frequency band that the device can receive or transmit without retuning. 9 RX antenna Intel NUC Cell modem USRP Power board GPS receiver Battery (a) Setup of the p ortable no de on the helikite. 87 MHz 6 GHz Sampling r a t e 30.72 MHz f c i f c i+1 f c n 25.68 MHz … … … IQ Sample Acquisition V alid bins W elch PSD Es tima tion FFT E dg e T rimming 512-poin t FFT W elch me thod Disc ar d 84 bins (42 per edg e) 512 - 84 = 428 ⎡ (6000-87)/25.68 ⎤ = 231 fr equency poin ts P er s w eep output 231×428 = 98,868 Da t a St or ag e (b) Sp ectrum sweep pro cedure. Fig. 4. Measuremen t setup and pro cedure for sp ectrum data collection using the helikite-mounted p ortable no de. (a) Exp eri- mental setup of the p ortable no de on the tethered helikite. (b) Spectrum sweep procedure. The pro cedure indicates that sp ectrum measurements are collected using rep eatable sweeps under xed hardware settings, making the resulting p ow er statistics suitable for comparative altitude- and time-based analysis. our SDR platform, the USRP B205mini-i pro vides high sensitivit y and selectivity across most commercial wireless bands, including L TE, 5G NR, and ISM. Fig. 4a illustrates the helikite-mounted measurement conguration, including the adapter housing the battery , GPS logger, and p ortable no de. The GPS logger records the platform location using information from the v ehicle autopilot while the platform is externally controlled. The GPS logger is connected via a USB cable to a companion computer (Intel NUC) housed within the p ortable no de. The Intel NUC manages tw o B205mini-i SDRs; one is equipp ed with a 3.5 GHz fron t end while the other op erates without a sp ecic front end. The portable no de is designed to operate on a 19 V supply from the battery , which p ow ers not only the companion computer but also the activ e comp onents of the fron t end, such as the Lo w Noise Amplier (LNA). Both USRPs are connected to iden tical but separate receive an tennas and are congured only to receive signals; there is no transmission functionality in this setup. The measured data for each sw eep requires approximately 15 seconds to b e stored. The sp ectrum sweep pro cedure used in the exp erimen ts is depicted in Fig. 4b , where the cen ter frequency shift and sampling rate are 25.68 MHz and 30.72 MHz, resp ectiv ely . The primary softw are comp onen ts consist of custom Python scripts that automate data collection and initial pro cessing stages, ensuring consistency and eciency in long-duration measurement campaigns. F or additional in- formation regarding the sp ectrum monitoring exp eriment, please refer to [ 65 ]. B. Dataset F ormat The wireless sp ectrum measurement dataset is publicly a v ailable through the Dryad Digital Rep ository and is designed to support wideband sp ectrum analysis, prop- agation studies, and data-driv en wireless researc h. The dataset consists of time-stamp ed p o wer sp ectral measure- men ts collected during aerial exp eriments, together with sync hronized UA V lo cation information. All sp ectrum and positioning data are released in SigMF format, accompanied by standardized metadata that do cumen t the measurement metho dology , equipment conguration, frequency settings, and acquisition context. P ow er sp ectrum records provide frequency-domain p o w er measuremen ts expressed in dBm ov er the monitored bandwidth, while GPS logs include time-aligned latitude, longitude, altitude, and Unix timestamp information. This structure enables precise asso ciation b et ween sp ectrum observ ations and UA V mobility . T o facilitate repro ducible analysis and interoperability with commonly used signal pro cessing to ols, the dataset includes supp orting do cumentation and utilities for con- v ersion in to MA TLAB and CSV formats. Detailed direc- tory hierarc hy , le naming conv entions, and conv ersion script descriptions are provided in App endix A . C. Represen tative Results This section presents representativ e results from sp ec- trum monitoring exp eriments conducted in b oth urban and rural environmen ts. Utilizing adv anced aerial plat- forms suc h as helikites, these experiments oer v aluable insigh ts into how environmen tal factors and top ographical features inuence wireless signal propagation and distri- bution. By comparing the results from densely p opulated urban areas during the Pac kapalo oza even t with those from the more op en and sparse rural areas near Lake Wheeler, w e aim to highlight the distinct challenges and dynamics encountered in dierent settings. Helikite T ra jectory Analysis: In urban settings during the P ackapalooza even t, the helikite’s tra jectory , as depicted in Fig. 5a , sho wcases its path abov e a densely p opulated area with signicant deviations caused by complex wind in teractions with urban structures. This erratic mo vemen t, indicated b y a red trace, p oten tially aects sp ectrum measuremen ts due to v ariable altitudes and obstructions. Con versely , in the rural landscap e near Lak e Wheeler as sho wn in Fig. 5b , the helikite exhibits a more stable and elongated igh t path across op en elds, suggesting more 10 (a) Pac kapalo oza 2024. (b) Lake Wheeler 2024. Fig. 5. Helikite lo cation for sp ectrum measurements in (a) Pac k- apalooza 2024 and (b) Lake Wheeler 2024. The tw o lo cations illustrate that the dataset captures en vironment-dependent sp ectrum statistics, enabling practical comparison b etw een less congested and more interference-prone RF environmen ts. consisten t data collection due to fewer obstructions and a steadier altitude control. Sp ectrum Analysis: In Fig. 6 , the 3D plots for Band 13 do wnlink (746 - 756 MHz) reveal distinct v ariations in sig- nal p o wer across dieren t environmen ts. In urban settings, Fig. 6a , p o wer lev els uctuate signicantly with altitude due to multipath eects and obstructions, showing a trend to ward stabilization as altitude increases. In contrast, rural settings in Fig. 6b display a more uniform increase in p o wer lev els at higher altitudes, indicating clearer signal paths and fewer obstructions. Fig. 7 illustrates the mean receiv ed p ow er as a function of frequency across altitudes for the Pac kapalo oza 2024 dataset, with several active United States radio bands also indicated. The results show that the mean received p o wer is signicantly higher b elow 1 GHz, where many L TE and NR netw ork bands are lo cated, compared to the remainder of the sub-6 GHz sp ectrum. D. P ossible Uses of Dataset Our helikite-based sp ectrum monitoring dataset pro- vides calibrated received p o wer measurements across a wide frequency range (87 MHz–6 GHz) with corresp ond- ing GPS co ordinates, altitude, and timestamp. While it do es not include raw I/Q samples or pow er sp ectral densit y (PSD) estimates, the dataset remains v aluable for man y practical wireless researc h and regulatory applica- tions. (a) Pac kapalo oza 2024. (b) Lake Wheeler 2024. Fig. 6. Altitude dependent p ow er in the 746 − 756 spectrum (L TE DL Band-13) in (a) Pac kapalo oza 2024 and (b) Lake Wheeler 2024. The plot shows systematic p ow er uctuations with altitude, indicating that elev ation is a statistically signican t factor in received spectrum power for aerial platforms. 1000 2000 3000 4000 5000 6000 Frequency (MHz) -80 -60 -40 -20 0 Power (dBm) mean n5 (UL/DL) ISM CBRS U-NII-3 Fig. 7. Representativ e results on the mean received p ow er versus frequency av eraged across all altitudes for the Pac kapalo oza 2024 dataset. 11 Sp ectrum Allocation Analysis: The dataset enables spatial and altitudinal characterization of sp ectrum utilization across urban and rural environmen ts. F or example, com- parisons of received p o wer in the Citizens Broadband Ra- dio Service (CBRS) and T elevision White Spaces (TVWS) bands can reveal underutilized areas or high-demand regions. In urban settings, it allo ws researchers to measure outdo or signal levels in the 6 GHz unlicensed band to assess p otential interference from indo or Wi-Fi 6E deplo yments. The av ailability of time-stamped data also p ermits the exploration of temp oral usage trends, such as p eak usage p eriods or band-specic congestion. Calibration of Analytical Mo dels: The dataset supports calibration of analytical and simulation mo dels, including sto c hastic geometry and empirical path loss framew orks. The relationship b et w een receiv ed p o wer and altitude can b e used to v alidate altitude-a ware propagation assump- tions. Dierences observed b et ween rural and urban mea- suremen ts can help rene clutter loss mo dels. In addition, LoS probability mo dels can b e empirically ev aluated using elev ation-dependent signal trends. Propagation Mo del T uning: Researchers can use the dataset to dev elop or rene radio propagation mo dels. The lo cation-tagged p ow er measuremen ts support construction of empirical path loss curves for a range of frequency bands. Comparing measuremen ts tak en in urban versus rural environmen ts helps to characterize the impact of buildings, vegetation, and other obstructions. Moreo v er, dierences b et ween low-frequency bands lik e FM and higher bands like 3.5 GHz can b e used to study frequency- dep enden t attenuation. Mac hine Learning for Signal Estimation: The dataset is suitable for dev eloping mac hine learning mo dels that estimate received p ow er from spatial and environmen tal features. Inputs such as latitude, longitude, altitude, and frequency can b e used to train regressors for p ow er predic- tion. The lab eled nature of rural and urban environmen ts supp orts classication tasks, suc h as iden tifying the t yp e of environmen t based on observed signal lev els. The data can also help delineate signal boundaries or approximate co verage maps through sup ervised learning. Anomaly and Interference Detection: The received p o wer measuremen ts allow for basic anomaly detection tech- niques. Sudden spikes or dips in p ow er levels may indicate unauthorized transmissions or interference even ts. Statis- tical prop erties suc h as skewness or v ariance can be used to detect deviations from normal signal patterns. When the data is track ed ov er time, researchers can analyze signal disruptions or temporal anomalies in sp ecic frequency bands. In terp olation and Cov erage Mapping: Despite the absence of I/Q or PSD data, the dataset is well-suited for generat- ing radio environmen t maps. The geolo cation and altitude information asso ciated with each measuremen t can b e used for spatial interpolation techniques such as Kriging or in verse distance w eighting. By interpolating the p o wer v al- ues, researchers can generate tw o-dimensional (2D) or 3D signal co verage maps for individual bands. The multi-band nature of the dataset further allows for frequency-aw are co verage visualizations across the monitored sp ectrum. VI I. 5G NSA Wireless KPI Dataset As the demand for using adv anced communications to support v arious use cases of UA V s rapidly increases, understanding the p erformance of 5G terrestrial netw orks in the 3D spatial domain b ecomes critical. In this section, w e present datasets for 5G wireless KPIs and the corre- sp onding exp erimental results from aerial measurements using a 5G-enabled UA V on a 5G non-standalone (5G- NSA) netw ork in C-band in the AERP A W testb ed. In particular, the datasets provide the eld-measured RF and ph ysical (PHY) lay er parameters of L TE and NR carriers on the 5G-NSA netw ork using three dierent t yp es of small p ortable no des (SPN) based on Quectel 5G mo dem, a mo died Android phone with Nemo soft ware, or a COTS Android device with P awPrin ts, a custom App that relies on op en-source Android application programming in terfaces (APIs). A. Description of Hardware and Softw are AERP A W pro vides m ultiple wireless radio access plat- forms for 4G and 5G exp erimen tation, including a commercial-grade Ericsson 5G netw ork that serves as the primary infrastructure for these datasets. AERP A W infrastructure for these exp eriments inv olves a) Ericsson 5G netw ork with RAN and Core, b) SPN, c) AERP A W xed node (AFN) as application server of user plane trac, and d) the UA V to carry the SPN during aerial exp erimen tation (Fig. 8 ). The RAN of this 5G system is deplo yed at the AERP A W L WRFL, whic h is a rural agricultural area (see Fig. 2b ), predominan tly an op en aerial eld with some vegetation on the ground. T o characterize the aerial p erformance of a 5G system, w e used a 5G NSA system with ov erlaid NR and L TE sec- tors. The L TE anchor carrier is in band 66 ( 1 . 7 / 2 . 1 GHz) with 5 MHz c hannel bandwidth and an NR carrier at 3 . 4 GHz in band n77 with 100 MHz of channel bandwidth. The sectors use a pair of dual +/-45 deg cross p olarized directional an tennas with 120 degrees of azimuth b eam width facing the north-w est direction from the BS to wer. L TE employs 2×2 MIMO on the downlink, whereas NR uses 4×4 MIMO. F or this exp eriment, b oth L TE and NR carriers are set at 5 watts of transmit p ow er p er antenna p ort. F or aerial exp eriments, three t yp es of p ortable no des w ere used as 5G user equipment carried by UA V s: a mo dem-based no de, a Keysigh t Nemo device, and a COTS Android device running Pa wPrints softw are. The p ortable no de based on the 5G mo dem as sho wn in Fig. 9 uses a Quectel 5G mo dule to connect to the Ericsson 5G net work, a LatteP anda mo dule as a companion computer to in terface with the UA V, and an A TT 5G mo dem for C2. The p ortable no de that is used as UE is moun ted on a small AERP A W Multi-rotor (SAM) UA V. 12 SPN on U A V AERP A W Ne tw ork Fix ed Node (AFN) @ AERP A W CC1 Fig. 8. 5G-NSA AERP A W Infrastructure using Ericsson netw ork. (a) SAM mounted with p ortable no de (SPN) (b) Small p ortable no de (SPN) with Quectel 5G mo dem Fig. 9. SAM mounted with a p ortable radio no de used in A2G measurements. (a) SAM mounted with SPN and (b) SPN with Quectel 5G mo dem. A high-lev el end-to-end softw are arc hitecture is giv en in Fig. 10 . There are three main softw are functions at the p ortable no de, namely radio softw are, trac softw are, and vehicle con trol softw are. These softw are mo dules run on the E-VM of the p ortable no de and generate real-time radio, trac, and v ehicle logs during the exp erimen t. The E-VM at the AFN provides the other end p oint of the serv er-client mo del for the user plane data through a trac soft ware and logging. T r a f fic Gener a t or Ericsson 5G RAN tlog E -VM - P ort able Node In t egr a t ed Applic a tion Radio Softw ar e T r a f fic Out T r a f fic In Radio Signals Out Radio Signals In rlog Ericsson 5G Cor e Ericsson App Ser v er V ehicle Softw ar e in the Loop (SITL) V ehicle Con tr ol Applic a tion Commands St a tus vlog AERP A W Ne tw ork T r a f fic Gener a t or tlog T r a f fic Out T r a f fic In E -VM - Fix ed Node OE O Console OE O - Console -VM Fig. 10. Software functional workow with 5G-NSA network. The worko w highlights that KPIs are derived from time-synchronized radio, trac, and UA V telemetry , which is essential for statistically reliable spatial p erformance mapping. F or Android-based measurements, the SAM UA V car- ried an SPN payload con taining tw o Android smartphones moun ted on custom hardware brac k ets. The tw o Android devices used were: a commercial standard Samsung S21 device with Pa wPrints, an in ternal AERP A W-built An- droid application using op en source Android APIs to log radio KPIs, and a mo died Samsung S23 con taining Keysigh t Nemo softw are [ 66 ], with custom rm ware, access to in ternal mo dem metric, and a wider range of KPIs. A Latte Panda on-board the SPN collected and logged GPS and UA V attitude measuremen ts, obtained from GPS sensors and an Ardupilot, resp ectiv ely , along with radio KPIs streamed b y the Android phone o ver USB. These Android phones connected to the priv ate 4G/5G Ericsson cell to wer. These phones also connected as clien ts to the In ternet Proto col Performance (iPerf) Server at the AFN, 13 (a) RSRP of L TE and NR si gnals versus distance and time. (b) SINR of L TE and NR signals versus distance and time. (c) RSRP of NR signals ov er 3D tra jectory . (d) SINR of NR carrier Fig. 11. (a) RSRP and (b) SINR of L TE and NR carriers vs. distance and time, (c) RSRP and (d) SINR of NR Carrier with UA V geo-location. These gures show that both RSRP and SINR exhibit clear distance- and lo cation-dep enden t trends, supporting spatially resolved statistical coverage analysis. enabling throughput measurements. B. Dataset F ormat The 5G-NSA datasets are categorized based on the t yp e of portable no de used during the measuremen t campaigns: (a) 5G modem-based SPN and (b) Android device-based SPN (Nemo and Pa wPrin ts). The datasets pro vide synchronized RF/PHY-lay er p erformance metrics, application-la yer throughput measuremen ts, and UA V telemetry collected during controlled UA V igh t exp er- imen ts on the AERP A W platform. The mo dem-based datasets include L TE and NR KPIs such as RSRP , SINR, Channel Quality Indica- tor (CQI), Rank Indicator (RI), Mo dulation and Co d- ing Scheme (MCS), and downlink throughput obtained using a UA V-mounted Quectel 5G mo dem connected to an Ericsson 5G-NSA net work. Complementary Android- based datasets collected using Nemo and Pa wPrints to ols pro vide L TE and NR KPIs derived from Android APIs, along with throughput measurements when av ailable. All datasets are released as structured CSV les with sync hronized timestamps and UA V geolo cation (longitude, latitude, altitude), enabling spatially resolved analysis of aerial cellular p erformance. Detailed descriptions of le organization, raw and p ost-processed logs, and parameter- sp ecic data les for b oth mo dem-based and Android- based datasets are provided in App endix A . C. Represen tative Results This section presents a few representativ e results from the aerial exp erimen ts using the abov e 5G modem and Android devices based p ortable no des on the Ericsson 5G- NSA netw ork. 5G mo dem dataset results: As explained ab ov e, w e used an UA V p ow ered by a 5G Quectel mo dem to measure and collect data along a zigzag aerial path tra jectory . F rom these exp erimen ts the RF/PHY parameters as well as application lay er p erformance parameters were collected for analysis. 14 The RSRP and SINR are some of the RF parameters and CQI, RI and MCS are some of the PHY lay er param- eters measured and logged on the 5G-p o wered p ortable no de presented here. Fig. 11a and Fig. 11b show the measured levels of downlink RSRP and SINR on L TE and NR carriers v ersus distance and time, whereas Fig. 11c and Fig. 11d show the same RSRP and SINR of NR carrier along the geo lo cations of the zigzag UA V igh t tra jectory . Similarly , Fig. 12 shows the reported CQI, RI and MCS versus the distance, time and geo lo cation on the L TE and NR downlink carriers. An iPerf client-serv er app with downlink trac was used b etw een the portable no de and the wired AFN, and Fig. 13 shows the downlink throughput achiev ed at the application lay er in real-time. Nemo and Pa wPrints dataset results: This section presents the representativ e results from the wireless KPI datasets collected from a UA V in tw o scenarios: measurements of a priv ate BS at the AERP A W L WRFL with controlled UA V tra jectories (using P awPrin ts and Nemo), and measure- men ts of commercial cell tow ers from a tethered Helikite during the Pac kapalo oza 2023 festiv al (using Pa wPrints). Fig. 14 depicts some representativ e results from the rst scenario, when the UA V traces sawtooth trajectories in the horizon tal plane, at increasing distances from the priv ate Ericsson BS. Fig. 14a and Fig. 14b show a heatmap of the iP erf throughput measured b y the Nemo and Pa wPrints device, resp ectively , when b oth were op erating as clien t sim ultaneously . The heatmaps conrm the reduction in throughput observed near handov er regions, particularly at sector b oundaries, as evidenced by the blue-shaded areas. Fig. 14c shows the channel rank of the physical do wnlink c hannel recorded by Nemo during the ight. Fig. 15 depicts the changing RSRP of an L TE node with v arying Helikite altitude as observ ed b y a Pa wPrints de- vice during the Pac kapalo oza 2023 even t. The Pa wPrints P ackapalooza 2023 dataset also contains extensive records of other nearby commercial L TE cellular tow ers, op erated b y A T&T and their netw ork KPI v alues near the NC State Universit y campus. Both datasets can b e pro cessed using the data pro cessing scripts in the previous sections to analyze netw ork cov erage and p erformance in the aerial dimension. The data from these exp eriments are publicly av ailable at the AERP A W datasets webpage [ 10 ] and in Dryad researc h repository [ 38 ]–[ 40 ], [ 67 ], [ 68 ]. D. P ossible Uses of Dataset The KPIs av ailable in this dataset can b e utilized for the following representativ e research problems. Study of wireless channel propagation in rural aerial en vironments: The empirical data on v ariations in signal strength, with distance from the BS and elev ation and azim uth angles, can b e used to v alidate existing theoretical propagation models and ra y-tracing simulators, along with dev eloping new mathematical or machine learning mo dels. Moreo ver, deep er insights can be obtained by studying the v ariation in channel rank and channel quality index in aerial scenarios. Application lay er throughput prediction in rural aerial scenarios: Throughput prediction mo dels for rural aerial scenarios can b e created by studying the relation b etw een ph ysical lay er KPIs suc h as channel rank and received SINR, and iPerf throughput. Analysis of commercial cellular netw ork cov erage in aerial urban environmen ts: The P ackapalooza dataset con tains receiv ed signal strength and quality v alues at v arious altitudes, whic h can be used to study the suitabilit y of commercial cellular netw orks, traditionally designed to serv e ground users, for aerial op erations. VI II. LoRa Propagation Dataset The LoRaW AN technology utilizes chirp mo dulation tec hniques to support long range, lo w pow er communi- cations, exhibiting unique propagation c haracteristics for measuremen t. In this section, we describ e AERP A W’s in- frastructure for suc h measuremen ts and presen t represen- tativ e results from LoRaW AN measurement campaigns. A. Description of Hardware and Softw are The LoRa infrastructure consists of USB-compliant pro- grammable LoRa devices and seven LoRaW AN gatewa ys (see Fig. 16 ), which relay LoRa communications ov er the AERP A W backplane to tenant-dedicated Do c ker contain- ers for executing application-sp ecic data pro cessing tasks. Standard soft ware stacks are installed on the con tainers, including Prometheus and PostGRES storage, whic h feed data for Grafana-based visualization. Fig. 17 sho ws the mobile platforms used for LoRaW AN measurements, in- cluding a ground v ehicle (Fig. 17a ), a UA V (Fig. 17b ), and a helikite (Fig. 17c ). The LoRa devices allow the exp erimen ts to congure the spreading factor b etw een 7 to 12, and accordingly set the transmission data rate from DR3 (5.47 kbps) to DR0 (0.25 kbps). B. Dataset F ormat The LoRa propagation dataset includes measuremen t logs collected from both the LoRa transmitter and the asso ciated LoRaW AN gatew ays, enabling end-to-end c har- acterization of aerial and ground LoRaW AN links. The dataset captures detailed pac ket-lev el metadata together with synchronized vehicle mobility and p ositioning in- formation, supp orting cov erage analysis, signal quality ev aluation, and latency assessment in aerial IoT scenarios. T ransmitter-side logs record pack et identiers, trans- mission parameters (including data rate, bandwidth, co de rate, spreading factor, and carrier frequency), transmis- sion timestamps, and vehicle state information such as geographic lo cation, orientation, velocity , and GPS status. Gatew ay-side logs capture reception metrics for success- fully deco ded pack ets, including Received signal strength indicator (RSSI), signal-to-noise ratio (SNR), reception timestamps, frequency channels, RF chain identiers, and gatew ay lo cation metadata. 15 (a) CQI & RI of NR carrier (b) CQI of NR carrier (c) MCS & RI of NR carrier (d) MCS of NR carrier Fig. 12. (a) CQI and (c) MCS of NR carrier with resp ect to distance and time, (b) CQI and (d) MCS of NR Carrier with UA V geo-location. The adaptation metrics v ary consistently with distance and p osition, indicating that link adaptation responds predictably to aerial channel conditions. (a) Throughput vs distance & time (b) Throughput vs geo lo cation Fig. 13. (a) Throughput with resp ect to distance and time, (b) Throughput with UA V geo-location. The throughput plots show signicant spatial and temp oral variabilit y , highlighting that achiev able rate statistics are strongly tra jectory dep endent. 16 Iperf Throughput from Nemo (Mbps) (a) Nemo iPerf throughput. Iperf Throughput from PawPrints (Mbps) (b) Pa wPrints iPerf throughput. 1 2 3 4 PDSCH Channel Rank (c) 5G downlink channel rank (Nemo). Fig. 14. Wireless KPI data gathered at AERP A W Lak e Wheeler tow er 1: (a) and (b) show iPerf throughput observed by Nemo and Pa wPrints, resp ectively , while simultaneously sending trac as iPerf clients; (c) shows the 5G do wnlink channel rank as recorded by Nemo. The comparison demonstrates that measured throughput statistics dep end on the logging to ol, which is practically imp ortant when benchmarking or cross-v alidating datasets. Fig. 15. RSRP v ariation against altitude observed by a PawPrin ts device on a Helikite at Pac kapalo oza 2023. In addition to successful transmissions, the dataset includes records of failed pack et transmissions and ag- gregated summaries of gatew ay-lev el data rate statistics, enabling reliabilit y and p erformance analysis across de- plo yment scenarios. Raw signal-level measurements are pro vided in SigMF format, while processed pac ket- and gatew ay-lev el records are released in structured CSV les suitable for statistical analysis and machine learning applications. Detailed le inv entories, directory organiza- tion, and con version script descriptions are pro vided in App endix A . (a) LoRaW AN gatewa y . (b) LoRaW AN dongle. Fig. 16. (a) LoRaW AN gatewa y and (b) USB-compliant pro- grammable LoRa device, used in the AERP A W system for mobile LoRa exp eriments. C. Represen tative Results The LoRa transmitter device was carried as a payload b y a tethered HeliKite, which traced a free-oating tra- jectory ov er the North Campus of NC State Universit y , Raleigh. The LoRa device was controlled by a Latte Panda mini computer, which also logged pac k et transmission details. The LoRa device transmitted pack ets, containing a sequence num b er and timestamp, at interv als of 1 . 5 s to six LoRaW AN gatewa ys at m ultiple locations, as shown in Fig. 18 . These gatew ays recorded the received RSSI, receiv ed SNR, and the timestamp of reception. The CDF of receiv ed RSSI at the gatew a ys is shown in Fig. 19a . The v ariation in received SNR with received RSSI, ov er all the LoRaW AN gatewa ys, is shown in Fig. 19b , which indicates that higher RSSI results in a smaller range of SINR v alues. In con trast, low er RSSI v alues can cause SIR uctuations as noise and interference dominate. The dataset not only provides physical lay er signal strength parameters but also includes pack et-level latency metrics. Data from LoRaW AN exp erimen ts are publicly a v ailable at the AERP A W datasets webpage [ 10 ] and in Dryad researc h repository [ 42 ]. 17 (a) Ground vehicle carrying a LoRaW AN device. (b) UA V carrying a LoRaW AN device. (c) Helikite carrying a LoRaW AN device. Fig. 17. Ground and aerial platforms used in mobile LoRaW AN experiments: (a) ground vehicle, (b) UA V, and (c) helikite, each carrying a LoRaW AN device. D. P ossible Uses of Dataset The use cases of this data set include: LoRaW AN Optimization for Mobile Aerial Applications: The dataset enables ev aluation of LoRaW AN p erformance in both urban and rural en vironments under mobile and aerial op erating conditions. By analyzing receiv ed signal strength, pack et deliv ery b ehavior, and gatewa y visibility as functions of UA V p osition and altitude, researchers can assess co verage limitations and inform gatewa y placement and density strategies. These measuremen ts are partic- ularly relev an t for IoT deplo yments inv olving mobile or airb orne platforms, which remain comparativ ely under- represen ted in existing LoRaW AN measurement studies. LoRa Physical-La yer Characterization: The dataset sup- p orts empirical analysis of LoRa ph ysical-lay er b ehavior under v arying channel conditions, including changes in Detailed spatial RSSI heatmap Flight location LoRaWAN Gateways L W5 L W4 L W1 L W3 L W2 CC2 CC3 Fig. 18. Lo cation of the LoRa tethered Helikite ight, showing location of the six LoRaW AN gatewa ys and the top view of the Helikite locations. The spatial separation of gatew ays enables statis- tical ev aluation of gatewa y diversity and co verage ov erlap. noise o or and receiv ed signal strength. The av ailability of altitude- and orien tation-tagged measurements enables c haracterization of air-to-ground LoRa propagation trends and transmission reliability . Such data can b e used to ev aluate physical-la yer robustness and to inform prop- agation mo deling eorts for lo w-p o wer wide-area aerial comm unication scenarios. IX. Multipath Propagation Dataset The b ehavior of radio signals as they propagate through the en vironment is a key factor in the design and p erfor- mance of v arious wireless systems, ranging from radars to cellular netw orks. In this context, m ultipath propa- gation datasets provide a crucial pathw a y to a deep er understanding of wireless communication principles, which ultimately contributes to robust wireless systems. This section describ es the hardw are and softw are comp onents of some of a propagation dataset acquired with an op en- source c hannel sounder [ 43 ], [ 44 ] from the AERP A W testb ed platform. A. Description of Hardware and Softw are The exp erimental setup in volv ed a UA V and a xed no de lo cated at the AERP A W Lake Wheeler testb ed site in Raleigh, North Carolina. The UA V carries a p ortable no de equipp ed with a USRP B210, RF fron t-end, Intel NUC, and a custom-designed Global Na vigation Satellite System disciplined oscillator (GNSSDO), as sho wn in Fig. 20a . The xed no de is congured with identical equipment. 18 -110 -105 -100 -95 -90 -85 -80 Received RSSI at LoRaWAN gateways (dBm) 0 0.1 0.2 0.3 0.4 0.5 0.6 0.7 CDF LW-1 CC-2 CC-3 LW-2 LW-4 Worst distribution of received RSSI at LW-1 (a) CDF of received RSSI at v arious LoRaW AN gatewa ys. -110 -100 -90 -80 -70 RSSI (dBm) -20 -15 -10 -5 0 5 10 15 20 SNR (dB) SNR saturates at higher RSSI due to interference (b) V ariation in LoRa pac ket’s received SNR as a function of receiv ed RSSI, aggregated ov er six LoRaW AN gatew ays. Fig. 19. The KPIs of LoRaW AN links measured during a tethered Helikite exp eriment, where the LoRa transmitter was elev ated, and data were collected across six gatewa ys. (a) Empirical CDF of received RSSI v alues observed at m ultiple gatewa ys. (b) Relationship between receiv ed RSSI and corresponding SNR, highlighting link quality v ariation. A ccurate characterization of A2G multipath wireless c hannels requires precise temp oral alignment b et ween the transmitting and receiving devices. Multipath propaga- tion inherently introduces time -v arying dela ys and phase shifts, and without stringen t synchronization, these eects can b e misinterpreted as genuine c hannel b ehavior. The custom-designed GNSSDO system, as sho wn in Fig. 20b , emplo yed b y AERP A W ensures a stable and common timebase for both the UA V and xed no de, minimizing phase ambiguit y and enabling reliable quantication of m ultipath comp onen ts and time-domain channel impulse resp onses (CIRs). The GNSSDO system achiev es 2.5 ns pulse-p er-second (PPS) accuracy b et ween the nodes, fa- cilitating high-delity channel measurements. Fig. 20c presents the ov erall architecture of the channel sounder soft ware. The softw are, developed in Cython, (a) Experiment setup for the USRP B210-equipped p ortable node and UA V. (b) Custom-designed GNSSDO system. GPSDO USRP Host PC - TX TX Channel Sounder Software Waveform Generator Scheduler Frame Generator USRP Sync Control 10 MHz Stratum-1 Time RF Frontend GPSDO USRP Host PC-RX RX Channel Sounder Software I/Q Collector Workers USRP Sync Control Stratum-1 Time RF Frontend Scheduler Correlator Power Detector Channel Estimator PPS PPS 10 MHz (c) Overall system architecture of the channel sounder. Fig. 20. Hardw are and system architecture used for A2G multi- path channel sounding measurements. (a) Field deploymen t of the portable measurement no de based on a USRP B210, moun ted on a UA V platform for aerial data collection. (b) Custom-designed GNSSDO providing high-precision timing and synchronization. (c) Block diagram of the channel sounder, highlighting key comp onents and signal ow used during the A2G exp eriments. enables real-time pro cessing of the USRP B210’s full bandwidth (56 MHz) and b eyond, as describ ed in [ 43 ]. The USRP B210 is synchronized using GNSSDO-generated PPS and 10 MHz reference signals, ensuring accurate tim- ing control and reliable data acquisition. The system sup- p orts multiple congurable sounding wa veforms, including Zado-Ch u, pseudo-noise (PN), and chirp sequences. F or the measuremen ts in this study , a Zado-Ch u sequence of length 401 and ro ot index 200 was used, with each 19 sequence rep eated four times. The sounding was conducted at a measuremen t frequency of 4 Hz, with a center frequency of 3564, 3620, or 3686 MHz, and a transmit p o wer of 19 dBm. A total of nine ight exp erimen ts w ere p erformed at three altitudes (30, 60, and 90 meters) along a 500-meter ight path, with a ight sp eed of 5 m/s. This conguration supports a wide range of channel sounding scenarios with high temp oral and spatial resolution. B. Dataset F ormat The A2G channel sounding dataset is released using the SigMF sp ecication [ 59 ], enabling standardized rep- resen tation of raw signal measurements together with comprehensiv e metadata. The dataset captures synchro- nized complex baseband samples acquired during UA V- based channel sounding exp erimen ts and supp orts detailed analysis of multipath propagation, path loss, and Doppler eects. The asso ciated metadata describ e measuremen t param- eters such as sampling rate, center frequency , capture timing, and wa veform conguration, along with UA V state information including geographic lo cation, altitude, and exp erimental con text. Additional elds do cument the Zado–Chu sequence parameters and synchronization settings used during the sounding pro cess, enabling re- pro ducible extraction of channel impulse responses and deriv ed propagation metrics. Represen tative results obtained from the dataset are illustrated in Fig. 21 , including an example channel im- pulse resp onse and corresp onding path loss measurements collected during a UA V ight at 90 m altitude. These examples demonstrate the suitabilit y of the dataset for m ultipath c haracterization and propagation mo deling. The dataset is accompanied by p ost-pro cessing tools that supp ort c hannel resp onse extraction and visualization using standard signal pro cessing w orkows. Detailed le structure, binary format descriptions, and p ost-pro cessing utilities are documented in App endix A . This organiza- tion ensures interoperability with third-party to ols while preserving full repro ducibilit y . C. Represen tative Results This section presents representativ e results from c han- nel sounding exp erimen ts conducted at the AERP A W L WRFL, a rural en vironmen t designed for wireless ex- p erimen tation. Fig. 21a illustrates a represen tative CIR obtained using correlation-based pro cessing of the receiv ed Zado-Ch u sequences. The three-dimensional plot shows the evolution of m ultipath components ov er time during a UA V ight. The horizontal axis represents the delay (in microseconds), the vertical axis indicates the exp eriment time (indexed per snapshot), and the color scale denotes the received signal magnitude in dB. The black trace pro jected onto the back plane indicates the UA V’s GPS distance from the xed transmitter as a function of time. The v ariation in dela y spread and path p ow er ov er time reects the dynamic nature of the A2G propagation c hannel, including the impact of UA V motion and altitude v ariation. Fig. 21b shows the corresp onding path loss measuremen t o ver the full ight trajectory . The UA V’s altitude prole is o verlaid to highlight dieren t igh t phases, including takeo, igh t, and landing. The results demonstrate a clear relationship b etw een the received p o wer and UA V p osition, consistent with exp ected large- scale path loss b ehavior. D. P ossible Uses of Dataset The provided dataset enables a wide range of researc h opp ortunities in the study and mo deling of A2G wireless comm unication channels. Given the synchronized high- resolution measurements, as well as the a v ailability of UA V p osition data, the dataset is well-suited for the following applications: Air-to-Ground Channel Mo deling: The dataset enables extraction of k ey air-to-ground propagation c haracteris- tics, including delay spread, Doppler proles, path loss b eha vior, and coherence bandwidth. These measurements supp ort the developmen t and ev aluation of statistical and geometry-based A2G channel mo dels grounded in empirical observ ations. Mac hine Learning for Wireless Systems: The dataset supp orts training and ev aluation of machine learning mo dels for UA V-based wireless applications. The av ail- abilit y of synchronized signal measuremen ts and metadata enables data-driven approaches to tasks such as c hannel estimation and link quality prediction under realistic aerial op erating conditions. Impact of Altitude and Mobility: Measurements collected at multiple altitudes and along controlled igh t tra jecto- ries enable analysis of ho w UA V height and mobility in- uence propagation conditions and cov erage. The dataset allo ws researchers to isolate altitude- and speed-dep endent eects on channel b ehavior. W av eform and System Design Ev aluation: The raw I/Q samples and associated metadata supp ort sim ulation and ev aluation of wa veform and receiver designs under realis- tic channel conditions. These data enable assessmen t of system p erformance using experimentally captured aerial signals rather than idealized channel assumptions. V alidation of Ray-T racing and Analytical Mo dels: The dataset provides empirical reference data that can be used to v alidate and calibrate ray-tracing simulations and analytical propagation mo dels. Comparisons b et ween measured and mo deled results supp ort assessmen t of mo del accuracy in rural air-to-ground environmen ts. X. Wireless Lo calization Dataset The decreasing cost of UA V s has led to rapid adoption across sectors such as defense, precision agriculture, aerial comm unications, searc h-and-rescue, and sp ectrum moni- toring and enforcement. Ho w ever, their growing presence in tro duces new c hallenges for securit y and airspace man- agemen t, particularly as UA V activit y increases around 20 −50 −40 −30 −20 −10 0 10 20 Magnitude (dBm) Distance from Launch versus Time (m) 0 150 300 450 600 Distance calculated by GPS (a) Representativ e CIR from channel sounding exp eriment. 0 50 100 150 200 250 300 350 75 80 85 90 95 100 105 110 115 120 0 20 40 60 80 Path Loss Measurement FSPL w/ Log Normal 2Ray w/ Log Normal 3GPP RMa LoS Altitude Time (s) Path Loss (dB) Altitude (m) T akeoff Flight Landing (b) Representativ e path loss measurement from channel sounding exp eriment. Fig. 21. Representativ e results from the A2G c hannel sounding campaign using a UA V-mounted transmitter. (a) Representativ e CIR illustrating c hannel impulse response characteristics observ ed during ight. (b) Corresponding path loss measurement as a function of time, recorded at an altitude of 90 meters. critical infrastructure. Eective UA V detection and track- ing are essential to developing a secure UA V trac managemen t (UTM) ecosystem [ 69 ]. A range of studies ha ve explored the use of RF signals for UA V detec- tion, classication, localization, and tracking—including in scenarios in volving non-co operative or p otentially ma- licious drones. Among the v arious RF-based approac hes, Time Dierence of Arriv al (TDOA)—a multilateration tec hnique that estimates UA V p ositions b y measuring dierences in signal arriv al times at spatially separated sensors—has b een shown to b e particularly eective for passiv e RF sensing and UA V lo calization [ 70 ], [ 71 ]. T o supp ort further research, this section in tro duces tw o UA V lo calization and tracking datasets collected using the AERP A W testb ed platform, providing researc hers with v aluable resources for ev aluating TDO A-based tracking metho ds in real-w orld scenarios. A. Description of Hardware and Softw are UA V ight exp erimen ts were conducted in AERP A W’s con trolled en vironment to generate b oth datasets, using Keysigh t N6841A RF sensors to collect TDO A measure- men ts. The N6841A (Fig. 22a ) is capable of detecting, recording, and precisely time-stamping RF signals across a frequency range of 20 MHz to 6 GHz, with a maximum bandwidth of 20 MHz. Equipp ed with a broadband om- nidirectional antenna and GPS-based timestamping, the system uses Keysight’s N6854A Geolo cation Softw are and Sensor Management T o ol to support TDO A, RSS, and h ybrid localization methods for tracking RF sources within 21 (a) Keysigh t N6841A RF sensor deplo yed on AERP A W tow er L W3. (b) AERP A W UA V with SDR p ortable node. (c) AERP A W’s L WRFL and RF sensor tow er lo cations at L W2, L W3, L W4, L W5. Fig. 22. Overview of the AERP A W testb ed showing the RF sensor, UA V no de, and L WRFL site lay out. (a) Keysight N6841A RF sensor deploy ed on AERP A W to w er L W3, (b) AERP A W UA V with SDR portable no de, and (c) AERP A W’s L WRFL and RF sensor to wer locations at L W2, L W3, L W4, L W5. appro ximately a 2 km radius. Ho wev er, the softw are is limited to 2D lo calization and do es not estimate altitude. Fig. 22c sho ws the deplo yment of these sensors at the L WRFL, where a single N6841A unit is mounted on eac h of the four to w ers lab eled L W2 through L W5, approximately 10 meters ab o v e ground level. The sensors are deploy ed in a rural environmen t with mixed LoS conditions due to tree co ver and building obstructions. All RF sen- sors within AERP A W are synchronized using a shared GPS-disciplined clo ck infrastructure and op erate on the same lo cal netw ork, with individual IP addresses assigned within a common subnet. Cen tralized management via the Keysigh t Geolo cation Server ensures netw ork-lev el time sync hronization, whic h is essential for accurate TDOA- based lo calization. During exp erimen ts, the N6841A units capture I/Q data from RF signals, whic h are subsequently pro cessed to estimate UA V p ositions. How ever, the sp e- cic algorithms used for TDO A extraction and position estimation are proprietary to Keysight and not publicly a v ailable. In our previous work [ 46 ], a 3.32 GHz channel sounding w av eform was transmitted from a UA V-mounted SDR (Fig. 22c ), and the RF sensors lo calized the UA V along m ultiple rep eated tra jectories. The dataset asso ciated with this study is publicly av ailable at [ 45 ]. In a separate study [ 72 ], TDOA-based lo calization was p erformed using do wnlink control signals from a DJI Inspire 2 UA V op er- ating in the 2.400–2.483 GHz ISM band with a 20 MHz bandwidth. The dataset corresp onding to this exp eriment is also publicly av ailable at [ 73 ]. B. Dataset F ormat The TDOA-based UA V lo calization datasets asso ciated with [ 45 ], [ 46 ] provide time-synchronized lo calization esti- mates and p erformance metrics collected during multiple UA V ight exp eriments on the AERP A W platform. Each dataset corresp onds to an individual igh t conducted at a sp ecied altitude and signal bandwidth, enabling con- trolled ev aluation of TDOA lo calization accuracy under v arying propagation conditions. F or eac h ight, the dataset records estimated UA V p ositions together with ground-truth co ordinates, cen ter frequency information, timestamps, and lo calization per- formance indicators. These indicators include correlation- based metrics and error statistics that quantify localiza- tion accuracy relative to known ground truth. In addition, the datasets include binary indicators describing LoS or NLoS conditions b etw een the UA V transmitter and m ultiple AERP A W RF sensor to w ers, enabling analysis of the impact of propagation conditions on localization p erformance. A related set of TDOA lo calization datasets rep orted in [ 72 ], [ 73 ] follo ws a similar structure but diers in the representation of LoS information and the separation of measurement and ground-truth data. T ogether, these datasets supp ort b enc hmarking of TDOA lo calization algorithms, ev aluation of LoS/NLoS eects, and compar- ativ e studies across exp erimental congurations. The datasets are released in structured CSV format, along with auxiliary pro cessing to ols to supp ort visualiza- tion and p erformance ev aluation. Detailed le inv entories, CSV eld descriptions, and help er script information are pro vided in App endix A . C. Represen tative Results Represen tativ e examples from the collected datasets are presen ted in this section to demonstrate typical lo caliza- tion b eha vior and c haracteristics. Fig. 23a illustrates the UA V’s 40-meter altitude tra- jectory o verlaid on the L WRFL site map, sho wing LoS conditions relative to three RF sensor to wers (L W2, L W3, and L W4), whic h are indicated by green triangles. The tra jectory is color-co ded based on v e distinct LoS scenarios, where eac h case indicates LoS or NLoS status 22 (a) UA V tra jectory at 40 meter altitude color-co ded by LoS conditions to tow ers L W2-4. (b) Ground truth UA V tra jectory color-co ded by lo calization error. Fig. 23. UA V tra jectory and lo calization p erformance at 40 m altitude. (a) UA V ight tra jectory color-co ded by LoS visibility to cellular tow ers L W2 through L W4, based on geometry and terrain data. (b) Ground truth tra jectory of the UA V color-co ded by the magnitude of lo calization error, highlighting spatial v ariation in positioning accuracy . relativ e to the three tow ers. F or example, Case 1 (green) represen ts segmen ts where the UA V maintained LoS to all three to wers, while Case 5 (purple) corresponds to areas where only L W3 maintained LoS. The color-co ding of the tra jectory clearly highlights frequen t transitions b et ween LoS conditions as the UA V mov es through the eld, illus- trating the mixed LoS/NLoS environmen t c haracteristic of the L WRFL site. A k ey takea wa y from this gure is that LoS a v ailability v aries substantially along the trajectory , ev en at a xed altitude, leading to p osition-dep enden t measuremen t qualit y for TDOA-based lo calization. Fig. 23b presen ts a color-co ded visualization of lo- calization error along the UA V’s tra jectory . Eac h p oin t represen ts a ground truth UA V p osition, with circles indicating the corresponding lo calization error relative to the nearest estimated coordinate. Green circles mark lo cations where the p osition error is less than 100 meters, while red circles identify p oin ts where the error exceeds 100 meters. Blue triangles indicate the lo cations of the RF sensor tow ers used for TDOA-based lo calization. As shown in the gure, the ma jority of the tra jectory is asso ciated with lo w lo calization error (green), suggesting consisten t and accurate TDOA-based position estimates along most of the UA V’s ight path. Higher error regions (red) are concentrated in sp ecic tra jectory segments that coincide with reduced LoS av ailability (due to foliage obstructions) or unfa vorable sensor geometry . T ogether, these results highlight tw o k ey observ ations: (i) reliable lo calization is achiev able across most of the tra jectory when fa vorable LoS conditions are av ailable, and (ii) lo calization p erformance degrades in predictable regions where LoS conditions or geometric dilution of precision (GDOP) are p o or. This emphasizes the strong coupling b et ween propagation conditions, sensor geometry , and lo calization accuracy in real-world environmen ts. D. P ossible Uses of Dataset The UA V TDOA lo calization datasets serv e as a v alu- able resource for adv ancing research in RF-based lo caliza- tion, UA V tracking, and passive sensing systems. Its real- w orld measurements, mixed LoS/NLoS conditions, and ground-truth references enable exploration of the follo wing researc h directions: T racking Filter Developmen t and Ev aluation: The dataset supp orts the developmen t and ev aluation of trac king lters, such as Kalman and particle lters, by pro viding real-w orld UA V trajectory and lo calization measurement sequences. These data enable state estimation studies under mixed line-of-sight and non-line-of-sight conditions. TDO A Lo calization Algorithm Benc hmarking: The dataset enables p erformance ev aluation and benchmarking of TDO A-based localization algorithms using real-w orld RF measurements. It supports direct comparison against industry-standard implementations, including Keysight- based TDO A lo calization, under mixed LoS/NLoS con- ditions. Multi-Sensor F usion: The dataset supports the develop- men t and ev aluation of multi-sensor fusion algorithms by com bining TDOA-based RF localization data with com- plemen tary sensing modalities. Such integration enables impro ved UA V tracking and state estimation in complex propagation environmen ts. Non-Line-of-Sigh t Mo deling and Analysis: The dataset enables characterization and mo deling of NLoS eects by pro viding real-world lo calization errors alongside explicit LoS/NLoS lab els. These data supp ort studies on NLoS de- tection, mitigation strategies, and bias-aw are lo calization tec hniques. CRLB Mo deling and V alidation: The dataset supp orts theoretical p erformance analysis through CRLB mo deling and enables empirical v alidation by comparing theoretical b ounds against measured TDOA-based lo calization errors under v arying sensor geometries and environmen tal con- ditions. 23 Fig. 24. AF AR Challenge setup highlighting the UA V ight zone (blue) and the designated area where the UGV could b e hidden (green). The UA V used during the exp erimen t is shown in Fig. 22 . T ogether, these research directions highlight the dataset’s v alue as a resource for adv ancing localization, trac king, and sensing tec hnologies in real-world UA V applications. XI. UA V-collected RSS Measurements for RF Source Lo calization The AERP A W Find A Ro v er (AF AR) Challenge [ 74 ] w as a national-level comp etition designed to promote researc h in UA V-assisted RF lo calization. Organized under the AERP A W testbed, the challenge aimed to accelerate inno v ation by providing a standardized exp erimental en- vironmen t for ev aluating RF lo calization algorithms using UA V s. In this competition, UA V s were deploy ed to lo cate an RF-emitting unmanned ground vehicle (UGV) based solely on signal measurements. In the AF AR Challenge, the UGV could b e placed anywhere within a designated searc h area (marked in green in Fig. 24 ), while the UA V w as restricted to y in the igh t zone (mark ed in blue in Fig. 24 ). T eams w ere free to design either autonomous or xed wa yp oin t-based UA V tra jectories to lo cate the UGV, with ight constrain ts of 20-110 meters altitude and sp eeds up to 10 m/s. The challenge consisted of tw o phases: dev elopment in a DT environmen t, and deploymen t in a real-w orld testb ed at L WRFL, NC, as detailed in [ 50 ]. Eac h of the v e nalist univ ersity teams independently devised UA V igh t tra jectories and lo calization algorithms as part of the comp etition. A. Description of Hardware and Softw are The AF AR dataset includes data collected from b oth a DT sim ulation en vironment and a real-w orld wireless testb ed, b oth deploy ed via the AERP A W platform. Eac h exp erimen tal run inv olved a UA V serving as the receiv er and a UGV op erating as the RF signal transmitter. The UA V and UGV w ere equipped with p ortable SDR no des based on the USRP B205mini. Eac h SDR was connected to an Intel NUC 10 mini- PC equipp ed with an i7-10710U pro cessor, 64 GB of RAM, and a 1 TB SSD, enabling real-time onboard signal pro cessing. T ransmissions employ ed a GNU Radio- based channel sounder that generated a pseudo-random bit sequence (PRBS) of length 4095 using a degree-12 Galois LFSR. The sequence was pulse-shap ed using a ro ot- raised cosine lter and transmitted at a 2 MHz sampling rate ov er 3.0–4.2 GHz using a wideband antenna. At the receiv er, frequency oset correction and correlation with the original PRBS enabled extraction of the CIR, from whic h RSS and received signal quality (RSQ) v alues were deriv ed. The DT environmen t mirrored the physical setup using con tainerized softw are emulation. A virtual USRP (V- USRP) and a c hannel em ulator VM (CHEM-VM) sim- ulated RF propagation based on real-time UA V-UGV p osition up dates. Exp erimen t logic ran in Exp eriment VMs (E-VMs), and UA V mobility was emulated using Soft ware-In-The-Loop (SITL) vehicles, all orchestrated through AERP A W’s geofencing and control interfaces. B. Dataset F ormat The AF AR c hallenge dataset is organized to reect the structure of the UA V-based RF source lo calization exp erimen ts conducted during the comp etition. Data w ere collected from ve nalist teams across three distinct UGV transmitter placements and tw o environmen ts, namely a DT simulation and the real-world AERP A W testb ed. This results in a total of 30 experimental scenarios, enabling systematic ev aluation of lo calization p erformance across teams, environmen ts, and deploymen t congurations. F or eac h exp eriment, the dataset includes time- sync hronized received signal measurements, signal quality indicators, and UA V navigation data, allowing join t analy- sis of RF observ ables and UA V motion. The measuremen ts capture b oth RSS and RSQ, together with precise times- tamps and UA V state information, supp orting tra jectory- a ware lo calization and algorithm b enc hmarking. The dataset structure supp orts comparative analysis b et ween simulated and real-w orld en vironmen ts, as w ell as cross-team and cross-lo cation ev aluation. All data are released in structured, machine-readable formats suitable for statistical analysis, visualization, and mac hine learning w orkows. Detailed directory organization, le inv ento- ries, log formats, and example data snipp ets are provided in App endix A . C. Represen tative Results The AF AR dataset reects diverse RF and mobility dy- namics, with teams emplo ying distinct UA V tra jectories- three teams using autonomous tra jectories and tw o adopt- ing xed wa yp oint tra jectories. Example tra jectories for T eam-300 (autonomous) and T eam-309 (xed) are sho wn for comparison in Fig. 25 . The measurements in the AF AR dataset exhibit consid- erable v ariability resulting from dierences in UA V tra jec- tories, UGV placements, and environmen t-sp ecic propa- gation eects. KPIs such as RSS, RSQ, and UA V motion 24 -78.7 -78.699 -78.698 -78.697 -78.696 Longitude 35.7265 35.727 35.7275 35.728 35.7285 35.729 35.7295 Latitude UAV trajectory UGV location (a) Autonomous tra jectory . -78.7 -78.699 -78.698 -78.697 -78.696 Longitude 35.727 35.7275 35.728 35.7285 35.729 35.7295 Latitude UAV trajectory UGV location (b) Fixed wa ypoint tra jectory . Fig. 25. Comparison of UA V trajectories: autonomous (T eam-300) vs. xed wa ypoint (T eam-309). parameters (e.g., sp eed and altitude) v ary signicantly across lo cations. F or instance, the UA V sp eed and altitude prole for T eam-309, who employ ed a xed w aypoint tra jectory , are sho wn in Fig. 26a . As the UA V approac hes eac h w aypoint, its speed increases, then decreases upon arriv al, b efore accelerating again to ward the next target. This cyclical sp eed pattern is characteristic of wa yp oint- based navigation. Additionally , the UA V main tains a relativ ely constant altitude of approximately 30 meters throughout the mission. Fig. 26b presents RSS heatmaps ov erlaid on the UA V igh t paths. The diamond marker indicates the RF source lo cation. As exp ected, RSS is strongest when the UA V is in close proximit y to the source and weak ens with increasing distance. Ho w ev er, the spatial distribution of receiv ed p ow er is not uniform, reecting the inuence of m ultipath and shadowing ee cts. T o highlight the contrast b etw een simulated and real- w orld signal b ehavior, Fig. 26c plots RSS and distance against time for both DT and real-world environmen ts. In the DT en vironment, RSS remains relativ ely smooth and predictable. In contrast, the real-world data ex- hibits signican t uctuations, ev en at similar distances, due to dynamic factors suc h as fading, b o dy blo ckage, and environmen tal clutter. This discrepancy underscores the imp ortance of accoun ting for real-w orld propagation eects when developing and v alidating RF lo calization algorithms. D. P ossible Uses of Dataset The AF AR dataset serv es as a comprehensive resource for adv ancing researc h in wireless communications, RF- based localization, and UA V-enabled signal in telligence. Its rich conten t and dual-environmen t structure (DT and real-w orld) enable the following researc h directions: A2G Channel Propagation Mo deling: The dataset enables realistic modeling of A2G wireless channels, accounting for UA V-sp ecic factors suc h as altitude, elev ation/azimuth angles, v elo city , and orientation (roll, pitc h, ya w). These measuremen ts help characterize the propagation environ- men t under mobility and elev ation diversit y [ 48 ]. An tenna Gain and Shadowing Analysis: The dataset facil- itates the ev aluation of directional antenna performance and gain v ariations due to UA V-b o dy shadowing. This is particularly relev ant for understanding signal attenuation in NLoS conditions and UA V maneuvers. P erformance Benchmarking: Researchers can perform comparativ e analysis of UA V-assisted RF localization algorithms. The dataset allows assessmen t of trajectory eciency , signal quality , and ov erall lo calization accuracy under controlled and real-world constraints. Data-Driv en Lo calization Algorithms: The time- sync hronized RF and p ositional data provide a robust basis for training and ev aluating machine learning mo dels for RF source lo calization, including regression, classication, or hybrid approaches. Signal Strength and F ading Prediction: Deep learning mo dels can b e trained to forecast RSS/RSQ v alues under v arying mobility conditions. This supp orts proactive plan- ning in UA V-assisted sensing and comm unication tasks. Fligh t Path Optimization: Using the dataset, UA V tra jec- tories can b e optimized for b etter link reliability , minimal energy use, or improv ed lo calization precision, either via reinforcemen t learning or optimization-based tec hniques. Sim ulation-to-Reality T ransfer Learning: The paired DT and real-w orld measuremen ts enable transfer learning strategies that impro v e mo del robustness across synthetic and physical environmen ts. In summary , the AF AR dataset bridges multiple disci- plines, oering a repro ducible platform to study wireless lo calization, adaptive mobilit y strategies, and signal-aw are autonom y in UA V net w orks. XI I. UA V Signal Classication Dataset In recen t times, malicious UA V s hav e b ecome a global threat to so ciety . Even in mo dern warfare, the use of UA V s has altered the dynamics of traditional military op erations, providing strategic adv an tages to state actors as well as established military forces. Besides, low cost, lo w altitude and low sp eed consumer UA V s (or micro- UA V s) p ose a unique threat to b oth military assets and civilians. As a result, researchers hav e b een in vestigating dieren t techniques for UA V identication. Some of these tec hniques include RF, radars, computer vision (optical and infra-red cameras), high-energy lasers, and acoustic tec hniques [ 75 ], [ 76 ]. Each of these techniques has its own adv an tages and c hallenges. T o ac hieve long range detection, identication, and impro ved lo calization of a wide-range of UA V s, RF- based techniques are commonly preferred. In addition, RF-based techniques for detecting and identifying UA V s can op erate in all weather conditions. As a result, UA V detection, identication (classication), and neutralization using RF-based electronic w arfare (EW) and signals in- telligence (SIGINT) systems are b ecoming p opular. These tec hniques exploit electromagnetic sp ectrum or directed energy to detect, iden tify , and interdict an incoming drone. Consequently , these systems are comparativ ely more eective than alternative detection approac hes (e.g. camera and acoustics) b ecause they can op erate in all w eather conditions and achiev e long detection ranges [ 75 ]. Ho wev er, due to the ubiquitousness of electronics and 25 0 200 400 600 800 1000 Time (s) 0 2 4 6 8 10 Speed (m/s) 0 10 20 30 40 50 Altitude (m) Exp-309 (Wolfpack) (a) UA V altitude and sp eed ov er time. (b) RSS ov er the UA V tra jectory . 0 200 400 600 800 Time (s) -80 -60 -40 -20 0 20 Power (dBm) 50 100 150 200 250 300 350 Distance (m) Exp-309 (Wolfpack) Real-world Digital Twin Distance (c) DT vs. real-world RSS and distance versus time. Fig. 26. Representativ e signal and mobility characteristics from the AF AR dataset for the team W olfpac k. (a) UA V altitude and speed ov er time, (b) RSS ov er the UA V tra jectory , and (c) DT vs. real-world RSS and distance versus time. Dr one High-r esolution oscillosc ope Cap tur ed w a v e f orm Dr one r emot e c on tr oller Fig. 27. The experimental setup for detecting and capturing RF signals from UA V controllers. The input of the receiver has an LAN, a bandpass lter and a parabolic antenna receiver. comm unication systems, esp ecially in the ISM band in urban cen ters, it could b e dicult to accurately detect and iden tify sp ecic UA V signals in the presence of inten tional jammers and non-inten tional EM radiators/in terference. T o mitigate this issue, researchers at AERP A W recognized the need to dev elop a dataset of unique UA V RF signals extracted from p opular commercial UA V s. This dataset could b e used to develop signal pro cessing algorithms and mac hine learning mo dels that can improv e the detection and identication of sp ecic consumer UA V s in the pres- ence of interference. A. Description of Hardware and Softw are F or the data collection, we designed a simple passiv e RF surv eillance receiver that contin uously listens to RF signals in the environmen t and sav es the data for further pro cessing. The RF signals captured are time-v arying mo dulated signals from p opular commercial UA V con- trollers. The exp erimental setup is shown in Fig. 27 . In the gure, a 24 dBi parabolic an tenna op erating in the 2.4 GHz ISM band listens to RF signals from UA V controllers, whic h are used to send control and navigation commands to an incoming UA V. A high-gain parab olic antenna is used to extend the receiver co verage range. The output signal from the antenna is fed to the receiver through an RF chain that combines a LNA and an RF bandpass lter. The LNA amplies weak signals, while the bandpass lter ensures the input signal is band-limited to preven t receiver saturation and nonlinear distortion. F or the exp eriment, the receiver is a high-resolution mixed signal Keysight oscilloscop e (6 GHz Keysight MSOS604A) capable of sampling the captured signal at 20 GSa/s. This high sampling rate ensures the detection system captures all the transient features or ngerprints of the captured UA V RF controller signals. Also, within the receiver in Fig. 27 , there is a custom MA TLAB script for signal detection, data prepro cessing and transformation of the raw signal. Fig. 28 shows samples of UA V RF remote controller (R C) signals and UA V emitted signals captured using the detection systems in Fig. 27 [ 52 ]. B. Dataset F ormat The UA V signal classication dataset comprises RF recordings from 17 commercial UA V con trollers (15 of which are unique) manufactured by eight dier- en t vendors, including DJI, F utaba, Hobb y King, and T urnigy [ 51 ]. The dataset captures controller-specic RF signatures transmitted in the 2.4 GHz ISM band and is designed to supp ort detection, identication, and clas- sication of UA V con trol signals under v arying SNR conditions. Eac h RF signal category in the dataset is associated with metadata describing the UA V controller type, man- ufacturer, and acquisition parameters. This metadata enables systematic benchmarking of RF-based UA V detec- tion and classication algorithms, as w ell as comparative studies across controller types and in terference conditions. Represen tative examples of dataset usage for detection and classication tasks are shown in Fig. 29 . T o facilitate repro ducible research, the dataset is re- leased together with supp orting softw are utilities that enable extraction of RF samples and asso ciated meta- data, as well as the construction of custom datasets for 26 0 0.5 1 1.5 2 2.5 Time (s) 10 -4 -0.2 -0.1 0 0.1 0.2 Amplitude (Volts) (a) Graupner MC-32 0 0.5 1 1.5 2 2.5 Time (s) 10 -4 -0.2 -0.1 0 0.1 0.2 Amplitude (Volts) (b) Sp ektrum DX6e 0 0.5 1 1.5 2 2.5 Time (s) 10 -4 -0.2 -0.1 0 0.1 0.2 Amplitude (Volts) (c) F utaba T8FG 0 0.5 1 1.5 2 2.5 Time (s) 10 -4 -0.2 -0.1 0 0.1 0.2 Amplitude (Volts) (d) DJI Phantom 4 Pro 0 0.5 1 1.5 2 2.5 Time (s) 10 -4 -0.2 -0.1 0 0.1 0.2 Amplitude (Volts) (e) DJI Inspire 1 Pro 0 0.5 1 1.5 2 2.5 Time (s) 10 -4 -0.2 -0.1 0 0.1 0.2 Amplitude (Volts) (f) JR X9303 0 0.5 1 1.5 2 2.5 Time (s) 10 -4 -0.2 -0.1 0 0.1 0.2 Amplitude (Volts) (g) Jeti Duplex DC-16 0 0.5 1 1.5 2 2.5 Time (s) 10 -4 -0.2 -0.1 0 0.1 0.2 Amplitude (Volts) (h) FlySky FS-T6 0 0.5 1 1.5 2 2.5 Time (s) 10 -4 -0.2 -0.1 0 0.1 0.2 Amplitude (Volts) (i) DJI Matrice 600 UA V 0 0.5 1 1.5 2 2.5 Time (s) 10 -4 -0.2 -0.1 0 0.1 0.2 Amplitude (Volts) (j) DJI Phantom 4 Pro UA V 0 0.5 1 1.5 2 2.5 Time (s) 10 -4 -0.2 -0.1 0 0.1 0.2 Amplitude (Volts) (k) DJI Inspire 1 Pro UA V 0 0.5 1 1.5 2 2.5 Time (s) 10 -4 -0.2 -0.1 0 0.1 0.2 Amplitude (Volts) (l) DJI Mavic Pro UA V Fig. 28. This sho ws a sample of RF signal captured from eigh t dierent UA V con trollers and four dieren t UA V s while on igh t: (a) Graupner MC-32, (b) Sp ektrum DX6e, (c) F utaba T8FG, (d) DJI Phantom 4 Pro, (e) DJI Inspire 1 Pro, (f ) JR X9303, (g) Jeti Duplex DC-16, (h) FlySky FS-T6, (i) DJI Matrice 600 UA V, (j) DJI Phantom 4 Pro UA V, (k) DJI Inspire 1 Pro UA V, (l) DJI Mavic Pro. Repro duced from [ 52 ], licensed under CC BY 4.0. algorithm ev aluation. These to ols allow researchers to assem ble controller-specic or mixed datasets tailored to sup ervised learning, feature extraction, and classication exp erimen ts. Detailed descriptions of dataset organization, metadata elds, and soft ware utilities are provided in App endix A . C. Represen tative Results The UAS signal classication dataset has b een used to v alidate several UA V detection and classication algo- rithms. The results from these works ha ve b een published in the literature [ 52 ], [ 53 ], [ 77 ]. In [ 53 ], the authors de- scrib ed a process for detecting and identifying Micro-UA V s using data extracted from the UAS signal classication dataset. The detection phase is based on the naïv e Bay es approac h using Marko v mo dels. Once the UA V signals ha ve b een detected, the identit y of the UA V is determined (or classied) using classical machine learning algorithms. The authors show ed that using features selection tech- niques such as neighborho o d comp onent analysis (NCA), the kNN machine learning algorithm achiev ed the highest classication accuracy of 96.3% at an SNR of 25 dB. In addition, the study show ed that as the SNR reduces, sim ulating a drone moving farther aw ay from the detection system, the detection and classication of the mac hine learning algorithms reduces. The limitation of this study is the absence of in terference signal from the en vironment. In [ 52 ], the authors extended the study in [ 53 ] to include the presence of wireless interference signals from Wi-Fi and Blueto oth enabled devices. Fig. 29 shows the p erformance of the detection and classication system as a function of the SNR. F rom Fig. 28a , we see that for a xed false alarm rate (F AR), increasing the detection threshold ( δ ) will reduce the detection accuracy . Also, from Fig. 28b , w e see that the accuracy of the classication system dep ends on the machine learning mo del deploy ed, the SNR, and the num b er of UA V classes in the database. Once again, the study shows that it is p ossible to achiev e an accuracy of 98.13% in classifying 15 dierent UA V controllers using classical mac hine learning mo dels like kNN and random forest. In [ 77 ], the authors inv estigated the impact of using the conv olutional neural netw ork (CNN) to clas- sify/iden tify UA V RF controller signals. The CNN mo dels are trained using sp ectrogram images representation of the ra w UA V controller RF signals. The CNN mo del ac hiev ed an accuracy of ab out 92%. D. P ossible Uses of Dataset Our UAS signal classication dataset can b e used for man y practical applications. They include the following: 27 -10 -8 -6 -4 -2 0 2 4 6 8 10 12 14 16 18 20 22 24 SNR (dB) 0 10 20 30 40 50 60 70 80 90 100 Detection Accuracy (%) =0.1 (FAR = 100%) =0.5 (FAR = 75.8%) =1.1 (FAR = 14.8%) =1.5 (FAR = 10.2%) =2.1 (FAR = 5.6%) =2.5 (FAR = 3.2%) =3.1 (FAR =3.0%) =3.5 (FAR = 2.8%) =4.1 (FAR = 2.6%) =15 (FAR =1.01%) =20 (FAR = 0.61%) [3.1 ,4.1 ] Increasing [15 ,20 ] [1.1 ,2.5 ] [3.1 ,4.1 ] (a) 25 20 15 10 5 0 SNR (dB) 30 40 50 60 70 80 90 100 Classification Accuracy (%) kNN-15 kNN-17 DA-15 DA-17 RandomF-15 RandomF-17 (b) Fig. 29. Representation Result for UA V Detection and Classication Using the UAS signal classication dataset: (a) The p erformance of the prop osed detection systems as a function of the SNR, the detection threshold ( δ ), and the xed F AR, (b) The p erformance of the ML-based mo del as a function of the SNR, the num b er of UA V RF controller signal category extracted from the UAS signal classication dataset. Repro duced from [ 52 ], licensed under CC BY 4.0. Benc hmarking Detection and Classication Algorithms: The dataset supp orts b enchmarking of UA V RF detection and classication algorithms against classical and learning- based approaches under consistent measurement condi- tions. Because the RF signals are captured in a controlled en vironment, the dataset enables comparativ e ev aluation of algorithm p erformance as functions of noise lev el and an tenna temperature. Impact of Inten tional and Unin tentional Interference: The dataset enables inv estigation of the impact of b oth in tentional interference, suc h as jamming signals, and unin tentional radiators on UA V RF detection and clas- sication p erformance. As demonstrated in [ 52 ], the data can b e used to study in-band and out-of-band interference from technologies such as Wi-Fi, BLE, Zigbee, and other common emitters, s upporting electromagnetic compatibil- it y analysis in shared unlicensed sp ectrum. Syn thetic UA V RF Dataset Generation: The dataset supp orts generation of synthetic UA V RF signals using data-driv en tec hniques suc h as generative adversarial net- w orks and v ariational auto enco ders. It can also serve as input for data augmentation, statistical mo deling, and Mon te Carlo simulation metho ds, enabling the creation of expanded training datasets to impro ve model robustness and generalization. XI II. UA V T ra jectory , RSRP , and Throughput Dataset in Emulated and Simulated Environmen ts UA V igh t path, including throughput and RSRP measuremen ts, is crucial to developing, exp erimenting with, and ev aluating next-generation wireless netw orks and DT solutions. The provided datasets capture critical A2G propagation and link c haracteristics as a function of tra jectory , as w ell as interactions with em ulated and sim ulated en vironments. The adv antage of the emulation en vironment is that it executes the same softw are and proto col stack used in real-w orld testb eds, running on SDR-based radios and UA V platforms. Ho wev er, it can b e relatively slow and computationally intensiv e for de- v elopment purp oses. In con trast, sim ulation abstractions accelerate the design and testing of UAS and radio algorithms that can subsequently b e deploy ed in emulation and real-world testb eds, though this comes at the exp ense of reduced realism. A. Description of Hardware and Softw are The measurements were obtained through a com bi- nation of MA TLAB sim ulation and DT em ulation [ 56 ], utilizing AERP A W’s cutting-edge exp erimental facilities at Lak e Wheeler eld. The UA V testb ed includes an L TE SISO radio-equipp ed UA V, GPS receivers, and igh t con trollers that ensure accurate tra jectory tracking. Field exp erimen ts were conducted in the Lake Wheeler area, where high-delity RSRP measurements were collected from four BSs (L W1-L W4). A MA TLAB-based simulation environmen t was devel- op ed to mo del UA V ights in virtual settings, with eld measuremen ts used for v alidation. The AERP A W DT further supp orts emulation of UA V-to-base-station com- m unications, oering parameterized control o v er mobility patterns, radio environmen ts, and netw ork conditions. Custom MA TLAB and Python scripts are provided for data pro cessing, analysis, and visualization. The dataset and associated pro cessing and simulation co de are publicly a v ailable at [ 54 ], [ 55 ]. B. Dataset F ormat This dataset provides tra jectory-a w are radio p erfor- mance measuremen ts for UA V-assisted cellular systems, 28 com bining emulated and simulated data to enable sys- tematic comparison of link b ehavior under con trolled mobilit y patterns. It includes RSRP , SNR, throughput, and UA V state information collected along b oth xed and autonomous UA V tra jectories. Three complemen tary categories of measuremen ts are included: em ulated RSRP measurements along predened UA V tra jectories, sim ulated RSRP measuremen ts along the same xed tra jectories as used in the emulation en- vironmen t, and the RSRP measurements for autonomous UA V tra jectories while maintaining the geofencing con- strain ts. F or all categories, the dataset records time- sync hronized UA V p osition (latitude, longitude, altitude) together with the RSRP measurements. The dataset is released in structured CSV format suitable for statistical analysis, visualization, and machine learning applications. It supp orts comparativ e ev aluation of emulation and sim ulation delit y , as well as in vestiga- tion of trajectory design for co verage analysis and through- put ev aluation. Detailed directory organization, CSV eld denitions, and post-pro cessing scripts used to generate the rep orted results are do cumen ted in App endix A . C. Represen tative Results The representativ e results for emulation and simulation measuremen ts and the impact of tra jectory design are discussed in Figs. 30 and 31 , resp ectively . Fig. 30 presen ts em ulation-based RSRP measuremen ts along the xed UA V tra jectory with resp ect to four base stations (L W1– L W4). As exp ected, stronger signal lev els are observed when the UA V is closer to a BS. F or example, Fig. 30a sho ws higher RSRP v alues near L W1, whic h can be attributed to the short distance and the absence of signican t obstructions such as trees, compared to other BSs. In [ 56 ], we demonstrated a high similarity b et ween the simulation and emulation RSRP measurements. Fig. 31 sho ws the simulated RSRP measurement for an autonomous UA V tra jectory with resp ect to individual BSs. Strong RSRP levels are observed near L W1, L W2, and L W3 as the UA V tra jectory passes close to these BSs. In contrast, low er RSRP v alues are observed for L W4, since the UA V remains farther aw ay and is re- stricted from approaching L W4 due to geofencing con- strain ts. Additional trajectory details for both xed and autonomous cases, along with complementary results such as distance-versus-RSRP and throughput measuremen ts, are presented in [ 56 ]. D. P ossible Uses of Dataset This dataset can be used for the follo wing researc h tasks: Sim ulation and Digital T win Calibration: The dataset sup- p orts calibration, v alidation, and tuning of simulation and em ulation environmen ts by enabling direct comparison b et ween emulated, simulated, and eld-measured data. Suc h comparisons allow researc hers to assess the delity of digital twin and net w ork emulation platforms and improv e their predictive accuracy for real-world UA V deplo ymen ts. A2G Propagation and Cov erage Analysis: The dataset enables empirical analysis of air-to-ground signal prop- agation, including the impact of altitude, tra jectory , and en vironment on RSRP , SNR, and throughput. These measuremen ts supp ort the construction and calibration of A2G path loss mo dels, spatial radio maps, and t wo- dimensional and three-dimensional cov erage representa- tions along complex UA V ight paths. T ra jectory-A ware Algorithm Ev aluation: The av ailability of emulated and simulated UA V tra jectory data supp orts the dev elopment and b enchmarking of tra jectory-a ware al- gorithms, including path planning, handov er management, and resource allo cation strategies. By coupling mobility information with measured and emulated signal metrics, researc hers can ev aluate algorithm p erformance under realistic aerial op erating conditions. Mac hine Learning for Link Quality Prediction: The dataset supp orts data-driv en mo deling of link quality b y enabling training and ev aluation of machine learning mo dels that predict RSRP or throughput using spatial, en vironmental, and mobility-related features. Suc h mo dels can b e used to complement analytical propagation ap- proac hes and inform adaptive UA V netw orking strategies. XIV. Ra y T racing Simulation and Measurement Comparison Dataset In this section, we presen t a dataset that enables direct comparison b et ween ray tracing (R T) simulation and real- w orld measuremen t of RSS measured at the AERP A W testb ed. The dataset includes UA V tra jectory and altitude information, and RSS data collected at eac h to wer. T o in vestigate realistic propagation c haracteristics in the R T sim ulation, w e implement forest areas with a simple tree mo del and also incorp orate geographical information, including buildings. A. Description of Hardware and Softw are The predened tra jectory and altitude ov er time of the UA V are demonstrated in Fig. 32 . The UA V tak es o near the L W1 to wer. After tak eo, the UA V sweeps L W2 and L W3 tow ers. The UA V returns to L W1 and lands on the ground. Each wa yp oin t of the tra jectory is highligh ted with a letter, which corresponds to vertical lines in Fig. 32b , and the blue horizontal arrows b etw een the vertical lines highligh t the ho vering duration at each w aypoint. The UA V and L W tow ers hav e SISO antenna setups with 3 . 3 GHz carrier frequency . The RSS is recorded b y a dual-channel USRP B210 and GNU Radio at eac h tow er while the UA V transmits signals. The RSS is measured for 20 ms for every 100 ms interv als. F or the R T, NVIDIA Sionna [ 78 ] is used with support of the Op en Street Map (OSM) database [ 79 ] for geo- graphic and building information and Blender [ 80 ] for 3D mo deling. T o consider the realistic eects of the trees in the L WRFL areas, we implement a simple tree mo del and p opulate it in the Lake Wheeler area, as shown in Fig. 2 of [ 58 ]. W e adopt predened material settings 29 -78.7 -78.696 - 7 8.692 Longitude 35.726 35.728 35.73 35.732 Latitude LW1 LW2 LW3 LW4 -70 -60 -50 RSRP (dBm) UAV is close to LW1 Stronger RSRP (a) -78.7 -78.696 - 7 8.692 Longitude 35.726 35.728 35.73 35.732 Latitude LW1 LW2 LW3 LW4 -70 -60 -50 RSRP (dBm) Weaker RSRP (b) -78.7 -78.696 - 7 8.692 Longitude 35.726 35.728 35.73 35.732 Latitude LW1 LW2 LW3 LW4 -70 -60 -50 RSRP (dBm) Weaker RSRP (c) -78.7 -78.696 - 7 8.692 Longitude 35.726 35.728 35.73 35.732 Latitude LW1 LW2 LW3 LW4 -70 -60 -50 RSRP (dBm) Weaker RSRP UAV is far away from LW4 (d) Fig. 30. RSRP measurement with resp ect to (a) L W1, (b) L W2, (c) L W3, and (d) L W4 for xed tra jectory in emulation. -78.7 -78. 696 -78.692 Longitude 35.726 35.728 35.73 35.732 Latitude LW1 LW2 LW3 LW4 -80 -70 -60 RSRP (dBm) UAV is close to LW1 weak strong (a) -78.7 -78. 696 -78.692 Longitude 35.726 35.728 35.73 35.732 Latitude LW1 LW2 LW3 LW4 -80 -70 -60 RSRP (dBm) UAV is close to LW2 strong weak (b) -78.7 -78. 696 -78.692 Longitude 35.726 35.728 35.73 35.732 Latitude LW1 LW2 LW3 LW4 -80 -70 -60 RSRP (dBm) UAV is far away from LW3 strong weak (c) -78.7 -78. 696 -78.692 Longitude 35.726 35.728 35.73 35.732 Latitude LW1 LW2 LW3 LW4 -80 -70 -60 RSRP (dBm) UAV is far away from LW4 strong weak (d) Fig. 31. RSRP measurement with resp ect to (a) L W1, (b) L W2, (c) L W3, and (d) L W4 for autonomous tra jectory in simulation. for R T sim ulation from Sionna. Sp ecically , the surface materials of the buildings are set to concrete and medium dry ground, which are dened as “itu_concrete” and “itu_medium_dry_ground”, resp ectiv ely . On the other hand, a tree mo del consists of a woo den cylinder with “itu_w o o d” and a cone on top of the cylinder with custom foliage material constants, which is calculated under [ 81 ]. The R T sim ulation is conducted at each GPS co ordinate of the UA V along the predened tra jectory to allow for direct comparison with the measurement data. F or calibration purp oses, osets that hav e minimum ro ot mean squared error (RMSE) are searched within the range of [ − 50 : 50 ] dB by the unit of 0 . 1 dB. Moreov er, the altitude o ver the predened tra jectory b elo w 0 . 5 m is rounded up to 0 . 5 m for the R T simulation. B. Dataset F ormat This dataset pro vides a direct comparison b etw een measured RSS along UA V tra jectories and corresp onding R T simulation results generated using the Sionna R T framew ork. The dataset supp orts systematic ev aluation of R T mo del delit y by enabling p oint-b y-p oint comparison of simulated and measured RSS v alues across multiple base station lo cations. The released data include measured RSS collected along a predened UA V trajectory , R T-simulated propagation parameters such as path co ecien ts and delays, and cali- brated RSS results that align sim ulation outputs with real- w orld measurements. T ogether, these comp onents enable v alidation of R T-based propagation mo deling and facili- tate repro ducible b enc hmarking of simulation accuracy in aerial wireless environmen ts. The dataset is accompanied by p ost-processing utilities that support tra jectory visualization, RSS calibration, and comparison b etw een measured and sim ulated results. All data and scripts are publicly a v ailable through an op en- access rep ository [ 57 ]. Detailed le inv entories, directory structure, and script-level descriptions used to reproduce the rep orted results are provided in App endix A . C. Represen tative Results The R T sim ulation results of RSS and measurement from eac h to w er are sho wn in Fig. 33 , where Z indicates out-of-co verage area. Here, the measurements from dif- feren t antennas of the dual-channel USRP at eac h tow er are lab eled as USRP1 and USRP2, resp ectiv ely . The R T sim ulation results are consistent with the measurements at all to wer cases. Fluctuations are observed in the measuremen t ov er the trajectory due to changes in the direction (roll/y aw/pitc h) of the UA V at each wa yp oint, fading eects, and other factors. Notably , during the ho vering p erio ds highlighted by the blue arrows, the mea- suremen ts tend to show a mismatch. During the hov ering, small v ariations of orien tation can cause noticeable RSS uctuation, while the xed orien tation is assumed in the R T simulation. It is also w orth while to note that a 10 dB v ariation b etw een USRP1 and USRP2 is observed in the L W1 and L W2 cases, which are highligh ted in the gure with arro ws. This v ariation can b e attributed to LoS blo ckage and c hannel conditions due to the an tenna orien tations of USRP1 and USRP2, facing the UA V. Moreo ver, altitude-dependent out-of-cov erage areas can be found in the R T sim ulation for L W3 at low er altitudes during takeo and landing (time interv al b efore 100 s and after 850 s). Ov erall, while the R T simulations capture the large-scale trend of RSS, the hov ering interv als show that UA V orientation changes can cause RSS mismatc h. This highligh ts the need for more realistic mo deling of antenna radiation patterns and orientation to impro v e the accuracy of R T simulations. 30 0 100 200 300 400 500 600 700 800 900 x axis [m] 0 100 200 300 400 500 600 700 800 y axis [m] LW1 LW2 LW3 A B C D E F Start Hovering 52.13 s at E Hovering 60.68 s at C Hovering 60 s at B (a) T rajectory 0 100 200 300 400 500 600 700 800 900 Time [s] -5 0 5 10 15 20 25 30 35 40 45 Altitude [m] A B C D E F (b) Altitude Fig. 32. (a) T ra jectory and (b) altitude of the signal cov erage mea- surements and R T simulation. The blue horizontal arrows b et ween the v ertical lines highlight the hov ering duration of the UA V at eac h wa yp oin t. D. P ossible Uses of Dataset Giv en the R T-based RSS results and dual-c hannel USRP measured dataset at the tow ers, this dataset can b e used for the following purp oses or analysis scenarios. Benc hmarking R T Algorithms: The dataset provides RSS measuremen ts from the tow ers and simulated results from the NVIDIA Sionna R T. Thus, the dataset can b e used for v alidation and b enchmarking of dierent R T approaches b y comparing the simulation results. RF Cov erage Analysis and T ra jectory Planning: Based on a rural area with dense foliage, the dataset enables the prediction and design of reliable RF co v erage b y comparing with the desired performance requiremen ts, suc h as required SNR lev els, etc. UA V Communication Link Analysis: The dataset captures uctuation in RSS ov er the predened tra jectory , allo wing for detailed analysis of link p erformance, e.g., throughput, under realistic propagation conditions. Statistical Propagation Channel Modeling: Since the R T results include propagation delay and path co ecien t information, the dataset can b e used for propagation c hannel characterization by statistically analyzing this information. XV. Syn thesis, Impact, and Research Outlo ok This section synthesizes the broader insights, demon- strated impact, and forw ard-lo oking implications that emerge from the consolidated analysis of aerial wireless datasets presented in this work. Rather than introducing new datasets, the discussion fo cuses on what can b e learned from jointly examining existing measurements, ho w these datasets hav e already informed state-of-the- art research, and how they can guide future exp erimental design and data-driven studies. T ogether, these p ersp ec- tiv es p osition the curated datasets not only as archiv al resources, but as activ e enablers of repro ducible and impactful aerial wireless research. A. State-of-the-Art Insights from A erial Wireless Datasets By consolidating and jointly examining a broad col- lection of publicly av ailable aerial wireless datasets, this w ork provides several state-of-the-art insigh ts that are not apparen t when datasets are considered in isolation. First, the datasets collectively illustrate the increasing div ersity of aerial wireless measurement mo dalities, span- ning raw signal-level captures, p ow er-level sp ectrum mea- suremen ts, and higher-lay er k ey performance indicators. This div ersit y reects a maturation of the eld from early propagation-cen tric studies to ward cross-lay er and system- lev el ev aluation of aerial netw orks. Second, the survey ed datasets highligh t the expanding range of platforms and deplo yment scenarios used in state- of-the-art aerial wireless research, including untethered UA V s, tethered aerial platforms, ground-based sensor net works, and digital twin en vironmen ts. This breadth underscores the imp ortance of interoperable datasets that supp ort comparative analysis across platforms and envi- ronmen ts. Third, the in tegration of datasets across multiple fre- quency bands, from sub-GHz LoRaW AN to mid-band 5G and cellular sp ectrum, reveals a gro wing emphasis on m ulti-band and heterogeneous netw ork ev aluation, whic h is essential for future 5G-Adv anced and 6G aerial systems. Finally , the presence of datasets explicitly designed for mac hine learning, lo calization, and ra y-tracing v alidation reects a state-of-the-art shift tow ard data-driv en and h ybrid mo deling approaches, where empirical data, simu- lation, and learning-based metho ds are jointly employ ed. B. Researc h Enabled by AERP A W Datasets Bey ond serving as arc hiv al resources, the datasets cu- rated through AERP A W ha ve already enabled a broad range of p eer-reviewed researc h spanning wireless ar- c hitectures, A2G propagation, lo calization and sensing, 31 0 200 400 600 800 Time [s] Z -80 -70 -60 -50 -40 -30 -20 -10 0 RSS [dBm] Ray Tracing USRP1 (Calibrated) USRP2 (Calibrated) A E F C B RSS Variation D (a) L W1 0 200 400 600 800 Time [s] Z -80 -70 -60 -50 -40 -30 -20 -10 0 RSS [dBm] Ray Tracing USRP1 (Calibrated) USRP2 (Calibrated) A B C D E F RSS Variation (b) L W2 0 200 400 600 800 Time [s] Z -80 -70 -60 -50 -40 -30 -20 -10 0 RSS [dBm] Ray Tracing USRP1 (Calibrated) USRP2 (Calibrated) A B C D E F (c) L W3 Fig. 33. RSS measurement and R T simulation results with the predened trajectory for the sp ecic UA V lo cations A-F in Fig. 32 . (a) L W1, (b) L W2, and (c) L W3. The blue horizontal arro ws b et ween the vertical lines highlight the ho v ering duration of the UA V at each w a ypoint. Agreement b etw een measured and simulated RSS is lo cation dep endent, highlighting where propagation mo dels may require calibration. mac hine learning, security , and cyb er-ph ysical system orc hestration [ 82 ]–[ 84 ]. A t the ph ysical and proto col la yers, multiple stud- ies hav e leveraged AERP A W measurement datasets to c haracterize A2G cellular p erformance, including full- stac k L TE and 5G-NSA exp eriments with UA V-moun ted radios. These datasets ha ve supp orted analyses of altitude- dep enden t RSRP , SINR, and throughput b ehavior, sp ec- trum reuse opp ortunities, and the limitations of terrestrial cellular infrastructure when serving aerial users, providing empirical grounding for UA V-aw are net work design and standardization eorts [ 41 ], [ 85 ]. AERP A W datasets ha ve also b een instrumen tal in digital twin-driv en exp erimentation, enabling controlled, rep eatable studies that bridge sim ulation and eld mea- suremen ts. Sev eral works hav e utilized AERP A W’s digi- tal t win to v alidate propagation mo dels, em ulate UA V- assisted base station deplo yments, and study discrepan- cies b etw een emulated and real-w orld conditions, thereb y establishing a w orkow for dataset-informed experimen- tation prior to live ights [ 86 ]–[ 88 ]. In the area of lo calization, sensing, and data-driven optimization, AERP A W datasets hav e supp orted UA V- based RF source lo calization, tra jectory-aw are throughput optimization, and mac hine learning-assisted data collec- tion. These datasets hav e b een used b oth to b enchmark algorithmic p erformance and to train learning-based mo d- els under realistic wireless conditions, including tra jectory optimization and adaptive ho vering strategies informed by measured channel quality [ 82 ], [ 89 ]. A growing b o dy of work further demonstrates the use of AERP A W datasets in mac hine learning and securit y-fo cused studies, including federated learning- enabled anomaly detection for drone swarms and secure drone video analytics. These studies rely on realistic, distributed measurement data to ev aluate learning ac- curacy , communication ov erhead, and robustness against adv ersarial conditions, highlighting the imp ortance of repro ducible, system-level datasets for emerging AI-native aerial netw orks [ 90 ], [ 91 ]. Finally , AERP A W datasets ha v e enabled cross-domain applications, such as autonomous agricultural monitoring with RF energy-harvesting sensor tags and UA V-assisted IoT data collection. These studies illustrate how aerial wireless datasets extend b eyond comm unications research to supp ort cyb er-physical systems, precision agriculture, and edge-enabled sensing worko ws [ 92 ], [ 93 ]. Collectiv ely , these works demonstrate that AERP A W datasets already function as benchmarks, training data, and empirical v alidation to ols across multiple lay ers of the wireless stac k and application domains. This existing b ody of research underscores the practical impact of the datasets consolidated in this paper and motiv ates the need for a unied, accessible dataset descriptor to further accelerate repro ducible and data-driv en aerial wireless research. C. F uture Research Directions Enabled by A erial Wireless Datasets The in tegrated analysis of existing aerial wireless datasets highligh ts several directions for future researc h and dataset developmen t. First, there is a clear need for cross-lay er datasets that jointly capture raw signal measuremen ts, intermediate physical-la yer metrics, and higher-la yer p erformance indicators within a single, co- heren t framework. Such datasets would enable holistic ev aluation of aerial net w orks and facilitate cross-la yer optimization. Second, while current datasets span a wide range of frequency bands and platforms, future eorts would b enet from co ordinated m ulti-band and m ulti-tec hnology measuremen ts, allo wing systematic comparison across sub- GHz, mid-band, and emerging high-frequency aerial links. This is particularly relev ant as aerial comm unications ev olve tow ard heterogeneous 5G-Adv anced and 6G archi- tectures. Third, most publicly av ailable datasets are limited in temp oral scop e. Long-term and large-scale data collection, capturing seasonal, environmen tal, and mobility-induced v ariations, remains an op en challenge and an imp ortant direction for improving mo del robustness and generaliza- tion. 32 F ourth, the gro wing adoption of data-driven and ma- c hine learning-based techniques motiv ates the develop- men t of ML-ready datasets, including standardized lab el- ing, synchronized metadata, and well-documented training and ev aluation splits. Suc h design considerations w ould signican tly lo wer the barrier to reproducible and com- parativ e learning-based research. Finally , future datasets can further strengthen the con- nection betw een measurement and mo deling by enabling tigh ter integration b etw een empirical data, ray-tracing sim ulations, and digital twin environmen ts, supp orting h ybrid v alidation worko ws and more realistic system ev aluation. XVI. Concluding Remarks A erial wireless connectivity is b ecoming an essential enabler of next-generation communication systems, in- cluding 5G-Adv anced and 6G. This pap er presented a div erse collection of op en and w ell-do cumen ted datasets from the NSF AERP A W testb ed, co v ering v arious radio tec hnologies suc h as 5G, Wi-Fi, and LoRa, and captured using UA V s, helikites, programmable SDR no des, and commercial UE. W e discussed the technical and regula- tory challenges asso ciated with dev eloping programmable aerial wireless platforms to collect suc h datasets, includ- ing the integration of SDRs, real-time localization with cen timeter-level precision, testb ed-wide time synchroniza- tion, and compliance with F AA and FCC requirements. The resulting datasets oer high spatial and temp oral resolution, supp orting a wide range of researc h activities in wireless communications, signal pro cessing, and mac hine learning. By explicitly addressing the fragmen tation, lack of standardization, and limited repro ducible access that c haracterize man y existing aerial wireless datasets, this dataset descriptor lls a critical gap b etw een individual measuremen t campaigns and the broader research com- m unity’s need for integrated, reusable data resources. These datasets are curated according to F AIR principles and are intended to supp ort the academic and industrial researc h comm unity . They enable rigorous ev aluation of propagation mo dels, data-driven algorithm design, and p erformance b enchmarking in altitude-v arying environ- men ts. Beyond cataloging datasets, our work pro vides a state-of-the-art p ersp ectiv e on how aerial wireless research has evolv ed tow ard integrated, data-driv en metho dologies. The collectiv e analysis of existing datasets reveals emerg- ing trends in platform diversit y , frequency utilization, and cross-lay er measurement, oering insigh t into how future datasets and exp erimen ts can b e designed to b etter supp ort repro ducible and comparative researc h. F uture w ork will inv olve expanding the dataset scop e to include co operative and mobile scenarios, incorp orating adv anced net working features, and aligning with emerging standards to inform data-driven regulatory p olicy . App endix A File structure This do cumen t provides detailed descriptions of dataset directory structures, le formats, and supp orting con- v ersion and p ost-pro cessing utilities associated with the datasets presented in this pap er. These implementation- lev el details are consolidated here to preserve full repro- ducibilit y while maintaining a clear separation from the main text, whic h emphasizes dataset scop e, measurement con tent, and representativ e results. The information in this section enables users to ecien tly navigate the re- leased datasets, in terpret stored v ariables, and repro duce the rep orted analyses using the provided scripts and to ols. A. Wireless I/Q Dataset File Organization Directory hierarch y: The dataset is organized by mea- suremen t altitude, with one top-level directory p er UA V altitude. Each altitude-sp ecic directory contains separate sub directories for I/Q samples and GPS logs, along with optional post-pro cessing outputs generated by the pro- vided scripts. / IQ_samples/ *.sigmf-data *.sigmf-meta matle/ (generated MA TLAB les) GPS_logs/ *.sigmf-data *.sigmf-meta csvle/ (generated CSV les) I/Q sample les: The IQ_samples directory con tains SigMF-formatted raw I/Q recordings. Each le corresp onds to a 20 ms capture window and is named according to the Unix timestamp representing the measuremen t start time. Consecutiv e captures are separated b y 100 ms, resulting in appro ximately 40 000 I/Q samples per le at a 2 MHz sampling rate. Measuremen t timestamps are also em b edded in the SigMF metadata. GPS log les: The GPS_logs directory con tains SigMF-formatted GPS measurements. When conv erted to CSV, eac h record includes latitude, longitude, altitude (in meters), and the corresp onding Unix timestamp. GPS measuremen ts are logged at a one-second interv al. Con version utilities: T o facilitate p ost-pro cessing, the rep ository provides Python scripts that con vert SigMF les into commonly used analysis formats: • sigMF2mat_IQ.py: Conv erts SigMF I/Q recordings in to MA TLAB (.mat) format. • sigMF2csv_GPS.py: Conv erts SigMF GPS logs into comma-separated v alues (.csv) format. Fig. 34 sho ws a snapshot of a MA TLAB le after con version representing a 20 milliseconds I/Q measuremen t, along with ve rows of the generated CSV le depicting the UA V trajectory ov er a ve-second p erio d. 33 (a) I/Q samples of 20 milliseconds, conv erted to MA TLAB le using provided script: results_2022_04_02_12_13_18_008.mat . (b) GPS T ra jectory Data for at 90 m altitude, conv erted to CSV using provided script: 2022-04-02_12_57_03_vehicleOut.csv . Fig. 34. Snapshot of I/Q samples and GPS logs for I/Q Measurement Dataset. A README le is included in the dataset rep ository , summarizing dataset usage, measuremen t metho dology , equipmen t conguration, environmen t description, and references to p ost-processing worko ws for A2G propagation mo deling [ 26 ], [ 94 ]. B. Wireless Sp ectrum Dataset File Organization Directory hierarch y: The dataset rep ository is organized into dedicated directories for pow er spectrum measuremen ts and GPS logs. Eac h directory con tains SigMF-formatted les indexed by measurement timestamps, with optional sub directories created when con version utilities are executed. p o w_sp ec/ *.sigmf-data *.sigmf-meta matle/ (generated MA TLAB les) GPS_logs/ *.sigmf-data *.sigmf-meta csvle/ (generated CSV les) P ow er sp ectrum les: The pow_spec directory contains SigMF-formatted p o wer sp ectrum measuremen ts. When con verted to MA TLAB format, each le includes frequency v ectors (in MHz) and corresponding p ow er v alues (in dBm). File names correspond to Unix timestamps that indicate the time of sp ectrum acquisition. GPS log les: The GPS_logs directory con tains SigMF-formatted GPS measuremen ts. After conv ersion to CSV format, each record includes longitude, latitude, altitude (in meters), and the asso ciated Unix ep o c h timestamp, enabling time alignment with sp ectrum measuremen ts. (a) GPS T rajectory Data for the Pac kapalo oza 2024 Even t: 2024-08- 24_11_48_21_vehicleOut.csv. (b) F requency and Po wer Data for the Pac kapalo oza 2024 Even t: spec_results_20240824_140512.mat. Fig. 35. Snapshot of GPS Log, F requency , and Po wer Data for the Pac kapalo oza 2024 Dataset. Con version utilities: T o supp ort p ost-processing and data reuse, the rep ository pro vides Python scripts for format con version: • sigMF2mat_PW.py: Conv erts SigMF-formatted p o wer sp ectrum data into MA TLAB (.mat) les. • sigMF2csv_GPS.py: Con verts SigMF-formatted GPS logs into comma-separated v alues (.csv) les. Fig. 35 sho ws a snapshot of the GPS tra jectory data from P ac kapalo oza 2024, along with a MA TLAB le generated after conv ersion that represen ts the frequency and corresp onding measured p o wer for a single sweep. A README le accompanies the dataset and provides an ov erview of dataset scop e, measurement metho dology , equipmen t conguration, usage instructions, metadata description, and curator contact information. This do cumen tation supp orts transparent reuse and repro ducible spectrum analysis. C. 5G Mo dem-Based SPN Dataset File Organization The 5G mo dem-based dataset provides comprehensiv e RF/PHY-la yer and throughput measurements collected from an Ericsson 5G-NSA netw ork on the AERP A W platform during UA V igh t missions conducted on Septem b er 15 and Octob er 26, 2023. A p ortable no de equipp ed with a Quectel 5G mo dem was moun ted on a UA V for these exp eriments. The UA V follow ed a predened zigzag ight tra jectory at a xed altitude of 30 m, cov ering the north-west quadran t relativ e to the serving base station tow er. Measuremen ts were rep eated for UA V ya w orientations of 315° and 45° to ev aluate the impact of an tenna orien tation. Do wnlink trac was generated using an iperf3 application b et ween the portable no de and an AERP A W xed no de. Ra w measuremen t logs: • Serving_cell_Params_ENDC.csv: Serving cell conguration and RF measurements including Cell ID, RSRP , SINR, eARFCN, op erating band, and sub carrier spacing for b oth L TE and NR carriers. 34 • Basic_and_Other_Params.csv: PHY-la y er parameters including do wnlink MCS v alues and rep orted CSI metrics such as CQI, PMI, and RI. • < date> _vehicleOut.txt: UA V telemetry log con taining geolocation, orien tation, sp eed, and timestamps. • < date> _iperfclient_log.txt: Raw iperf3 client log capturing downlink throughput statistics. P ost-pro cessed parameter les: • inputf1_cellid_with_header.csv: L TE serving cell ID. • inputf2_cellid_with_header.csv: NR serving cell ID. • inputf1_rsrp_with_header.csv: L TE RSRP (dBm). • inputf2_rsrp_with_header.csv: NR RSRP (dBm). • inputf1_sinr_with_header.csv: L TE SINR (dB). • inputf2_sinr_with_header.csv: NR SINR (dB). • inputf2_cqi_with_header.csv: NR CQI v alues. • inputf2_mcs_with_header.csv: NR MCS v alues. • inputf2_ri_with_header.csv: NR rank indicator v alues. • input_throughput_with_header.csv: Do wnlink throughput (Mbps). All p ost-pro cessed les include synchronized timestamps and UA V geolo cation (longitude, latitude, altitude). The datasets are publicly av ailable via the AERP A W datasets webpage and the Dry ad digital rep ository . D. Nemo and Pa wPrints Dataset File Organization Dep ending on the exp erimental conguration, the Nemo and P awPrin ts datasets contain up to three logs p er measurement campaign: L TE logs, NR logs, and throughput logs. Within eac h log t yp e, radio or throughput KPIs are merged with UA V location information based on timestamps into a single CSV le. P awPrin ts datasets: The Pa wPrints datasets are obtained using Android APIs and include L TE and NR KPIs along with throughput measurements when av ailable. • pawprints_4G_LTE.csv: L TE KPIs including RSRP , RSR Q, RSSI, Physical Cell Identit y (PCI), T AC, and cell ID. • pawprints_5G_NR.csv: NR KPIs including sync hronization signal RSRP , RSRQ, and RSSI. • pawprints_iperf_throughput.csv: Do wnlink throughput measurements obtained using iperf. Nemo datasets: The Nemo datasets provide more comprehensiv e PHY-la yer measurements and include: • nemo_4G_LTE.csv: L TE RF and cell-level KPIs. • nemo_5G_NR.csv: NR KPIs including MCS, CQI, and channel rank. All Nemo and Pa wPrints les include synchronized timestamps and UA V geolo cation (latitude, longitude, altitude), enabling spatially resolved analysis of aerial L TE and NR p erformance. E. LoRa Propagation Dataset File Organization T ransmitter-side logs: The transmitter logs record pac ket-lev el metadata and vehicle state information asso ciated with eac h LoRa transmission. • Pac ket identiers and sequence num b ers. • LoRaW AN transmission parameters, including data rate, bandwidth, co de rate, spreading factor, and carrier frequency . • T ransmission timestamps. • V ehicle geographic lo cation (latitude, longitude, altitude), orientation (ya w, pitch, roll), and velocity . • GPS metadata, including the num b er of satellites in view. Gatew ay-side logs: Logs collected at the LoRaW AN gatew ays record reception metrics for successfully received pac kets. • RSSI. • SNR. • Pac ket reception timestamps. • Reception frequency channel and RF chain identier. • Gatewa y identier and geographic location. Deriv ed and auxiliary les: In addition to raw transmitter and gatewa y logs, the dataset includes auxiliary CSV les generated during p ost-pro cessing: • failed_tx_packages.csv: Records of failed or missing pac ket transmissions. • gateway- dataRate- Table.csv: Summary of data rates group ed b y receiving gatew ay . Signal-lev el data and utilities: Raw signal measuremen ts, including RSSI and SNR, are provided in SigMF format. Example Python scripts are included in the rep ository to con v ert SigMF les in to CSV format and to generate visualization outputs from the pro cessed data. F. A2G Channel Sounding Dataset File Organization Ra w signal les: Eac h channel sounding capture is stored using the SigMF format and consists of tw o les: • .sigmf- data: A binary le containing complex I/Q samples stored as 32-bit oating-p oint v alues in little-endian format. • .sigmf- meta: A JSON-formatted metadata le complian t with the SigMF specication. Metadata conten ts: In addition to standard SigMF elds, the metadata les include custom entries describing: • UA V GPS co ordinates and altitude at the time of capture. • Zado–Chu w av eform parameters, including sequence length and ro ot index. • Measurement frequency , timestamp alignment, and sync hronization parameters. • Flight conguration and experimental context. P ost-pro cessing utilities: The asso ciated GitHub rep ository provides p ost-pro cessing soft ware for c hannel analysis. This includes Python scripts and a Jupyter noteb ook that op erate either directly on SigMF-formatted les or on compressed intermediate data representations. 35 • PostProcess.ipynb: Implements correlation-based c hannel impulse response extraction, path loss computation, and visualization routines used to generate the published results. These utilities enable users to reproduce the represen tative gures and analyses presented in the main text [ 44 ]. G. TDO A-Based UA V Lo calization Dataset File Organization Primary dataset archiv e: The datasets reported in [ 45 ], [ 46 ] are distributed as a compressed archiv e containing one CSV le p er UA V igh t. File names enco de the ight altitude, signal bandwidth, and recording date. • Example lename: 40m_1.25MHz_7.15.24.csv, corresp onding to a ight at 40 m altitude with 1.25 MHz signal bandwidth recorded on July 15, 2024. CSV le con ten ts: Eac h CSV le includes the follo wing elds: • Center frequency of the transmitted signal. • Estimated UA V latitude and longitude. • Ground-truth (GT) latitude, longitude, and altitude. • Lo calization p erformance metrics, including the degree of cross-correlation (RHO) and circular error probabilit y (CEP). • Timestamps corresp onding to each lo calization estimate. • Binary LoS indicators (LOStoLW2- 5) describing LoS visibilit y to AERP A W tow ers L W2 through L W5, where a v alue of 1 denotes LoS and 0 denotes NLoS. If b oth latitude and longitude estimates are recorded as zero, the corresp onding en try indicates that the lo calization algorithm failed to produce a v alid p osition estimate for that measurement instance. Pro cessing utilities: The dataset archiv e includes a MA TLAB help er script: • KeysightRTDOALocalizationforFlights.m: Pro cesses a selected CSV le to generate UA V tra jectory visualizations and lo calization p erformance metrics. Related datasets: The datasets rep orted in [ 72 ], [ 73 ] follo w a similar format but dier in t wo asp ects: (i) LoS indicator v ariables are not included, and (ii) measurement and ground-truth data are provided in separate CSV les (Inspiron_backup.csv and GPS_Flight1_backup. csv, resp ectiv ely). H. AF AR Challenge Dataset File Organization The AF AR dataset is organized hierarchically to reect team participation, exp erimental environmen t, and UGV transmitter placement. F or each of the ve nalist teams, data are provided for three UGV lo cations (Lo c-1, Lo c-2, Lo c-3) and for b oth the DT simulation environmen t and the real-world AERP A W testbed. Directory hierarch y: • T op-level directories corresp ond to team iden tiers (e.g., 288, 300, 301). • Each team directory contains tw o subfolders: T ABLE II I Sample F ormat of p o wer_log.txt Timestamp Index RSS (dB) 2023-12-13 13:45:34.041027 0000000 -34.9675 2023-12-13 13:45:34.072347 0000004 -40.7695 2023-12-13 13:45:34.105068 0000010 -48.0318 – development: Digital twin sim ulation data. – testbed: Real-world AERP A W testb ed data. • Within eac h environmen t folder, lo cation-specic subfolders are provided: – loc- 1, loc- 2, and loc- 3. Core les in each testb ed lo cation folder: Each lo cation-specic folder within the testbed directory con tains the following les: • power_log.txt: Con tains RSS measurements captured b y the UA V receiver. Each row includes a timestamp (microsecond resolution), a sample index, and the measured RSS in dB. The sample index column is not used for signal analysis. • quality_log.txt: Contains RSQ measuremen ts with the same format as power_log.txt. • log.csv: Time-synchronized UA V navigation data, including GPS co ordinates (latitude, longitude, altitude), sp eed, heading, and satellite metadata. • angles.mat: UA V orientation data, including roll, pitc h, and ya w angles. T able I I I provides an example snipp et of the power_log. txt le format, and T able IV illustrates representativ e en tries from the log.csv le. I. UA V Signal Classication Dataset Organization and Utilities Dataset con tents: The UA V signal classication dataset consists of pro cessed RF signal recordings and asso ciated metadata stored in MA TLAB .mat les. The dataset includes RF signals from 17 commercial UA V con trollers represen ting eight manufacturers, as summarized in T able V . Metadata for each RF sample, including con troller identit y and acquisition parameters, are summarized in T able VI . Signal extraction and visualization: The dataset pro vides a MA TLAB class denition, droneRC.m, whic h enables ob ject-orien ted access to individual UA V controller RF signals and their asso ciated metadata. This class supp orts extraction, visualization, and prepro cessing of RF samples stored in the dataset. Fig. 36 illustrates the use of the droneRC class for accessing RF signals and metadata. Dataset construction for exp eriments: T o supp ort exible exp erimental design, the dataset includes a MA TLAB utilit y function, createDatabase.m, which enables construction of custom datasets from selected UA V controller signals. The function can generate databases in matrix or table format and allo ws users to sp ecify the n um b er of samples, selected con trollers, and 36 T ABLE IV Sample entries from log.csv showing UA V navigation and GPS metadata. TimeUS Status GMS GWk NSats HDop Lat Lng Alt Spd GCRs VZ Y a w U 2166080919 5 3.27E+08 2292 14 0.77 35.727371 -78.6962127 112.65 0.03985 72.47443 0.007 0 1 2166280903 5 3.27E+08 2292 14 0.77 35.727371 -78.6962128 112.66 0.028284 261.8699 -0.059 0 1 2166460908 5 3.27E+08 2292 14 0.77 35.7273709 -78.6962131 112.66 0.04639 172.5686 0.007 0 1 2166660988 5 3.27E+08 2292 14 0.77 35.727371 -78.6962132 112.65 0.061294 5.61758 0.21 0 1 2166860968 5 3.27E+08 2292 14 0.77 35.727371 -78.6962131 112.66 0.023087 252.3499 -0.189 0 1 2167060890 5 3.27E+08 2292 14 0.77 35.7273709 -78.6962132 112.68 0.011664 329.0363 -0.148 0 1 2167280929 5 3.27E+08 2292 14 0.77 35.7273708 -78.6962132 112.69 0.008485 315 -0.13 0 1 T ABLE V UA V platforms and remote controllers included in the drone signal classication dataset. Make Model Make Model Inspire 1 Pro DX5e Matrice 100 DX6e DJI Matrice 600 Spektrum DX6i Phantom 4 Pro JR X9303 Phantom 3 F utaba T8F G Graupner MC-32 HobbyKing HK-T6A FlySky FS-T6 T urnigy 9X Jeti Duplex DC-16 T ABLE VI Metadata of UAS signal classication dataset. Description V alue Number of drone controllers 17 Sampling frequency 20 GSa/s Center frequency 2.4 GHz Number of signals/drone RC ∼ 1000 Number of samples/signal 5 million Time duration/signal 0.25 ms A v erage data size/signal 7 MB Dataset size 124 GB Data format .mat feature representations. Fig. 37 illustrates the database construction pro cess. These utilities enable repro ducible b enc hmarking of UA V RF signal detection and classication algorithms under con trolled exp erimen tal conditions, including ev aluation across SNR lev els, controller diversit y , and interference scenarios. J. T ra jectory-A ware RSRP and Throughput Dataset File Organization Directory organization: The dataset is organized in to three primary directories corresp onding to the measuremen t metho dology and tra jectory t yp e: • fixed_trajectory_rsrp_emulation: Emulated RSRP measuremen ts collected along predened UA V tra jectories. Each record includes timestamps, UA V p osition (latitude, longitude, altitude), orientation (pitc h, roll, ya w), and RSRP v alues. • fixed_trajectory_rsrp_simulation: Simulated RSRP measuremen ts generated for the same xed UA V tra jectories. Each record includes timestamps, UA V p osition, and RSRP v alues. Fig. 36. The droneRC.m class is used to extract b oth RF signal data and asso ciated metadata from sp ecic .mat les in the UAS signal classication dataset [ 51 ]. Fig. 37. The createDatabase.m function is used to create a table or matrix of droneR C objects from the UAS signal classication dataset. The database generated can b e used to benchmark dierent UA V RF signal detection and classication algorithms in the presence or absence of interference [ 51 ]. • autonomous_trajectory_rsrp_simulation: Simulated RSRP measurements collected along autonomous UA V trajectories sub ject to geofencing constraints. Eac h record includes timestamps, UA V p osition, and RSRP v alues. CSV le structure: Each CSV le corresp onds to a UA V igh t and contains time-indexed measuremen ts including UA V p osition (longitude, latitude, altitude), radio metrics suc h as RSRP and SNR, and application-lay er throughput where applicable. T able VII illustrates a representativ e sample of the CSV structure. P ost-pro cessing utilities: The dataset rep ository includes 37 T ABLE VII UA V measurement dataset sample with RSRP , SNR, and data rate. Time (s) Lon. (deg) Lat. (deg) Alt. (m) RSRP (dBm) SNR (dB) Rate (Mbps) 25-03-28 03:36:50 -78.69627 35.72748 0.00 -53.00 37.00 7.35 25-03-28 03:36:51 -78.69627 35.72748 0.47 -53.00 37.00 7.35 … 25-03-28 03:37:05 -78.69627 35.72748 30.0 -54.00 36.00 7.29 25-03-28 03:37:06 -78.69622 35.72748 30.0 -53.00 37.00 7.35 25-03-28 03:37:07 -78.69615 35.72745 30.0 -52.00 38.00 7.40 MA TLAB and Python scripts used to generate the gures and analyses presen ted in the pap er. These scripts supp ort visualization of RSRP as a function of UA V lo cation, distance to base stations, and time, as well as throughput analysis for xed and autonomous tra jectories. These utilities enable reproducible preparation of all represen tative gures and statistical results rep orted in [ 56 ]. K. Ra y-T racing Sim ulation and Measurement Comparison Dataset File Organization The dataset is distributed as a collection of data folders and MA TLAB scripts labeled using the prexes “D” (data) and “C” (co de). The organization supp orts repro ducible comparison b et ween measured RSS and ra y-tracing sim ulation results. Data comp onen ts: • D1_RSS_Measurements: Contains subfolders corresp onding to RSS measurements (in dB) collected at ve base station lo cations (L W1–L W5). Eac h subfolder also includes the GPS information asso ciated with the predened UA V tra jectory . • D2_RT_RSS_results_data.mat: Stores R T sim ulation outputs for the predened UA V tra jectory , including path co ecien ts and propagation delays at eac h UA V p osition. • D3_RT_Measurement_RSS_postprocessed_ data.mat: Contains the time duration of the measuremen t campaign, RSS v alues derived from R T sim ulation, and calibrated RSS v alues obtained from measuremen ts. P ost-pro cessing scripts: • C1_trajectory_altitude.m: Plots the predened UA V tra jectory and altitude as a function of time. • C2_RSS_postprocessing.m: P erforms p ost-processing and calibration of R T and measured RSS data. This step is optional for repro ducing the published results, as the calibrated outputs are included in D3_RT_Measurement_RSS_ postprocessed_data.mat. • C3_RSS_comparison.m: Generates comparativ e plots of measured and R T-sim ulated RSS v alues for each base station, corresp onding to the results presen ted in the main text. These components e nable full repro duction of the reported ra y-tracing comparison results. References [1] G. Geraci, A. Garcia-Ro driguez, M. M. Azari, A. Lozano, M. Mezzavilla, S. Chatzinotas, Y. Chen, S. Rangan, and M. Di Renzo, “What will the future of UA V cellular communi- cations b e? A ight from 5G to 6G,” IE EE Commun. Surveys T uts., vol. 24, no. 3, pp. 1304–1335, 2022. [2] A. Guidotti, A. V anelli-Coralli, V. Schena, N. Chuberre, M. El Jaafari, J. Puttonen, and S. Cioni, “The path to 5G- adv anced and 6G non-terrestrial netw ork systems,” in Proc. IEEE Adv. Satell. Multimed. Syst. Conf. Signal Pro cess. Space Commun. W orksh., 2022, pp. 1–8. [3] M. Mozaari, W. Saad, M. Bennis, Y.-H. Nam, and M. Deb- bah, “A tutorial on UA V s for wireless netw orks: Applications, challenges, and open problems,” IEEE Commun. Surv eys T uts., vol. 21, no. 3, pp. 2334–2360, 2019. [4] F ederal Communications Commission, “The role of 5G for UAS,” FCC T echnological Advisory Council, T ech. Rep., Sep. 2021, accessed: Jul. 30, 2025. [Online]. A v ailable: https://www. fcc.gov/sites/default/files/tac- 5g- uas- white- paper- 2021.pdf [5] ——, “Use of the 5030–5091 MHz band for unmanned aircraft communications,” F ederal Communications Commission, T ech. Rep. FCC-22-101, Dec. 2022, accessed: Jul. 30, 2025. [Online]. A v ailable: https://docs.fcc.gov/public/attachments/ FCC- 22- 101A1.pdf [6] 3GPP , “Enhanced L TE supp ort for aerial vehicles,” 3rd Gen- eration Partnership Project (3GPP), TR 36.777, Dec. 2017, av ailable: https://www.3gpp.org/ftp/Specs/archive/36_series/ 36.777/ . [7] International T elecommunication Union, “The use of International Mobile T elecommunications (IMT) for broadband public protection and disaster relief (PPDR) applications,” International T elecommunication Union, Radiocommunication Sector (ITU-R), Recommendation Report ITU-R M.2291-2, 2021, accessed: 2025-07-31. [Online]. A vailable: https://www.itu.int/dms_pub/itu- r/opb/ rep/R- REP- M.2291- 2- 2021- PDF- E.pdf [8] Ericsson, Samsung, and Qualcomm, “Clarication of RSRP measurement triggering for num b er of cells for UA V s,” 3GPP TSG RAN W orking Group 4 (RAN4), LS / T ec hnical Contri- bution R2‑2203658, 2022. [9] C. M. Nassif, “Electronic conspicuity: Exploring the use of adv anced radiofrequency technologies to enable unmanned air- craft systems integration,” U.S. Department of T ransp ortation (USDOT), T ec h. Rep., Nov. 2024, white Paper. [10] AERP A W Project, “Aerpa w wireless datasets for public use,” [Online]. A v ailable: https://aerpaw.org/experiments/datasets/ , accessed: Aug. 5, 2025. [11] R. Mozny , P . Masek, M. Stusek, K. Molnar, M. P alenska, D. Moltc hanov, and J. Hosek, “Exp erimental quality assessmen t of cellular netw orks and their utilization for UA V services,” in Proc. IEEE V eh. T ec hnol. Conf. (VTC), 2023, pp. 1–6. [12] J. Braunfelds, G. Jako vels, I. Murans, A. Litvinenko, U. Senkans, R. Rum ba, A. Onzuls, G. V alters, E. Lidere, and E. Plone, “Experimental study on L TE mobile net w ork performance parameters for con trolled drone igh ts,” Sensors, vol. 24, no. 20, p. 6615, 2024. [13] J. Zhang, K. Lu, Y. W an, J. Xie, and S. F u, “Emp ow ering UA V-based airb orne computing platform with SDR: Building an L TE base station for enhanced aerial connectivity ,” IEEE T rans. V eh. T echnol., vol. 73, no. 10, pp. 15 513–15 524, 2024. [14] N. Ruseno, H. V. Ongko wijoy o, and C.-Y. Lin, “Analysis of 4G signal qualit y in the UAS netw ork remote ID using machine learning metho ds,” J. Aeronaut. Astronaut. A viat., vol. 56, no. 2, pp. 555–568, 2024. [15] M. A. Zulkiey , M. Behjati, R. Nordin, and M. S. Zakaria, “Mobile netw ork p erformance and technical feasibility of L TE- powered unmanned aerial vehicle,” Sensors, vol. 21, no. 8, p. 2848, 2021. [16] I. Ko v acs, R. Amorim, H. C. Nguyen, J. Wigard, and P . Mo- gensen, “Interference analysis for UA V connectivity ov er L TE using aerial radio measurements,” in Pro c. IEEE V eh. T echnol. Conf. (VTC), 2017, pp. 1–6. [17] S. Chennamsetty , S. Bo ddu, and P . Chandhar, “Real time measurement and analysis of 4G and 5G sp ectrum occupancy in Andhra Pradesh and T elangana - India,” in Pro c. IEEE India Counc. Int. Conf., 2023, pp. 31–36. 38 [18] D. Kuester, X. Lu, D. Gu, A. Kord, J. Rezac, K. Carson, M. L. Dow ell, E. Eyeson, A. F eldman, K. F orsyth et al., “Radio spectrum occupancy measuremen ts amid COVID-19 telew ork and telehealth,” Nat. Inst. Stand. T echnol., T ec h. Rep. TN- 2240, 2022. [19] M. D. Wilkinson, M. Dumontier, I. J. Aalb ersberg, G. Apple- ton, M. Axton, A. Baak, N. Blomberg, J.-W. Boiten, L. B. da Silv a Santos, P . E. Bourne et al., “The F AIR guiding principles for scientic data managemen t and stewardship,” Sci. Data, vol. 3, no. 1, pp. 1–9, 2016. [20] AERP A W User Man ual, “FCC and F AA Regulations in AERP A W,” [Online]. A v ailable: https://sites.google.com/ ncsu.edu/aerpaw- user- manual/3- user- resources- and- policies/ 3- 5- fcc- faa- regulations , accessed: Oct. 1, 2025. [21] “ArduPilot website,” https://ardupilot.org. [22] “MA VLink sp ecications,” https://ma vlink.io. [23] “QGroundControl,” https://qgroundcon trol.com/. [24] AERP A W User Manual, “AERP A W Sample Exp eriments,” [Online]. A v ailable: https://sites.google.com/ncsu.edu/ aerpaw- user- manual/6- sample- experiments- repository , accessed: Oct. 1, 2025. [25] S. J. Maeng, O. Ozdemir, I. Guvenc, M. Sichitiu, and R. Dutta, “L TE I/Q measuremen t by AERP A W platform for air-to-ground propagation mo deling,” IEEE Dataport, Dataset, 2022. [Online]. A v ailable: https://doi.org/10.21227/0p43- 0d72 [26] S. J. Maeng, O. Ozdemir, I. Guv enc, M. L. Sichitiu, M. Mushi, and R. Dutta, “L TE I/Q measurement by AERP A W platform for air-to-ground propagation mo deling,” CodeOcean, Softw are Capsule, 2023. [Online]. A v ailable: https://codeocean.com/capsule/8597224 [27] S. J. Maeng, O. Ozdemir, İ. Güvenç, M. Sic hitiu, R. Dutta, and M. Mushi, “AERIQ: SDR-based L TE I/Q measuremen t and analysis framework for air-to-ground propagation mo deling,” in Proc. IEEE Aerosp. Conf., 2023, pp. 1–11. [28] S. J. Maeng, O. Ozdemir, İ. Güvenç, and M. L. Sichitiu, “Kriging-based 3-D spectrum a wareness for radio dynamic zones using aerial sp ectrum sensors,” IEEE Sensors J., vol. 24, no. 6, pp. 9044–9058, 2024. [29] S. J. Maeng, H. Kw on, O. Ozdemir, and İ. Güvenç, “Impact of 3-D antenna radiation pattern in UA V air-to-ground path loss modeling and RSRP-based lo calization in rural area,” IEEE Open J. Antennas Propag., vol. 4, pp. 1029–1043, Oct. 2023. [30] A. H. F. Raouf, O. Ozdemir, I. Guvenc, and M. Sichitiu, “AERP A W helikite sp ectrum measurements at P ackapalooza F estiv al in Aug. 2024,” Dryad, Dataset, 2024. [Online]. A v ailable: https://doi.org/10.5061/dryad.0zpc8676n [31] ——, “AERP A W helikite sp ectrum measurements at Lake Wheeler site in August 2024,” Dryad, Dataset, 2024. [Online]. A v ailable: https://doi.org/10.5061/dryad.pk0p2ngz8 [32] S. J. Maeng, O. Ozdemir, I. Guvenc, and M. Sichitiu, “AERP A W helikite spectrum measurements at Lake Wheeler site in Ma y 2022,” Dryad, Dataset, 2023. [Online]. A v ailable: https://doi.org/10.5061/dryad.jm63xsjhw [33] ——, “AERP A W helikite spectrum monitoring at Pac kapalo oza festiv al in Aug. 2022,” Dryad, Dataset, 2023. [Online]. A v ailable: https://doi.org/10.5061/dryad.qbzkh18qd [34] ——, “AERP A W helikite sp ectrum measurements at Pac kapalo oza F estiv al in Aug. 2023,” Dryad, Dataset, 2023. [Online]. A v ailable: https://doi.org/10.5061/dryad.mw6m9063f [35] A. H. F. Raouf, O. Ozdemir, I. Guvenc, and M. Sichitiu, “AERP A W helikite sp ectrum measurements at P ackapalooza F estiv al in August 2025,” Dryad, Dataset, 2025. [Online]. A v ailable: https://doi.org/10.5061/dryad.tb2rbp0fw [36] A. H. F. Raouf, S. J. Maeng, I. Guvenc, Ö. Özdemir, and M. Sic hitiu, “Cellular spectrum o ccupancy probability in urban and rural scenarios at various UAS altitudes,” in Proc. IEEE IEEE Annu. Int. Symp. Pers. Indo or Mob. Radio Commun. (PIMRC), 2023, pp. 1–6. [37] ——, “Spectrum monitoring and analysis in urban and rural en- vironments at dierent altitudes,” in Proc. IEEE V eh. T echnol. Conf. (VTC), 2023, pp. 1–7. [38] R. Asokan, A. H. F ahim Raouf, O. Ozdemir, I. Guv enc, and M. Sichitiu, “Ericsson 5G NSA netw ork RF and throughput measurements on AERP A W network,” Dryad, Dataset, 2025. [Online]. A v ailable: https://doi.org/10.5061/dryad.wh70rxx06 [39] S. Singh, O. Ozdemir, M. Sichitiu, and I. Guvenc, “AERP A W: Aerial Android-based 4G measurements of public A T&T cell tow ers from a tethered Helikite in Aug 2023,” Dryad, Dataset, 2023. [Online]. A v ailable: https://doi.org/10.5061/ dryad.r7sqv9sr3 [40] S. Singh, A. Gurses, R. Asokan, O. Ozdemir, M. Sichitiu, and I. Guvenc, “AERP A W: Aerial Android-based cellular measurements for horizontal sweeps across a private base station,” Dry ad, Dataset, 2024. [Online]. A vailable: https: //doi.org/10.5061/dryad.6wwpzgnbd [41] R. Asokan, O. Ozdemir, İ. Güvenç, and M. L. Sichitiu, “Aerial RF and throughput measurements on a non-standalone 5G wireless netw ork,” in Pro c. IEEE In t. Symp. Dyn. Sp ectr. A ccess Netw. (DySP AN), 2024, pp. 120–123. [42] S. V argas Villar, A. H. F. Raouf, O. Ozdemir, I. Guvenc, and M. Sichitiu, “LoRaW AN gatewa y p erformance and vehicle tracking data in AERP A W testb ed,” Dryad, Dataset, 2025. [Online]. A v ailable: https://doi.org/10.5061/dryad.w0vt4b939 [43] A. Gürses, “USRP Channel Sounder,” GitHub, Software Repository , 2025. [Online]. A v ailable: https://github.com/ anilgurses/USRP- Channel- Sounder [44] A. Gürses and M. L. Sic hitiu, “Air-to-ground channel modeling for UA V s in rural areas,” in Pro c. IEEE V eh. T echnol. Conf. (VTC), 2024, pp. 1–6. [45] C. Dick erson, O. Ozdemir, M. Sichitiu, and I. Guvenc, “AERP A W Keysight N6841A RF sensor UA V lo calization measurements with LOS/NLOS information, July 2024,” Dryad, Dataset, 2025, accessed: March 2025. [Online]. A v ailable: https://doi.org/10.5061/dryad.vq83bk44h [46] C. Dick erson, S. Masrur, J. Dick erson, O. Ozdemir, and I. Gu- venc, “Impact of altitude, bandwidth, and NLOS bias on TDOA-based 3D UA V lo calization: Experimental results and CRLB analysis,” in Pro c. IEEE Int. Conf. Commun. W orksh. (ICC W orksh.), 2025, pp. 671–677. [47] A. Gurses, A. H. F. Raouf, S. J. Maeng, O. Ozdemir, I. Guvenc, and M. Sichitiu, “AERP A W Find-a-Rov er (AF AR) Challenge Dataset, December 2023,” Dryad, Dataset, 2024. [Online]. A v ailable: https://doi.org/10.5061/dryad.18931zd4g [48] S. Masrur and I. Guv enc, “Bridging simulation and reality: A 3D clustering-based deep learning model for UA V-based RF source localization,” in Pro c. IEEE Int. Conf. Comm un. W orksh. (ICC W orksh.), 2025, pp. 953–958. [49] P . S. Kudyba, Q. Lu, and H. Sun, “Bay esian optimization for fast radio mapping and lo calization with an autonomous aerial drone,” in Proc. IEEE V eh. T echnol. Conf. (VTC), W ashington, DC, USA, Sep. 2024, pp. 1–5. [50] S. Masrur, O. Ozdemir, A. Gurses, I. Guvenc, M. L. Sic hitiu, R. Dutta, M. Mushi, T. Za jko wski, C. Dic k erson, G. Reddy , S. V. Villar, C.-W. W ong, B. Chatterjee, S. Chaudhari, Z. Li, Y. Liu, P . Kudyba, H. Sun, J. S. Mandapaka, K. Namuduri, W. W ang, and F. F und, “Collection: UA V-based RSS measure- ments from the AF AR challenge in digital twin and real-world environmen ts,” IEEE Data Descr., vol. 2, pp. 375–385, 2025. [51] M. Ezuma, F. Erden, C. K. Anjinappa, O. Ozdemir, and I. Guvenc, “Drone remote controller RF signal dataset,” 2020. [Online]. A v ailable: https://dx.doi.org/10.21227/ss99- 8d56 [52] ——, “Detection and classication of UA V s using RF nger- prints in the presence of Wi-Fi and Blueto oth interference,” IEEE Op en J. Commun. So c., pp. 60–76, Nov. 2019. [53] ——, “Micro-UA V detection and classication from RF n- gerprints using machine learning techniques,” in Pro c. IEEE Aerosp. Conf., Big Sky , Montana, Mar. 2019. [54] “UA VFlexSimF ramework,” GitHub, Softw are Rep ository , 2025. [Online]. A v ailable: https://github.com/mhossenece/ UAVFlexSimFramework.git [55] M. S. Hossen, A. Gurses, M. Sichitiu, and I. Guvenc, “Accelerating developmen t in UA V netw ork digital twins with a exible simulation framework,” Dryad, Dataset, 2025. [Online]. A v ailable: https://doi.org/10.5061/dryad.zw3r228k9 [56] ——, “Accelerating developmen t in UA V network digital twins with a exible simulation framework,” in Proc. IEEE In t. Conf. Commun. W orksh. (ICC W orksh.), Montreal, Canada, 2025. [57] “Sionna ra y tracing vs. real-world measurements: Signal strength comparison in rural scenarios with foliage,” Dry ad, Dataset, accessed: 2025. [Online]. A vailable: https://datadryad. org/dataset/doi:10.5061/dryad.ttdz08m8r [58] D. Lee, O. Ozdemir, R. Asokan, and I. Guvenc, “Analysis and prediction of cov erage and channel rank for UA V networks in 39 rural scenarios with foliage,” IEEE Open J. V eh. T echnol., v ol. 6, pp. 1943–1962, 2025. [59] The GNU Radio F oundation, Inc., “The signal metadata format (SigMF),” https://sigmf.org , 2018, cC-BY-SA-4.0. [Online]. A v ailable: https://sigmf.org [60] S. J. Maeng, O. Ozdemir, I. Guvenc, and M. Sichitiu, “3D antenna pattern measurement for AERP A W exp eriments,” IEEE Datap ort, Dataset, 2023. [Online]. A v ailable: https: //doi.org/10.21227/mma2- 0t93 [61] M. Rahman, S. J. Maeng, İ. Güv enç, and C.-W. W ong, “3D spectrum aw areness for radio dynamic zones using Kriging and matrix completion,” in Pro c. IEEE Int. Symp. Dyn. Sp ectr. Access Netw. (DySP AN), W ashington, DC, USA, May 2024, pp. 439–446. [62] Ettus Researc h, “USRP B205mini-i,” [Online]. A v ailable: https: //www.ettus.com/all- products/USRP- B205Mini- I/ , accessed: F eb. 19, 2025. [63] AMD, “Spartan-6 FPGA Pro duct Page,” [Online]. A v ailable: https://www.amd.com/en/products/adaptive- socs- and- fpgas/ fpga/spartan- 6.html , accessed: F eb. 19, 2025. [64] Analog Devices, “AD9361 RF Agile T ransceiver,” [Online]. A v ailable: https://www.analog.com/en/products/ad9361.html , accessed: F eb. 19, 2025. [65] AERP A W User Manual, “UHD1: Sp ectrum Monitoring,” [Online]. A v ailable: https://sites.google.com/ncsu.edu/ aerpaw- user- manual/6- sample- experiments- repository/ 6- 1- radio- software/6- 1- 4- uhd- python- api- experiments/ uhd1- spectrum- monitoring?authuser=0 , accessed: F eb. 19, 2025. [66] Keysight, “Nemo Handy Handheld Measurement Solution,” [Online]. A v ailable: https://www.keysight.com/us/en/product/ NTH50047B/nemo- handy- handheld- measurement- solution. html , accessed: 2025. [67] S. Singh, R. Asokan, O. Ozdemir, M. Sichitiu, and I. Guvenc, “AERP A W: A erial Android-based 4G measurements for semi circle tra jectories around a priv ate base station,” Dryad, Dataset, 2024. [Online]. A v ailable: https://doi.org/10.5061/ dryad.gmsbcc30x [68] ——, “AERP A W: Aerial android-based cellular measurements for two sweeps across a priv ate base station,” Dryad, Dataset, 2024. [Online]. A v ailable: https://doi.org/10.5061/ dryad.02v6wwqgt [69] F ederal A viation A dministration, “Unmanned aircraft system (UAS) trac management (UTM): Concept of operations v2.0,” F AA NextGen Oce, W ashington, DC, USA, T ech. Rep., Mar. 2020. [70] I. Guv enc, F. K oohifar, S. Singh, M. L. Sic hitiu, and D. Matolak, “Detection, trac king, and interdiction for amateur drones,” IEEE Commun. Mag., vol. 56, no. 4, pp. 75–81, 2018. [71] M. M. Azari, H. Sallouha, A. Chiumen to, S. Ra jendran, E. Vino- gradov, and S. Pollin, “Key technologies and system trade- os for detection and localization of amateur drones,” IEEE Commun. Mag., vol. 56, no. 1, pp. 51–57, 2018. [72] U. Bhattacherjee, E. Ozturk, O. Ozdemir, I. Guvenc, M. L. Sichitiu, and H. Dai, “Exp erimental study of outdo or UA V localization and tracking using passiv e RF sensing,” in Pro c. ACM W orksh. Wirel. Netw. T estb eds Exp. Ev al. Charact. (WiNTECH W orksh.), 2022, pp. 31–38. [73] U. Bhattacherjee, I. Guvenc, O. Ozdemir, and M. L. Sichitiu, “Experimental study of outdo or UA V lo calization and tracking using passive RF sensing,” IEEE Datap ort, Dataset, 2022. [Online]. A v ailable: https://doi.org/10.21227/5rrb- 9y02 [74] AERP A W T eam, “AERP A W AF AR Challenge,” [Online]. A v ailable: https://aerpaw.org/aerpaw- afar- challenge/ , accessed: Aug. 19, 2025. [75] W. Kha waja, M. Ezuma, V. Semkin, F. Erden, O. Ozdemir, and I. Guvenc, “A survey on detection, classication, and tracking of UA V s using radar and communications systems,” IEEE Commun. Surveys T uts., pp. 1–40, Mar. 2025. [76] M. Ezuma, O. Ozdemir, C. K. Anjinappa, W. A. G. Khaw a ja, and I. Guvenc, “Micro-UA V detection with a low-grazing angle millimeter wa ve radar,” in Pro c. IEEE Radio Wirel. Symp., Orlando, FL, Jan. 2019. [77] E. Ozturk, F. Erden, and I. Guvenc, “RF-based low-SNR classication of UA V s using conv olutional neural networks,” arXiv preprint arXiv:2009.05519, pp. 1–18, Sep. 2020, preprint. [78] NVIDIA, “NVIDIA Sionna,” [Online]. A v ailable: https:// developer.nvidia.com/sionna , accessed: 2022. [79] Op enStreetMap, “Op enStreetMap,” [Online]. A v ailable: https: //www.openstreetmap.org , accessed: 2004. [80] Blender F oundation, “Blender,” [Online]. A v ailable: https:// www.blender.org/ , accessed: 1994. [81] International T elecomm unication Union, “ITU-R P .833-10,” [Online]. A vailable: https://www.itu.int/pub/R- REC/en , ac- cessed: 2021. [82] A. Grote, E. Ly ons, K. Thareja, G. Papadimitriou, E. Deelman, A. Mandal, P . Caly am, and M. Zink, “Flypa w: Optimized route planning for scientic UA V missions,” in Pro c. IEEE Int. Conf. e-Science, 2023, pp. 1–10. [83] A. E. Morel, C. Qu, P . Calyam, C. W ang, K. Thareja, A. Man- dal, E. Lyons, M. Zink, G. P apadimitriou, and E. Deelman, “FlyNet: Drones on the horizon,” IEEE Internet Computing, vol. 27, no. 3, pp. 35–43, 2023. [84] P . Kudyba, J. S. Mandapaka, W. W ang, L. McCorkendale, Z. McCorkendale, M. Kidane, H. Sun, E. Adams, K. Namuduri, F. F und et al., “A UA V-assisted wireless lo calization challenge on AERP A W,” arXiv preprint arXiv:2407.12180, 2024. [85] M. Drago, A. Gurses, R. W. H. Jr., M. L. Sic hitiu, and M. Zorzi, “End-to-end full-stack drone measurements: A case study using AERP A W,” in Pro c. IEEE Int. Conf. Commun. W orksh. (ICC W orksh.), 2023. [86] J. Moore, A. S. Ab dalla, C. Ueltschey , A. Gurses, O. Ozdemir, M. L. Sichitiu, I. Guvenc, and V. Maro jevic, “Adv ancing experimental platforms for UA V comm unications: Insigh ts from AERP A W’s digital t win,” in Pro c. IEEE V eh. T echnol. Conf. (VTC), 2024. [87] A. Gurses, M. F underburk, J. Kesler, K. P ow ell, T. F. Rahman, O. Ozdemir, M. Mushi, M. L. Sichitiu, I. Guv enc, R. Dutta, and V. Maro jevic, “Demonstration of joint SDR/UA V exp eriment developmen t in AERP A W,” in Pro c. IEEE Mil. Commun. Conf. (MILCOM), 2023. [88] S. Javed, A. Hassan, R. Ahmad, M. M. Alam, M. S. Hossen, A. Gurses, and O. Ozdemir, “Autonomous UA V tra jectory design and ev aluation for data muling in AERP A W digital twin,” in Proc. IEEE Int. Conf. Comm un. (ICC), May 2026, to app ear. [89] J. J. Sadique, M. R. Khan, and A. S. Ibrahim, “UA V-aided fast data collection via machine learning using AERP A W’s digital twin,” in Proc. ACM Int. W orksh. Wirel. Netw. T estbeds Exp. Ev al. Charact. (WiNTECH), 2025. [90] K. Kostage, R. Adepu, J. Monro e, T. Haughton, J. Mogollon, S. Poduvu, K. Palaniappan, C. Qu, P . Calyam, and R. Mitra, “F ederated learning-enabled net work incident anomaly detec- tion optimization for drone swarms,” in Pro c. ACM Int. Conf. Distrib. Comput. Netw. (ICDCN), 2025. [91] A. A. Ab dalla, J. Moore, A. Gurses, O. Ozdemir, M. L. Sichitiu, I. Guvenc, and V. Marojevic, “Enhancing drone video analytics security management using an AERP A W testbed,” in Pro c. IEEE Int. Conf. Commun. W orksh. (ICC W orksh.), 2023, pp. 1–6. [92] P . S. Kudyba and H. Sun, “Autonomous agricultural monitoring with aerial drones and RF energy-harvesting sensor tags,” in Proc. Springer International Symp osium on Intelligen t Com- puting and Netw orking, 2025, pp. 106–116. [93] A. E. Morel, P . Calyam, and K. Palaniappan, “T ask ooading strategies for agricultural UA V systems in dynamic netw ork environmen ts,” in Proc. IEEE Int. Conf. Distrib. Comput. Smart Syst. Internet Things (DCOSS-IoT), 2025, pp. 344–351. [94] S. J. Maeng, O. Ozdemir, I. Guvenc, M. L. Sichitiu, M. Mushi, and R. Dutta, “L TE I/Q data set for UA V propagation mo del- ing, communication, and navigation research,” IEEE Commun. Mag., vol. 61, no. 9, pp. 90–96, 2023.
Original Paper
Loading high-quality paper...
Comments & Academic Discussion
Loading comments...
Leave a Comment