Auditing the Auditors: Does Community-based Moderation Get It Right?
Online social platforms increasingly rely on crowd-sourced systems to label misleading content at scale, but these systems must both aggregate users' evaluations and decide whose evaluations to trust. To address the latter, many platforms audit users…
Authors: Yeganeh Alimohammadi, Karissa Huang, Christian Borgs
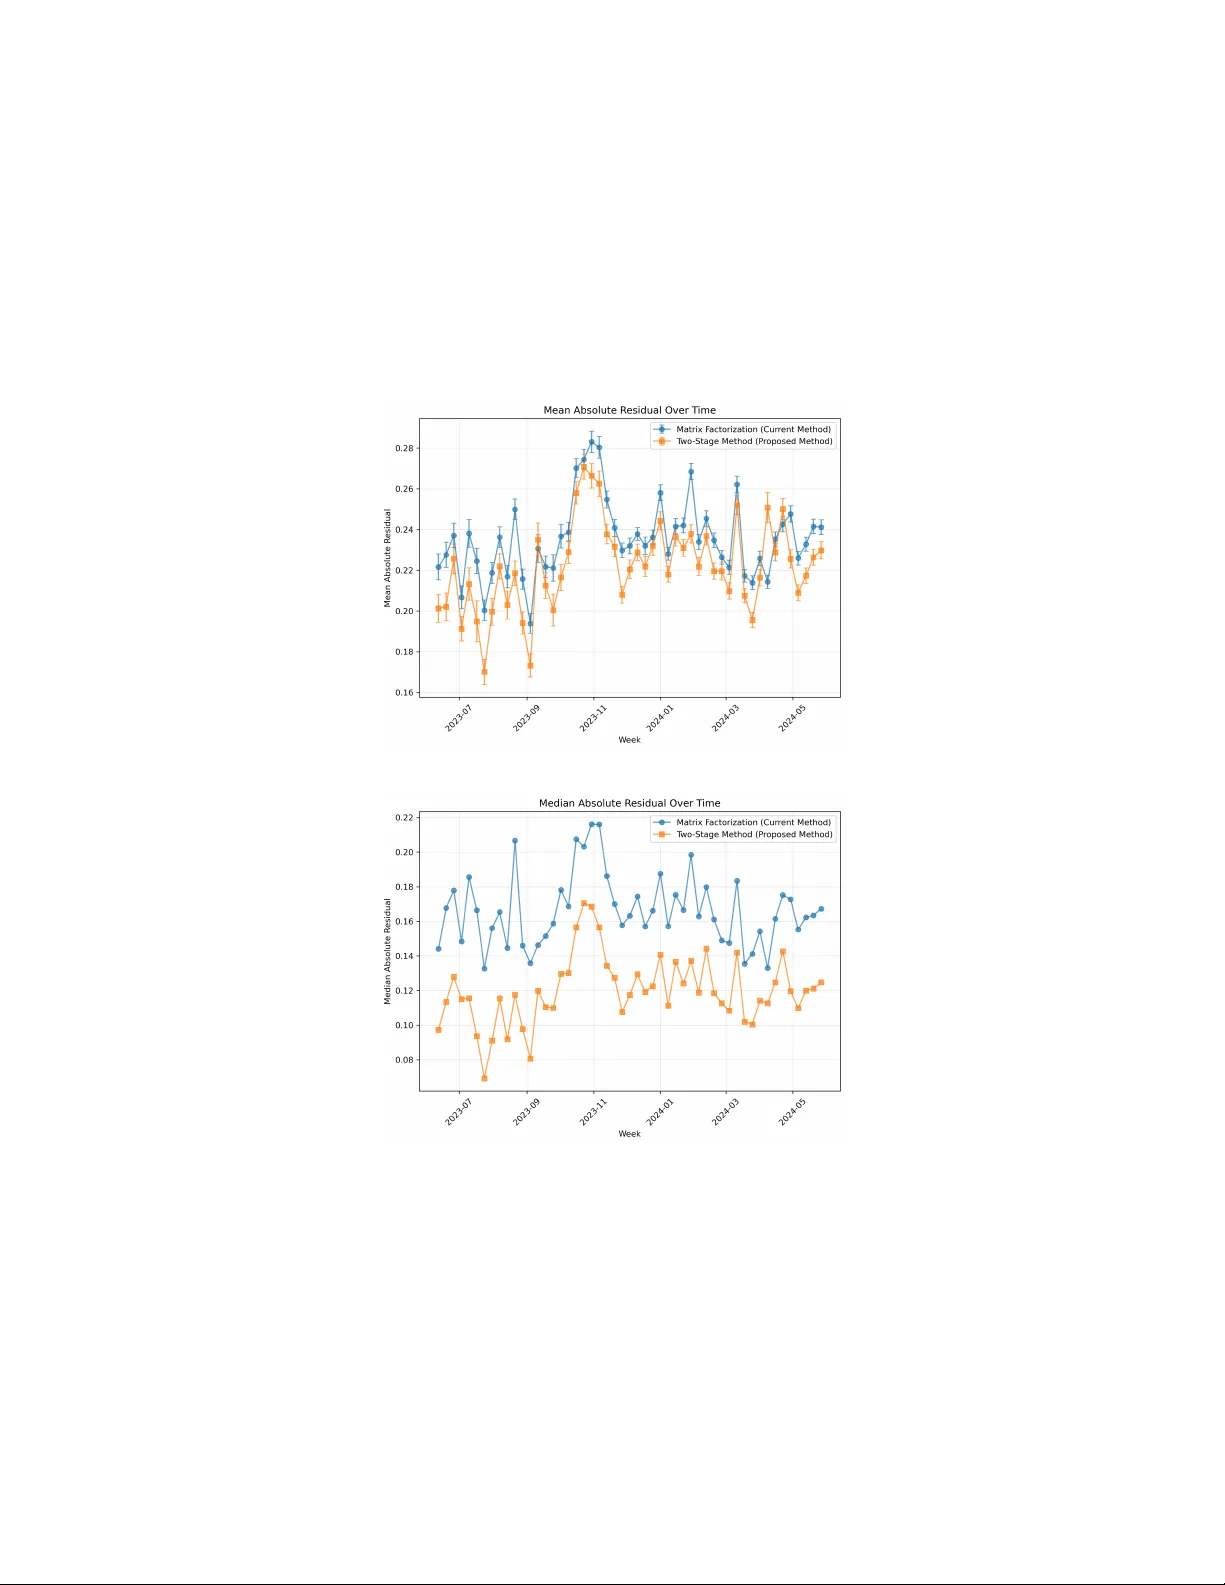
A U D I T I N G T H E A U D I T O R S : D O E S C O M M U N I T Y - B A S E D M O D E R A T I O N G E T I T R I G H T ? Y eganeh Alimohammadi 1 † Univ ersity of Southern California Karissa Huang 1 ‡ UC Berkeley Christian Borgs § UC Berkeley Jennifer Chayes ¶ UC Berkeley March 20, 2026 A B S T R AC T Online social platforms increasingly rely on crowd-sourced systems to label misleading content at scale, b ut these systems must both aggregate users’ ev aluations and decide whose ev aluations to trust. T o address the latter , many platforms audit users by rewarding agreement with the final aggregate outcome, a design we term consensus-based auditing. W e analyze the consequences of this design in X’ s Community Notes, which in September 2022 adopted consensus-based auditing that ties users’ eligibility for participation to agreement with the e ventual platform outcome. W e find evidence of strate gic conformity: minority contributors’ e valuations drift to ward the majority and their participation share falls on controversial topics, where independent signals matter most. W e formalize this mechanism in a behavioral model in which contrib utors trade off priv ate beliefs against anticipated penalties for disagreement. Motiv ated by these findings, we propose a two-stage auditing and aggregation algorithm that weights contrib utors by the stability of their past residuals rather than by agreement with the majority . The method first accounts for differences across content and contributors, and then measures how predictable each contributor’ s ev aluations are relativ e to the latent-factor model. Contributors whose e valuations are consistently informati ve recei ve greater influence in aggregation, e ven when they disagree with the pre v ailing consensus. In the Community Notes data, this approach improv es out-of-sample predicti ve performance while a voiding penalization of disagreement. K eywords Content moderation | Misinformation | Community Notes | Matrix f actorization | Cro wdsourcing In the face of rapidly increasing online misinformation and harmful content [ 60 ], online platforms face a fundamental design question: how can unreliable inf ormation be identified and flagged at scale? Many platforms hav e turned this question back to their users, creating cro wdsourced systems of content moderation that seek to lev erage a div erse user base. Notably , X (formerly T witter)–and, at a more experimental stage, Meta, T ikT ok, and Bluesky–in vite users to ev aluate content and add context to potentially unreliable posts [66, 34, 42, 54]. A central challenge in these systems is that users v ary widely in the reliability of their e valuations [ 7 , 10 ]. As a result, platforms confront a second problem: how to audit the auditors themselv es? In practice, platforms aggre gate user content ev aluations into an inferred platform outcome, which we refer to as the consensus , that determines whether content is do wnranked or gi ven additional context [ 65 ]. The same consensus is then used to e valuate users’ reliability as well: users whose historical input to the system aligns with the consensus gain influence, whereas those who di ver ge are downweighted or lose eligibility to participate in future e valuations [ 14 , 15 ]. W e refer to this design choice as consensus-based auditing . † Marshall School of Business, Univ ersity of Southern California. yalimoha@usc.edu ‡ Department of Statistics, UC Berkeley . krhuang@berkeley.edu § Bakar Institute of Digital Materials for the Planet and Department of Electrical Engineering and Computer Sciences, UC Berkeley . borgs@berkeley.edu ¶ Department of Statistics, Department of Mathematics, School of Information, Department of Electrical Engineering and Computer Sciences, and Bakar Institute of Digital Materials for the Planet, UC Berkeley . jchayes@berkeley.edu 1 Equal contribution. A P R E P R I N T - M A R C H 2 0 , 2 0 2 6 Although consensus-based auditing appears operationally efficient, it implicitly assumes that consensus is a reliable proxy for truth and that disagreement signals lo w credibility . This coupling of aggregation and auditing can potentially create a self - reinforcing dynamic [ 26 , 39 ]. When agreement with the consensus is rew arded, users hav e incentiv es to anticipate the outcome rather than provide independent input [37, 33]. As a result, disagreement becomes less visible, and minority perspectiv es may be withdrawn before the y are ev er aggregated [ 69 , 38 ]. In this paper , we quantify these effects and sho w , both theoretically and empirically , that consensus-based auditing systematically distorts contributor behavior and reduces the representation of informati ve minority vie wpoints. X’ s Community Notes pro vides a concrete setting for studying these design choices. Launched in January 2021 (initially as Birdwatc h ), Community Notes is a crowdsourced content ev aluation system where participating platform users ( contributor s ) add short “notes” that provide conte xt to help readers assess a post’ s claims [ 66 ]. Other participating users rate the helpfulness of these notes, and an aggre gation algorithm selects which notes are displayed publicly as annotations on the original post, based on their predicted helpfulness across div erse viewpoints. In September 2022, Community Notes introduced Rating Impact and Writing Impact , which enforce a consensus-based auditing rule: a user’ s ability to continue rating and writing content depends on their historical alignment with the platform’ s aggregated outcome (the consensus) [ 14 , 15 , 40 ]. This policy change of fers a natural setting for examining how consensus-based auditing shapes acti vity in a crowd-sourced moderation system. W e identify se veral systematic shifts indicati ve of reduced minority visibility . First, over time minority contrib utors increasingly align their ratings with the majority , suggesting strategic anticipation of the platform outcome. Further , we examine topic - lev el participation and find that posts on controversial topics (e.g., politics, international conflict, etc.) recei ve fe wer notes than noncontroversial posts follo wing the adoption of consensus - based auditing, ev en though these are exactly the topics where misinformation risk is highest and where an effecti ve policy should encourage more ev aluator engagement [63, 61, 57]. T o understand these empirical observ ations, we dev elop a simple behavioral model in which users choose their ratings to balance their private belief about content quality against a penalty for deviating from the anticipated consensus. By analyzing the model’ s equilibrium, we formally prove that consensus-based penalties amplify conformity , and disproportionately suppress minority contributors. Finally , we propose an alternati ve auditing algorithm to address some of the ke y shortcomings of the current system. The algorithm proceeds in two stages. In the first stage, we estimate content-le vel and user-le vel ef fects, and systematic user–content alignment from the observed ratings, and then compute residuals as the dif ference between observed and predicted ratings. The resulting residuals isolate the idiosyncratic component of each ev aluation. In the second stage, we estimate contributor reliability from the variance of these first-stage residuals and aggregate current ev aluations using inv erse-variance weights. Crucially , “consistency” here refers to stability of residuals conditional on content and user’ s baseline , not agreement with the majority . As a result, a contributor may consistently disagree with the prev ailing consensus and still retain influence, provided their ev aluations are stable and informati ve relativ e to the modeled structure. This two-stage method is moti vated by classical results on weighted least squares under heteroskedasticity . After removing intrinsic content-level ef fects and user-specific average effects, residual ev aluations can be modeled as conditionally unbiased signals with user -specific variance; in this setting, inv erse-variance weighting yields the minimum-variance unbiased aggre gation of signals [ 4 , 12 , 27 , 46 ]. Empirically , we show that our algorithm impro ves out-of-sample predictiv e performance relativ e to the deployed algorithm. Better predictiv e performance yields harm reduction at scale. Previous work sho ws that the effecti veness of community annotations is highly time-sensitive. Notes attached earlier yield substantially larger reductions in engagement and diffusion than notes attached later; posts receive about 50% fewer reposts when notes are attached within 12 hours, compared to less than 10% reductions when attached after about 48 hours [ 48 ]. A more predicti ve auditing rule increases the signal-to-noise of early aggregates, reducing the number of ratings required to reach a confidence helpfulness decision and shortening time-to-attachment. In sum, our work makes three key contributions: (1) W e provide empirical e vidence that consensus-based auditing systematically alters minority behavior and reduces engagement with contro versial topics. (2) W e introduce a beha vioral model that explains these shifts. (3) W e design and ev aluate an alternativ e auditing and aggregation algorithm that improv es predictiv e performance while preserving participation of minorities. Related W ork The promise of cro wd-sourced ev aluation is often moti vated by the “wisdom of cro wds”: when individual judgments are div erse and independent, their aggregation can outperform indi vidual experts [ 23 , 52 ]. Ho wev er , when individuals 2 A P R E P R I N T - M A R C H 2 0 , 2 0 2 6 are exposed to others’ opinions, social influence can undermine independence and induce herding [ 9 , 3 , 20 , 33 ]. Studies sho w that once early public feedback is observed, later contributors may follo w the emerging trend, causing correlated errors and conformity [ 2 , 16 ]. Consensus-based auditing creates an additional channel for such ef fects: when contributors are re warded for matching the ev entual consensus rather than for providing informati ve signals, they are encouraged to conform [ 26 , 35 , 31 , 62 , 43 ]. This is particularly problematic in crowd-sourced moderation systems like Community Notes, where vie wpoint div ersity can mitigate biases in content labeling [ 53 ]. Y et empirical evidence on ho w consensus-based auditing rules shape contrib utor behavior in deployed cro wd-sourced moderation systems remains limited. T o date, empirical work on Community Notes has primarily focused on downstream ef fects of note attachment on user behavior and information dif fusion. Studies show that posts with attached notes hav e lower engagement – measured in terms of likes, replies, vie ws, and reposts – with especially strong effects when notes are attached earlier in a post’ s lifecycle [ 48 , 24 , 18 , 11 , 6 ]. Other studies find that notes receiving broad contributor endorsement are perceiv ed as more trustworthy by users than platform-issued misinformation labels [ 19 ]. Partisan asymmetries in content moderation participation have also been documented: contributors are more likely to challenge counter-partisan content and to rate co-partisans’ notes as more helpful [ 5 , 45 , 28 ]. T ogether, this literature establishes that Community Notes can affect eng agement, trust, and partisan dynamics, while leaving open ho w platform incentiv e and eligibility rules shape contributor participation and co verage across topics. One dif ficulty that crowd-sourced moderation systems f ace is lack of a ground truth for estimated quantities lik e note helpfulness and user latent factors. There is a large literature that addresses the problem of how to infer contributor reliability in such settings. For example, in the cro wd-sourcing and labeling literature, work er–task models estimate worker accurac y and task dif ficulty from patterns of agreement and disagreement [ 17 , 44 , 29 , 30 ]. Relatedly , there is a body of literature on designing mechanisms to elicit truthful information without verified labels, including proper scoring rules and peer-prediction methods [ 25 , 35 , 43 , 64 , 47 ]. A common lesson from these works is that participants should be e valuated against targets not determined by themselves, reducing incenti ves to coordinate on a focal consensus [ 35 , 43 , 25 , 32 , 21 ]. These approaches formalize the idea that reliability should be learned from error structure, not simply from matching a majority vote. Methodologically , the Community Notes algorithm is closely related to latent-factor models and collaborati ve filtering in recommender systems, where one seeks to infer user and item attributes from sparse, noisy ratings [ 58 , 7 , 29 ]. A parallel line of work studies the design of aggregation rules that limit influence from noisy or adversarial users [ 46 ]. In statistics, classical results on weighted least squares show that in verse-v ariance weighting yields efficienc y gains under heteroskedastic noise [4, 12]. Our two-stage algorithm combines these principles and ideas from the literature by drawing on the logic of scoring contributors ag ainst targets not defined purely by ra w agreement with consensus, and using these scores to construct weights in a second-stage aggregation model. This combination links practical auditing in cro wd-sourced moderation to established ideas in statistical efficienc y and incentiv e-compatible information elicitation. X Community Notes In the Community Notes program, users can write short annotations (called notes) that provide context for potentially misleading or disputed content on the platform, and rate notes written by other users as Helpful , Somewhat Helpful , or Not Helpful . These ratings are aggregated using a matrix factorization algorithm that determines which notes are displayed publicly under the corresponding posts, while all remaining notes are kept hidden [ 65 ]. As a result, aggregation outcomes directly shape which information is surf aced and which contributors shape public discourse. Aggregation via Matrix F actorization For each user–note pair ( u, n ) , let r un ∈ { 0 , 0 . 5 , 1 } denote the observed rating, where Helpful , Somewhat Helpful , and Not Helpful responses are mapped to 1 , 0 . 5 and 0 , respectiv ely [ 65 ]. The platform assumes that ratings are modeled as r un = µ + h u + i n + f u · g n , (1) where µ is a global intercept, h u is a rater intercept capturing user u ’ s baseline agreeability (the tendency to mark notes as helpful rather than unhelpful, regardless of content), i n is a note intercept capturing the perceiv ed overall helpfulness of note n , and f u , g n ∈ R are latent rater and note factors whose product represents the ideological alignment between user and note. 3 A P R E P R I N T - M A R C H 2 0 , 2 0 2 6 The platform estimates these parameters by solving the regularized least-squares problem ˆ h u , ˆ i n , ˆ g n , ˆ f u , ˆ µ = arg min µ,h u ,i n ,f u ,g n X ( u,n ) observed ( r un − ˆ r un ) 2 + λ u X u ∥ h u ∥ 2 + ∥ f u ∥ 2 + λ n X n ∥ i n ∥ 2 + ∥ g n ∥ 2 . (2) where λ u , λ n are regularization parameters. In this formulation, the note intercept i n is the primary quantity of interest, as it captures ho w broadly helpful a note is across the user base and directly determines its eligibility for public display . Notes with estimated intercept ˆ i n ≥ 0 . 4 are classified as Helpful and sho wn publicly beneath the corresponding posts, while notes with ˆ i n < 0 . 4 are withheld from public display . Among these, notes with ˆ i n < − 0 . 05 are classified as Not Helpful and may generate negati ve feedback for both the note’ s author and raters who marked the note as helpful [67]. 6 Rating Impact In September 2022, Community Notes introduced the Rating Impact feature, which links rating aggregation to contributors’ continued participation. Rating Impact is a user-le vel score computed based on whether a contrib utor’ s ratings align with a note’ s e ventual Helpful / Not Helpful classification; agreement increases the score, while disagreement decreases it [ 41 , 40 ]. A user’ s Rating Impact score determines their ability to write Community Notes; ne w contrib utors must reach a minimum Rating Impact threshold before they can write notes. Writers hav e a separate Writing Impact score, which governs their ability to write notes on the platform; writers lose the ability to submit new notes if at least 3 of their 5 most recently written notes hav e been labeled Not Helpful after aggregation [14]. While the stated goal of this system is to surface notes from contributors with a track record of accuracy , it may create conformity incenti ves. T o gain or retain writing privile ges, contributors may feel pressure to align both their ratings and their note content with anticipated majority views, as repeated disagreement risks reduced influence and loss of access. Therefore, the September 2022 policy introduction, together with our use of October 1, 2022 as a conservati ve operational cutoff, pro vides a natural policy discontinuity for our study . Data Our analysis uses the publicly released Community Notes dataset, which contains the complete history of notes and ratings since Community Notes’ launch in 2021 [ 68 ]. 7 Our primary analysis window spans June 1, 2022 through May 31, 2023, covering se veral months on both sides of the rollout of Rating Impact. For each rating e vent, the dataset records the note identifier n , rater identifier u , timestamp, selected rating, a summary of the note content, and metadata about the associated post. The dataset does not include estimates of the latent parameters ( h u , i n , f u , g n ) , as these quantities are re-estimated by the platform as new data arri ve. T o study ho w the Rating Impact polic y affects contrib utor beha vior , we reconstruct the latent factors by running the platform’ s matrix factorization algorithm on the open-source ratings data. Specifically , we recover weekly estimates of ( h u , i n , f u , g n ) by applying the Community Notes aggreg ation algorithm to cumulativ e ratings data up to each week. W e implement the publicly released December 31, 2022 version of X’ s open-source matrix factorization code [ 65 , 55 ]. 8 As a robustness check, we additionally incorporate an impro ved platform’ s algorithm from the May 2025 release (see Supplementary Information, Section 2 for details). While both implementations share the same underlying matrix factorization frame work described earlier , they dif fer modestly in operational details such as regularization choices, handling of ties, and per-topic f actorizations. W e use both v ersions as a sensitivity check to v erify that our results are robust to reasonable v ariation in the estimation procedure. 6 The production scoring system has e volv ed over time; the formulation here reflects the core structure and thresholds rele vant for our analysis. Our empirical replication uses the corresponding open-source implementation released by platform X, though operational details such as confidence adjustments or per-topic f actorizations may differ . 7 The initial name for Community Notes was Birdwatch. 8 The code is publicly av ailable on the platform’ s GitHub repository . 4 A P R E P R I N T - M A R C H 2 0 , 2 0 2 6 Empirical Results W e document three empirical patterns in platform acti vity around the September 2022 introduction of the Rating Impact system, using October 1, 2022 as the analysis cutoff date 9 ; we refer to dates before October 1 as pre-rollout and dates after as post-rollout. First, we observe that minority-aligned raters shift their e valuations to ward the majority . Second, controv ersial content receiv es relativ ely lower engagement post-rollout, potentially contributing to fe wer visible annotations. Finally , the platform’ s latent-factor model exhibits reduced out-of-sample predicti ve performance post-rollout. These observ ations align with the hypothesis that raters behav ed strategically in response to the Rating Impact policy . The following subsections present each pattern in turn. Minority Behavior Shift First, we examine whether the introduction of the Rating Impact system altered how minority raters ev aluate notes. Recall that each user and note are assigned a latent factor , f u and g n , respectiv ely , that represent their ideology 10 . Then, for a pair of users and notes ( u, n ) , f u · g n represents their the rater -note alignment, and its magnitude measures the strength of that alignment. As proxies for behavioral change, (i) we study shifts in the distributions of rater and note factors, and (ii) changes in the predicti ve role of user –note alignment for Helpful ratings. (i) Latent Factor Distrib ution Shift Figure 1a plots the distrib ution of rater f actors in the pre-rollout and post-rollout periods. Relati ve to the pre-rollout period, the share of raters in the majority-aligned mode increases from 58.4% to 63.1%, while the share in the minority- aligned mode decreases from 41.6% to 36.2%. Within the minority group, the distribution also shifts toward zero: the mean absolute factor | f u | for minority-aligned raters declines from 0.522 (CI: ± 0.177) pre-rollout to 0.413 (CI: ± 0.215) post-rollout. This change reflects both a subset of minority-aligned raters mo ving closer to the center and a subset crossing ov er to the opposite alignment. A parallel pattern is visible in the note factor distrib ution. For note factors the mean absolute note factor | g n | changes from 0.451 (CI: ± 0.25) pre-rollout to 0.408 (CI: ± 0.233) post-rollout. This suggests that the notes produced by minority-aligned writers are, on av erage, positioned closer to the center of the latent-factor spectrum in the later period 11 . Note that user and note factors are computed relative to all user-note interactions on the platform. T o distinguish behavioral adaptation from compositional change due to entry of ne w raters, we compare factor shifts for two groups. W e call one group “Early Users"; this is the set of users who have been acti ve raters on the platform since before Oct. 1, 2022. The second group of users are “New Users"; this is the set of users who joined as ne w raters on X Community Notes between Oct. 1, 2022 and Jan. 1, 2023. W e compute the factor shift for Early Users and New Users, taking the difference between their first latent f actor after Jan. 1, 2023 and first latent factor after Oct. 1, 2022, for users where both factors e xist. W e then run a permutation test on the mean f actor shift (10,000 permutations). W e find that early users’ shifts were more negati ve than ne w users ( ∆ = − 0 . 053 , p < 0 . 001 ). This is another indicator that the Rating Impact policy influences user beha vior , causing users who experienced the polic y change to become more strategic in rating. (ii) User -Note Alignment T o assess whether the predicti ve role of user–note alignment changed at the Rating Impact rollout, we use Spearman’ s correlation coefficient as a proxy . W e use ratings data from Aug. 1, 2022 to Jan. 1, 2023, focusing on a fix ed cohort of 1 , 202 users who were acti ve on the platform both before and after the October 1, 2022 cutof f. For each period, we compute the Spearman correlation between the rater-note factor dot product and helpfulness ratings, taking the dif ference (post minus pre) as our test statistic. The correlation declined from 0 . 792 before the rollout to 0 . 525 , yielding an observ ed difference of − 0 . 267 . T o assess whether this decline is statistically significant, we conduct a permutation test with 1 , 000 iterations, randomly reassigning ratings to the pre/post groups while preserving the original group sizes, which gav e a p -value of 0 . 004 . 9 October 1 provides a conservati ve operational cutof f following the period when the relev ant eligibility rules began to take effect in our dataset. 10 These factors can theoretically be vectors b ut in the context of X’ s algorithm factors are scalar . 11 Note f actors partly reflect writer behavior b ut also depend on endogenous note entry and which notes recei ve suf ficient e valuation to be estimated. 5 A P R E P R I N T - M A R C H 2 0 , 2 0 2 6 (a) Rater factor change (b) Note factor change Figure 1: V isualization of rater and note factor distrib ution shift over time. In the Appendix, we conduct sensiti vity test these behavioral shifts with various additional metrics. T aken together , these patterns are consistent with the hypothesis that after the Rating Impact rollout, minority–aligned raters adjusted their ev aluations toward the anticipated consensus, reducing observ able disagreement. Annotations on Contro versial T opics Another indication of changing rater beha vior is the e xtent to which the y engage with contro versial vs. non-controversial notes; agreement with the majority is far more likely on non-controv ersial notes, thereby increasing the potential to boost a rater’ s Rating Impact score. T o study this, we compare annotation patterns for controversial and non- controv ersial notes before and after rollout of the Rating Impact system. W e define controv ersy at the note lev el using two complementary approaches: a topic-based classification and a factor-based classification. T opic-based classification. For topic-based classification, we assign each note to a content topic based on its summary text, using retrained version of X’ s public topic-assignment pipeline (details in Appendix C). W e then flag as controv ersial those topics that, in platform discourse and prior literature, are kno wn to be highly polarized (e.g., national politics, public health, geopolitical conflicts). This classification captures domain-lev el controversy , independent of individual note characteristics. W e additionally use Large Language Model (LLM)-based topic assignments as alternativ e classification procedures (details in Appendix C). F actor-based classification. For factor -based classification, we use the absolute v alue of the estimated note factor , | g n | , as a continuous measure of ideological alignment. In the Community Notes latent-factor model, notes with factors far from zero are those that recei ve systematically different ev aluations from different groups of raters. W e therefore classify a note as controv ersial if | g n | lies in the top quantile of the distribution. This approach captures instance-lev el controv ersy ev en within otherwise non-polarized topics. 6 A P R E P R I N T - M A R C H 2 0 , 2 0 2 6 Figure 2: Rolling Spearman correlation between rater-note factor dot product alignment and helpfulness ratings for the cohort of 1 , 202 early users, computed ov er a sliding windo w of 50 ratings sorted by date. The red dashed line marks the algorithmic change on October 1, 2022. The bold line shows a LO WESS smooth of the rolling correlation. Prior to the intervention, the correlation is relati vely stable, whereas after the interv ention, the correlation declines steadily . This is an observ ational indicator that the rollout of Rating Impact weakened the relationship between rater-note alignment and helpfulness ratings among the group of users who were activ e before the change. W e use both definitions in parallel to ensure rob ustness. The topic-based approach pro vides interpretability , while the factor -based approach is model-deriv ed and sensitiv e to within-topic variation. Our empirical results are qualitativ ely consistent across both definitions. In this section, we report results using the topic-based classification leaving factor -based results to Appendix C. Figure 3 presents the weekly share of tweets recei ving a first note that ultimately attains Helpful status before and after the rollout date, separately for contro versial and non-contro versial topics. For controv ersial topics, the helpful-share increases 12 from 0.061 with W ilson CI [0.044, 0.084] pre-rollout to 0.126 with W ilson CI [0.109, 0.146] post-rollout, a change of 6.5 percentage points. In contrast, non-controv ersial topics see an increase from 0.062 with W ilson CI [0.027, 0.138] to 0.199 with W ilson CI [0.151, 0.258], a change of 13.7 percentage points. W e use a difference-in-dif ferences (DiD) design to estimate the effect of the rollout of the Rating Impact system on note helpfulness for controversial vs. non-controversial notes. Using a symmetric 12 week band around Oct. 1, 2022, we see that the probability a non-controv ersial note is rated helpful increased by around 9 percentage points (95% CI [0.015, 0.161]) more than the probability a contro versial note is rated Helpful. These shifts are also reflected in the counts during this 12 week band before and after the cutof f date: the proportion of tweets recei ving at least one ne w note in contro versial topics decreases ( − 3 . 4 pp ), while the proportion of tweets recei ving at least one new note in non-controv ersial topics rises ( +3 . 4 pp ). This trend of reduced engagement on controversial topics is especially present in the minority group. In Appendix C, we run an additional DiD study on the proportion of ratings assigned to controversial notes for indi viduals in the minority group vs. non-minority group. W e find that, in a 12 week band around the rollout date, the proportion of controv ersial notes rated by minority users decreases 7.53 percentage points relati ve to the change observ ed for non-minority users ( p = 0 . 0284 ). W e emphasize that these comparisons are descriptiv e; they show a post-rollout div ergence in annotation outcomes between controv ersial and non-controv ersial topics, but the y do not by themselves identify the mechanism. Ho wev er , the consistent pattern across both classification schemes is in line with the hypothesis that, under the Rating Impact system, content on controv ersial topics receives fe wer helpful ratings and correspondingly fe wer surfaced annotations, while non-controv ersial topics receiv e more. 12 The definition of "helpfulness" was relaxed around the time of the Rating Impact rollout, so the helpfulness for both controversial and non-controv ersial notes increases [65]. 7 A P R E P R I N T - M A R C H 2 0 , 2 0 2 6 Figure 3: Pre–post change in the share of notes with final status Helpful by controv ersy category around the Rating Impact rollout (cutoff: 2022-10-01). Bars sho w the mean proportion in the approximately 20 weeks before (Pre, blue) and after (Post, orange) the cutoff; error bars are 95% CIs. T ext abo ve bars reports the Post–Pre dif ference in percentage points. The increase is lar ger for non-controversial notes (+13.7 pp) than for contro versial notes (+6.5 pp). W eeks (Pre, Post) Estimate 95% CI p -value (12, 0-12) 0.0882 [0.0152, 0.1612] 0.0179 (12, 13-26) 0.1185 [0.0311, 0.2059] 0.0079 T able 1: DiD Estimates. W indowed dif ference-in-differences estimates of the change in the weekly helpfulness rate dif ference between non-controv ersial and controversial content after the October 1, 2022 rollout. The outcome is the difference in weekly proportion of tweets receiving a note that is ultimately rated Helpful between tweets with contro versial vs. non-controv ersial notes. The gap increases by 8.8 pp in the first 12 weeks post-rollout and by 11.9 pp in weeks 13–26. Both effects are positi ve and statistically significant. Predicti ve Accuracy W e study ho w the predicti ve performance of the platform’ s latent-factor model changes around the rollout of Rating Impact. For each calendar week t , we fit the X Community Notes matrix factorization algorithm on cumulati ve data up to week t , and then e valuate two types of prediction error . The in-sample error measures the error for the model predictions on ratings in week t . The one-week-ahead error measures the error for model predictions on ratings in week t + 1 , restricting to rating pairs ( u, n ) where both the rater and note are observed in week t (see Appendix D for implementation details). Figure 4 plots the one-week-ahead mean squared error (MSE) over time, with the rollout week marked and T able 2 aggregates by period. The post-rollout period shows a higher and more volatile error than the pre-rollout period, with in-sample MSE increasing ov er 116% and one-week-ahead MSE increasing o ver 76% between pre- and post- rollout. Pre-Rollout Post-Rollout % Change In-sample 0.0488 (0.0327, 0.0648) 0.1057 (0.1005, 0.1109) +116.60% One-week-ahead 0.0927 (0.0600, 0.1254) 0.1634 (0.1429, 0.1839) +76.27% T able 2: Prediction Accuracy of Matrix Factorization. This table shows the a verage increase in in-sample MSE and one-week-ahead MSE of the matrix f actorization estimates, computed as av erages over three months pre- and post-rollout. Numbers in parentheses indicate 95% confidence intervals. A uditing by Predictiv e Stability: T wo-Stage W eighted Matrix F actorization The empirical patterns suggest that the platform’ s current auditing may create incentiv es for conformity that reduce div ersity in ratings and cov erage of controversial topics. 8 A P R E P R I N T - M A R C H 2 0 , 2 0 2 6 Figure 4: This figure shows the weekly mean squared error (MSE) for in-sample vs. out-of-sample predictions from the matrix factorization model. The MSE is computed as the squared difference between the observed rating outcomes and the model’ s predicted rating outcomes (pre-discretization). In-sample errors reflect fit to the same week’ s ratings, while out-of-sample errors use factors estimated from week t to predict ratings in week t + 1 . The vertical dashed line marks the Rating Impact analysis date we use. W e therefore propose an alternati ve rule that separates auditing from agreement. Follo wing well-established precedent in the literature, we propose an alternati ve weighting method, which we refer to as weighted matrix f actorization, that targets r ater r eliability directly rather than agreement with the final note-status. The method consists of the following steps: First stage: Compute matrix factorization estimates ˆ µ, ˆ h u , ˆ i n , ˆ f u , ˆ g n as in (2) Second stage: 1. Compute r esiduals: For each observ ed user-note pair ( u, n ) , compute the first stage residual: e (1) un = r un − ˆ µ − ˆ h u − ˆ i n − ˆ f u · ˆ g n . 2. Estimate variance: For each user u , estimate the empirical v ariance of their ratings as ˆ σ 2 u = 1 | N ( u ) | X n ∈ N ( u ) e (1) un 2 where N ( u ) is the set of notes that user u has rated. 3. Refit inter cepts & factors: Run a final weighted regression: arg min ˜ µ, ˜ h u , ˜ i n , ˜ f u , ˜ g n X ( u,n ) observed 1 ˆ σ 2 u r un − ˜ µ − ˜ h u − ˜ i n − ˜ f u · ˜ g n 2 . This step adjusts the intercepts after incorporating the user variance terms. In principle, one could also recalculate the ˆ σ 2 u and iterate. The in verse-v ariance weight 1 / ˆ σ 2 u measures how predictable a rater’ s beha vior is, giv en their latent position. Because weights are based on internal consistency rather than agreement with other raters, consistent minority raters keep their influence ev en when they di ver ge from the majority . W e expect this approach to: • Mitigate conf ormity incentives: W eights depend on consistency , not consensus alignment. • Preser ve minority contributions: Consistent raters from minority vie wpoints are not penalized for disagree- ment. • Impro ve pr edictive perf ormance: As in WLS, accounting for heterosk edasticity should reduce mean squared error in prediction. 9 A P R E P R I N T - M A R C H 2 0 , 2 0 2 6 Empirical Predicti ve Perf ormance T o test the performance of our weighted matrix factorization algorithm, we run it on the Community Notes dataset modifying the Community Notes matrix factorization algorithm. W e use ratings data from Jan. 1, 2023 to June 1, 2024. In particular, the ratings data from Jan. 1, 2023-July 1, 2023 serves as a w arm start for the matrix factorization algorithm, and we e valuate our method on the ratings data from July 1, 2023-June 1, 2024. Detailed implementation description is giv en in the Appendix. In Figure 5a and 5b we compare the mean absolute residual and the median absolute residual on the one-week-ahead predictions from the matrix factorization approach vs. the two-stage approach. Using our proposed two-stage approach, the mean absolute residual is 5.73% lower on a verage, and the median absolute residual is 27.99% lo wer on av erage. (a) Mean absolute residuals. (b) Median absolute residuals. Figure 5: W eekly out-of-sample (one-week-ahead) predictions for residuals estimated using matrix f actorization vs. two-stage approach. Figure 5a shows the mean absolute residuals, with error bars, for each weeks’ predictions. Figure 5b shows the median absolute residuals for each weeks’ predictions. A Beha vioral Model of Strategic Conformity What counts as “truth” in content moderation is not straightforw ard. Whether a note is helpful can depend on context, values, and vie wpoint, and in many settings there is no exogenous ground truth that the platform can audit against. Y et deployed systems necessarily act as if there is a stable truth to infer . In particular , both X’ s Community Notes model and related designs (including Meta’ s) are built around an implicit premise: contributors receiv e noisy priv ate signals 10 A P R E P R I N T - M A R C H 2 0 , 2 0 2 6 about a latent underlying e valuation (as in Equation 1), and aggre gation can recov er that latent helpfulness of a note when signals are div erse and independent. In this section, we take that premise at face value , and assume that contributors truly do observe latent signals that fit the platform’ s modeling assumptions. W e then ask even if this latent-signal model were correct, would a consensus-based auditing system recov er the underlying evaluation once contrib utors anticipate the platform’ s eventual consensus? Our analysis shows that it does not. When contributors are rew arded or penalized based on agreement with anticipated consensus, they have incenti ves to report strategically rather than reporting their priv ate ev aluations (signals) about the content. This systematically biases the platform’ s inferred quantities, particularly on contro versial content where conformity pressure is strongest. Finally , we show ho w shifting auditing from agr eement with the majority to out-of- sample stability of r esidual behavior can remov e the direct incenti ve to match the anticipated platform outcome and giv es an unbiased estimator for helpfulness of a note. Model W e consider a system with U users and N notes where users u rate notes n that appear on their feeds. Follo wing the latent-signal interpretation implicit in matrix factorization [ 55 ], suppose each user , suppose that each user u observes a latent signal s un on a note n with additiv e noise ϵ un r ⋆ un = s un + ϵ un , s un = µ + h u + i n + f u g n where E [ ϵ un ] = 0 , E [ ϵ 2 un ] := σ 2 u ∈ (0 , ∞ ) . The errors ϵ un are independent across users u and i.i.d. for the same u . As in (1) , the main quantity of interest is i n , which captures the perceiv ed ov erall helpfulness of note n . Here, µ is a global intercept, and h u is a rater intercept capturing user u ’ s baseline tendency to rate notes as helpful rather than unhelpful, independent of the note’ s content. The latent v ariables f u , g n ∈ R are user and note factors, respecti vely , and their product f u g n captures the extent to which a note is vie wed as more or less helpful by users with different latent positions. The platform does not observe the latent quantity r ⋆ un directly . Instead, it observes reported ratings, which we denote by a un , and fits the matrix f actorization model in (2) to these reports using ridge-re gularized least squares. Specifically , the platform computes arg min µ,h,i,f ,g X ( u,n ) ∈ Ω a un − µ − h u − i n − f u g n 2 + λ h ∥ h ∥ 2 2 + λ i ∥ i ∥ 2 2 + λ f ∥ f ∥ 2 2 + λ g ∥ g ∥ 2 2 , (3) where Ω denotes the set of observed ratings. Let ˆ µ, ˆ h u , ˆ i n , ˆ f u , ˆ g n denote the resulting estimates. Modeling user’ s behavior Consensus-based auditing ties a contrib utor’ s future standing (eligibility or influence) to whether their ratings agree with the platform’ s eventual aggre gate outcome. At the time of rating, howe ver , that outcome has not yet been realized. Contributors therefore form e xpectations about it using information that is broadly observable on the platform, including past notes and ratings, visible patterns in prior outcomes, and the aggregation rule itself. These expectations may dif fer across contributors, reflecting dif ferences in attention or inference. Still, because they are formed from largely shared information, it is natural to model them as noisy forecasts of a common note-le vel consensus target. Definition 1. Let c n ∈ [0 , 1] be a scalar metric that denotes the contr oversy of the note n . F or a note n , let m n denote the anticipated platform consensus, that is, the outcome contributor s expect the platform eventually to assign to that note. W e leave m n unrestricted. It may reflect a simple heuristic, such as av eraging visible prior ratings, or a more sophisticated forecast of the score implied by the platform’ s aggregation rule. Contributor-specific differences in attention or inference are captured as additional noise around this target. Specifically , contributor u observes ˜ m un = m n ( c n ) + ϵ m un where ϵ m un captures heterogeneity in perceptions across users with E [ ϵ m un | f u , g n , c n , ρ n ] = 0 and V ar( ϵ m un | f u , g n , c n , ρ n ) = σ 2 m,u ( c n ) . Allowing σ 2 m,u ( · ) to depend on c n captures the idea that forecasts of the platform outcome may be noisier on more controv ersial notes. 11 A P R E P R I N T - M A R C H 2 0 , 2 0 2 6 W e next model how contributors choose ratings. A contrib utor u chooses a latent report a un ∈ R on note n by balancing two objecti ves: (i) reporting their priv ate signal r ⋆ un against (ii) aligning with what they e xpect the platform to treat as the consensus, which we denote by ˜ m un . The first term captures truthful reporting. The second captures the incentive created by consensus-based auditing: contributors anticipate that future standing on the platform (such as eligibility or influence) depends on whether their ratings agree with the platform’ s ev entual aggregate outcome. Deviating from the anticipated outcome therefore carries an expected penalty . W e allo w this tradeof f to depend on the controv ersy lev el c n . On more controversial notes, the incenti ve to anticipate the platform’ s outcome is plausibly stronger , so the weight placed on the contrib utor’ s own signal is weaker . W e capture this expected downstream consequence of disagreement using a smooth quadratic loss. Similar tensions between pri v ate information and social conformity arise in models of social learning and information cascades [9, 49, 1, 2]. Definition 2 (User’ s Utility) . User u ’ s utility for a r eport a ∈ R on note n is defined to be U un ( a | r ⋆ un , c n ) = − ρ ( c n ) 2 ( a − r ⋆ un ) 2 − 1 − ρ ( c n ) 2 ( a − ˜ m un ( c n )) 2 + ζ un . (4) Her e, ρ ( · ) ∈ [0 , 1] is conformity weight that is weakly decr easing in c n ; it r eflects the intuition that as the contr oversy of a note decreases, user s are mor e inclined to r eport their true signal, and as the contr oversy of a note increases, users ar e mor e inclined to conform to the majority . ζ un is an idiosyncratic payof f shock (mean zer o and finite variance, i.i.d. acr oss users u and notes n ) that generates r esidual noise in choices independent of action a 13 . W e model the expected downstream consequence of disagreement using a smooth quadratic loss, which serves as a reduced-form approximation to the platform’ s discrete eligibility and impact rules. Similar tensions between pri v ate information and social conformity arise in models of social learning and information cascades Maximizing a user’ s utility (4) immediately implies that the optimal latent report is the conv ex combination a ⋆ un = ρ ( c n ) r ⋆ un + (1 − ρ ( c n )) ˜ m un ( c n ) . (5) Thus, reports place weight ρ ( c n ) on the contributor’ s pri vate signal and weight 1 − ρ ( c n ) on the anticipated platform consensus. When ρ ( c n ) = 1 , the contributor reports their priv ate signal exactly; we refer to this case as truthful r eporting . Because ρ ( · ) is weakly decreasing in controversy , more controversial notes lead contributors to place relativ ely less weight on their own signals and more weight on the anticipated platform outcome. Results In this section, we present our main theoretical results. Proofs and technical regularity conditions are giv en in Appendix E. Throughout, we work in the setting where the number of users and notes are gro wing at the same asymptotic rate. In reality , the platform observes only a subset of user–note interactions, which we model as missing-completely-at- random sampling: each rating a un is observed independently with probability p ∈ (0 , 1] . W e also assume that the true { ( h u , f u ) } u and { ( i n , g n ) } u are bounded and i.i.d., with finite v ariance and that all intercept and factor terms are mutually independent. In addition, we assume that h u , i n , g n are mean zero, but that E [ f u ] = µ f , for some known positiv e constant µ f ; this allows us to identify a majority and minority group of users. The boundedness assumption is typically observed in real-life data, since user and item attributes are generally finite or are normalized by construction. Finally , we assume mean-zero sub-Gaussian noise terms ϵ un and ϵ m un independent of the latent variables. Formal regularity conditions are gi ven in Appendix E Assumption 1. Private-Signal Reporting ( ρ = 1 ) W e begin with the benchmark case ρ ( · ) ≡ 1 , so that contributors report their priv ate signals and a ⋆ un = r ⋆ un . In this setting the platform observes noisy realizations of the latent-signal model itself, and the matrix factorization recov ers note helpfulness. This result extends the analogous result in the interactiv e fixed-ef fects framew ork in [ 8 ] to our setting with missing data using techniques from the matrix completion and interactiv e fixed-ef fects literature [13, 36, 51]. Theorem 0.1. Assume U, N → ∞ and that E [ f u ] = µ f wher e µ f is known. Then, the estimate for note helpfulness is consistent. In particular ˆ i n p − → i 0 n . That is, in the truthful r e gime, rank-1 MF r ecovers the true note helpfulness. 13 In X’ s model, reports are discretized to { 0 , 0 . 5 , 1 } , so we interpret user actions a as a latent inde x; the observed rating maps negati ve v alues of a to 0 , positiv e values to 1 , and 0 to 0 . 5 . Our MF is fit to the observed ratings, while the analysis proceeds on the latent index. 12 A P R E P R I N T - M A R C H 2 0 , 2 0 2 6 Strategic Conformity ( ρ < 1 ) Next, we turn to analyzing the case when ρ ( · ) ≡ 1 , in which contributors place positive weight on the anticipated platform consensus. In this regime, the follo wing theorem tells us that the estimate of note helpfulness ˆ i n will be biased, and in particular will not conv erge to the model-implied helpfulness i n . For the next theorem, we assume that the anticipated platform consensus m n varies across notes and has finite variance; formal re gularity conditions are gi ven in Appendix E Assumption 2. Theorem 0.2. Suppose ρ ( · ) ≡ 1 . As U, N → ∞ , ther e exists a random variable i ∞ n such that ˆ i n p − → i ∞ n , and for at least one n , i ∞ n = i 0 n . The source of this bias comes from the conformity incentives. When ρ ( c n ) < 1 , the platform no longer observes contributors’ latent signals directly . Instead, it observes reports that combine the pri vate signal r ⋆ un with the anticipated consensus tar get m n . Thus, matrix factorization is applied to conformity-distorted signals rather than to the latent signal matrix itself. T o see where the distortion enters, write δ n := m n − ( µ + i n ) . The quantity δ n measures how far the anticipated platform consensus deviates from the note-side latent component of the signal. Under users’ strategic reporting, the observed report matrix dif fers from the latent signal matrix by a note-side perturbation proportional to (1 − ρ ( c n )) δ n . The platform nevertheless fits the same matrix factorization model. Consequently , the recovered parameters correspond to the best rank-1 approximation of this distorted matrix. In particular , the bias is gov erned by the projection of the conformity term (1 − ρ ( c n )) δ n onto the note-factor direction g n . Whenev er this projection is nonzero on a nontrivial set of notes, the resulting factorization con verges to a parameter i ∗ n which is different from the true note helpfulness i 0 n . Furthermore, we can characterize the extent to which user factors will shift in this regime due to strategic behavior . Note that the latent factors f u and g n are unique up to a global constant scaling factor . Multiplying all note factors by c and user factors by c − 1 still leads to a valid solution for solving the matrix factorization optimization problem gi ven by (2). Thus, we use the follo wing normalization for identification. Define the (estimated) residualized ratings to be y un := a ⋆ un − ˆ µ − ˆ h u − ˆ i n where ˆ µ, ˆ h u , ˆ i n are giv en by solving the least squares problem (2). The latent factor normal equations are gi ven by ˆ f u = P n ω un y un g n P n ω un g 2 n , ˆ g n = P u ω un y un f u P u ω un f 2 u . (6) The identifiability conditions on the matrix factorization estimates allow us to determine the sign and scale of the factor estimates. Our next result states ho w the estimate of the user factor behav es as a function of ρ ( c n ) , m ( c n ) , and g n in expectation. Theorem 0.3. Let ρ ≡ 1 . Consider the setting of Theor em E.8, and suppose that the true note factors { g n } n ar e known. Let ˆ µ, ˆ h u , ˆ i n , ˆ f u denote the solution to (2) . Then E [ ˆ f u | f u , g n , c n ] = w 1 f u + c (1 − w 1 ) + o p (1) , wher e w 1 = P n ρ n g 2 n P n g 2 n . Theorem 0.3 tells us that E [ ˆ f u | f u ] is an af fine transformation of the user’ s truth f u . As the probability of encountering controv ersial notes increases (more notes with c n = 1 ), w 1 decr eases . Thus, the estimated user f actor places less weight on the indi vidual’ s true position and more weight on the aggregate conformity distortion. In particular , the bias is driv en by the dependence of ratings on anticipated consensus, rather than by estimation error in the note f actors. In practice, the g n n are themselves estimated, so additional distortion may arise from estimation error , potentially amplifying the effect described abo ve. Theorem 0.3 also implies the follo wing proposition, telling us which members of the minority are more susceptible to measurement errors in their latent factor estimations. Let the true minority be { u : f u < 0 } with share π − true := Pr( f u < 13 A P R E P R I N T - M A R C H 2 0 , 2 0 2 6 0) ∈ (0 , 1 2 ) , since we assume that f u has positi ve expected value. Because the latent-factor sign is globally arbitrary , the theoretical section uses a normalization opposite to the empirical sections. Empirically , we flip signs so that the majority is negati ve and the minority positive; all sign-based claims are in v ariant under the global transformation ( f , g ) → ( − f , − g ) . Proposition 0.4. Consider the setting of Theorem 0.3. Then, E [ ˆ f ∗ u | f u , g n , c n ] > 0 if and only if f u > − c (1 − w 1 ) w 1 . In particular , the minority slice ( − c (1 − w 1 ) w 1 , 0) is mapped to positive estimates. Proposition 0.5. Consider the setting of Theor em 0.3. Let F be the CDF of f u . Assume that F is continuous with no atom at 0 . Then, the estimated minority shar e π − est := Pr( ˆ f u < 0 | f u , g n , c n ) satisfies π − est = F − c (1 − w 1 ) w 1 < F (0) + o (1) = π − true + o (1) , and π − est is (weakly) decr easing in w 2 and (weakly) incr easing in w 1 . Remark 0.6. One can carry a similar computation for the note factors E [ˆ g n | f u , g n , c n ] to get E [ ˆ g n | f u , g n , c n ] ≈ g n ρ n 1 − c P u f u P u f 2 u . If user opinions ar e balanced ( E ( f u ) = 0 ), then the expected estimate E [ ˆ g n | f u , g n , c n ] is pr oportional to g n with a coefficient that depends on ρ n ( c n ) . In particular , higher value of c n (contr oversial notes) reduce this coefficient, shrinking the note factor towar d zer o. Statistical guarantee for the tw o-stage estimator W e no w turn to the alternativ e auditing rule studied in the empirical section. Recall two-stage algorithm: the platform first fits the standard unweighted regularized matrix factorization model, and then uses the resulting residuals to estimate contributor -specific noise le vels. It then refits the same model using in verse residual v ariance weights. This is the matrix-factorization analogue of feasible generalized least squares and is closely related to weighted lo w-rank approximation [4, 50, 56]. In the first stage, the platform fits the unweighted re gularized model in (3) and obtains estimates ( ˆ µ, ˆ h, ˆ i, ˆ f , ˆ g ) . For each contributor u , let S u := { n : ( u, n ) ∈ Ω } and N u := | S u | , and define the first-stage residual variance estimate ˆ σ 2 u := 1 N u X n ∈ S u a un − ˆ µ − ˆ h u − ˆ i n − ˆ f u ˆ g n 2 . (7) In the second stage, the platform sets ˆ w u := 1 ˆ σ 2 u and refits the same regularized rank-1 model using contributor -specific weights. More generally , for any bounded positiv e weights w = { w u } , define the weighted regularized matrix factorization problem arg min ˜ µ, ˜ h u , ˜ i n , ˜ f u , ˜ g n X ( u,n ) observed w u r un − ˜ µ − ˜ h u − ˜ i n − ˜ f u · ˜ g n 2 . (8) W e write ˜ i ts n for the note-helpfulness estimate produced by (8) with weights ˆ w u = 1 / ˆ σ 2 u . Our next theorem shows that, among estimators obtained in this way , the estimator with weights w u = 1 / ˆ σ 2 u is consistent and has the lowest asymptotic v ariance. Theorem 0.7. Assume that ρ ≡ 1 and that µ f is known. Then the solution to (8) with weights 1 / ˆ σ 2 u , ˜ i ts n , reco vers consistent estimates of i n , i.e., as U, N → ∞ ˜ i ts n p − → i 0 n . 14 A P R E P R I N T - M A R C H 2 0 , 2 0 2 6 Mor eover , among all other solutions of (8) ˜ i n with positive, finite weights w u ∈ (0 , ∞ ) , aV ar( ˜ i ts n ) ≤ aV ar( ˜ i n ) . Her e, for a scalar estimator X m , aV ar( X m ) = lim m →∞ m · V ar( X m ) . This theorem gi ves a statistical interpretation of contributor impact under the redesigned rule. In the two-stage estimator , contributors are weighted by the in verse of their residual v ariance, so contributors whose e valuations are more stable relativ e to the fitted latent structure receiv e greater influence in the second stage. In this sense, the redesign audits contributors by r esidual stability rather than by agreement with the platform’ s e ventual consensus. This is the key contrast with consensus-based auditing. Under the current rule implemented in Community Notes, contributor influence is tied to whether ratings align with the platform’ s final aggregate outcome. Under the two-stage rule, influence is instead tied to the statistical precision of a contributor’ s ev aluations within the latent-factor model. The theorem shows that, under pri vate-signal reporting, this weighting rule yields a consistent estimator and attains the lowest asymptotic v ariance among weighted matrix factorization estimators in this class. Whether the same rule also changes contributors’ strategic incenti ves is a separate behavioral question. The result here suggests an alternati ve notion of contrib utor rating impact based on r esidual stability rather than agreement with the platform’ s eventual consensus. Conclusion Crowdsourced moderation systems are often motiv ated by the idea that div erse, independent ev aluations can be aggregated into reliable judgments. Our findings sho w that this promise depends not only on how ratings are aggregated, but also on how contributors are audited. In X’ s Community Notes, auditing contrib utors by whether they agree with the platform’ s eventual consensus creates incenti ves to anticipate that consensus rather than to provide independent ev aluations. Empirically , this is associated with strategic conformity by minority contributors, reduced engagement on controv ersial content, and lower predicti ve performance of the platform’ s latent-factor model. Our theoretical analysis clarifies why this occurs. Even if one grants the platform’ s latent-signal model, consensus-based auditing alters the object being measured: once contributors partially conform to the anticipated platform outcome, matrix factorization no longer aggregates independent ev aluations alone. Instead, it recov ers a conformity-distorted projection of those e valuations. These observations also suggest a dif ferent design principle. Rather than re warding contributors for matching the eventual majority outcome, platforms can ev aluate them using targets that do not mechanically fav or conformity . Moti vated by this idea, we study a two-stage procedure that weights contributors by the stability of their residual behavior rather than by agreement with the final consensus. In the Community Notes data, this approach improv es out-of-sample predictiv e performance while allowing informati ve disagreement to retain influence. More broadly , our results suggest that cro wdsourced moderation should be designed to preserve independence, especially on controv ersial content where finding misinformation is most v aluable. Systems that rew ard agreement with the final aggregate may appear to improv e reliability , but can instead suppress the disagreement needed for accurate aggreg ation. In en vironments without externally v erifiable ground truth, the design of the auditing rule is therefore not a peripheral implementation detail; it is part of the core of the system. Acknowledgments KH was partially supported by the National Science Foundation under grant DGE 2146752. 15 A P R E P R I N T - M A R C H 2 0 , 2 0 2 6 References [1] Daron Acemoglu, Munther A. Dahleh, Ilan Lobel, and Asuman Ozdaglar . Bayesian learning in social networks. The Revie w of Economic Studies , 78(4):1201–1236, 2011. [2] Daron Acemoglu, Ali Makhdoumi, Azarakhsh Malekian, and Asu Ozdaglar . Fast and slow learning from re views. Econometrica , 90(2):775–810, 2022. [3] Daron Acemoglu, Asuman Ozdaglar , and James Siderius. A model of online misinformation. Review of Economic Studies , 91(6):3117–3150, 2024. [4] A. C. Aitken. Iv .—on least squares and linear combination of observ ations. Pr oceedings of the Royal Society of Edinbur gh , 55:42–48, 1936. [5] Jennifer Allen, Cameron Martel, and David G Rand. Birds of a feather don’t fact-check each other: Partisanship and the ev aluation of ne ws in twitter’ s birdwatch crowdsourced f act-checking program. In Pr oceedings of the 2022 CHI Confer ence on Human F actors in Computing Systems , CHI ’22, New Y ork, NY , USA, 2022. Association for Computing Machinery . [6] Jennifer Allen, Duncan J W atts, and David G Rand. Quantifying the impact of misinformation and v accine- skeptical content on facebook. Science , 384(6699):eadk3451, 2024. [7] Xavier Amatriain, Josep Pujol, and Nuria Oliv er . I like it... i like it not: Evaluating user ratings noise in recommender systems, 06 2009. [8] Jushan Bai. Panel data models with interacti ve fix ed effects. Econometrica , 77(4):1229–1279, 2009. [9] Abhijit V . Banerjee. A Simple Model of Herd Behavior*. The Quarterly Journal of Economics , 107(3):797–817, August 1992. _eprint: https://academic.oup.com/qje/article-pdf/107/3/797/5298496/107-3-797.pdf. [10] Md Momen Bhuiyan, Amy X. Zhang, Connie Moon Sehat, and T anushree Mitra. Inv estigating differences in crowdsourced ne ws credibility assessment: Raters, tasks, and expert criteria. Pr oc. A CM Hum.-Comput. Interact. , 4(CSCW2), October 2020. [11] Nadia M Brashier , Gordon Pennycook, Adam J Berinsky , and Da vid G Rand. T iming matters when correcting fake ne ws. Pr oceedings of the National Academy of Sciences , 118(5):e2020043118, 2021. [12] Raymond J. Carroll and David Ruppert. Robust estimation in heteroscedastic linear models. The Annals of Statistics , 10(2):429–441, 1982. [13] Y uxin Chen, Y uejie Chi, Jianqing Fan, Cong Ma, and Y uling Y an. Noisy matrix completion: Understanding statistical guarantees for con vex relaxation via nonconv ex optimization. SIAM journal on optimization , 30(4):3098– 3121, 2020. [14] Community Notes Guide – X. Locking and unlocking the ability to write notes. https://communitynotes.x. com/guide/en/contributing/writing- ability , n.d. Accessed: 2025-08-30. [15] Community Notes Guide – X. Rating and writing impact. https://communitynotes.x.com/guide/en/ contributing/writing- and- rating- impact , n.d. Accessed: 2025-08-30. [16] W eijia Dai, Ginger Jin, Jungmin Lee, and Michael Luca. Aggregation of consumer ratings: an application to yelp. com. Quantitative Marketing and Economics , 16(3):289–339, 2018. [17] Alexander Philip Dawid and Allan M Skene. Maximum likelihood estimation of observer error-rates using the em algorithm. Journal of the Royal Statistical Society: Series C (Applied Statistics) , 28(1):20–28, 1979. [18] Chiara Patricia Drolsbach and Nicolas Pröllochs. Diffusion of community fact-checked misinformation on twitter . Pr oceedings of the A CM on Human-Computer Interaction , 7(CSCW2):1–22, 2023. [19] Chiara Patricia Drolsbach, Kirill Solov ev , and Nicolas Pröllochs. Community notes increase trust in fact-checking on social media. PNAS ne xus , 3(7):pgae217, 2024. [20] Erik Eyster and Matthew Rabin. Naiv e herding in rich-information settings. American economic journal: micr oeconomics , 2(4):221–243, 2010. [21] Boi Faltings and Goran Radano vic. Game theory for data science: Eliciting truthful information . Springer Nature, 2022. [22] V iv ek Farias, Andrew A Li, and Tian yi Peng. Uncertainty quantification for low-rank matrix completion with heterogeneous and sub-e xponential noise. In International Confer ence on Artificial Intellig ence and Statistics , pages 1179–1189. PMLR, 2022. [23] Francis Galton. V ox populi, 1907. 16 A P R E P R I N T - M A R C H 2 0 , 2 0 2 6 [24] Y ang Gao, Maggie Mengqing Zhang, and Huaxia Rui. Can crowdchecking curb misinformation? evidence from community notes. Information Systems Researc h , 2025. [25] T ilmann Gneiting and Adrian E Raftery . Strictly proper scoring rules, prediction, and estimation. Journal of the American Statistical Association , 102(477):359–378, 2007. [26] Eric Horvitz. Incentiv es and truthful reporting in consensus-centric crowdsourcing. T echnical report, Microsoft Research, 2012. [27] Matthew Jackson and Stephen Nei. Finding the wise and the wisdom in a cro wd: Estimating underlying qualities of revie wers and items. American Economic Revie w , 111(3):1001–1024, 2021. [28] Uku Kangur , Roshni Chakraborty , and Rajesh Sharma. Who checks the checkers? exploring source credibility in twitter’ s community notes. arXiv pr eprint arXiv:2406.12444 , 2024. [29] David Kar ger , Sew oong Oh, and Dev avrat Shah. Iterative learning for reliable cro wdsourcing systems. Advances in neural information pr ocessing systems , 24, 2011. [30] Hisashi Kashima, Satoshi Oyama, Hiromi Arai, and Junichiro Mori. Trustw orthy human computation: a survey . Artificial Intelligence Revie w , 57(12):322, 2024. [31] Y uqing K ong, Katrina Ligett, and Grant Schoenebeck. Putting peer prediction under the micro (economic) scope and making truth-telling focal. In International Confer ence on W eb and Internet Economics , pages 251–264. Springer , 2016. [32] Y ang Liu and Y iling Chen. Machine-learning aided peer prediction. In Pr oceedings of the 2017 ACM Confer ence on Economics and Computation , EC ’17, page 63–80, Ne w Y ork, NY , USA, 2017. Association for Computing Machinery . [33] Jan Lorenz, Heiko Rauhut, Frank Schweitzer , and Dirk Helbing. How social influence can undermine the wisdom of crowd ef fect. Pr oceedings of the national academy of sciences , 108(22):9020–9025, 2011. [34] Meta Platforms, Inc. Introducing community notes — adding context to posts. https://www.meta.com/technologies/community- notes/?srsltid= AfmBOoqGYuB01StOhwvVzji0toKNwMWsuS3OurkU7X3c5L2AvsifdBYC , 2025. Accessed: 2025-11-17. [35] Nolan Miller , Paul Resnick, and Richard Zeckhauser . Eliciting informativ e feedback: The peer-prediction method. Management Science , 51(9):1359–1373, 2005. [36] Hyungsik Roger Moon and Martin W eidner . Linear regression for panel with unkno wn number of factors as interactiv e fixed ef fects. Econometrica , 83(4):1543–1579, 2015. [37] Lev Muchnik, Sinan Aral, and Sean J T aylor . Social influence bias: A randomized experiment. Science , 341(6146):647–651, 2013. [38] Elisabeth Noelle-Neumann. The Spiral of Silence: A Theory of Public Opinion . Uni versity of Chicago Press, 1974. [39] Juan Perdomo, T ijana Zrnic, Celestine Mendler-Dünner , and Moritz Hardt. Performativ e prediction. In Interna- tional Confer ence on Machine Learning , pages 7599–7609. PMLR, 2020. [40] Sarah Perez. T witter expands its crowdsourced fact-checking program Birdwatch ahead of US midterms, September 2022. Accessed: 2025-09-16. [41] Sarah Perez. T witter is making its crowdsourced f act-checks visible to all U.S. users with Birdwatch expansion, October 2022. Accessed: 2025-09-16. [42] Sarah Perez. Bluesky adds ‘anti-toxicity’ tools and aims to integrate ‘a community notes-like’ feature in the future. T echCrunch , 2024. Accessed: 2025-11-17. [43] Drazen Prelec. A bayesian truth serum for subjectiv e data. Science , 306(5695):462–466, 2004. [44] V ikas C Raykar , Shipeng Y u, Linda H Zhao, Gerardo Hermosillo V aladez, Charles Florin, Luca Bogoni, and Linda Moy . Learning from crowds. Journal of machine learning r esearc h , 11(4), 2010. [45] Thomas Renault, Mohsen Mosleh, and David G Rand. Republicans are flagged more often than democrats for sharing misinformation on x’ s community notes. Pr oceedings of the National Academy of Sciences , 122(25):e2502053122, 2025. [46] Paul Resnick and Rahul Sami. The influence limiter: prov ably manipulation-resistant recommender systems. In Pr oceedings of the 2007 A CM Confer ence on Recommender Systems , RecSys ’07, page 25–32, New Y ork, NY , USA, 2007. Association for Computing Machinery . 17 A P R E P R I N T - M A R C H 2 0 , 2 0 2 6 [47] V ictor Shnayder , Arpit Agarwal, Rafael Frongillo, and Da vid C Parkes. Informed truthfulness in multi-task peer prediction. In Pr oceedings of the 2016 A CM Conference on Economics and Computation , pages 179–196, 2016. [48] Isaac Slaughter , Axel Pe ytavin, Johan Ugander , and Martin Sav eski. Community notes reduce engagement with and diffusion of false information online. Proceedings of the National Academy of Sciences , 122(38):e2503413122, 2025. [49] Lones Smith and Peter Sørensen. Pathological outcomes of observ ational learning. Econometrica , 68(2):371–398, 2000. [50] Nathan Srebro and T ommi Jaakkola. W eighted low-rank approximations. In Proceedings of the 20th international confer ence on machine learning (ICML-03) , pages 720–727, 2003. [51] Liangjun Su, Fa W ang, and Y iren W ang. Estimation and inference for unbalanced panel data models with interactiv e fixed ef fects. Journal of Econometrics , 255:106222, 2026. [52] James Suro wiecki. The wisdom of cr owds . V intage, 2005. [53] Jacob Thebault-Spieker , Sukrit V enkatagiri, Naomi Mine, and Kurt Luther . Div erse perspectives can mitigate political bias in crowdsourced content moderation. In Pr oceedings of the 2023 A CM Confer ence on F airness, Accountability , and T ranspar ency , pages 1280–1291, 2023. [54] T ikT ok Pte. Ltd. Rolling out tiktok footnotes in the u.s. https://newsroom.tiktok.com/ rolling- out- tiktok- footnotes- in- the- us?lang=en , 2025. Accessed: 2025-11-17. [55] T witter , Inc. Community notes: Documentation and source code powering community notes. https://github. com/twitter/communitynotes , 2022. [56] Madeleine Udell, Corinne Horn, Reza Zadeh, and Stephen Boyd. Generalized low rank models. F oundations and T rends in Mac hine Learning , 9(1):1–118, 2016. [57] Sander V an Der Linden. Misinformation: susceptibility , spread, and interventions to immunize the public. Natur e medicine , 28(3):460–467, 2022. [58] Benjamin V an Roy and Xiang Y an. Manipulation robustness of collaborativ e filtering. Management Science , 56(11):1911–1929, 2010. [59] Roman V ershynin. Introduction to the non-asymptotic analysis of random matrices., 2012. [60] Michela Del V icario, Alessandro Bessi, Fabiana Zollo, Fabio Petroni, Antonio Scala, Guido Caldarelli, H. Eugene Stanley , and W alter Quattrociocchi. The spreading of misinformation online. Proceedings of the National Academy of Sciences , 113(3):554–559, 2016. [61] Soroush V osoughi, Deb Roy , and Sinan Aral. The spread of true and false news online. Science , 359(6380):1146– 1151, 2018. [62] Bo W aggoner and Y iling Chen. Output agreement mechanisms and common knowledge. In Pr oceedings of the AAAI Confer ence on Human Computation and Cr owdsour cing , volume 2, pages 220–226, 2014. [63] Je vin D. W est and Carl T . Bergstrom. Misinformation in and about science. Pr oceedings of the National Academy of Sciences , 118(15):e1912444117, 2021. [64] Jens W itko wski and David C Parkes. Peer prediction without a common prior . In Pr oceedings of the 13th A CM Confer ence on Electr onic Commer ce , pages 964–981, 2012. [65] X Community Notes Guide. Ranking notes. https://communitynotes.x.com/guide/en/ under- the- hood/ranking- notes , n.d. Accessed: 2025-08-30. [66] X Corp. About community notes on x. https://help.x.com/en/using- x/community- notes , 2025. Ac- cessed: 2025-11-17. [67] X Corp. / Community Notes Guide. Note ranking algorithm. https://communitynotes.x.com/guide/en/ under- the- hood/ranking- notes , n.d. Accessed: 2025-08-05. [68] X (formerly T witter) Community Notes Guide. Downloading data. https://communitynotes.x.com/guide/ en/under- the- hood/download- data , n.d. Accessed: 2025-08-30. [69] Dora Zhao, Diyi Y ang, and Michael S. Bernstein. Mapping the spiral of silence: Surve ying unspoken opinions in online communities. arXiv preprint , 2025. 18 A P R E P R I N T - M A R C H 2 0 , 2 0 2 6 A Guide to the Appendix This Appendix has tw o goals. First, it provides the empirical implementation details and robustness analyses underlying the main-text results. Second, it contains the full technical Appendix for the theoretical results. The org anization of the Appendix is designed to mirror the logic of the paper: we first document the empirical reconstruction and additional analyses, and then turn to the stylized model and proofs. The Appendix is organized as follo ws. Appendix B describes the data sources, preprocessing steps, and reconstruction of weekly latent factors from the public Community Notes data and open-source code. Appendix C presents additional empirical analyses in the order of the main text, including the shift in minority-aligned contributors after the introduction of Rating Impact, the change in participation on controv ersial content, and additional predictive-performance analyses. Appendix D describes the implementation of the two-stage weighted matrix factorization procedure and additional empirical details for that estimator . Appendix E contains the full theory Appendix: it states the stylized estimation model, lists the regularity conditions used in the proofs, and provides proofs of all theorems and propositions in the main text. B Data, reconstruction, and empirical methodology B.1 Data sources In this paper , we use the open source code and data from X Community Notes [ 68 ]. T o study the effect of the Rating Impact rollout, we focus on the time frame between June 1, 2022 and May 31, 2023. T o ev aluate the predicti ve performance of our two-stage matrix factorization (MF) method, we use ratings data from Jan. 1, 2023 to June 1, 2024. Information about the primary dataframes we use in our analysis and relev ant columns are stored in T able 3. More detailed information about all av ailable data can be found in the Community Notes documentation [68]. Dataframe Relevant Columns Description ratings_df noteId, raterParticipantId, createdAtMillis, helpfulnessLevel Record of each (user , note) rating pair and the times- tamp history_df noteId, createdAtMillis, currentStatus Record of each note and what its most recent note status was (i.e. whether it has reached Helpful or Not Helpful status) note_df noteId, raterParticipantId, createdAtMillis, tweetId, summary Contains metadata about each note note_factor_df noteId, week_dt, noteIntercept, noteFactor1 Contains weekly computations for note intercept and note factor (one for 2022 v ersion, one for 2025 ver - sion of the code) rater_factor_df raterParticipantId, week_dt, raterIntercept, raterFactor1 Contains weekly computations for rater intercept and rater factor (one for 2022 v ersion, one for 2025 ver - sion of the code) T able 3: Dataframes used in our analysis. B.2 Reconstructing W eekly Latent Factors The public release does not include the latent parameters used internally by the platform’ s aggreg ation system. As a result, all note and rater intercepts and factors used in our analysis are reconstructed from the ratings history rather than observed directly . In order to recover weekly estimates for rater and note intercepts and factors, we run X’ s matrix factorization algorithm. For each week w from June 1, 2022 to May 31, 2023, we run the matrix f actorization algorithm on all ratings up to and including ratings from week w . Since matrix factorization can only recover the rater and note factors up to a global scaling and sign, the algorithm checks the sign distrib ution of factors and ensures that the majority always has a negati ve sign. Thus, the sign meaning stays consistent throughout the weeks. W e run both the version from Dec. 2022 and the version from May 2025 [ 55 ]. Both implementations largely solv e the biased matrix factorization problem presented in the main text using stochastic gradient descent with L 2 regularization, and factor normalization to ensure consistent interpretation of factors across weeks. The 2022 version is a straightforward implementation of the least-squares MF optimization problem with single- round optimization and basic con ver gence criteria. The 2025 version of the code includes many enhancements (multi-round reputation filtering, harassment detection, uncertainty quantification, and abuse mitigation), ho wever , our implementation utilizes only the stable initialization improvement from the modern codebase. Specifically , we run the 19 A P R E P R I N T - M A R C H 2 0 , 2 0 2 6 run_single_round_mf function, which implements stable initialization using a designated modeling group to prev ent factor sign drift across time. B.3 Policy T iming, and User Cohorts W e use Oct. 1, 2022 as the analysis cutoff date. This is a conservati ve operational cutof f following the period when the Rating Impact eligibility rules (announced in September 2022) begin to take ef fect in the observed data. Dates before Oct. 1 are referred to as pr e-r ollout , and dates on or after Oct. 1 as post-r ollout . Sev eral analyses distinguish beha vioral adaptation from compositional change due to entry of ne w raters. W e define early users to be raters who were activ e on Community Notes before Oct. 1, 2022, and new users to be raters who first became activ e between Oct. 1, 2022 and Jan. 1, 2023. Finally , note and rater factors should be interpreted as relati ve positions within a weekly latent scale estimated from all observed user -note interactions on the platform. In particular , note factors are equilibrium objects: they reflect not only how notes are e valuated, b ut also which notes are written and which notes recei ve enough ratings to be assigned a factor . For this reason, our empirical comparisons focus on within-pipeline temporal changes, cohort differences, and discontinuities at the rollout boundary , rather than on absolute comparisons across different estimation procedures. C Additional Empirical Results C.1 Robustness Checks f or Minority Beha vior Shift In this section, we provide se veral sensitivity tests for the e vidence on changes in minority behavior . Recall that the platform normalizes users with negati ve latent factor to be the majority . The main empirical finding was that, follo wing the introduction of Rating Impact, minority-aligned contrib utors moved closer to the majority in the platform’ s latent-factor space, and the predictiv e role of user-note alignment for Helpful ratings weakened. Here we show that this pattern is robust across alternati ve visualizations of the factor distrib utions, a permutation-based comparison of factor shifts for early and new users, a regression discontinuity design for distrib utional shape, and additional predicti ve specifications based on the user-note dot product. C.1.1 Latent Factor Distrib ution Shift Recall from the main te xt that we define early users to be the cohort of users were who acti ve on Community Notes before the rollout date of Oct. 1, 2022, and new users to be the cohort of users who became acti ve between Oct. 1, 2022 and Jan. 1, 2023. In Figures 6, 8, and 9, we give additional visualizations for the distrib ution shift for early users compared with new users between Oct. 2022 and Jan. 2023. All figures gi ve observ ational evidence that users who were affected by the Rating Impact policy change their beha vior , with their factors aligning more with the majority over time. C.1.2 RDD T ests for Bimodality As an additional robustness test the latent factor distribution shift among note and rater factors, we compute the bimodality coefficient of the distributions ov er time and run a regression discontinuity design. For each week t , we compute the bimodality coefficient (BC) of the empirical distribution of latent f actors, defined as BC t = sk ewness 2 t + 1 kurtosis t , (9) where ske wness and kurtosis are computed from the stimated factors in week t . The bimodality coef ficient is scale- in variant and increases with the prominence of multiple modes; for reference, unimodal symmetric distrib utions (e.g., Gaussian) hav e BC ≈ 1 / 3 , while bimodal distributions yield lar ger values. W e compute BC t separately for (i) rater factors { f u } and (ii) note factors { f n } using weekly snapshots of the matrix factorization estimates reconstructed from the public data. The estimation pipeline, normalization, and regularization are held fixed across time, so temporal changes in BC t reflect changes in the empirical distrib ution rather than rescaling artifacts. Regression discontinuity design. W e estimated a sharp RDD to test whether the October 1, 2022 intervention produced a discontinuous shift in weekly bimodality coef ficients. The running variable R t is defined as the signed 20 A P R E P R I N T - M A R C H 2 0 , 2 0 2 6 number of days between the Monday of week t and the cutoff date, so R t = 0 corresponds to the first post-intervention week. W e use the full available time series as the estimation bandwidth ( 9 weeks pre-, 9 weeks post-interv ention). W e estimated a local linear model on each side of the cutof f: B C t = β 0 + β 1 R t + β 2 · 1 [ R t ≥ 0] + β 3 · ( R t × 1 [ R t ≥ 0]) + ε t (10) where β 2 identifies the discontinuous jump at the threshold and β 3 allows the post-interv ention slope to differ from the pre-intervention slope. The model was estimated separately for the rater -lev el and note-level bimodality series via OLS with HC3 heteroskedasticity-rob ust standard errors. Results and interpretation. For rater factors, we observe a statistically significant negati ve discontinuity in the bimodality coef ficient at the cutoff (Figure 10), indicating an abrupt shift to ward a more unimodal distribution follo wing the introduction of Rating Impact. This pattern is consistent with minority-aligned raters moving closer to the center of the latent spectrum or crossing alignment tow ard the majority group. For note f actors, we also observe a significant decline in the bimodality coef ficient at the cutoff (Figure 11), though the subsequent time trend dif fers from that of raters. The regression discontinuity design is used to identify the local effect of the Rating Impact rollout on the distributional shape of latent factors, not to characterize longer-run dynamics. While the post-cutof f time path of note f actors differs from that of rater factors, this div ergence is expected and does not affect the interpretation of the discontinuity . Rater factors represent latent traits of a largely fixed population of users and therefore e volv e primarily through beha vioral adaptation. In contrast, note factors are equilibrium objects shaped by endogenous entry: which notes are written, and which notes receive suf ficient ev aluations to get assigend a factor all depend on post-rollout incentiv es. These selection forces can alter higher-order moments of the note-factor distribution o ver time, e ven when the immediate response to the policy change is a reduction in bimodality . Importantly , our inference relies on the direction and significance of the discontinuity at the rollout boundary , which is common to both rater and note factors, and is consistent with strategic conformity reducing the salience of minority-aligned positions. C.1.3 Additional Alignment T ests The main text used Spearman’ s correlation between the rater–note dot product f u g n and Helpful ratings as a nonpara- metric measure of the predicti ve role of user –note alignment. Here we report two additional rob ustness checks on the same question. Logistic Regression For each rating between Aug. 1, 2022 and Jan. 1, 2023, we compute the dot product between the user factor and note factor at the time of rating. For each period before and after the Oct. 1, 2022 rollout, we regress helpfulness ratings on the rater -note dot product using logistic regression, and tak e the difference in coef ficients (post minus pre) as our test statistic measuring change in predicti veness. The logistic regression coef ficient declined from 15 . 696 to 4 . 427 , a change of − 11 . 269 . W e conduct a permutation test with 1 , 000 iterations, randomly reassigning the ratings to pre/post groups, while preserving the original group sizes. The p-value of 0 . 001 indicates that the observed decline is statistically significant at the 0 . 05 lev el, consistent with the Spearman correlation results reported in the main text. The test statistic distribution is sho wn in Figure 13. Note that the logistic regression coef ficient is sensiti ve to the scale of the dot product and is therefore less robust than the Spearman correlation as a test statistic; we include it here for completeness. DiD for Note Helpfulness Second, we estimate a difference-in-dif ferences (DiD) framework on the same dataset to test whether the rollout of Rating Impact affects the predicti veness of rater -note factor for note helpfulness ratings. W e regress note helpfulness using the follo wing: r un = α + β ( f u g n ) + γ Post + δ ( Post × f u g n ) + ϵ un , where f u , g n are the rate r and note factors, and Post is an indica tor that is 1 after Oct. 1, 2022. The coef ficient β captures the baseline predictiv eness of the rater-note factor prior to the interv ention, γ captures any le vel shift in helpfulness ratings post-rollout, and δ is the DiD estimator of interest. Standard errors are heteroskedasticity-robust (HC3). Results are shown belo w . T aken together with the Spearman and rolling-correlation analyses in the main te xt, these additional specifications reinforce the same conclusion: after the introduction of Rating Impact, user–note alignment becomes less predicti ve of helpfulness ratings among contributors who were acti ve through the polic y change. 21 A P R E P R I N T - M A R C H 2 0 , 2 0 2 6 Parameter Std. Err . z p -value Lo wer CI Upper CI Intercept 0.4937 0.039 12.649 < 0.001 0.417 0.570 f u g n 1.3821 0.068 20.323 < 0.001 1.249 1.515 Post − 0.0767 0.047 − 1.636 0.102 − 0.169 0.015 Post × f u g n − 0.5344 0.100 − 5.345 < 0.001 − 0.730 − 0.338 T able 4: DiD estimates for the predictiv eness of the rater-note factor on note helpfulness ratings, corresponding to the specification in (11) . The dependent v ariable is r un , is the helpfulness rating. f u g n is the rater-note dot product and Post is an indicator equal to 1 after the Rating Impact rollout (October 2022). The baseline coef ficient on f u g n ( ˆ β = 1 . 382 , p < 0 . 001 ) indicates a strong pre-intervention relationship between the rater-note factor and helpfulness. The DiD estimator Post × f u g n ( ˆ δ = − 0 . 534 , p < 0 . 001 ) indicates that this predictiv e relationship weakened significantly following the rollout. Standard errors are heteroskedasticity-rob ust (HC3). C.2 Contro versial Content and Participation This section provides additional detail and sensitivity analyses for the controv ersial-content result in the main text. The main pattern is that, follo wing the rollout of Rating Impact, notes on controversial content are less lik ely to attain Helpful status than notes on non-controversial content. W e document this pattern using two complementary definitions of controv ersy . The first is topic-based and uses note summaries to classify notes into broad content areas before labeling those areas as controv ersial or non-controv ersial. The second is factor -based and uses the magnitude of the estimated note factor as a model-based measure of polarization. W e also examine whether the decline in controversial-note visibility is accompanied by changes in contributor -lev el engagement with controv ersial content. C.2.1 T opic Assignment and Controversy Definitions Next we describe how we assign topic labels to notes and ho w those labels are used to classify content as controv ersial or non-controv ersial. W e first define the primary topic assignment procedure used throughout the main text, which closely follows X’ s public implementation with expanded co verage. W e then present alternati ve large-language-model (LLM)- based topic assignments used as alternative classification procedures to assess sensitivity to the topic-classification mechanism. Primary T opic Assignment (Bag-of-W ords Classifier) Our primary topic assignment b uilds on the topic-modeling code used by the platform implementation, which combines seed-term matching with a supervised bag-of-words classifier . In the version of X’ s code used for this paper , each topic is defined initially by a small set of seed terms. Preliminary topic assignment is based on exact and fuzzy matches to these seed terms, after which a multi-class logistic regression classifier is trained to e xpand the set of in-topic notes. In the version of X’ s code used for this paper , the nativ e topic in ventory is limited to Ukr aine Conflict , Gaza Conflict , Messi–Ronaldo , and Scams . T o support analyses requiring broader topical cov erage, we expand this in ventory by introducing additional candidate topics and associated seed terms. These additional topics and seed terms are used only to augment the training data for the bag-of-words classifier . The classifier architecture, feature representation, and regularization follo w X’ s implementation, with one modification: we lower the minimum balanced-accuracy threshold for topic inclusion to 0 . 01 in order to retain topics with sparse coverage. T able 10 lists the resulting topic set and seed terms. All topic labels used in the main-text analyses are produced by this retrained bag-of-w ords classifier . Independently of the topic-assignment procedure, we label topics a priori as controv ersial or non-controv ersial based on domain knowledge and prior literature. T able 11 reports the full list of topics and their controv ersy classification. LLM-Based T opic Assignment (Alternative Classification Procedur es) T o assess whether our results depend on the specific topic-assignment mechanism, we conduct rob ustness checks using two alternati ve LLM-based classification procedures. These procedures are not used in the main analyses and serve only to ev aluate sensitivity to the choice of topic classifier . Both LLM-based procedures use an identical, fixed in ventory of topic labels: Ukraine Conflict, Gaza Conflict, Messi Ronaldo, Sports NFL, Sports NBA, Movies TV , Education, F ood Nutrition, Space Astr onomy , Health, CO VID-19, Climate En vir onment, W eather Disasters, Artificial Intelligence , T ec h Companies, US P olitics, Crime Le gal, Economy F inance, Scams, Other . In both cases, the input text is the note-le vel summary field, and each note is assigned exactly one topic label. Notes with missing summaries are excluded. 22 A P R E P R I N T - M A R C H 2 0 , 2 0 2 6 Figure 6: The top figure shows rater factor distrib ution shift for the early user cohort and the bottom figure sho ws rater factor distrib ution shift for the new user cohort using the 2022 version of the matrix factorization code. The minority mode decreases significantly for early users, while remaining more stable for new users. For early users, the proportion of positi ve factors during the T ransition period compared with the Stabilized period decreases from 31 . 4% to 24 . 8% , a decrease of 6 . 6 percentage points. For new users, the proportion of positive factors comparing the same two time periods decreases from 50 . 3% to 49 . 5% , a decrease of only 0 . 8 percentage points. Appr oach 1 (Prompted LLM Classification): Our first procedure uses a prompted instruction-tuned LLM accessed through Sno wflake Cortex’ s te xt completion interface. For each note summary , we supplied an e xplicit natural-language prompt that enumerates the full label set and enforces a single-label classification objecti ve with a structured output format. Decoding was deterministic (temperature set to zero) to ensure reproducibility across runs. The exact prompt used was: You are a classifier. Choose exactly ONE topic label from: [Ukraine Conflict, Gaza Conflict, Messi Ronaldo, Sports NFL, Sports NBA, Movies TV, Education, Food Nutrition, Space Astronomy, Health, COVID-19, Climate Environment, Weather Disasters, Artificial Intelligence, Tech Companies, US Politics, Crime Legal, Economy Finance, Scams, Other]. Return ONLY valid JSON like {"topic":"
Original Paper
Loading high-quality paper...
Comments & Academic Discussion
Loading comments...
Leave a Comment