FairShare: Auditable Geographic Fairness for Multi-Operator LEO Spectrum Sharing
Dynamic spectrum sharing (DSS) among multi-operator low Earth orbit (LEO) mega-constellations is essential for coexistence, yet prevailing policies focus almost exclusively on interference mitigation, leaving geographic equity largely unaddressed. Th…
Authors: Seyed Bagher Hashemi Natanzi, Hossein Mohammadi, Vuk Marojevic
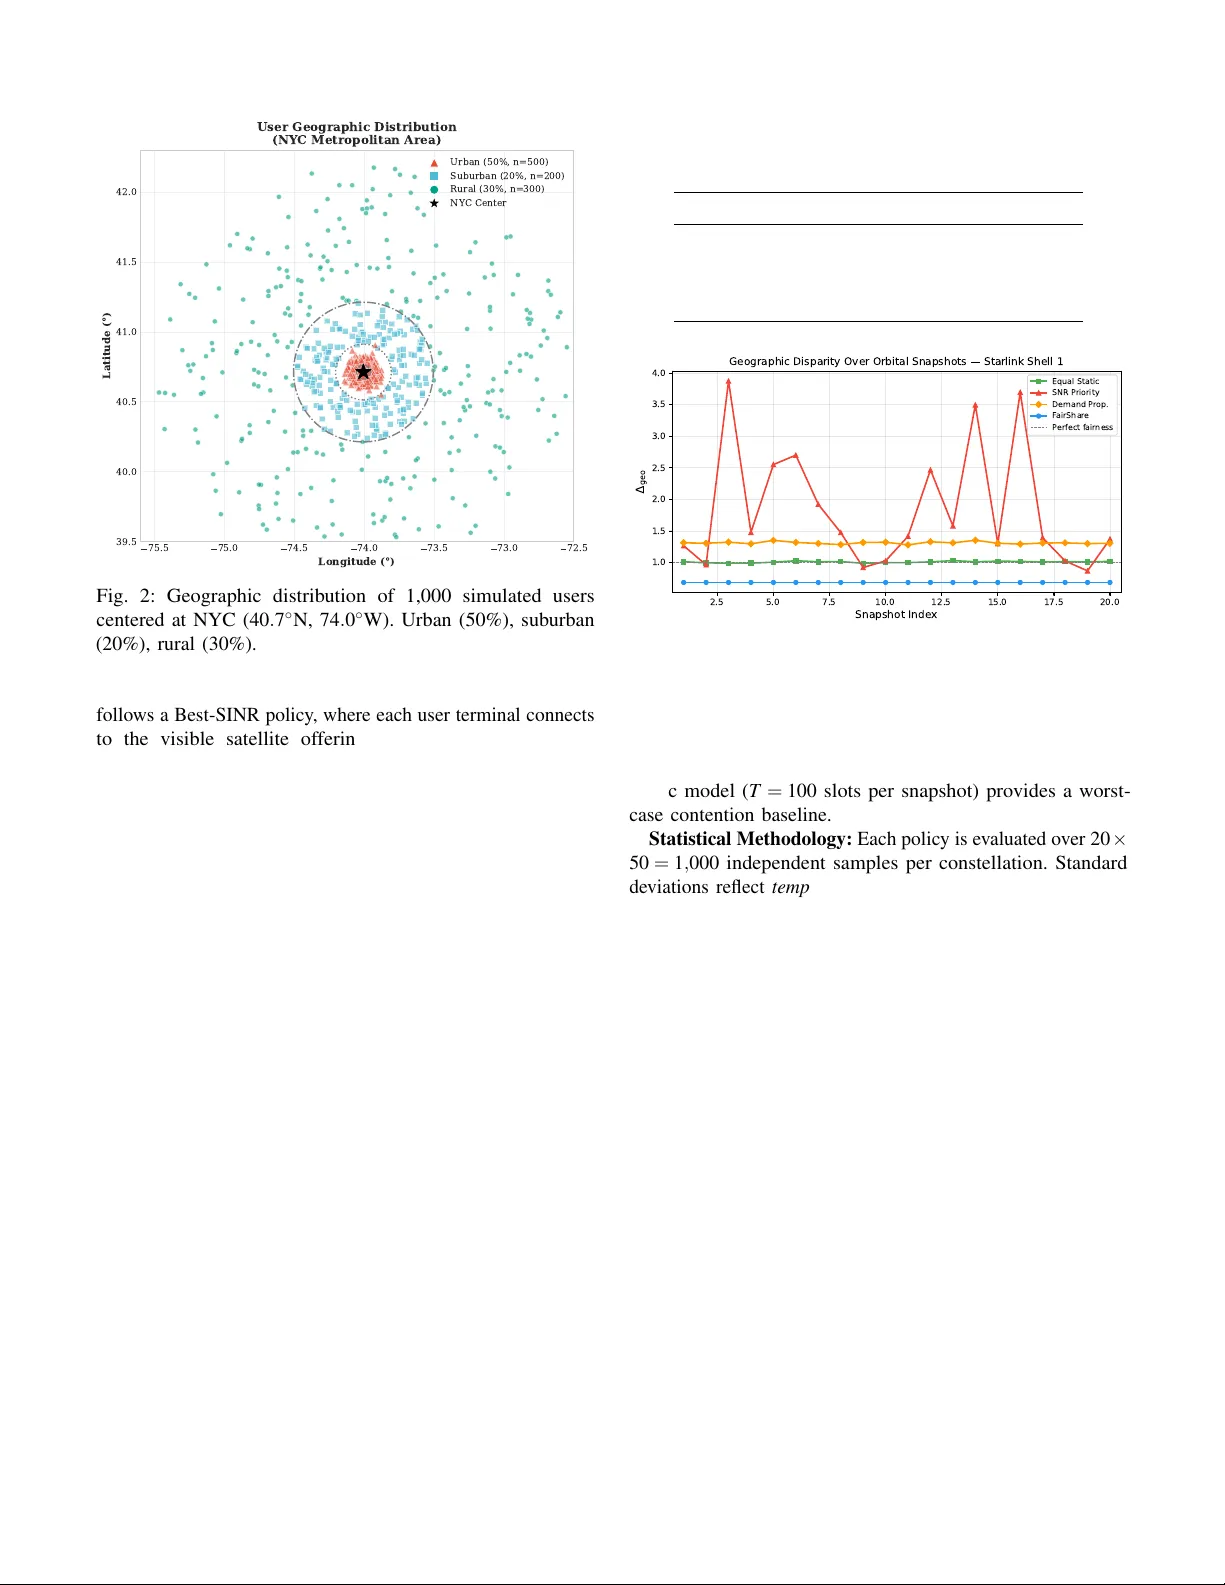
F airShare: Auditable Geographic F airness for Multi-Operator LEO Spectrum Sharing Seyed Bagher Hashemi Natanzi ∗ , Hossein Mohammadi † , V uk Marojevic † , Bo T ang ∗ ∗ Department of Electrical and Computer Engineering, W orcester Polytechnic Institute (WPI), USA Email: {snatanzi, btang1}@wpi.edu † Department of Electrical and Computer Engineering, Mississippi State Univ ersity , USA Email: {hm1125, vm602}@msstate.edu Abstract —Dynamic spectrum sharing (DSS) among multi- operator low Earth orbit (LEO) mega-constellations is essential for coexistence, yet pre vailing policies focus almost exclusively on interference mitigation, lea ving geographic equity largely unaddressed. This work in vestigates whether conventional DSS approaches inadvertently exacerbate the rural digital divide. Incorporating Keplerian orbital dynamics, inter -beam co-channel interference, and three real-world constellation geometries (Star- link, OneW eb, Kuiper), we conduct large-scale, 3GPP-compliant non-terrestrial network (NTN) simulations across 20 orbital snapshots spanning 10 minutes of satellite motion. The results uncover a stark and persistent structural bias: SNR-priority scheduling induces a 1 . 84 × mean urban–rural access disparity , with temporal fluctuations reaching 3 . 9 × during fav orable interference conditions. Counter -intuitively , increasing system bandwidth amplifies rather than alleviates this gap. T o remedy this, we propose FairShar e, a lightweight, quota-based framework that enforces geographic fairness. FairShar e not only reverses the bias, achie ving an affirmativ e disparity ratio of ∆ geo = 0 . 68 × with zero variance across all orbital snapshots and interference conditions, but also reduces scheduler runtime by 3.3%. This demonstrates that algorithmic fairness can be achiev ed without trading off efficiency or complexity , and that it remains inv ariant to physical-layer dynamics. Our work pro vides regulators with both a diagnostic metric for auditing fairness and a practical, enfor ceable mechanism for equitable spectrum gover nance in next-generation satellite networks. Index T erms —LEO satellite netw orks, DSS, geographic fairness, multi-operator coexistence, NTN, spectrum policy , regulatory auditing. I . I N T RO D U C T I O N The rapid deployment of low Earth orbit (LEO) mega- constellations by multiple operators such as Starlink, OneW eb, and Kuiper is intensifying competition for shared Ka-band spectrum. As these systems scale to thousands of satellites, dynamic spectrum sharing (DSS) has become indispensable for their coexistence [1]. Current regulatory frameworks, including those of the International T elecommunications Union (ITU) and the Federal Communications Commission (FCC), primarily emphasize interference mitigation [2], [3]; howe ver , they largely overlook an equally fundamental question: Do existing DSS policies pr ovide equitable spectrum access acr oss geogr aphically diverse users? Fairness is inherently geographic for non-terrestrial networks (NTN). User channel quality is directly shaped by satellite elev ation geometry . Users in rural and remote areas, situated at the periphery of satellite spot beams, face a systematic geometric disadvantage: significantly lower elev ation angles and longer slant ranges. This increases free-space path loss and atmospheric attenuation, resulting in a structural net signal-to- noise ratio (SNR) penalty that cannot be overcome by local en vironmental adv antages. Unlike demographic or demand- driv en disparities, this disadvantage is immutable and persists regardless of user behavior . Consequently , fairness in NTNs emerges as a unique physical-layer challenge poorly addressed by terrestrial fairness framew orks. Classical metrics such as Jain’ s index [4], the Gini coef- ficient, and α -fairness [5] were dev eloped for quasi-static terrestrial networks and fail to capture LEO dynamics, where elev ation-dependent propagation dictates link quality . When channel-aware or demand-dri ven allocation policies are ap- plied in this context, they systematically amplify geometric advantages, translating modest SNR differences into sev ere disparities in spectrum access between urban and rural users. While prior work on LEO scheduling and NTN coexistence has focused on spectral ef ficiency and interference control [6], [7], geographic fairness for multi-operator spectrum sharing remains unexamined. Moreover , current 3GPP Rel-17/18/19 NTN specifications provide no fairness mechanisms for multi- operator scenarios [8], leaving a critical gap between regulatory objectiv es and practical allocation behavior . This paper addresses this gap through F airShar e , which serves both as a benchmarking framew ork and a geographic- aware allocation policy . Using 3GPP TR 38.811 compliant channel models and simulating large-scale distributed user populations, we systematically ev aluate con ventional DSS strategies. The results reveal that SNR-priority scheduling induces a mean urban rural access disparity of 1 . 84 × , with temporal fluctuations reaching 3 . 9 × during fav orable interfer - ence conditions, while demand-proportional allocation yields a 1 . 31 × gap. Critically , this disparity is sho wn to be policy- inher ent rather than scar city-driven and persists across all three constellation geometries ev aluated. T o ov ercome this limitation, FairShare introduces explicit, tunable geographic quotas into the allocation process. This simple intervention enforced through a centralized coordination Fig. 1: Geographic disparity (a) and the FairShare framework (b). The Physical Pr oblem: Rural users f ace a structural disadvantage through two compounding mechanisms: beam gain roll-off (as beams are centered on population-dense urban areas) and ele vation-dependent path loss. The figure illustrates the latter , where rural users experience lower elev ation angles ( θ r < θ u ) and longer slant ranges, contributing to the ov erall SNR penalty (a). The F airShar e Solution: The proposed frame work replaces purely competition-based allocation with geographic partitioning, enforcing specific bandwidth quotas (b). Note: the SNR gap sho wn is illustrativ e; measured values are 5–10 dB. framew ork representative of emer ging regulatory models (see Sec. III) not only eliminates urban bias but achieves affirmati ve fairness ( ∆ geo = 0 . 68 × ) with zero temporal v ariance, while retaining high spectral efficienc y . Moreover , the quota-based design reduces computational runtime by 3.3% compared to baseline schedulers. This work makes five ke y contributions: (1) an open bench- marking framework for ev aluating geographic fairness in multi- operator LEO spectrum sharing under 3GPP channel models with Keplerian orbital propagation and inter-beam co-channel interference; (2) the first systematic e vidence that con ventional DSS policies induce extreme urban-rural disparities originating from allocation design, not spectrum scarcity , validated across 20 orbital snapshots spanning 10 minutes of satellite motion; (3) FairShare, a lightweight geographic-aw are policy that guarantees equitable access while maintaining high spectral ef ficiency; (4) cross-constellation v alidation demonstrating that the structural bias persists and FairShare remains ef fectiv e across Starlink, OneW eb, and Kuiper geometries; and (5) con- crete, evidence-based guidance for regulators on incorporating explicit geographic fairness metrics into future NTN spectrum- sharing standards. I I . R E L A T E D W O R K A. DSS and F airness in LEO Systems Ahmed et al. [1] survey DSS mechanisms between LEO and terrestrial systems, emphasizing interference management, while Giordani et al. [7] analyze Ka/Ku-band coexistence challenges in multi-operator settings, identifying regulatory gaps regarding inter-constellation coordination. Recent AI- driv en approaches such as hierarchical deep reinforcement learning [9] achiev e improved throughput b ut optimize aggre- gate metrics, lacking e xplicit fairness guarantees or geographic considerations; the opacity of learned policies further presents challenges for regulatory auditability . Classical fairness metrics Jain’ s index [4], proportional fairness, α -fairness [5] were designed for quasi-static terrestrial channels. Ahmad [6] demonstrates that these become unreli- able under LEO dynamics, where elev ation-dependent SINR fluctuations obscure systematic geographic biases. Max-min and weighted proportional fairness [10] assume homogeneous user populations without geographic structure and fail to detect location-correlated discrimination. B. Standar dization and Regulatory Gaps 3GPP Rel-17/18/19 NTN specifications [8] define physical layer procedures, timing advance mechanisms, and mobility management for satellite access but do not address fairness in the context of multi-operator spectrum sharing. The ITU Radio Regulations provide interference coordination procedures (Article 22) but lack provisions for equitable access across geographic regions. Although fairness is not explicitly defined as a key performance indicator (KPI), the IMT -2030 framew ork (ITU-R M.2160) mandates ubiquitous coverage and social inclusivity , implicitly requiring geographically equitable user experience [11], [12]. Recent work on equitable access to satellite broadband and LEO frequency or orbit resources, as well as NTIA ’ s broadband equity initiativ es, emphasize geographic disparities and the need for evidence-based equity metrics, but do not specify concrete spectrum or resource allocation mechanisms at the technical le vel [13]. T o date, no prior work systematically e valuates geographic fairness for multi-operator NTN spectrum sharing or proposes allocation policies e xplicitly targeting geographic equity . I I I . S Y S T E M M O D E L A N D P R O B L E M F O R M U L A T I O N The system under consideration captures a forwar d-looking r e gulatory scenario : a downlink multi-operator LEO NTN where O satellite operators share a common spectrum pool of total bandwidth W (Hz), managed by a centralized coordinator akin to the FCC’ s Spectrum Access System (SAS) for the Citizen Broadband Radio Service (CBRS). 1 The system operates in discrete time slots t ∈ T , where channel states, visibility , and beam associations e volv e with satellite motion. Fig. 1 illustrates the structural relationship between geographic location and channel quality that motiv ates this work. A. Network T opology Let S = { 1 , . . . , S } denote visible LEO satellites and U = { 1 , . . . , U } the user terminals. Each satellite s forms a multibeam footprint with beam set B s , and the global beam set is B = S s ∈ S B s . Each user u is served by beam b ( u , t ) ∈ B at time t . Geographic Classification: Users are classified into cat- egories ℓ u ∈ { urban , suburban , rural } based on distance from urban centers. This classification is designed to capture a hypothesized effective channel quality gradient driv en by two compounding mechanisms central to our study: (1) beam gain roll-off, modeling the operational premise that satellite beams are centered on population-dense urban areas to maximize capacity , leaving rural users at beam edges with reduced antenna gain; and (2) elev ation-dependent path loss and clutter variations per 3GPP TR 38.811 models [14], [15].The combined ef fect in our model is a systematic SNR disadv antage for rural users, allowing us to in vestigate fairness under a capacity-centric network planning paradigm rather than one focused solely on atmospheric propagation. Multi-Operator Coordination: The model considers O = 3 operators sharing spectrum through a centralized coordination mechanism, representativ e of emer ging regulatory frameworks such as the FCC’ s spectrum access system for satellite services [3]. This cooperati ve setting isolates the inherent geometric unfairness from competitive market behaviors. Operators submit allocation requests to a central coordinator, which applies the DSS policy to distribute spectrum across all users reg ardless of operator identity . Inter -operator beam conflicts are av oided through time-frequency separation. B. Orbital Dynamics and Constellation Model T o e valuate fairness under realistic satellite motion, we employ a Keplerian orbital propag ator . Each satellite’ s position in Earth-Centered Inertial (ECI) coordinates is computed 1 While current constellations operate on separate licenses with proprietary beam management, this study models a unified dynamic spectrum access en vironment to evaluate the efficacy of proposed fairness regulations for future shared-spectrum framew orks. T ABLE I: Constellation configurations ev aluated. Constellation Planes Sats/Pl. T otal Alt. Inc. Starlink Shell 1 72 22 1,584 550 km 53.0 ◦ OneW eb Phase 1 18 36 648 1,200 km 87.9 ◦ Kuiper Shell 1 34 34 1,156 630 km 51.9 ◦ from classical two-body orbital elements and transformed to Earth-Centered Earth-Fixed (ECEF) coordinates accounting for Earth’ s rotation: r ECEF ( t ) = R z ( ω E t ) r ECI ( t ) , (1) where ω E = 7 . 2921 × 10 − 5 rad/s is Earth’ s rotation rate and R z ( · ) is the rotation matrix about the polar axis. The simulation runs N snap = 20 orbital snapshots at ∆ t = 30 s intervals, spanning 10 minutes of satellite motion. At each snapshot, satellite positions are re-propagated and user satellite geometry (elev ation angles, slant ranges) is recomputed. Only satellites exceeding a minimum ele vation angle θ min = 10 ◦ (per 3GPP TR 38.811 [14]) are considered visible. T able I defines the three W alker-Delta constellation con- figurations e valuated. These span the range of current LEO filings in altitude (550–1,200 km), inclination (51.9–87.9 ◦ ), and constellation size (648–1,584 satellites). C. Channel Model A 3GPP TR 38.811-compliant channel model is employed, capturing elev ation-dependent path loss, shadow fading, and atmospheric ef fects. For user u at ele vation angle θ u ( t ) , the channel gain is | h u ( t ) | 2 = G s , b ( ψ u ) · G u · L − 1 ( θ u , d u ) · ξ u ( t ) · A u ( t ) , (2) where G s , b ( ψ u ) is the satellite beam gain as a function of the user’ s off-axis angle ψ u from the serving beam center (Sec. III-D ), G u is the user terminal gain, L ( · ) is the elev ation- dependent path loss, ξ u ( t ) is the log-normal shadow fading, and A u ( t ) is the atmospheric loss [15, Sec. 5.5]. Path Loss: Follo wing 3GPP TR 38.811 (clause 6.6.2) [14]: L ( θ u , d u ) = L FS ( d u ) + L clutter ( ℓ u , θ u ) , (3) where L FS is the free-space path loss gi ven by L FS = 32 . 45 + 20 log 10 ( f c ) + 20 log 10 ( d u ) with f c in MHz and d u in km [15]. The clutter loss L clutter varies with geographic type ℓ u and elev ation angle, follo wing the statistical models in 3GPP TR 38.811 [14, T able 6.6.2-1]. Shadow Fading: Large-scale fading is modeled as 10 log 10 ( ξ u ) ∼ N ( 0 , σ 2 SF ( ℓ u )) , where the standard deviation σ SF varies by geographic type follo wing 3GPP TR 38.811 [14] 2 . 2 Although urban en vironments exhibit higher shadow fading v ariability ( σ SF = 8 dB), the combined effect of beam-center positioning and favorable propagation conditions results in approximately 5–10 dB urban SNR advantage depending on deployment geometry . The signal-to-interference-plus-noise ratio (SINR) is ob- tained as γ u ( t ) = p s , b , u ( t ) | h u ( t ) | 2 ∑ ( s ′ , b ′ ) =( s , b ) I ( s ′ , b ′ ) u ( t ) + N 0 b u ( t ) . (4) where p s , b , u ( t ) denotes the transmit po wer allocated from satellite s and beam b to user u at time t , I ( s ′ , b ′ ) u ( t ) is the interference po wer recei ved at user u from beam b ′ of satellite s ′ , b u ( t ) is the bandwidth allocated to user u (Hz), and N 0 is the noise power spectral density so that N 0 b u ( t ) is the corresponding noise power . The achiev able rate is R u ( t ) = b u ( t ) log 2 ( 1 + γ u ( t )) . (5) D. Beam Model and Interfer ence Each satellite generates a hexagonal 7-beam spot-beam layout centered on its sub-satellite point. The antenna gain for user u at angular offset ψ u from beam center follows the ITU-R S.1528 [16] parabolic approximation: G s , b ( ψ u ) = G max − 12 ψ u ψ 3dB 2 [ dBi ] , (6) clamped at G max − 25 dB (first sidelobe floor), where G max = 30 dBi is the peak beam gain and ψ 3dB = 1 . 5 ◦ is the half-power beamwidth for Ka-band spot beams. A 4-color frequency reuse pattern is applied across the 7 beams, assigning each beam one of four sub-bands such that adjacent beams operate on distinct frequencies. Co-channel interference arises from beams sharing the same sub-band. The interferer set for user u served by beam b on frequency f b is I u = { ( s ′ , b ′ ) : f b ′ = f b , ( s ′ , b ′ ) = ( s , b ) } . (7) The 4-color reuse significantly reduces interference by ensuring that only ∼ 25% of all beams are co-channel with the serving beam. The resulting SINR is 15–25 dB lower than the interference-free SNR, placing users in a realistic operating regime for Ka-band LEO systems. E. F airness Metrics Geographic Allocation Rate (Service A vailability): The expected fraction of users in category ℓ receiving spectrum allocation is defined as ρ ℓ = E |{ u : ℓ u = ℓ ∧ b u > 0 }| | U ℓ | , (8) where the expectation is taken ov er channel realizations, and U ℓ = { u : ℓ u = ℓ } denotes the set of users in geographic cate- gory ℓ . For the assumed full-buf fer traffic model, unallocated users experience a transmission outage ( R u ( t ) = 0 ). Therefore, ρ ℓ serves as a direct proxy for service availability , and ( 1 − ρ ℓ ) represents the user outage probability . Geographic Disparity Ratio: The urban-to-rural allocation gap is expressed as ∆ geo = ρ urban ρ rural . (9) A value of ∆ geo = 1 indicates perfect geographic fairness; ∆ geo > 1 indicates urban bias. This metric is preferred over aggregate indices because it explicitly captures the spatial structure of inequality . Unlike global metrics that can mask localized starv ation, ∆ geo enables straightforward policy tar- gets (e.g., mandating ∆ geo ≤ 1 . 5 × ) directly addressing the regulatory concern of the digital divide. A verage SINR: The a verage signal-to-interference-plus- noise ratio of allocated users is computed as ¯ γ = 1 | U alloc | ∑ u ∈ U alloc γ u . (10) Jain’ s Fairness Index: W e compute Jain’ s index for user rates, J = ∑ U u = 1 R u 2 U ∑ U u = 1 R 2 u , (11) to benchmark against traditional notions of fairness. W e employ this metric in Sec. VII to demonstrate that high aggregate f airness ( J ≈ 1 ) can paradoxically coexist with sev ere geographic discrimination. F . Pr oblem F ormulation The spectrum allocation problem can be formulated as a con- strained optimization that balances efficienc y and geographic fairness: max { b u } ∑ u ∈ U b u log 2 1 + γ u (12) s.t. ∑ u ∈ U b u ≤ W (12a) ∑ u ∈ U ℓ b u ≥ q ℓ W , ∀ ℓ (12b) ρ ℓ ≥ ρ min , ∀ ℓ (12c) b u ≥ 0 , ∀ u (12d) For notational simplicity , we drop the explicit time index and write b u and γ u as representativ e per-slot bandwidth allocation and SINR, respectiv ely . Objective (12) maximizes sum-rate (spectral ef ficiency) with constraint (12a) to enforce total bandwidth, constraint (12b) to guarantee minimum geographic quotas, and constraint (12c) to ensure minimum allocation rates per region. I V . D S S P O L I C Y D E S I G N W ithout constraint (12b) , the optimal solution allocates exclusi vely to high-SNR users (urban), yielding maximum efficienc y but extreme unfairness. FairShare implements (12b) through explicit geographic partitioning, then solves the remaining sum-rate maximization greedily within each region. Con ventional channel-aware policies create geographic unfairness because channel quality is structurally corr elated with geographic location [17]: • Channel-Geography Correlation: Although urban envi- ronments introduce higher local clutter loss, urban users in Algorithm 1 FairShare Allocation Require: Users U , bandwidth W , quotas { q ℓ } , SINR { γ u } , min per-user bandwidth b min Ensure: Allocation { b u } 1: N alloc ← ⌊ W / b min ⌋ ▷ System capacity in user slots 2: for each category ℓ ∈ { urban , suburban , rural } do 3: W ℓ ← q ℓ · W ▷ Re gion bandwidth quota 4: U ℓ ← { u : ℓ u = ℓ } ▷ Users in region 5: n ℓ ← min max ( 1 , ⌊ N alloc · q ℓ ⌋ ) , | U ℓ | ▷ User slots for region 6: Sort U ℓ by γ u descending 7: for u in top n ℓ of U ℓ do 8: b u ← W ℓ / n ℓ 9: end f or 10: end for 11: return { b u } this model experience systematically higher net SNR than rural users. This is because the geometric advantage of higher elev ation angles (shorter slant range) dominates the additional clutter loss. This structural gap is fundamental to wide-area LEO coverage. • Amplification Effect: When policies select users by chan- nel quality (Priority) or combine channel with demand (Demand Proportional), urban users are systematically fa vored. The multiplicati ve nature of Demand Proportional where urban users have both better channels and higher demand creates catastrophic unfairness. A. F airShar e: Geogr aphic-A ware Allocation FairShare is grounded in a guaranteed-minimum principle: an immutable geographic disadvantage should not systemati- cally bar users from service. It operationalizes this by enforcing minimum geographic quotas, rejecting pure merit-based (SNR- priority) and utilitarian (throughput-maximizing) objecti ves that amplify structural bias. Fairness is defined at the user level , independent of operator identity , ensuring equitable access regardless of which constellation serves a giv en user . FairShare guarantees geographic quotas while optimizing channel quality within each region. The ke y insight is that geographic f airness and spectral efficienc y can coexist through a partition-then-optimize approach: 1) Partition: The bandwidth is divided into geographic quotas: W ℓ = q ℓ · W for each category ℓ ∈ { urban , suburban , rural } , where ∑ ℓ q ℓ = 1. 2) Rank: Within each region, users are sorted by channel quality γ u ( t ) in descending order . 3) Allocate: The bandwidth is assigned to top users in each region until the quota is exhausted, guaranteeing minimum allocation rate ρ min . Quota Selection: Setting q ℓ proportional to population share of region ℓ with compensation for channel disadvantage achiev es ∆ geo = 1 . 0 × . Quotas can be adjusted for affirmati ve access policies fa voring underserved regions. Complexity: FairShare runs in O ( U log U ) per region for SNR-based sorting plus O ( U ) for classification. This is negligible relativ e to channel estimation. B. Optimality Analysis Proposition 1 (Pareto Optimality) . Under fixed geographic quotas { q ℓ } , F airShare achie ves the maximum sum-rate among all policies satisfying the same quota constraints. Pr oof. Gi ven quota constraints that fix the bandwidth allocated to each geographic region, any deviation from SNR-based user selection within re gions strictly decreases the sum-rate without improving ∆ geo . Since FairShare selects the highest-SNR users within each quota, it maximizes the objectiv e (12) subject to (12b) . Thus, FairShare lies on the Pareto frontier of the fairness-ef ficiency tradeoff. Setting q ℓ proportional to population share yields ∆ geo ≈ 1 . 0 × . The default configuration ( q rural = 35% vs. 30% popula- tion share) intentionally over -allocates to rural users, achieving affirmati ve fairness ( ∆ geo = 0 . 68 × ). Design Philosophy: FairShare is intentionally simple. The partition-then-optimize approach embodies the principle of guaranteed minimum access ensuring no geographic region falls below a defined allocation threshold regardless of channel conditions. This simplicity is a feature for three reasons: (1) Regulatory T ranspar ency: Quota-based policies are interpretable by policymak ers and auditable by regulators, unlike opaque learned policies; (2) Pr ovable Guarantees: FairShare provides deterministic fairness bounds, whereas optimization-based approaches of fer only statistical guarantees; (3) Deployment Practicality: The algorithm’ s lo w complexity ensures real-time operation on general-purpose processors without requiring specialized hardware, as evidenced by its 3.3% runtime reduction compared to priority scheduling (Sec. VI). V . E V A L U A T I O N S E T U P A. Simulation F ramework and Network T opology The proposed FairShare policy is ev aluated using a high- fidelity , system-level simulation framework built in T ensorFlow following 3GPP TR 38.811 channel models, with graphics processing unit (GPU) acceleration. 3 W e employ a multi- snapshot Monte Carlo approach incorporating Keplerian orbital propagation (Sec. III-B ). The simulation runs N snap = 20 snapshots at 30-second interv als, spanning 10 minutes of satellite motion. At each snapshot, satellite positions are re- propagated and the full channel model including inter-beam co- channel interference (Sec. III-D ) is recomputed. Three W alker - Delta constellation configurations are e valuated (T able I): Starlink Shell 1 (1,584 satellites at 550 km), OneW eb Phase 1 (648 satellites at 1,200 km), and Kuiper Shell 1 (1,156 satellites at 630 km) [18]. The cov erage area is centered at the New Y ork City metropolitan area ( 40 . 7 ◦ N, 74 . 0 ◦ W). The network scenario models a multi-operator en vironment where O = 3 operators share a common spectrum pool of bandwidth W = 300 MHz at a carrier frequency of f c = 20 GHz (Ka-band). User association 3 https://github.com/CLIS-WPI/FairShare 75.5 75.0 74.5 74.0 73.5 73.0 72.5 Longitude (°) 39.5 40.0 40.5 41.0 41.5 42.0 Latitude (°) User Geographic Distribution (NY C Metropolitan Area) Urban (50%, n=500) Suburban (20%, n=200) Rural (30%, n=300) NY C Center Fig. 2: Geographic distribution of 1,000 simulated users centered at NYC ( 40 . 7 ◦ N, 74 . 0 ◦ W). Urban (50%), suburban (20%), rural (30%). follo ws a Best-SINR policy , where each user terminal connects to the visible satellite offering the highest instantaneous channel quality . B. Baseline P olicies W e implement three con ventional allocation policies, which are introduced in continuation, to contextualize FairShare’ s performance. Equal Static: Uniform random allocation independent of channel quality: b u ( t ) = W / | U activ e | for randomly selected users. This provides a fairness baseline b ut ignores spectral efficienc y . SNR Priority: Resources are giv en to users with highest channel quality γ u ( t ) . Users are ranked by instantaneous SINR, and the top fraction is allocated resources. This prioritizes users with higher ele vation angles, maximizing spectral efficiency . Demand Pr oportional: The resource allocation is weighted by both demand and channel quality: s u ( t ) = d u ( t ) · ( 1 + γ u ( t ) / γ max ) . This policy serves as a proxy for commercial traffic-shaping strategies that prioritize high-density service areas. C. Geogr aphic User Distribution and Channel Model Users are classified by distance from the metropolitan center (Fig. 2): Urban (50%, Gaussian σ ≈ 5 . 5 km), Sub urban (20%, 22–55 km annulus), Rural (30%, 55–165 km ring). Channel propagation follows 3GPP TR 38.811 [14] with EIRP = 45 dBW , user terminal gain = 30 dBi, noise figure = 2 dB [19], [20], and location-dependent shado w fading ( σ SF = 8 dB urban, 4 dB rural). A full-buf fer downlink T ABLE II: Allocation rates and fairness (Starlink Shell 1, W = 300 MHz, 20 × 50 samples, with interference). ∆ geo = ρ urban / ρ rural ; std reflects temporal variability . Policy Urban Rate Rural Rate ∆ geo Equal Static 35.2 ± 0.2% 35.2 ± 0.3% 1.01 ± 0.01 SNR Priority 39.3 ± 3.9% 25.7 ± 8.3% 1.84 ± 0.93 Demand Prop. 38.7 ± 0.2% 29.8 ± 0.3% 1.31 ± 0.02 FairShar e 28.0 ± 0.0% 41.0 ± 0.0% 0.68 ± 0.00 2.5 5.0 7.5 10.0 12.5 15.0 17.5 20.0 Snapshot Inde x 1.0 1.5 2.0 2.5 3.0 3.5 4.0 g e o Geographic Disparity Over Orbital Snapshots Starlink Shell 1 Equal Static SNR P riority Demand P r op. F airShar e P erfect fair ness Fig. 3: Geographic disparity ( ∆ geo ) over 20 orbital snapshots (Starlink Shell 1). SNR Priority exhibits large temporal fluctuations driven by interference geometry changes, while FairShare remains perfectly flat at 0 . 68 × . traffic model ( T = 100 slots per snapshot) provides a worst- case contention baseline. Statistical Methodology: Each policy is e valuated ov er 20 × 50 = 1 , 000 independent samples per constellation. Standard devi ations reflect tempor al variability due to orbital dynamics rather than statistical uncertainty . V I . R E S U L T S A. Geogr aphic Allocation The structural SNR gap (urban users exhibit ∼ 6 dB higher median SNR than rural users due to fav orable elev ation geom- etry) directly translates to allocation bias under channel-aware policies. T able II presents the allocation performance for the Starlink Shell 1 constellation, av eraged over 20 × 50 = 1 , 000 samples. Key Findings: Priority scheduling yields a 1 . 84 × mean disparity with substantial temporal fluctuations (std = 0 . 93 ), peaking at 3 . 9 × during lo w-interference orbital configurations. It results in a mean service outage pr obability of 74 . 3% for rural users ( ρ rural = 25 . 7% ), compared to 60 . 7% for urban users. FairShare (with 35% rural quota) reduces the rural outage probability to 59 . 0% , effecti vely bridging the service av ailability gap with zer o temporal variance . T emporal V ariability: A striking finding, visualized in Fig. 3, is the large temporal variability of SNR Priority ( std = 0 . 93 ) compared to FairShare ( std = 0 . 00 ). As satellites orbit, the beam ov erlap pattern changes, causing co-channel T ABLE III: Cross-constellation comparison of geographic disparity . ∆ geo Constellation Alt. Sats Priority F airShare Starlink Shell 1 550 km 1,584 1.84 ± 0.93 0.68 ± 0.00 OneW eb Phase 1 1,200 km 648 1.77 ± 0.59 0.68 ± 0.00 Kuiper Shell 1 630 km 1,156 1.60 ± 0.49 0.68 ± 0.00 T ABLE IV: Impact of inter-beam co-channel interference (Starlink Shell 1). A verage SINR is computed over allocated users only . A vg. SINR (dB) ∆ geo Policy No Intf. W ith Intf. No Intf. With Intf. Equal Static 42.3 20.8 1.00 1.01 SNR Priority 47.2 32.7 2.55 1.84 Demand Prop. 42.9 22.0 1.36 1.31 FairShar e 46.6 32.1 0.68 0.68 interference to oscillate with an approximately 5-minute period. The Pearson correlation between average SINR and ∆ geo for Priority scheduling is r = 0 . 69 : when interference is low (SINR ≈ 28 dB), the urban–rural quality gap is amplified and disparity peaks at 3 . 9 × ; when interference is high (SINR ≈ 10 dB), it partially equalizes users, reducing disparity to ∼ 1 × . FairShare’ s quota mechanism renders it completely in variant to these dynamics the allocation counts per region are deterministic, yielding ∆ geo = 0 . 68 × at e very snapshot. This demonstrates that orbital dynamics expose priority-based policies as not only unfair on a verage b ut temporally unstable , while FairShare provides guaranteed fairness. Cross-Constellation V alidation: T able III demonstrates that the structural bias is not an artifact of a specific constellation geometry . All three constellations spanning altitudes from 550 to 1,200 km and sizes from 648 to 1,584 satellites exhibit significant urban bias under Priority scheduling, with ∆ geo ranging from 1 . 60 × to 1 . 84 × . FairShare achiev es an identical ∆ geo = 0 . 68 × across all three, confirming that its quota mechanism is robust to constellation design. Interference Impact: T able IV compares system beha vior with and without inter-beam co-channel interference. The 4- color frequency reuse and hexagonal beam layout reduce SINR by approximately 15 25 dB relative to interference- free SNR, placing users in a realistic operating regime. Notably , interference moderately r educes the mean disparity for Priority scheduling (from 2 . 55 × to 1 . 84 × ) because co- channel interference partially equalizes channel conditions across regions. FairShare remains in variant ( 0 . 68 × ) regardless of interference, confirming its robustness. Bandwidth Sensitivity: T able V(a) re veals that disparity un- der Priority scheduling incr eases with bandwidth. At 200 MHz, the structural bias emerges ( 1 . 29 × ); at 300 MHz it reaches 1 . 65 × . Below 200 MHz, the system is saturation-limited and T ABLE V: Sensitivity analysis (single-snapshot, no- interference baseline). ∆ geo = ρ urban / ρ rural ( × ); consistent with multi-snapshot results (T able II). (a) Bandwidth Impact BW Equal Priority Demand FairShare 200 MHz 1.00 1.29 1.25 0.72 300 MHz 1.00 1.65 1.40 0.72 (b) Rural Quota T unability Quota ∆ geo Interpretation 25% 1.11 Urban Bias 30% 0.80 Mild Rural Favor 35% (Def.) 0.72 ‡ Affirmati ve Action 40% 0.50 Strong Rural Priority ‡ Achiev es ∆ geo = 0 . 68 under multi-snapshot with interference (T able II). all policies yield ∆ geo = 1 . 00 . FairShare maintains 0 . 72 × regardless of bandwidth. Quota T unability: T able V(b) demonstrates FairShare’ s flexibility: adjusting the rural quota from 25% to 40% shifts ∆ geo from urban-biased ( 1 . 11 × ) to strongly rural-f av oring (0 . 50 × ), enabling regulators to set precise fairness tar gets. B. Computational Efficiency Benchmarked on an H100 GPU, FairShare achie ves a 3.3% speedup over Priority scheduling (9.89 s vs. 10.22 s per cycle). This gain arises from the divide-and-conquer nature of quota-based allocation: sorting three smaller regional subsets is inherently cheaper than sorting one global user pool. V I I . D I S C U S S I O N A. Aggr e gate Metrics Mask Geographic Bias Although all policies achie ve Jain’ s index J > 0 . 95 , SNR- priority scheduling yields 1 . 84 × mean urban-rural disparity up to 3 . 9 × during specific orbital configurations because aggregate metrics are inflated by the dominant urban population (50%). The interference-modulated oscillation in ∆ geo (Fig. 3) further compounds this: a regulator auditing at a single instant may observe values from 0 . 9 × to 3 . 9 × . FairShare’ s quota mechanism eliminates both problems, pro viding ∆ geo = 0 . 68 × with zero variance at e very snapshot. These findings underscore that geographic-specific metrics ( ρ ℓ , ∆ geo ) are essential for meaningful NTN fairness auditing. B. Unfairness Is P olicy Inherent The cross-constellation results (T able III) demonstrate that unfairness persists despite fundamentally different orbital parameters, and the bandwidth analysis (T able V(a)) shows disparity gr ows with capacity proving the bias is structural, not scarcity-driven. As Proposition 1 establishes, FairShare achiev es the Pareto-optimal sum-rate within any quota con- straint. Deploying more satellites or spectrum alone will not close the digital divide; re gulatory interventions must prioritize fair allocation policies . C. F airShar e as a Re gulatory T ool The partition-then-optimize design of fers regulators trans- parency (auditable quotas), efficienc y (no throughput penalty , 3.3% runtime reduction), and practicality (real-time operation). FairShare is architecturally compatible with existing spectrum gov ernance: in the FCC’ s SAS/CBRS framew ork, a centralized coordinator already enforces tiered access policies. FairShare requires only a geographic classification layer and configurable quota parameters { q ℓ } no modifications to operators’ PHY or MA C layers. The ∆ geo metric pro vides a standardized, time-in v ariant audit trail aligned with NTIA ’ s broadband equity mandates [13]. As the FCC extends shared-spectrum frame works to NGSO services [3], FairShare of fers a ready-to- deploy fairness module complementing existing interference management. W e propose mandating the reporting of ρ ℓ and ∆ geo and adopting tunable quota frameworks to set enforceable targets (e.g., ∆ geo ≤ 1 . 2 × ). D. Scope and Futur e W ork The K eplerian propagator suf fices for our 10-minute windo w; higher-order perturbations matter only for longer studies. The full-buf fer traffic and NYC-centric models provide conserv ati ve baselines; e xtension to bursty traffic, continental cov erage, and proportional-fair intra-region scheduling are natural next steps. FairShare assumes a trusted coordinator; designing incenti ve- compatible mechanisms for competitiv e markets and validating with real LEO measurements remain open. V I I I . C O N C L U S I O N Through 3GPP-compliant simulations with Keplerian orbital dynamics, inter-beam interference, and three constellation geometries, we hav e shown that SNR-priority scheduling creates a 1 . 84 × mean urban-rural disparity (peak 3 . 9 × ) a bias that is polic y-inherent, persists across constellations, and worsens with increasing bandwidth. FairShare, a lightweight quota-based framew ork, achieves ∆ geo = 0 . 68 × with zero v ariance across all conditions while reducing runtime by 3.3%. Its complete inv ariance to physical-layer dynamics makes it uniquely suited for regulatory enforcement, transforming a scheduling problem into actionable spectrum policy for closing the digital divide. A C K N O W L E D G M E N T The work by Natanzi and T ang was supported in part by NTIA A ward No. 51-60-IF007. The work by Mohammadi and Marojevic was supported in part by NSF A ward 2332661. R E F E R E N C E S [1] A. Ahmed et al. , “Overview of dynamic spectrum sharing between LEO satellites and mobile networks, ” IEEE Access , 2025. [2] International T elecommunication Union, Radio Re gulations, Edition of 2020 . ITU, 2020, article 22: Control of interference to geostationary- satellite systems. [Online]. A vailable: https://www .itu.int/pub/R- REG- RR [3] Federal Communications Commission, “FCC-24-117: Revising Spectrum Sharing Rules for Non-Geostationary Orbit, Fixed-Satellite Service Systems, ” Dec. 2024, second Report and Order on NGSO-NGSO and NGSO-GSO sharing. [Online]. A vailable: https://docs.fcc.gov/public/ attachments/FCC- 24- 117A1.pdf [4] R. Jain, D.-M. Chiu, and W . R. Hawe, “ A quantitative measure of fairness and discrimination for resource allocation in shared computer systems, ” Digital Equipment Corporation, Eastern Research Laboratory , T ech. Rep. DEC-TR-301, Sep. 1984. [Online]. A vailable: https://www .cse.wustl.edu/~jain/papers/ftp/fairness.pdf [5] J. Mo and J. W alrand, “Fair end-to-end window-based congestion control, ” IEEE/ACM T ransactions on Networking , vol. 8, no. 5, pp. 556– 567, Oct. 2000. [Online]. A vailable: https://doi.org/10.1109/90.879343 [6] B. Ahmad, “User scheduling for LEO MIMO NTN systems, ” Ph.D. dissertation, Univ ersity of Bologna, 2024. [7] M. Giordani et al. , “Spectrum sharing opportunities for 6G terrestrial and non-terrestrial networks, ” MDPI Future Internet , 2025. [8] “3GPP NTN Standards for 5G/6G, ” https://www .3g4g.co.uk/3GPP/2024_ 11_26_NTN_3GPP_stds_5G- 6G_P A4_bak.pdf, 2024. [9] M. A. V azquez et al. , “Hierarchical deep reinforcement learning for spectrum sharing in integrated TN-NTN systems, ” arXiv pr eprint arXiv:2503.06720 , 2025. [10] Y . Chen, L. Liu, Y . Li, H. Li, Q. Wu, J. Liu, and Z. Lai, “Unraveling physical space limits for LEO network scalability , ” ser . HotNets ’24. New Y ork, NY , USA: Association for Computing Machinery , 2024, p. 43–51. [Online]. A vailable: https://doi.org/10.1145/3696348.3696885 [11] ITU-R, “Recommendation ITU-R M.2160-0: Framework and overall objectiv es of the future development of IMT for 2030 and beyond, ” International T elecommunication Union, T ech. Rep., Nov . 2023, ubiquitous connecti vity and digital equity requirements. [Online]. A vailable: https://www .itu.int/dms_pubrec/ itu- r/rec/m/R- REC- M.2160- 0- 202311- I!!PDF- E.pdf [12] International T elecommunication Union (ITU), “IMT towards 2030 and beyond (IMT -2030), ” https://www .itu.int/en/ITU- R/study- groups/rsg5/ rwp5d/imt- 2030/pages/default.aspx, ITU Radiocommunication Sector (ITU-R), 2025, accessed: 2025-12. [Online]. A vailable: https://www .itu. int/en/ITU- R/study- groups/rsg5/rwp5d/imt- 2030/pages/default.aspx [13] B. Akcali Gur and J. Kulesza, “Equitable access to satellite broadband services: Challenges and opportunities for developing countries, ” T elecommunications P olicy , vol. 48, no. 5, p. 102731, 2024. [Online]. A vailable: https://www .sciencedirect.com/science/article/pii/ S0308596124000284 [14] 3GPP, “TR 38.811: Study on New Radio (NR) to support non-terrestrial networks (Release 15), ” 3rd Generation Partnership Project, T ech. Rep. V15.4.0, 2020, table 6.6.2-1 for shado w f ading parameters. [Online]. A vailable: https://www .3gpp.org/ftp/Specs/archi ve/38_series/ 38.811/38811- f40.zip [15] G. Maral, M. Bousquet, and Z. Sun, Satellite Communications Systems: Systems, T echniques and T echnology , 6th ed. Chichester , UK: John W iley & Sons, 2020. [16] ITU-R, “Recommendation ITU-R S.1528: Satellite antenna radiation patterns for non-geostationary orbit satellite antennas operating in the fixed-satellite service below 30 GHz, ” International T elecommunication Union, Radiocommunication Sector (ITU-R), Geneva, ITU-R Recom- mendation S.1528, 2001. [17] M. Aslnia, M. Soleimani, S. H. Sedighy , and A. Ebrahimi, “Statistical channel modeling for low-ele vation in LEO satellite communication, ” Results in Engineering , vol. 23, p. 102494, 2024. [Online]. A vailable: https://www .sciencedirect.com/science/article/pii/S2590123024007497 [18] Federal Communications Commission, “FCC-22-91: Space Exploration Holdings, LLC (SpaceX Gen2 Starlink), ” Dec. 2022, authorizes 7,500 satellites at 525-535 km altitude, 53° inclination. [Online]. A vailable: https://docs.fcc.gov/public/attachments/FCC- 22- 91A1.pdf [19] 3GPP, “TR 38.821: Solutions for NR to support non-terrestrial networks (NTN), ” 3rd Generation Partnership Project, T ech. Rep. V16.1.0, 2021, deployment scenarios and link budget parameters. [Online]. A vailable: https://www .3gpp.org/ftp/Specs/archiv e/38_series/38.821/ [20] O. Koudelka, “Link Budget Calculations, ” ITU-R W orkshop on Small Satellites, Prague, 2015. [On- line]. A vailable: https://www .itu.int/en/ITU- R/space/workshops/ 2015- prague- small- sat/Presentations/ITU- linkbudget.pdf
Original Paper
Loading high-quality paper...
Comments & Academic Discussion
Loading comments...
Leave a Comment