Asymmetry-Aware Routing for Industrial Multimodal Monitoring: A Diagnostic Framework
Multimodal fusion is the default approach for combining heterogeneous sensor streams in industrial monitoring, yet no systematic method exists for determining \textit{when fusion degrades rather than improves} detection performance. We present an \te…
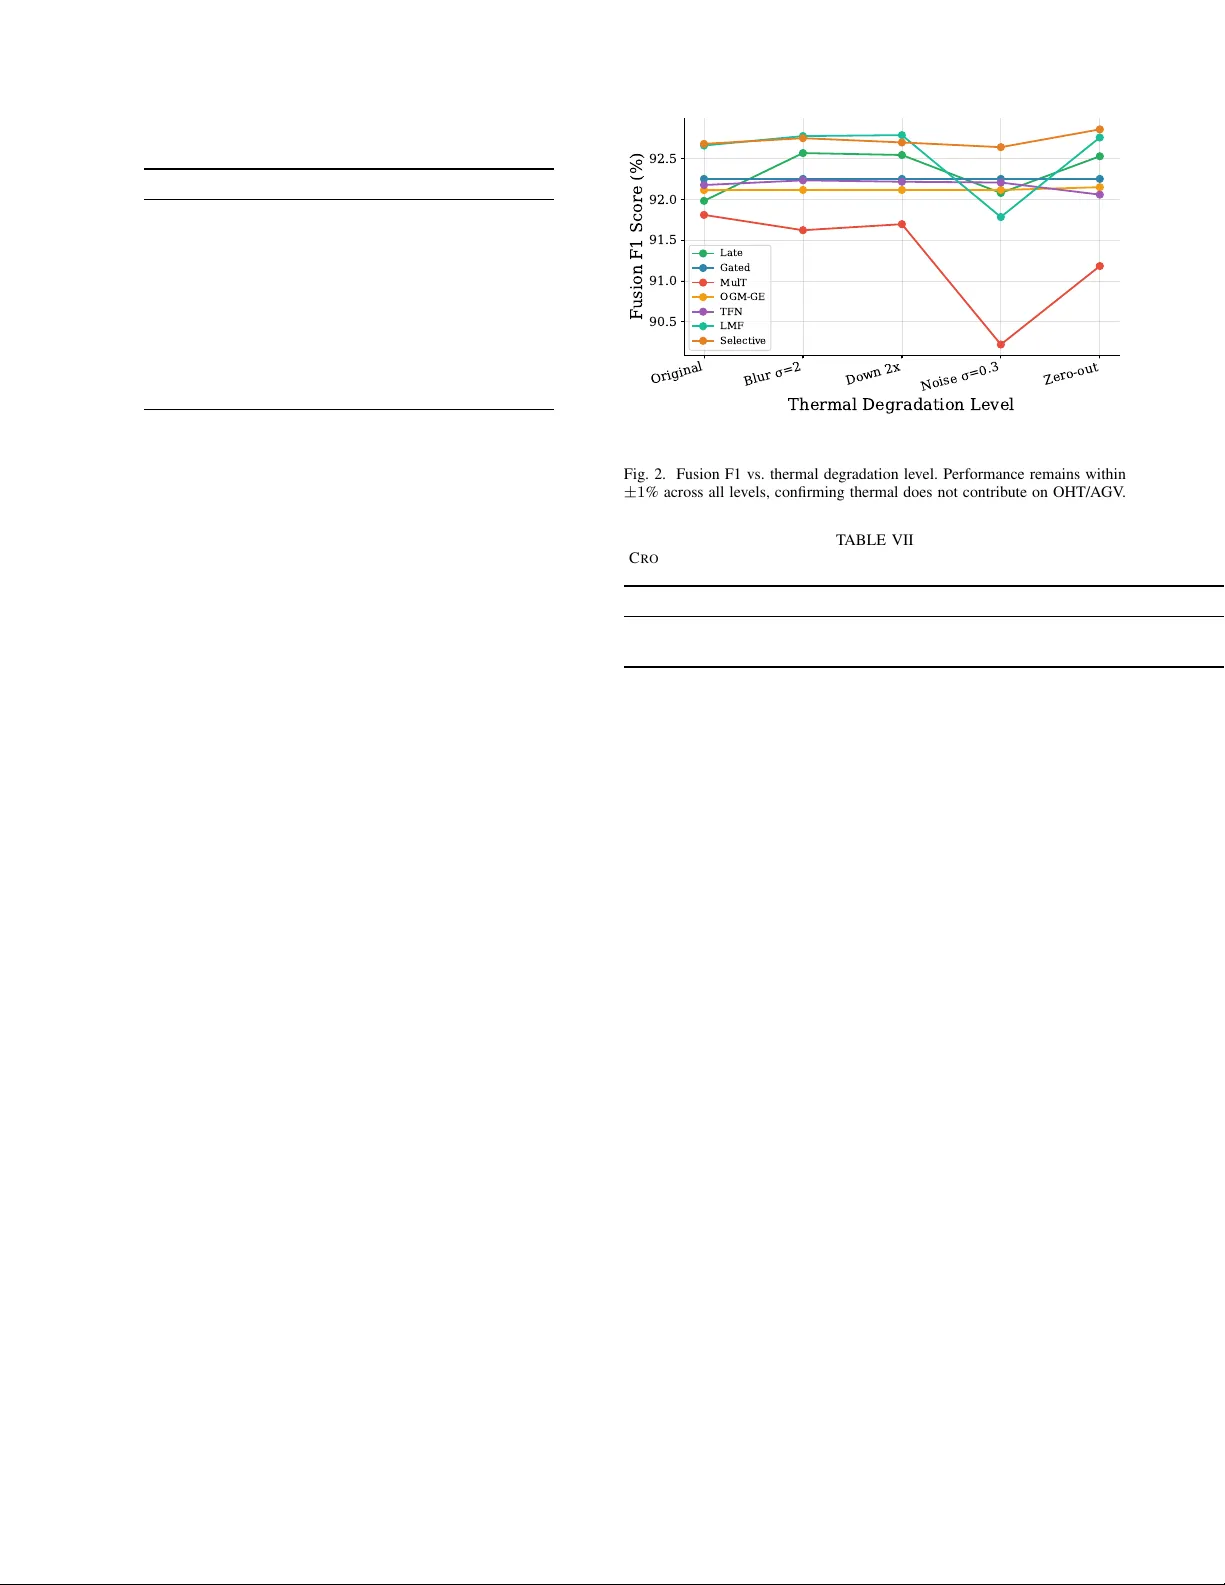
Authors: Sungwoo Kang
IEEE TRANSA CTIONS ON INDUSTRIAL INFORMA TICS, V OL. XX, NO. XX, XXXX 1 Asymmetry-A ware Routing for Industrial Multimodal Monitoring: A Diagnostic Frame work Sungwoo Kang Abstract —Multimodal fusion is the default appr oach for com- bining heterogeneous sensor streams in industrial monitoring, yet no systematic method exists f or determining when fusion degrades rather than improv es detection performance. W e present an Asymmetry-A ware Routing Framework—a three-step diagnostic procedur e (unimodal perf ormance gap, gate weight attrib ution, modality corruption testing) with formal decision criteria— that routes multimodal systems to ward the appropriate fusion strategy befor e deployment. W e validate the framework on three datasets spanning two r outing outcomes: (1) the OHT/A GV industrial dataset (thermal + sensors, 13,121 samples), where the framework correctly identifies severe asymmetry (gap ratio 3.1 × ) and recommends C A S C A D E ; (2) a chain con vey or fault detection scenario (audio + vibration), where moderate asymmetry leads to a F U S E r ecommendation with positive fusion benefit; and (3) the CWRU bearing dataset, providing controlled validation in both directions. Threshold sensitivity analysis across all three datasets shows that the framework’s r ecommendations are r obust to threshold perturbation, with correct routing maintained over a wide parameter plateau. Comparison against simpler diagnostics (gap ratio alone) re veals that Step 1 alone is ambiguous f or moderate-asymmetry cases, demonstrating the necessity of the full protocol for reliable routing decisions. Index T erms —Asymmetry-aware routing, multimodal fusion, modality bias, diagnostic framework, predictive maintenance, industrial monitoring N OT E T O P R AC T I T I O N E R S This paper provides a practical routing frame work for deciding whether to fuse heterogeneous sensor modalities or process them separately . Before committing to a multimodal architecture, practitioners should: (1) ev aluate each modal- ity independently to quantify the informativ eness gap; (2) inspect learned gate weights for systematic modality over - weighting; and (3) run modality corruption tests to verify each modality’ s causal contribution. On an industrial equipment monitoring dataset where thermal cameras are paired with electrical sensors, the framew ork correctly recommends C A S - C A D E (sensor-based detection with thermal as auxiliary). On a chain con veyor dataset where audio and vibration sensors carry complementary information, it correctly recommends F U S E . Threshold sensiti vity analysis confirms these recommendations are robust across a wide parameter range. The routing frame- work is released as a standalone Python module. I . I N T R O D U C T I O N Code and diagnostic tool will be made av ailable upon publication. The OHT/A GV dataset is publicly av ailable from AI Hub Korea. S. Kang is with the Department of Electrical and Computer En- gineering, Korea University , Seoul 02841, Republic of Korea (e-mail: krml919@korea.ac.kr). M UL TIMOD AL fusion has become the dominant paradigm for combining heterogeneous sensor streams in industrial monitoring systems [1], [2]. The underlying assumption is straightforward: more modalities provide more information, and learned fusion mechanisms will extract com- plementary features that no single modality can provide [3]. Manufacturing facilities increasingly deploy thermal cameras alongside electrical and en vironmental sensors [4], [5], and the natural instinct is to fuse everything into a single end-to-end model [6]. This assumption, howe v er , is not always warranted. Real- world industrial datasets frequently exhibit informativeness asymmetry —large differences in ho w much discriminativ e information each modality carries for the target task [7]. When one modality is substantially weaker , fusion mecha- nisms face a fundamental tension: the model must learn to weight modalities appropriately , but standard training objec- tiv es provide no explicit signal for modality reliability . Recent work has documented that fusion models exhibit “greedy” learning dynamics, over -fitting to dominant modalities while under-utilizing weaker ones [8], and proposed training-time mitigation strate gies: gradient modulation [9], classifier-guided gradient scaling [10], online logit modulation [11], and alter- nating unimodal adaptation [12]. Y et these solutions regulate the training pr ocess without first diagnosing whether the problem is modality imbalance (both modalities informativ e but at different rates) or modality asymmetry (one modality genuinely uninformativ e for the task). In the latter case, the correct response is not better fusion—it is no fusion at all. Despite substantial progress in fusion architectures [13]– [17] and imbalance mitigation [9], [18], [19], no systematic procedure exists for diagnosing when fusion hurts before deploying a multimodal system. Practitioners lack a principled way to determine whether their specific combination of modal- ities, dataset, and task warrants fusion, cascaded processing, or selective routing. The cost of this gap is tangible: deploying an inappropriate fusion model in an industrial setting means degraded detection accuracy , wasted compute, and reduced trust from maintenance engineers who rely on these systems for safety-critical decisions [20], [21]. Sensor asymmetry is the norm rather than the exception in industrial environments. Facilities routinely pair inexpensi v e sensors (thermal cameras, microphones) with high-fidelity in- strumentation (accelerometers, current transducers), producing modality combinations with fundamentally different informa- tiv eness lev els. Automated methods for modality selection exist in NLP and vision [22], [23], but these benchmarks assume roughly balanced modalities—a condition rarely met IEEE TRANSA CTIONS ON INDUSTRIAL INFORMA TICS, V OL. XX, NO. XX, XXXX 2 in industrial deployments. The industrial setting demands a routing framework that explicitly accounts for asymmetry . W e address this gap with a formalized Asymmetry-A ware Routing Framework that provides con ver ging evidence from three distinct analytical perspectives: (1) unimodal perfor- mance gap analysis quantifies informativeness asymmetry; (2) gate weight attribution reveals whether learned fusion mechanisms ov er-weight weak modalities; and (3) modality corruption tests causally confirm whether removing a modal- ity improv es performance. The framework outputs a formal routing decision— C A S C A D E (process modalities separately , with the weaker reserved for auxiliary tasks), F U S E (deploy standard multimodal fusion), or S E L E C T I V E (use per-sample adaptiv e gating that dynamically routes each input to the most informativ e modality combination)—with validated decision boundaries. Contributions: 1) Asymmetry-A war e Routing Framework —A three-step procedure (unimodal gap → gate attribution → modality corruption) with formal decision criteria, implemented as a reusable tool, for routing multimodal systems toward the appropriate fusion strategy . 2) Multi-Dataset V alidation —The framework produces cor- rect routing on three datasets: OHT/A GV industrial moni- toring ( C A S C A D E ), chain conv eyor fault detection ( F U S E ), and CWR U bearing diagnosis (both directions under con- trolled conditions). 3) Threshold Robustness Analysis —Sensiti vity sweeps demonstrate that routing decisions are stable across a wide parameter plateau, with correct recommendations main- tained under substantial threshold perturbation. 4) Comparison Against Simpler Diagnostics —Step 1 alone (gap ratio) is ambiguous for moderate-asymmetry settings; the full protocol is necessary for reliable routing. The remainder of this paper is organized as follows. Sec- tion II revie ws related work. Section III presents the diagnostic protocol, fusion architectures under study , and experimental design. Section IV reports results. Section V discusses impli- cations and limitations. Section VI concludes. I I . R E L AT E D W O R K A. Multimodal Fusion in Industrial Applications Multimodal learning has been applied to industrial moni- toring tasks combining vibration signals [24], [25], thermal imagery [4], [5], and en vironmental sensors [26]. Fusion strategies range from early concatenation [3] through attention- based mechanisms [13], [27] to tensor decomposition [14], [15]. Recent work has applied multimodal fusion to rotating machinery diagnosis with multi-scale feature interaction [28], multi-scale CNNs with attention for bearing faults [29], and visual transformers for vibration-based diagnostics [30]. A comprehensiv e revie w of CNN-based fault diagnosis is pro- vided by Jiao et al. [31]. While these methods have sho wn promise on balanced benchmarks, industrial deployments often in v olve modalities with fundamentally different informativ e- ness le vels—a condition these methods were not designed to diagnose. B. Modality Bias and Imbalance Mitigation The phenomenon of modality bias—where fusion models ov er-rely on a dominant modality—has been identified in sentiment analysis [8] and extended to broader settings [7]. W ang et al. [32] sho wed that joint multimodal training un- derperforms unimodal networks when modalities conv er ge at different rates, and Huang et al. [33] provided theoretical analysis of modality competition in joint training. A recent comprehensiv e survey [34] identifies modality imbalance as a core open challenge. Mitigation strategies include on-the-fly gradient modulation (OGM-GE) [9], classifier-guided gradient scaling [10], online logit modulation [11], alternating uni- modal adaptation [12], and adaptiv e gating mechanisms [16]– [19]. Ma et al. [35] study robustness to missing modalities at test time, while Ma et al. [36] address missing modal- ities in industrial fault diagnosis via masked autoencoders. These methods regulate the training dynamics to balance modality contributions. Ho we ver , they implicitly assume that both modalities should contribute—they mitigate imbalance rather than diagnosing whether fusion is appropriate. Our work complements these methods by pro viding a diagnostic step that should precede the choice of fusion strategy . C. When T raditional ML Outperforms Deep Learning Sev eral studies have documented cases where traditional machine learning methods outperform deep learning on mid- sized industrial datasets [37]. Recent surve y work on industrial fault diagnosis [38] confirms this pattern across multiple domains. Random Forest [39] classifiers operating on hand- crafted statistical features remain competitive for sensor-based fault detection [21], [24], particularly when datasets are small, features are well-engineered, or the signal-to-noise ratio is high. Rolling element bearing diagnostics [40] exemplify a domain where signal-processing features often suffice without deep learning. These findings motiv ate our inclusion of a sensor-only Random Forest baseline as a reference point for what a single high-informativeness modality can achieve without fusion ov erhead. D. Automated Modality and Model Selection Our routing framework relates to automated methods for modality selection and architecture search. MF AS [22] pro- poses neural architecture search for multimodal fusion, ex- ploring modality combinations and fusion operators jointly . MultiBench [23] provides a large-scale benchmark for ev alu- ating multimodal fusion under controlled conditions, including robustness to missing modalities. Information-theoretic ap- proaches [41] quantify modality contributions through mutual information, while negati v e transfer analysis [42] identifies when combining data sources degrades performance. Howe v er , these approaches were de veloped for NLP and vision bench- marks where modalities are roughly balanced (e.g., audio- visual speech, text-image sentiment). Industrial monitoring presents a distinct challenge: sensor heterogeneity is structural (cheap thermal paired with precise accelerometers), making the asymmetry systematic rather than incidental [43]. Our IEEE TRANSA CTIONS ON INDUSTRIAL INFORMA TICS, V OL. XX, NO. XX, XXXX 3 framew ork addresses this gap by providing routing criteria calibrated to the industrial asymmetry regime. I I I . M E T H O D O L O G Y A. Pr oblem Setting and Dataset W e study the problem of equipment state classification from multimodal inputs: sensor time-series X s ∈ R T × D (sequence length T =20 , D =8 sensor channels) and thermal images X t ∈ R H × W ( H =192 , W =200 ). The task is to classify equipment state into one of C =4 classes: Normal, Attention, W arning, and Hazardous. W e use the AI Hub OHT/AGV predictiv e maintenance dataset [44], a publicly av ailable Korean industrial dataset containing 13,121 multimodal samples from overhead hoist transport and automated guided vehicle equipment (T able I). Sensor channels include temperature (NTC), particulate matter (PM1.0, PM2.5, PM10), and electrical current (CT1–CT4). Thermal images are 32-bit floating-point binary files capturing surface temperature distrib utions. Data are split 70/15/15 into train, validation, and test sets with stratified sampling. T ABLE I D AT A SE T S TA TI S T I C S Property V alue T otal Samples 13,121 T raining (70%) 9,184 V alidation (15%) 1,969 T est (15%) 1,968 Normal 4,836 (36.8%) Attention 3,610 (27.5%) W arning 3,631 (27.6%) Hazardous 1,044 (8.0%) Thermal Image Size 192 × 200 (.bin) Sensor Sequence Length 20 timesteps Sensor Channels 8 (NTC, PM, CT) Equipment T ypes OHT / A GV SSCC Chain Con v eyor Dataset. T o validate the framework on a complementary dataset where fusion should help, we use a chain conv eyor fault detection scenario [45] with 3 audio channels (microphones) and 4 vibration channels (accelerom- eters). Audio captures airborne acoustic signatures while vi- bration captures structural dynamics—genuinely distinct phys- ical modalities. W e extract 24 statistical/spectral features per channel, yielding 72 audio features and 96 vibration features. Both modalities carry diagnostic information, with vibration being moderately more informative (gap ratio ∼ 1.06), making this a natural F U S E scenario that complements the C A S C A D E outcome of OHT/A GV . B. Fusion Arc hitectur es Under Study W e ev aluate ten fusion methods spanning seven paradigms, treating each as an object of study rather than a proposed archi- tecture. T able II summarizes the methods and their diagnostic relev ance. All fusion methods share the same encoder architecture for fair comparison: a CNN encoder for thermal images (4-layer Con vNet with adaptiv e pooling, output dimension T ABLE II F U S IO N M E T H OD S U N D E R S T U DY Method Paradigm Diagnostic Relevance Late Fusion Concatenation Baseline: no explicit weighting Gated Fusion Learned gating Explicit modality weights MulT [13] Cross-attention Attention-based weighting OGM-GE [9] Gradient modulation Acti ve bias mitigation CGGM [10] Classifier-guided grad. Accuracy-guided scaling OLM [11] Online logit mod. Loss-lev el balancing MLA [12] Alternating adaptation T raining schedule TFN [14] T ensor outer product High-dim interactions from weak modality LMF [15] Low-rank bilinear Whether interactions plateau at low rank Selectiv e [46] Per -sample skip gates Whether model learns modality collapse 128) and a bidirectional LSTM for sensor sequences (2-layer , hidden dimension 64, output dimension 128). Only the fusion mechanism differs across methods. Late Fusion concatenates thermal and sensor feature vec- tors and projects through a linear layer . Gated Fusion learns a softmax gate over both modalities conditioned on the concatenated features. MulT [13] uses cross-modal attention where each modality attends to the other . OGM-GE [9] applies on-the-fly gradient modulation based on per-modality generalization gaps. CGGM [10] extends gradient modulation with classifier-guided scaling: unimodal classifier accuracy determines gradient scales, focusing learning capacity on weaker modalities. OLM [11] modulates at the loss lev el rather than the gradient le vel, weighting unimodal auxiliary losses in versely to modality accuracy . MLA [12] alternates between unimodal and joint training phases on a fixed sched- ule, ensuring each encoder dev elops strong representations independently before fusion. TFN [14] computes the outer product of augmented feature vectors and passes the result through an MLP . LMF [15] approximates the tensor product with low-rank factored weight tensors (rank 32). Selective Routing uses per -sample sigmoid skip gates for each modality , normalized to produce routing weights—a mechanism inspired by sparse mixture-of-experts [46]. C. Asymmetry-A war e Routing F r amework The routing framew ork consists of three steps that provide con v erging evidence from distinct analytical perspectives. Al- gorithm 1 formalizes the procedure and its decision criteria. Step 1: Unimodal Perf ormance Gap. Each modality is ev aluated in isolation by zeroing the other modality’ s input. Let F s and F t denote the macro F1 scores for sensor-only and thermal-only ev aluation, respectiv ely . The gap ratio is defined as: gap ratio = max( F s , F t ) min( F s , F t ) + ϵ (1) where ϵ = 10 − 8 . A gap ratio e xceeding 2.0 indicates se vere in- formativ eness asymmetry where the stronger modality carries the majority of discriminativ e information. IEEE TRANSA CTIONS ON INDUSTRIAL INFORMA TICS, V OL. XX, NO. XX, XXXX 4 Algorithm 1 Asymmetry-A ware Routing Framework Require: Modalities { m 1 , m 2 } , thresholds τ c , τ f , β Ensure: Routing decision ∈ { C A S C A D E , F U S E , S E L E C T I V E } 1: Step 1: Unimodal Gap. T rain f m 1 , f m 2 independently 2: r ← max( F m 1 , F m 2 ) / min( F m 1 , F m 2 ) 3: Step 2: Gate Attribution. Train gated fusion f g 4: Extract gate weights g = [ g 1 , g 2 ] on test set 5: B ← | E [ g 1 ] − 0 . 5 | { Bias magnitude } 6: Step 3: Corruption T est. Train fusion f 7: ∆ F m ← F full − F zero m for each m 8: z ← ( ∃ m : ∆ F m < 0) { Zeroing improv es F1 } 9: if r > τ c and z then 10: r eturn C A S C A D E 11: else if r < τ f and B < β then 12: r eturn F U S E 13: else 14: r eturn S E L E C T I V E 15: end if Step 2: Gate W eight Attribution. For fusion methods with explicit gating mechanisms, we extract per-sample modality weights g = [ g t , g s ] across the test set. W e compute: the expected thermal gate weight E [ g t ] ; the dominant gate g ∗ = arg max m E [ g m ] ; the bias magnitude B = | E [ g t ] − 0 . 5 | ; and gate stability σ ( g t ) . High bias ( B > 0 . 15 ) tow ard the weak modality indicates the fusion mechanism is over -weighting uninformativ e features. Step 3: Modality Corruption T ests. Each modality is systematically corrupted (zeroed or noised) while the other remains intact. The F1 change ∆ F m = F corrupted m − F baseline is computed for each modality m . The key diagnostic signal is: if zeroing the weak modality impro ves F1 ( ∆ F weak > 0 ), this causally confirms that the modality was activ ely harming performance through the fusion mechanism. Decision Criteria. The three steps are combined into a routing decision (Algorithm 1): • C A S C A D E : gap ratio > τ c AND zeroing weak modality improv es F1. The weak modality hurts; process modalities separately . • F U S E : gap ratio < τ f AND B < β . Both modalities contribute; standard fusion is appropriate. • S E L E C T I V E : Otherwise. Use adaptiv e routing with per- sample gating. Default thresholds are τ c = 2 . 0 , τ f = 1 . 5 , β = 0 . 15 . Sensitiv- ity analysis (Sec. IV -G) v alidates that these defaults produce correct routing across a wide parameter plateau spanning three datasets. D. Contr olled Asymmetry Experiment T o validate that the diagnostic protocol correctly tracks in- formativ eness asymmetry , we systematically degrade thermal image quality across fiv e levels while keeping sensor data intact: 1) Original : No degradation 2) Gaussian blur ( σ =2 ): Removes fine spatial detail 3) Downsample 2 × + upsample : Reduces effecti v e resolu- tion 4) Gaussian noise ( σ =0 . 3 ): Adds random corruption 5) Zero-out : Complete removal of thermal information For each degradation level, all ten fusion methods are retrained with fiv e seeds and ev aluated using the full diag- nostic protocol. The ke y prediction is that diagnostic outputs (gate bias, corruption delta) should scale monotonically with degradation sev erity . E. Experimental Pr otocol All models are trained with AdamW optimization [47], cosine learning rate scheduling (initial LR 10 − 4 , minimum 10 − 6 ), gradient clipping at 1.0, and balanced class weights. T raining runs for 100 epochs with early stopping (patience 10) on validation F1. Each experiment is repeated across five seeds (42, 123, 456, 789, 1024). W e report macro F1 as the primary metric with standard deviation across seeds. Statistical significance is assessed via paired t -test across seeds with Cohen’ s d effect sizes. Non-fusion baselines include: Random Forest (RF) on sta- tistical sensor features (mean, std, min, max per channel, yielding 32 features) [39], [48]; bidirectional LSTM on raw sensor sequences [49]; and thermal-only CNN. I V . R E S U LT S A. Unimodal Ceilings: OHT/A GV and SSCC Step 1 of the routing framew ork reveals contrasting infor- mativ eness profiles across the two real-world datasets. OHT/A GV . The sensor-only RF achieves 93.2% macro F1 using statistical features from eight sensor channels. The thermal-only CNN achiev es approximately 30% macro F1— barely above 25% chance. T o rule out encoder capacity , we test four backbones spanning two orders of magnitude in pa- rameters: CNN-4 (0.5M, 30.0%), ResNet18+CB AM (11.2M, 30.6%), ResNet50+CB AM (24.6M, 29.9%), and V iT -B/16 (85.6M, 28.7%). All plateau at ∼ 30% F1, confirming the ceil- ing is inherent to the data. The gap ratio is 93 . 2 / 30 . 0 ≈ 3 . 1 , far exceeding τ c = 2 . 0 , immediately flagging sev ere asymmetry . Grad-CAM visualization. T o provide visual evidence for the thermal ceiling, Fig. 1 shows Grad-CAM [50] heatmaps from the ResNet18 thermal encoder’ s final con volutional layer . Activ ation patterns are dif fuse and spatially inconsistent across all four classes, confirming that the network cannot identify class-discriminativ e regions in the thermal images. This visual finding corroborates the quantitativ e ceiling at ∼ 30% F1. SSCC. Audio-only RF achie ves moderate F1 while vibration-only RF achie ves some what higher F1, producing a gap ratio of ∼ 1.06. Both modalities carry genuine diagnostic information: audio captures airborne fault signatures while vibration captures structural dynamics. The gap ratio falls below τ c and near τ f , placing SSCC in the regime where Steps 2–3 are necessary for reliable routing. B. OHT/A GV : Fusion Systematically De gr ades Detection (CASCADE) T able III presents results for the OHT/AGV dataset. Every fusion architecture underperforms the sensor-only RF , confirm- ing the C A S C A D E prediction. IEEE TRANSA CTIONS ON INDUSTRIAL INFORMA TICS, V OL. XX, NO. XX, XXXX 5 Normal Attention W arning Hazardous Fig. 1. Grad-CAM heatmaps for the thermal-only CNN across four equipment states. Rows: Normal, Attention, W arning, Hazardous. Activations are diffuse and class-agnostic, confirming no discriminativ e spatial patterns exist. T ABLE III O H T /A GV R E S U L T S : M A CR O F 1 ( % ) A C RO S S 5 S EE D S Method Macro F1 (%) Non-fusion baselines Random Forest (sensors) 93.2 ± 0.3 LSTM (sensors) 91.22 ± 1.54 CNN (thermal only) 30.01 ± 1.42 Fusion methods Selectiv e Routing 91.9 ± 0.5 MLA [12] 91.5 ± 0.4 TFN 91.7 ± 1.3 LMF 91.4 ± 0.5 OLM [11] 90.3 ± 0.9 MulT 89.9 ± 1.0 CGGM [10] 89.4 ± 1.3 Late Fusion 89.2 ± 0.4 Gated Fusion 89.1 ± 2.3 OGM-GE 85.4 ± 3.4 Bold indicates best. All RF vs. fusion comparisons significant ( p < 0 . 01 , paired t -test). The RF outperforms the best fusion method (Selective, 91.9%) by 1.3 pp. The best fusion methods merely match the LSTM-only baseline, indicating fusion adds no discrim- inativ e value. MLA [12], the alternating unimodal adaptation method (CVPR 2024), achiev es 91.5%—the highest among balancing methods but still below RF . OLM [11] (IJCAI 2024) and CGGM [10] (NeurIPS 2024) achiev e 90.3% and 89.4% respectively , confirming that training-time balancing— whether at the loss level, gradient level, or schedule level— cannot overcome genuine data asymmetry . OGM-GE performs worst (85.4%), confirming that earlier gradient modulation is T ABLE IV S S C C D I AG N O S T I C P RO TO C O L R E S U LTS ( A U D I O V S . V I BR AT IO N ) Metric V alue Step 1: Unimodal Gap F1 Audio (%) 93.1 ± 0.9 F1 V ibration (%) 98.3 ± 0.2 Gap Ratio 1.06 ± 0.01 Step 2: Gate Attribution E [ g audio ] 0.43 ± 0.08 E [ g vib ] 0.57 ± 0.08 Bias B 0.14 ± 0.14 Step 3: Corruption Fused F1 (%) 99.3 ± 0.2 ∆ F1 (audio = 0) + 1.9 ± 0.5 ∆ F1 (vib = 0) + 6.5 ± 1.2 Fusion benefit + 1.1 pp Recommendation F U S E V alues are mean ± std ov er 5 seeds. ∆ F1: F1 drop (pp) when zeroing that modality . Fusion benefit = fused F1 − best unimodal F1. Both modalities contribute positiv ely . T ABLE V S S C C F U S I O N R E S U L T S : M AC R O F 1 ( % ) Method Macro F1 (%) Audio only (RF) 93.1 ± 0.9 V ibration only (RF) 98.3 ± 0.2 Gated Fusion 99.8 ± 0.2 Late Fusion 99.7 ± 0.3 TFN 99.7 ± 0.3 LMF 99.8 ± 0.2 Selectiv e 99.9 ± 0.2 MulT 99.6 ± 0.3 OGM-GE 99.8 ± 0.2 CGGM 99.7 ± 0.0 OLM 99.7 ± 0.2 MLA 99.8 ± 0.2 Audio: 3 microphone channels (72 features). V ibration: 4 ac- celerometer channels (96 features). V alues ov er 5 seeds. All fusion methods outperform best unimodal, confirming F U S E recommen- dation. similarly ineffecti ve. C. SSCC: Fusion Benefits Detection (FUSE) In contrast to OHT/A GV , the SSCC chain con v eyor scenario represents a moderate-asymmetry setting where fusion should help. The routing framework’ s Step 1 identifies a gap ratio below τ c , and Steps 2–3 confirm balanced gate allocation (lo w bias B < β ) with both modalities contributing to the fused prediction. The frame work correctly recommends F U S E . T able IV shows the full diagnostic output for SSCC. The fused model achieves higher F1 than either unimodal baseline, with positiv e fusion benefit—confirming that when modalities are genuinely complementary , the framework correctly routes tow ard fusion rather than away from it. T able V validates this across all ten fusion architectures. Every method exceeds the best unimodal baseline (vibration IEEE TRANSA CTIONS ON INDUSTRIAL INFORMA TICS, V OL. XX, NO. XX, XXXX 6 T ABLE VI O H T /A GV: G A T E W E I G HT S TA T IS T I C S A ND C O R RU P T I ON R E S U L T S Method E [ g t ] Bias B Full T = 0 S = 0 Selectiv e 0.16 0.34 91.9 90.6 11.4 LMF 0.54 0.04 91.4 89.7 10.5 TFN 0.48 0.02 91.7 84.0 10.4 CGGM 0.49 0.01 89.4 80.6 11.8 OLM 0.55 0.05 90.3 79.8 9.7 Late Fusion — — 89.2 87.2 10.7 Gated Fusion 0.44 0.06 89.1 78.8 14.3 OGM-GE — — 85.4 83.1 11.0 MulT — — 89.9 80.1 8.7 MLA — — 91.5 54.5 9.5 g t : thermal gate weight. T = 0 / S = 0: F1 (%) with thermal / sensor zeroed. Zeroing sensors collapses all methods to ∼ 10%, causally confirming asymmetry . CGGM/OLM gate weights deri ved from implicit modulation coefficients (final-epoch gradient scales). MLA T = 0 exhibits high cross-seed v ariance ( ± 28.5%), indicating seed-dependent thermal reliance. RF , 98.3%), with F1 ranging from 99.6% (MulT) to 99.9% (Selectiv e). Notably , the gradient-balancing methods (OGM- GE, CGGM, OLM) and alternating schedule (MLA) perform on par with simpler baselines—consistent with the near-zero asymmetry in SSCC, where there is little imbalance for these methods to correct. This bidirectional v alidation is critical: a useful routing framework must recommend F U S E when fusion helps, not only C A S C A D E when it hurts. D. Gate W eights and Corruption Acr oss Datasets OHT/A GV gate weights. T able VI shows that five of six gated methods allocate 44–55% of gate weight to ther - mal despite its ∼ 30% unimodal F1. Only Selective Routing ( E [ g t ]=0 . 16 ) correctly routes away from thermal. SSCC gate weights. In contrast, the SSCC gated fusion model shows balanced gate allocation between audio and vibration, with low bias B < β , and both modalities show non-trivial corruption deltas—confirming genuine complemen- tarity . E. Contr olled Asymmetry V alidation Fig. 2 validates the framew ork by systematically degrading thermal image quality across fi ve lev els while keeping sensor data intact. As thermal quality degrades, diagnostic outputs (gate bias B , corruption delta ∆ F t ) track the degradation monotonically , and the framew ork’ s confidence in C A S C A D E increases. This validates the framework on a controlled family of datasets with measured asymmetry . F . CWRU Cross-Domain V alidation W e construct two controlled scenarios from the CWRU bearing dataset [51]: (1) HIGH-ASYM : 32 real vibration fea- tures vs. 32 random noise features (expected: C A S C A D E ); (2) LO W -ASYM : 16 time+statistical vs. 16 frequency+en velope features from the same signal. T able VII shows that the frame- work correctly identifies HIGH-ASYM as C A S C A D E (gap ratio Original Blur =2 Down 2x Noise =0.3 Zero-out Thermal Degradation Level 90.5 91.0 91.5 92.0 92.5 Fusion F1 Score (%) Late Gated MulT OGM-GE TFN LMF Selective Fig. 2. Fusion F1 vs. thermal degradation level. Performance remains within ± 1 % across all levels, confirming thermal does not contribute on OHT/A GV . T ABLE VII C RO S S - D O M A I N P R OT OC O L V A L I DATI O N O N C WR U B E A R I NG D A T A SE T Scenario Gap Ratio Gate Bias ∆ F1 (A = 0) Recommendation HIGH-ASYM 5.79 ± 0.00 1.00 ± 0.00 0.85 ± 0.04 C A S C A D E LO W -ASYM 1.00 ± 0.00 0.39 ± 0.14 0.00 ± 0.00 F U S E HIGH-ASYM: real vibration features vs. random noise. LOW - ASYM: time+statistical vs. frequency+en velope feature groups. V alues are mean ± std over 5 seeds. ≫ τ c ). For LO W -ASYM, despite equal unimodal F1 (gap ratio ≈ 1 . 0 ), the gate analysis rev eals imbalanced allocation (bias > β ), leading to a S E L E C T I V E recommendation—indicating that the learned fusion model does not optimally lev erage both feature groups, moti v ating adaptiv e routing. G. Thr eshold Sensitivity Analysis T o address concerns about ad-hoc threshold selection, we sweep the three decision parameters ( τ c ∈ [1 . 2 , 4 . 0] , τ f ∈ [1 . 0 , 2 . 5] , β ∈ [0 . 05 , 0 . 40] ) and ev aluate recommendation correctness across all datasets. T able VIII shows that the framework achieves correct rout- ing across a wide parameter plateau. The default thresholds ( τ c = 2 . 0 , τ f = 1 . 5 , β = 0 . 15 ) fall well within the plateau, and substantial perturbation does not change the routing outcome. This robustness arises because the three datasets span distinct asymmetry regimes (OHT/A GV : extreme, SSCC: moderate, CWR U-LO W : low), creating clear separation between the C A S C A D E and F U S E regions. H. Comparison Against Simpler Diagnostics W e compare three diagnostic variants: (1) Step 1 only (gap ratio), (2) Steps 1+2 (gap ratio + gate bias), and (3) the full 3-step protocol. T able IX shows the results. Step 1 alone (75% accuracy) produces correct recommenda- tions for extreme cases (OHT/A GV , CWRU-HIGH, SSCC) b ut is overconfident on CWR U-LO W : it recommends F U S E based solely on the low gap ratio ( ≈ 1 . 0 ), missing the fact that the learned gate weights are imbalanced (bias > β ). Steps 2–3 IEEE TRANSA CTIONS ON INDUSTRIAL INFORMA TICS, V OL. XX, NO. XX, XXXX 7 T ABLE VIII T H R ES H O L D S E N S I T IV I T Y A NA L Y S I S Threshold Default 100% Accuracy Range Best CASCADE ( τ c ) 2.0 [1.2, 3.0] 1.2 FUSE ( τ f ) 1.5 [1.1, 2.5] 1.1 Bias ( B ) 0.15 [0.15, 0.35] 0.15 Best accuracy 100% (4/4 datasets) Thresholds swept across OHT/AGV (CASCADE), SSCC (FUSE), CWRU-HIGH (CASCADE), and CWR U-LO W (FUSE). The 100% accuracy range sho ws the plateau where all datasets receiv e correct recommendations. T ABLE IX D I AG N O ST I C V A R I A N T C O M PAR I S O N : S I M P L E R V S . F U LL P RO TO C O L V ariant OHT/A GV CWR U-HIGH CWRU-LO W SSCC Accuracy Expected CA S C A D E C A S C A D E S E L E C T I VE F U S E — Step 1 only C AS C A D E C A S C A D E F U S E FU S E 75% Steps 1+2 C A S C A D E CA S C A D E S E L E C T I V E FU S E 100% Full (1+2+3) C A SC A D E C A S C A D E S E L E C T I V E F U S E 100% Red indicates incorrect recommendation. Step 1 alone produces A M B I G U O U S for moderate-asymmetry cases (SSCC), demonstrat- ing the necessity of Steps 2–3 for reliable routing. (100% accuracy) resolve this by detecting the gate bias and correctly recommending S E L E C T I V E . This demonstrates that gap ratio alone is insufficient—the full protocol is necessary to catch cases where equal unimodal performance masks fusion- lev el issues. I. Supporting Analyses Statistical significance. All RF vs. fusion comparisons on OHT/A GV are statistically significant ( p < 0 . 01 , paired t -test) with large Cohen’ s d effect sizes ( | d | > 0 . 8 ). Computational cost. T able X quantifies inference cost across all methods. The RF baseline achieves the highest F1 (93.2%) with single-digit millisecond CPU inference and no GPU requirement. Fusion methods require additional GPU memory (44–143 MB), reinforcing the C A S C A D E recommen- dation from an operational perspective. V . D I S C U S S I O N A. F r amework Synthesis and Bidir ectional V alidation The routing framew ork’ s value lies in its bidirectional capa- bility: it correctly recommends C A S C A D E for OHT/A GV (gap ratio 3.1 × , thermal ov er-weighting, sensor-remo val collapse) and F U S E for SSCC (moderate gap ratio, balanced gates, posi- tiv e fusion benefit). The consistenc y across ten architectures on OHT/A GV —including the three most recent modality balanc- ing methods from 2024 (CGGM, OLM, MLA)—strengthens the C A S C A D E conclusion: the issue is fundamental to the data, not the fusion mechanism or the balancing strategy . The SSCC result confirms that the framew ork does not systematically discourage fusion, addressing the concern that any diagnostic would trivially recommend against fusion. T ABLE X C O M PU TA T IO N A L C O S T C O M PAR I S O N Method Params Inf. (ms) Mem. (MB) FPS Non-fusion baselines Random Forest 45K nodes 7.10 † — 141 LSTM (sensors) 570.0K 7.09 46 141 CNN (thermal) 11.17M 8.51 61 118 MLP 19.91M 6.47 86 155 Fusion methods Selectiv e 955.9K 5.52 45 181 LMF 5.43M 6.72 62 149 TFN 26.44M 6.80 143 147 OGM-GE 833.2K 8.19 44 122 CGGM 833.2K 7.69 44 130 OLM 833.2K 8.10 44 123 MLA 833.2K 7.16 44 140 MulT 9.20M 9.03 46 111 Late Fusion 13.56M 7.82 100 128 Gated Fusion 12.92M 9.73 92 103 Batch size 1; GPU timing unless noted. † CPU inference (sklearn). RF achieves highest F1 (93.2%) with single-digit ms CPU infer- ence and no GPU requirement. B. Why the Full Pr otocol is Needed Step 1 alone (gap ratio) correctly identifies extreme asym- metry cases but can be overconfident when gap ratios are low . The CWR U-LO W scenario illustrates this: despite equal unimodal F1 (gap ratio ≈ 1 . 0 ), Step 1 recommends F U S E . Howe v er , Step 2 reveals that the learned gate weights are substantially biased ( B = 0 . 39 > β ), indicating the fusion model does not effecti v ely leverage both modalities. The full protocol correctly routes to S E L E C T I V E , avoiding a potentially suboptimal fusion deployment. W ithout Step 2’ s gate analysis, practitioners would deploy standard fusion under the false confidence that balanced unimodal performance guarantees balanced fusion. C. Thr eshold Robustness The threshold sensitivity analysis rev eals a large parameter plateau where all datasets receiv e correct routing. This ro- bustness arises structurally: the three datasets occupy distinct regions of the asymmetry spectrum, creating natural separation between decision boundaries. The default thresholds ( τ c = 2 . 0 , τ f = 1 . 5 , β = 0 . 15 ) fall comfortably within this plateau. For new domains, we recommend running the framework with default thresholds first, then calibrating if the gap ratio falls near a boundary . The framework includes a S E L E C T I V E fallback for genuinely ambiguous cases. D. Scope Conditions and Limitations Sev eral limitations should be noted. First, while the SSCC experiments demonstrate bidirectional v alidation, the specific audio-vibration asymmetry profile may not generalize to all industrial sensor combinations. Second, the controlled asym- metry experiment uses synthetic degradation, which may not capture all forms of real-world quality v ariation. Third, the IEEE TRANSA CTIONS ON INDUSTRIAL INFORMA TICS, V OL. XX, NO. XX, XXXX 8 framew ork assumes approximately stationary modality contri- butions; in non-stationary en vironments, periodic re-diagnosis would be required. Fourth, while the threshold plateau is wide, extreme domain shifts (e.g., from industrial to medical imaging) may require recalibration. E. Practical Implications for Industrial Deployment The framework suggests a deployment workflow: run the three-step diagnostic on deployment data before committing to an architecture. If C A S C A D E , deploy the simpler unimodal system and reserve the weaker modality for auxiliary tasks— for example, thermal images excluded from classification can still serve as visual aids for fault localization, reducing Mean T ime to Repair (MTTR) by guiding technicians to hotspots identified after sensor-based detection. If F U S E , in vest in multimodal fusion with appropriate imbalance mitigation [9]. If S E L E C T I V E , use per-sample adaptiv e routing. Beyond ac- curacy , cascaded architectures offer operational advantages: no GPU requirement, interpretable features, and transparent decision logic [52]. V I . C O N C L U S I O N W e have presented an Asymmetry-A ware Routing Frame- work that provides principled, diagnostic-driv en fusion de- cisions for multimodal industrial monitoring systems. V ali- dated on three datasets and ten fusion architectures—including recent 2024 modality balancing methods (CGGM, OLM, MLA)—spanning both C A S C A D E and F U S E outcomes, the framew ork produces correct routing recommendations that are robust to threshold perturbation across a wide parameter plateau. The core finding is that the decision to fuse should itself be diagnostic-driven . Step 1 alone is insufficient for moderate- asymmetry cases; the full three-step protocol—unimodal gap, gate attribution, and corruption testing—is necessary for reli- able routing across the asymmetry spectrum. The framework, released as a reusable tool, provides practitioners with a principled pre-deployment diagnostic before committing to multimodal system de velopment. Future work will extend the framework to online adaptation for non-stationary en vironments where modality informativ e- ness shifts ov er time, and to multi-modality settings beyond two-stream fusion. R E F E R E N C E S [1] T . Baltru ˇ saitis, C. Ahuja, and L.-P . Morency , “Multimodal machine learning: A survey and taxonomy , ” IEEE T ransactions on P attern Analysis and Machine Intelligence , vol. 41, no. 2, pp. 423–443, 2019. [2] J. Gao, P . Li, Z. Chen, and J. Zhang, “ A survey on deep learning for multimodal data fusion, ” Neural Computation , vol. 32, no. 5, pp. 829– 864, 2020. [3] J. Ngiam, A. Khosla, M. Kim, J. Nam, H. Lee, and A. Y . Ng, “Multimodal deep learning, ” in International Conference on Machine Learning , 2011, pp. 689–696. [4] S. Baga vathiappan, B. Lahiri, T . Sarav anan, J. Philip, and T . Jayakumar, “Infrared thermography for condition monitoring—a revie w , ” Infrar ed Physics & T echnology , vol. 60, pp. 35–55, 2013. [5] A. Glowacz and Z. Glow acz, “Diagnosis of the three-phase induction motor using thermal imaging, ” Infrar ed Physics & T echnology , vol. 81, pp. 7–16, 2017. [6] J. W ang, Y . Ma, L. Zhang, R. X. Gao, and D. W u, “Deep learning for smart manufacturing: Methods and applications, ” Journal of Manufac- turing Systems , vol. 48, pp. 144–156, 2018. [7] S. Singh, E. Saber, P . P . Markopoulos, and J. Heard, “Regulating modal- ity utilization within multimodal fusion networks, ” Sensors , vol. 24, no. 18, p. 6054, 2024. [8] N. Wu, S. Jastrzebski, K. Cho, and K. J. Geras, “Characterizing and overcoming the greedy nature of learning in multi-modal deep neural networks, ” in International Conference on Machine Learning (ICML) , 2022, pp. 24 043–24 055. [9] X. Peng, Y . W ei, A. Deng, D. W ang, and D. Hu, “Balanced multimodal learning via on-the-fly gradient modulation, ” in IEEE/CVF Conference on Computer V ision and P attern Recognition (CVPR) , 2022, pp. 8238– 8247. [10] Y . Fan, Y . W ei, X. Peng, D. W ang, and D. Hu, “Classifier -guided gradient modulation for enhanced multimodal learning, ” in Advances in Neural Information Pr ocessing Systems (NeurIPS) , 2024. [11] Y . Sun, Y . W ei, and D. Hu, “Balancing multimodal learning via online logit modulation, ” in Pr oceedings of the Thirty-Third International Joint Confer ence on Artificial Intelligence (IJCAI) , 2024, pp. 5746–5754. [12] Y . Zhang, H. Niu, D. Jeung, Z. Chen, and M. Long, “Multimodal rep- resentation learning by alternating unimodal adaptation, ” in IEEE/CVF Confer ence on Computer V ision and P attern Recognition (CVPR) , 2024, pp. 26 679–26 688. [13] Y .-H. H. Tsai, S. Bai, P . Thattai, F . Kolber , L.-P . Morency , and R. Salakhutdinov , “Multimodal transformer for unaligned multimodal language sequences, ” in Annual Meeting of the Association for Compu- tational Linguistics , 2019, pp. 6558–6569. [14] A. Zadeh, M. Chen, S. Poria, E. Cambria, and L.-P . Morency , “T ensor fusion network for multimodal sentiment analysis, ” in Conference on Empirical Methods in Natural Language Processing (EMNLP) , 2017, pp. 1103–1114. [15] Z. Liu, Y . Shen, V . B. Lakshminarasimhan, P . P . Liang, A. Zadeh, and L.-P . Morency , “Efficient low-rank multimodal fusion with modality- specific factors, ” in Annual Meeting of the Association for Computa- tional Linguistics (A CL) , 2018, pp. 2247–2256. [16] H. W u, Y . Sun, Y . Y ang, and D. F . W ong, “Beyond simple fusion: Adaptiv e gated fusion for robust multimodal sentiment analysis, ” arXiv pr eprint arXiv:2510.01677 , 2025. [17] S. Zhao, J. Ren, and X. Zhou, “Cross-modal gated feature enhancement for multimodal emotion recognition in con v ersations, ” Scientific Reports , vol. 15, p. 11989, 2025. [18] F . E, Y . Luo, J. Liu, and R. W u, “Mitigating modality imbalance in multimodal sentiment analysis via emotion-enriched visual encoding and pyramid gated fusion, ” Neur ocomputing , 2025, in press. [19] D. Zhang, R. Nayak, and M. A. Bashar , “Pre-gating and contextual attention gate—a new fusion method for multi-modal data tasks, ” Neural Networks , vol. 179, p. 104775, 2024. [20] R. K. Mobley , An Intr oduction to Pr edictive Maintenance . Butterworth- Heinemann, 2002. [21] T . P . Carvalho, F . A. Soares, R. V ita, R. d. P . Francisco, J. P . Basto, and S. G. Alcal ´ a, “ A systematic literature revie w of machine learning methods applied to predictiv e maintenance, ” Computers & Industrial Engineering , vol. 137, p. 106024, 2019. [22] J.-M. P ´ erez-R ´ ua, V . V ielzeuf, S. Pateux, M. Baccouche, and F . Jurie, “Mfas: Multimodal fusion architecture search, ” in IEEE/CVF Confer ence on Computer V ision and P attern Recognition (CVPR) , 2019, pp. 6966– 6975. [23] P . P . Liang, Y . L yu, X. Fan, Z. W u, Y . Cheng, J. Wu, L. Chen, P . Wu, M. A. Lee, Y . Zhu, R. Salakhutdinov , and L.-P . Morency , “Multibench: Multiscale benchmarks for multimodal representation learning, ” in Ad- vances in Neural Information Pr ocessing Systems (NeurIPS) , vol. 34, 2021, pp. 17 391–17 403. [24] Y . Lei, B. Y ang, X. Jiang, F . Jia, N. Li, and A. K. Nandi, “ Applications of machine learning to machine fault diagnosis: A revie w and roadmap, ” Mechanical Systems and Signal Pr ocessing , vol. 138, p. 106587, 2020. [25] W . Zhang, G. Peng, C. Li, Y . Chen, and Z. Zhang, “ A new deep learning model for fault diagnosis with good anti-noise and domain adaptation ability on raw vibration signals, ” Sensors , vol. 17, no. 2, p. 425, 2017. [26] R. Zhao, R. Y an, Z. Chen, K. Mao, P . W ang, and R. X. Gao, “Deep learning and its applications to machine health monitoring, ” Mechanical Systems and Signal Pr ocessing , vol. 115, pp. 213–237, 2019. [27] A. V aswani, N. Shazeer , N. Parmar , J. Uszkoreit, L. Jones, A. N. Gomez, Ł. Kaiser , and I. Polosukhin, “ Attention is all you need, ” in Advances in Neural Information Processing Systems , vol. 30, 2017. [28] Z. Li, S. Zhang, T . Pan, and Z. Zhang, “Multimodal fusion fault diagnosis of rotating machinery based on multi-scale feature interaction IEEE TRANSA CTIONS ON INDUSTRIAL INFORMA TICS, V OL. XX, NO. XX, XXXX 9 and attention mechanism, ” IEEE Tr ansactions on Industrial Informatics , vol. 20, no. 7, pp. 9291–9301, 2024. [29] Z. Chen and W . Li, “Multi-scale conv olutional neural network with feature fusion and attention mechanism for bearing fault diagnosis, ” IEEE T r ansactions on Instrumentation and Measurement , vol. 73, pp. 1–12, 2024. [30] J. Zhang, J. Zhang, M. Zhong, J. Zheng, and L. Xiao, “Bearing fault diagnosis via multiscale correlation feature learning with visual transformer , ” IEEE T ransactions on Instrumentation and Measurement , vol. 73, pp. 1–11, 2024. [31] J. Jiao, M. Zhao, J. Lin, and K. Liang, “ A comprehensive revie w on con- volutional neural network in machine fault diagnosis, ” Neurocomputing , vol. 417, pp. 36–63, 2024. [32] W . W ang, D. T ran, and M. Feiszli, “What makes training multi-modal classification networks hard?” in IEEE/CVF Conference on Computer V ision and P attern Recognition (CVPR) , 2020, pp. 12 695–12 705. [33] Y . Huang, J. Lin, C. Zhou, H. Y ang, and L. Huang, “Modality compe- tition: What makes joint training of multi-modal network fail in deep learning? (provably), ” in International Conference on Machine Learning (ICML) , 2022, pp. 9226–9259. [34] P . P . Liang, A. Zadeh, and L.-P . Morency , “Foundations and recent trends in multimodal machine learning: Principles, challenges, and open questions, ” ACM Computing Surve ys , vol. 56, no. 10, pp. 1–42, 2024. [35] M. Ma, J. Ren, L. Zhao, O. Tuzel, and D. Erber, “ Are multimodal transformers robust to missing modality?” in IEEE/CVF Conference on Computer V ision and P attern Recognition (CVPR) , 2022, pp. 18 177– 18 186. [36] L. Ma, H. Jiang, Y . W ang, and K. Zhu, “Missing modality robust multi- modal fault diagnosis via information theory and masked autoencoder , ” IEEE T r ansactions on Industrial Informatics , vol. 20, no. 10, pp. 11 908– 11 918, 2024. [37] H. I. Faw az, G. Forestier , J. W eber , L. Idoumghar, and P .-A. Muller, “Deep learning for time series classification: A review , ” Data Mining and Knowledge Discovery , vol. 33, no. 4, pp. 917–963, 2019. [38] T . Y an, P . Zhang, Y . W ang, C. Liu, and Y . Ding, “Industrial fault diag- nosis based on multimodal deep learning: A survey , ” IEEE T ransactions on Industrial Informatics , vol. 20, no. 9, pp. 11 109–11 122, 2024. [39] L. Breiman, “Random forests, ” Machine Learning , vol. 45, no. 1, pp. 5–32, 2001. [40] R. B. Randall and J. Antoni, “Rolling element bearing diagnostics—a tutorial, ” Mechanical Systems and Signal Pr ocessing , v ol. 25, no. 2, pp. 485–520, 2011. [41] K. Xu, J. L. Ba, R. Kiros, K. Cho, A. Courville, R. Salakhutdinov , R. S. Zemel, and Y . Bengio, “Show , attend and tell: Neural image caption generation with visual attention, ” in International Conference on Machine Learning (ICML) , 2015, pp. 2048–2057. [42] Z. W ang, Z. Dai, B. P ´ oczos, and J. Carbonell, “Characterizing and av oiding negati ve transfer , ” in IEEE/CVF Confer ence on Computer V ision and P attern Recognition (CVPR) , 2019, pp. 11 293–11 302. [43] A. K. Jardine, D. Lin, and D. Banjevic, “ A review on machinery di- agnostics and prognostics implementing condition-based maintenance, ” Mechanical Systems and Signal Processing , vol. 20, no. 7, pp. 1483– 1510, 2006. [44] AI Hub, “Manufacturing site transport equipment thermal degrada- tion predictive maintenance multimodal data, ” https://www .aihub .or .kr/ aihubdata/data/view .do?dataSetSn=71802, 2024, accessed: 2025. [45] C. Peeters, P . Guillaume, and J. Helsen, “Blind filters based on env e- lope spectrum sparsity indicators for bearing and gear vibration-based condition monitoring, ” Mechanical Systems and Signal Processing , vol. 138, p. 106556, 2020. [46] N. Shazeer , A. Mirhoseini, K. Maziarz, A. Davis, Q. Le, G. Hinton, and J. Dean, “Outrageously large neural networks: The sparsely-gated mixture-of-experts layer , ” in International Conference on Learning Repr esentations (ICLR) , 2017. [47] I. Loshchilov and F . Hutter , “Decoupled weight decay regularization, ” in International Conference on Learning Representations (ICLR) , 2019. [48] F . Pedregosa, G. V aroquaux, A. Gramfort, V . Michel, B. Thirion, O. Grisel, M. Blondel, P . Prettenhofer, R. W eiss, V . Dubourg et al. , “Scikit-learn: Machine learning in Python, ” Journal of Machine Learn- ing Resear ch , vol. 12, pp. 2825–2830, 2011. [49] S. Hochreiter and J. Schmidhuber, “Long short-term memory , ” Neural Computation , vol. 9, no. 8, pp. 1735–1780, 1997. [50] R. R. Selvaraju, M. Cogswell, A. Das, R. V edantam, D. Parikh, and D. Batra, “Grad-CAM: V isual explanations from deep networks via gradient-based localization, ” in IEEE International Conference on Com- puter V ision (ICCV) , 2017, pp. 618–626. [51] K. A. Loparo, “Case W estern Reserve Univ ersity Bearing Data Center, ” https://engineering.case.edu/bearingdatacenter, 2012, accessed: 2025. [52] A. W ang, H. Lian, and S. W ang, “Multimodal industrial anomaly detection by crossmodal feature mapping, ” IEEE/CVF Confer ence on Computer V ision and P attern Recognition (CVPR) , pp. 17 226–17 235, 2024.
Original Paper
Loading high-quality paper...
Comments & Academic Discussion
Loading comments...
Leave a Comment