Predictive Uncertainty in Short-Term PV Forecasting under Missing Data: A Multiple Imputation Approach
Missing values are common in photovoltaic (PV) power data, yet the uncertainty they induce is not propagated into predictive distributions. We develop a framework that incorporates missing-data uncertainty into short-term PV forecasting by combining …
Authors: Parastoo Pashmchi, Jérôme Benoit, Motonobu Kanagawa
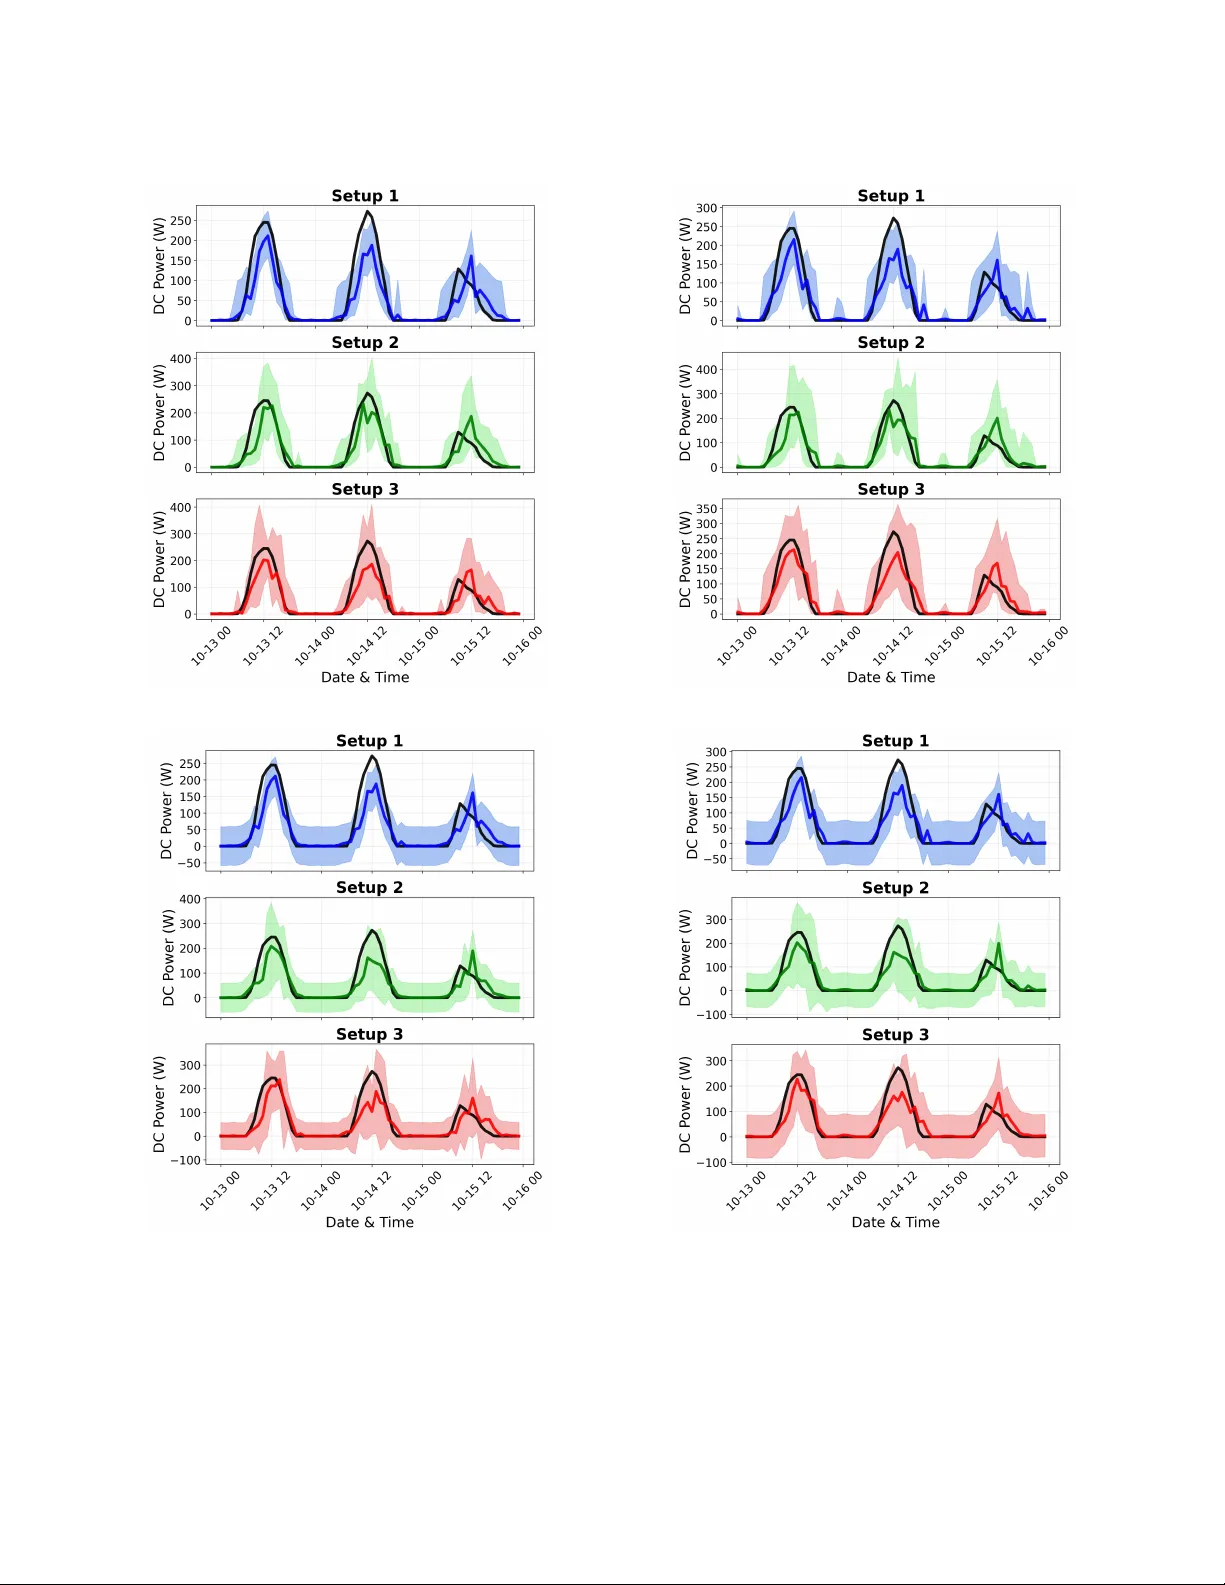
1 Predicti v e Uncertainty in Short-T erm PV F orecasting under Missing Data: A Multiple Imputation Approach Parastoo Pashmchi, Jérôme Benoit, and Motonobu Kanagawa Abstract —Missing values ar e common in photovoltaic (PV) power data, yet the uncertainty they induce is not propagated into predicti ve distributions. W e develop a framework that incor- porates missing-data uncertainty into short-term PV for ecasting by combining stochastic multiple imputation with Rubin’ s rule. The approach is model-agnostic and can be integrated with standard machine-learning predictors. Empirical r esults show that ignoring missing-data uncertainty leads to overly narrow prediction intervals. Accounting for this uncertainty improves in- terval calibration while maintaining comparable point prediction accuracy . These results demonstrate the importance of propagat- ing imputation uncertainty in data-driven PV forecasting . Index T erms —Photovoltaic F orecasting, Missing Data, Multiple Imputation, Uncertainty Quantification, Prediction Intervals I . I N T RO D U C T I O N Photov oltaic (PV) generation is a major renew able en- ergy technology . As its penetration increases, power system planning and control become more challenging because PV output depends on weather , location, and solar irradiance [1], [2]. Accurate forecasts, together with calibrated uncertainty estimates, are therefore essential for grid operation. Forecasting methods ha ve ev olved from persistence and classical statistical models to machine-learning approaches that capture nonlinear dynamics [3]. For grid integration, operational decisions (e.g., reserve scheduling) are made under forecast uncertainty and therefore require probabilistic fore- casts with good calibration [4], [5]. Accordingly , we study probabilistic PV forecasting and prediction interv als under missing data. In practice, PV monitoring datasets often contain missing observations due to outages, equipment faults, and commu- nication or logging failures [6]–[9]. Missingness can exceed 10% [7], [8] and sev ere cases considered in the literature reach 40% [7]; gaps may last weeks to months [6]. Figure 1 illustrates such patterns in real PV measurements, including complete-day gaps and prolonged zero-output periods. Missing v alues are not just a preprocessing issue; they are a source of predicti ve uncertainty . In PV forecasting, missingness can affect both training data and test-time inputs. Single imputation (e.g., zeros or av erages) treats unkno wn values as fixed, typically understating predictiv e v ariance and yielding miscalibrated prediction interv als. A substantial body of work develops probabilistic PV forecasting under complete-data assumptions. For e xample, existing approaches based on Gaussian process models [10], Parastoo Pashmchi and Jérôme Benoit are with SAP Labs France, Mougins, France (e-mail: pashmchi.parastoo@gmail.com, jerome.benoit@sap.com). Motonobu Kanagawa is with EURECOM, Biot, France (e-mail: motonobu.kanaga wa@eurecom.fr). Fig. 1: Example of missing observations in real PV power measurements collected at EURECOM, illustrating complete- day gaps and prolonged zero-output periods consistent with system outages or failures. ensemble-based approaches [11], spatio-temporal probabilistic models [12], interv al forecasting methods including bootstrap- and quantile-regression-based constructions [13], [14], non- parametric density estimation [15], and uncertainty-aware day- ahead and short-term models [16], [17] all quantify predictive uncertainty . Howe ver , these approaches assume fully observed data and do not account for uncertainty induced by missing observations. A. Existing W orks on Missing V alues in PV Systems A separate line of research addresses missing data in PV systems [18]–[26]. Imputation is performed prior to forecast- ing, after which the completed dataset is treated as fully observed. Predictiv e performance is e valuated by point-error metrics. Uncertainty arising from the imputation step is neither quantified nor incorporated into the forecasting model. Zhang et al. [18] propose SolarGAN, a WGAN-based im- putation method for multiv ariate solar time series. A recurrent generator conditions on the observed entries (with added noise) to fill missing v alues, while a discriminator enforces realistic joint dynamics across v ariables, yielding a single completed dataset. Imputation uncertainty is not quantified or propagated into prediction interv als. Shen et al. [19] propose a deep generativ e reconstruction model that imputes missing values in test-time inputs prior to forecasting by conditioning on the observed variables within a multi-modal time window , including PV output, meteorolog- ical measurements (such as solar radiation), and sky images, without quantifying imputation uncertainty . Benitez et al. [20] use irradiance and weather variables to fill missing PV outputs by averaging historical observations 2 under similar conditions, and then forecast PV output from the resulting completed dataset using a point-prediction model; no uncertainty quantification is introduced for either the imputa- tion or the forecasting stage. Shireen et al. [21] use an iterativ e multi-task Gaussian- process framework to estimate missing historical PV obser- vations from correlated panels and irradiance data, and then apply ARIMA to forecast future PV output based on the imputed series; no uncertainty from the imputation step is propagated into the forecasting model. Lee et al. [22] study missing PV power data by imputing it with deletion, linear interpolation, kNN, or GAIN using irradiance and temperature measurements and weather-forecast variables (including precipitation and sky status), and then train a CNN–GR U point-forecasting model on the completed data; no uncertainty quantification is provided for either im- putation or forecasting. Liu et al. [23], [24] address missing values in short PV output histories used as inputs for forecasting. A con volutional neural network is trained on complete data with artificially introduced gaps and then used to reconstruct missing entries in the input series. Future PV output is predicted from the reconstructed data using a re gression model. Both reconstruc- tion and forecasting are formulated as point estimation, and no predicti ve uncertainty is quantified. Costa et al. [25] predict missing PV generation values from meteorological variables using tree-based regressors trained on complete data. The approach yields a single imputed v alue for each gap and does not quantify imputation uncertainty . Phan et al. [26] handle missing values in PV and meteo- rological input series by an iterati ve MICE-style procedure. Missing entries are first initialized by mean imputation, af- ter which the completed dataset is repeatedly resampled by bootstrap; at each step an XGBoost regressor is fitted and predictiv e mean matching is used to update the imputed values. The resulting data are treated as a single completed dataset for downstream forecasting. Prediction intervals are produced by a T ransformer–LUBE model. Bootstrap is used to repeat the imputation procedure rather than to quantify or propagate uncertainty in the imputed values. B. Contributions While missing values are recognized as a practical issue in PV forecasting, the uncertainty they induce is neither quantified nor propagated into predictive distributions. Miss- ing values may arise in both the training data—including inputs and outputs—and in test-time inputs. In such cases, these variables should be regarded as uncertain rather than fixed. Replacing missing entries with single imputed values underestimates predictiv e v ariance, resulting in ov erly narro w prediction intervals. Giv en the substantial variability of PV generation, poorly calibrated intervals may distort grid opera- tion, for example through insufficient reserve allocation. This study de velops a frame work for propagating missing- data uncertainty into predictive distrib utions in short-term PV forecasting. Multiple imputation is widely used for parameter inference under missing data [27]. Here we adapt this principle Fig. 2: Comparison of single and multiple imputation for one-hour-ahead prediction with a Random Forest model. The shaded regions show the 95% prediction interv als. Single imputation gi ves overly narrow intervals, whereas the proposed multiple-imputation approach accounts for missing-value un- certainty and giv es wider intervals. to predicti ve uncertainty in a model-agnostic manner . Figure 2 illustrates the main effect of the proposed multiple-imputation approach: single imputation yields ov erly narrow predictiv e intervals, whereas multiple imputation accounts for missing- value uncertainty and gives wider intervals. Experimental details are giv en in Section IV. The main contributions are as follows: • Principled propagation of missing-data uncertainty . W e combine stochastic multiple imputation with Rubin’ s rule to incorporate uncertainty due to missing inputs and targets into predicti ve variance. • Unified and model-agnostic formulation. The frame- work handles missing values in both training (inputs and targets) and test-time inputs, and can be integrated with standard machine-learning predictors. • Implications for predicti ve calibration. Ignoring missing-data uncertainty results in overly narrow inter- vals. Accounting for this uncertainty improves calibration without de grading point prediction accuracy . The remainder of this paper is organized as follo ws. Sec- tion II presents the one-hour -ahead PV forecasting setup under complete data and establishes the notation. Section III dev elops the multiple imputation framework for predictiv e uncertainty quantification in the presence of missing values. Section IV outlines the experimental design, and Section V reports the empirical findings. I I . F O R E C A S T S E T U P W I T H O U T M I S S I N G V A L U E S W e first describe the PV forecasting task under complete data and introduce the notation. Missing values are incorpo- rated in the ne xt section. 3 A. One-hour-ahead PV P ower F or ecasting W e consider one-hour-ahead PV power forecasting using the pre vious 24 hours of PV power and irradiance. Thus, the response is the PV power in the next hour , and the input is a 48-dimensional vector consisting of 24 hourly PV power values and 24 hourly irradiance values. Each observation is the total PV energy or irradiance ov er the corresponding hour . B. Machine Learning T raining Let ( P 1 , I 1 ) , ( P 2 , I 2 ) , . . . , ( P T , I T ) (1) be a historical time series of hourly PV power and irradiance, where P t ≥ 0 and I t ≥ 0 denote the total PV po wer and irradiance at hour t , respectively , for t = 1 , . . . , T . From this series, we construct input-output pairs for one-hour-ahead supervised learning: the input is the pre vious 24 hours of PV power and irradiance, and the output is the PV power in the next hour . W e define the training pairs by X t = ( P t , I t , P t − 1 , I t − 1 , . . . , P t − 23 , I t − 23 ) ⊤ ∈ R 48 , Y t = P t +1 ∈ R , (2) for t = 24 , . . . , T − 1 . The training dataset is D tr := { ( X 24 , Y 24 ) , . . . , ( X T − 1 , Y T − 1 ) } , with N = T − 24 pairs. A prediction model ˆ f is trained on D tr to estimate the relation between X t and Y t . In general, ˆ f is obtained by minimizing a training loss over a model class F , for example, ˆ f = arg min f ∈F 1 N N X i =1 ( f ( X i ) − Y i ) 2 , (3) when squared-error loss is used. W e write the trained model as ˆ f = T rain F ( D tr ) , (4) where T rain F denotes the training procedure applied to D tr . C. Machine Learning F orecast on T est Data Let ( P te 1 , I te 1 ) , ( P te 2 , I te 2 ) , . . . , ( P te T ′ , I te T ′ ) (5) be the test-period time series of hourly PV po wer and irradi- ance. F or t = 24 , . . . , T ′ − 1 , the next-hour PV power Y te t = P te t +1 is predicted from X te t = ( P te t , I te t , P te t − 1 , I te t − 1 , . . . , P te t − 23 , I te t − 23 ) ⊤ , (6) that is, ˆ f ( X te t ) ≈ Y te t . T o quantify predictiv e uncertainty , we use a Gaussian pre- dictiv e distribution with mean ˆ f ( X te t ) and variance estimated from the training residuals: ˆ σ 2 := 1 N N X i =1 ˆ f ( X i ) − Y i 2 . (7) This is the maximum likelihood estimator under a Gaussian noise model. Other probabilistic forecasting approaches are also a vailable; see, for example, [10]–[17]. I I I . M U LT I P L E I M P U T AT I O N F O R P V F O R E C A S T I N G In practice, many PV power v alues are missing, so the procedures in Section II are not directly applicable. Remo ving incomplete observ ations reduces the training sample size and may prevent test-time forecasting. W e therefore impute the missing values and quantify the resulting uncertainty . This section describes our multiple imputation approach. A. Stochastic Imputation of Missing PV P ower V alues PV po wer values may be missing in both training and test data. W e represent missingness by binary indicators: T raining: ( P 1 , I 1 , M 1 ) , ( P 2 , I 2 , M 2 ) , . . . , ( P T , I T , M T ) , (8) T est: ( P te 1 , I te 1 , M te 1 ) , ( P te 2 , I te 2 , M te 2 ) , . . . , ( P te T ′ , I te T ′ , M te T ′ ) , (9) where M t = 1 if P t is missing and M t = 0 otherwise; similarly , M te t = 1 if P te t is missing and M te t = 0 otherwise. Missing PV power values are imputed from the statistical relation between PV power and irradiance in the training data. A natural target is the conditional distribution of PV power giv en irradiance: ˆ P t ∼ Pr( P t | I t ) , t = 1 , . . . , T with M t = 1 . Since this conditional distrib ution is unknown, it must be estimated from the observed data. In our experiments, we use kNNSampler [28], a stochastic imputation method with the- oretical con ver gence guarantees. Other consistent estimators could also be used, and the conditioning variables could be extended beyond contemporaneous irradiance. kNNSampler imputes a missing PV power v alue at irra- diance I t by sampling from the observed PV power values corresponding to the k nearest irradiance neighbors of I t . Equiv alently , it approximates the conditional distribution by Pr( P t | I t ) ≈ c Pr( P t | I t ) = 1 k X i ∈ NN( I t ,k ) δ P i , (10) where δ P i is the point mass at P i , and NN( I t , k ) is the set of indices of the k nearest irradiance observ ations to I t among those with observed PV power . Under mild regularity conditions, the kNNSampler empiri- cal distribution con verges to the true conditional distribution as n → ∞ , k → ∞ , and k/n → 0 , where n is the number of observed irradiance–PV power pairs. In practice, k is a hyperparameter selected by the fast leave-one-out cross- validation method of [29]; see [28] for details. 4 B. Multiple Imputation F rame work W e now describe the proposed multiple imputation frame- work. It generates B ≥ 1 completed versions of the training and test data, leading to B predictions and uncertainty esti- mates for each test instance. These are combined into a single prediction and uncertainty estimate that reflects missing-v alue uncertainty . The case B = 1 corresponds to single imputation. In what follo ws, b = 1 , . . . , B index es the imputation rounds. 1) Imputing Missing T raining Data: For each imputation round b = 1 , . . . , B , missing PV power values in the training data (8) are imputed by sampling from the estimated condi- tional distrib ution gi ven the observed irradiance: ˆ P ( b ) t ∼ c Pr( P t | I t ) , t = 1 , . . . , T with M t = 1 . Define P ( b ) s = ( P s , if M s = 0 , ˆ P ( b ) s , if M s = 1 . The b -th completed training dataset is then constructed as D ( b ) tr := { ( X ( b ) 24 , Y ( b ) 24 ) , . . . , ( X ( b ) T − 1 , Y ( b ) T − 1 ) } , where, for t = 24 , . . . , T − 1 , X ( b ) t = ( P ( b ) t , I t , P ( b ) t − 1 , I t − 1 , . . . , P ( b ) t − 23 , I t − 23 ) ⊤ , Y ( b ) t = P ( b ) t +1 . A prediction model is trained on the b -th completed training dataset, which we write as ˆ f ( b ) = T rain F ( D ( b ) tr ) . 2) Imputing Missing T est Input F eatur es: At test time, some of the past 24 PV po wer values used as input may be missing. For each imputation round b = 1 , . . . , B , we define P te( b ) s = ( ˆ P te( b ) s ∼ c Pr( P te s | I te s ) , if M te s = 1 , P te s , if M te s = 0 , for each s = t, t − 1 , . . . , t − 23 . The resulting completed test input is X te( b ) t = ( P te( b ) t , I te t , P te( b ) t − 1 , I te t − 1 , . . . , P te( b ) t − 23 , I te t − 23 ) ⊤ , (11) and the next-hour PV power is predicted by ˆ f ( b ) ( X te( b ) t ) ≈ Y te t = P te t +1 . For each imputation round, predictive uncertainty is quanti- fied by a v ariance estimate. Here we use the training residual variance computed on the b -th completed training dataset: ( ˆ σ 2 ) te( b ) = 1 N N X i =1 ˆ f ( b ) ( X ( b ) i ) − Y ( b ) i 2 . (12) This is the same residual-based variance estimate as in (7), now applied to the imputed training data. More sophisticated probabilistic forecasting methods could also be used here; see, for e xample, [10]–[17]. C. Aggr e gation by Rubin’ s Rule For each imputation round b = 1 , . . . , B , we obtain a predictiv e mean and variance. These are then combined by Rubin’ s rule [27] to yield the final predicti ve mean and variance. The final predictive mean is the average of the B predictive means: ˆ Y te t = 1 B B X b =1 ˆ f ( b ) ( X te( b ) t ) . (13) The final predicti ve variance combines the within- imputation variance (WV) and the between-imputation v ari- ance (BV). The within-imputation variance is d WV te t = 1 B B X b =1 ( ˆ σ 2 ) te( b ) , the average of the B predictiv e variances. The between- imputation v ariance is d BV te t = 1 B − 1 B X b =1 ˆ Y te t − ˆ f ( b ) ( X te( b ) t ) 2 , the sample variance of the B predictiv e means. Rubin’ s rule then defines the total predictive variance by ( ˆ σ 2 t ) te = d WV te t + 1 + 1 B d BV te t . (14) Rubin’ s rule (14) is a finite-sample analogue of the law of total v ariance [27], [30]. Let Z t denote the missing values that affect prediction at time t . Then, conditional on the observed data, V ar( Y te t ) = E V ar( Y te t | Z t ) + V ar E [ Y te t | Z t ] . The first term corresponds to the within-imputation variance, and the second to the between-imputation variance. Rubin’ s rule estimates this decomposition with a finite number of imputations; the factor 1 + 1 B in (14) is the corresponding finite- B correction. Single imputation is the special case in which there is no between-imputation v ariability . Then V ar E [ Y te t | Z t ] = 0 , and Rubin’ s rule reduces to ( ˆ σ 2 t ) te = d WV te t . Thus, only within-imputation uncertainty is retained. D. Pr edictive Intervals A predictive interv al for next-hour PV po wer is obtained from a distrib ution whose mean and variance match the final predictiv e mean (13) and variance (14). W e consider normal and gamma distributions. The normal distribution is widely used and gives better-calibrated interv als in our experiments, but it may produce ne gativ e lower bounds. The gamma distri- bution is included as a simple non-negativ e baseline, since it is supported on non-ne gativ e values. W e deriv e a 100(1 − α )% predicti ve interv al for 0 < α < 1 , for e xample the 95% interval when α = 0 . 05 . 5 1) Normal-based Intervals: Under a normal distribution with predictive mean (13) and v ariance (14), the 100(1 − α )% predictiv e interv al is ˆ Y te t − z 1 − α/ 2 q ( ˆ σ 2 t ) te , ˆ Y te t + z 1 − α/ 2 q ( ˆ σ 2 t ) te , where z 1 − α/ 2 is the (1 − α/ 2) quantile of the standard normal distribution (e.g., z 0 . 975 ≈ 1 . 96 ). Normal-based intervals are widely used and, in our exper- iments, better calibrated in terms of cov erage. Howe ver , they are symmetric about the mean and may include negati ve v al- ues. Since PV po wer is non-neg ative and typically asymmetric, we also consider a gamma-based interv al. 2) Gamma-based Intervals: For y ≥ 0 , let f ( y ; a t , b t ) = y a t − 1 e − y /b t Γ( a t ) b a t t , a t > 0 , b t > 0 , be the gamma density with shape a t and scale b t ; see, for example, [31]. Its mean and variance are a t b t and a t b 2 t , respectiv ely . Matching these to the predictive mean (13) and variance (14) gi ves a t = ( ˆ Y te t ) 2 ( ˆ σ 2 t ) te , b t = ( ˆ σ 2 t ) te ˆ Y te t . W ith these parameters, the 100(1 − α )% predicti ve interval is h G − 1 α 2 ; a t , b t , G − 1 1 − α 2 ; a t , b t i , where G − 1 ( p ; a t , b t ) denotes the p th quantile of the gamma distribution with parameters a t and b t . If the predictiv e mean ˆ Y te t is non-positi ve, we use the degenerate interval [0 , 0] . I V . E X P E R I M E N T S E T U P A. Dataset Implementation The dataset used in this study was obtained from the European Union GRIDouble project 1 . It contains hourly PV power generation and solar irradiation data collected from industrial facilities in ˇ Ca ˇ cak, Serbia, cov ering November 2022 to No vember 2023. The dataset includes approximately 8,275 hourly observa- tions of generated energy (DC Po wer) across three locations, measured in kilo watt-hours (kWh) (Figure 3). For irradiation, we use the Global Horizontal Irradiance (GHI), measured in kilow atts per square meter (kW/m²). The training data consists of hourly records from 2022/11/22 to 2023/08/25, and the remaining 1,650 hours are reserved for testing. The split is chronological, and no shuf fling is applied. T o ev aluate the impact of missing values in a controlled manner , we simulate missingness by remo ving se veral contigu- ous weeks from both the training and test sets (Figure 3). This block-wise pattern reflects realistic device-le vel outages, such as in verter or sensor failures, which interrupt data recording for extended periods. In the resulting dataset, approximately 29.5% of the PV power observations are missing. Although the experiments focus on block missingness, the proposed 1 https://github .com/vodena/GRIDouble Fig. 3: Dataset from the EU GRIDouble project used in our experiments. T op: original hourly DC power . Middle: DC power after block-wise removal of se veral contiguous weeks (29.5% missing). Bottom: corresponding hourly irradiation (GHI). framew ork is not restricted to this pattern and can be applied to other missing mechanisms. Throughout the experiments, irradiation is assumed to be fully observed, reflecting typical operational settings where meteorological measurements are reliably recorded. Missing v alues are simulated rather than relying on naturally missing observ ations in order to retain access to the true under - lying values. This enables objecti ve ev aluation of imputation accuracy and predicti ve co verage, which would not be possible if the ground truth were unav ailable. B. Imputation Setups W e consider three imputation settings in order to disentangle the impact of uncertainty arising from different stages of the pipeline: • Setup 1 : Both the training data and the test input features are imputed using single imputation. • Setup 2 : The training data are imputed using single imputation, while the test input features are imputed using multiple imputation. • Setup 3 : Both the training data and the test input features are imputed using multiple imputation. This design allows us to isolate the effect of uncertainty introduced at the training stage, the prediction stage, and their combination. For single imputation, we use the kNNImputer [32], a widely used imputation method that replaces each missing value with the a verage of its nearest neighbors. For mul- tiple imputation, we use kNNSampler [28], which gener- 6 ates stochastic imputations by sampling from the empirical conditional distribution induced by nearest neighbors (see Section III-A). The number of multiple imputations, B , is set to B = 5 and B = 10 for comparison. C. Machine Learning Models W e ev aluate the proposed framew ork using four standard prediction models [33]: Random Forest (RF) [34], k-Nearest Neighbors (kNN) [35], a two-layer Multi-Layer Perceptron (MLP) [36], and Lasso regression [37]. All models are im- plemented in the Scikit-learn library [38]. Hyperparameters are tuned using time-series cross- validation via the TimeSeriesSplit procedure in Scikit- learn, which preserves chronological order by training on past observations and validating on future data. No shuf fling is applied. For kNN, the number of neighbors k ∈ { 1 , . . . , 500 } is selected by 10-fold time-series cross-validation. RF is tuned using HalvingRandomSearchCV with an initial ensemble of 600 trees, exploring maximum depth, minimum samples per split and leaf, and feature subsampling. The MLP consists of two hidden layers (100 and 50 neurons) and is trained for 1000 iterations using the Adam optimizer , with hyperparameters selected via 5-fold time-series cross-validation. Lasso uses LassoCV to select the regularization parameter α . D. Evaluation Metrics Predictiv e performance is assessed using two metrics: Coverage Probability (CP). Let [ L t , U t ] denote the 100(1 − α )% prediction interval for the test observation Y te t con- structed in Section III-D, under either the normal or the g amma predictiv e distrib ution. Cov erage is ev aluated only on test points defined in (9) for which the true value is observed, i.e., M te t = 0 . Define T obs = { t : M te t = 0 } . The empirical co verage probability is CP = 1 |T obs | X t ∈T obs 1 Y te t ∈ [ L t , U t ] . If CP < 1 − α , the intervals are narrower than the designed lev el (o verconfident). If CP > 1 − α , they are wider than the designed le vel (conservati ve). Normalized Root Mean Square Error (NRMSE). Prediction accuracy is measured by the normalized root mean square error (NRMSE), computed over observed test points. Let b Y te t denote the predictiv e mean in (13). Then NRMSE is defined as NRMSE = s 1 |T obs | X t ∈T obs Y te t − b Y te t 2 / Y max , where Y max = max t ∈T obs Y te t . T ABLE I: Coverage probability (%) of 95% prediction inter- vals under the normal distrib ution Imputation Setup B RF kNN MLP Lasso 1) SI train, SI test – 74.4 83.8 83.0 85.1 2) SI train, MI test 5 84.1 88.5 90.0 90.7 10 83.9 88.1 90.5 91.5 3) MI train, MI test 5 85.2 92.1 93.1 93.4 10 84.5 92.1 93.6 92.8 T ABLE II: Coverage probability (%) of 95% prediction inter- vals under the gamma distrib ution Imputation Setup B RF kNN MLP Lasso 1) SI train, SI test – 70.7 78.8 72.1 70.1 2) SI train, MI test 5 80.7 83.1 78.7 77.0 10 80.9 83.6 79.5 76.5 3) MI train, MI test 5 83.7 88.1 78.3 79.5 10 82.9 88.7 84.7 79.2 V . R E S U LT S T ables I and II report the empirical cov erage probabilities of the 95% prediction intervals under the normal and gamma predictiv e distributions, respectively . T able III reports the cor- responding NRMSE values. Figures 4–7 describe prediction intervals over arbitrarily selected three days for all predictors, illustrating that the effect of multiple imputation is not model- specific. Throughout this section, SI and MI denote single and multiple imputation, respectiv ely . The follo wing observ ations can be made from the results: MI corrects ov erconfidence under SI. For each predictor and each predictiv e distribution, Setup 2 (SI train, MI test) and Setup 3 (MI train, MI test) yield higher co verage than Setup 1 (SI train, SI test). This indicates that multiple imputation corrects the overconfidence induced by single imputation, which treats missing values as fix ed. For example, for the MLP with normal interv als, the coverage increases from 83.0% under Setup 1 to 90.0% under Setup 2 ( B = 5 ) and 93.1% under Setup 3 ( B = 5 ), the latter being close to the nominal 95% le vel. Uncertainty in test inputs dominates that in training data. The increase in coverage from Setup 1 (SI train, SI test) to Setup 2 (SI train, MI test) is larger than the change from Setup 2 to Setup 3 (MI train, MI test). F or example, for Random Forest with normal intervals ( B = 5 ), coverage increases by 9.7 percentage points from Setup 1 to Setup 2 (74.4% to 84.1%), whereas the increase from Setup 2 to Setup 3 is only 1.1 points (84.1% to 85.2%). This suggests that most of the additional predictiv e uncertainty arises from missing values in the test input features rather than from the training stage. A small number B of imputations suffices. The coverage probabilities and NRMSE values dif fer little between B = 5 7 T ABLE III: NRMSE for different algorithms under each imputation setup Imputation Setup B RF kNN MLP Lasso 1) SI train, SI test – 0.123 0.131 0.124 0.132 2) SI train, MI test 5 0.127 0.136 0.126 0.132 10 0.126 0.132 0.123 0.129 3) MI train, MI test 5 0.127 0.136 0.125 0.132 10 0.126 0.133 0.121 0.130 and B = 10 for most cases. This suggests that a small number of imputations, such as B = 5 , is adequate in practice. This is consistent with Rubin’ s observation that “as few as fi ve (or ev en three in some cases) is adequate” [30, p. 480]. MI does not materially affect prediction accuracy . For each predictor , the NRMSE v alues are similar across the three imputation setups. Thus, the improvement in cov erage under multiple imputation is not accompanied by a material change in predictiv e accuracy . Normal intervals achiev e better calibration. Gamma intervals respect the non-neg ativity of PV power and serve as a simple non-negati ve baseline. In this study , howe ver , their empirical coverages are substantially below the nominal 95% lev el, e ven under Setup 3. In contrast, normal intervals under Setup 3 are close to the nominal le vel for kNN, MLP , and Lasso. Thus, within this study , the normal formulation yields better calibrated prediction intervals. If strict non-negati vity is required, neg ative lower bounds can be truncated in practice, since the observed PV output is non-negati ve. Normal intervals with MI f or both training and test data achieve the best calibration. In summary , normal prediction intervals under Setup 3 (MI train, MI test), corresponding to the proposed imputation framew ork described in Section III-B, achiev e the best calibration among the considered settings. V I . C O N C L U S I O N This study introduced a principled framework for propagat- ing missing-data uncertainty into predictiv e distributions for short-term PV forecasting. Existing PV forecasting studies treat imputed values as fix ed and do not propagate imputation uncertainty into predictive distributions. In contrast, we integrate stochastic multiple imputation with Rubin’ s rule to quantify and propagate the additional v ariance induced by missing observations. Empirical results sho w that ignoring this source of un- certainty leads to systematically under-co vered interv als. Ac- counting for it restores calibration without degrading point prediction accurac y . The experiments were conducted on one real dataset with simulated block missingness, which allows objective ev alua- tion because the ground truth is retained. Broader validation across sites, climates, and missingness mechanisms remains for future work. (a) Gamma intervals with Random Forest (b) Normal intervals with Random Forest Fig. 4: 95% prediction intervals ( B = 5 ) for Random For est under (a) gamma and (b) normal predictiv e distributions, shown for three imputation setups: (1) SI train & test, (2) SI train with MI test, and (3) MI train & test. Black thick curve: ground truth; thick colored curve: predictiv e means; shaded region: 95% prediction intervals. 8 (a) Gamma intervals with MLP (b) Normal intervals with MLP Fig. 5: 95% prediction intervals ( B = 5 ) for MLP under (a) gamma and (b) normal predicti ve distributions, shown for three imputation setups: (1) SI train & test, (2) SI train with MI test, and (3) MI train & test. Black thick curve: ground truth; thick colored curve: predictiv e means; shaded region: 95% prediction interv als. (a) Gamma intervals with Lasso (b) Normal intervals with Lasso Fig. 6: 95% prediction intervals ( B = 5 ) for Lasso under (a) gamma and (b) normal predictive distributions, sho wn for three imputation setups: (1) SI train & test, (2) SI train with MI test, and (3) MI train & test. Black thick curve: ground truth; thick colored curv e: predictiv e means; shaded region: 95% prediction intervals. 9 (a) Gamma intervals with kNN (b) Normal intervals with kNN Fig. 7: 95% prediction intervals ( B = 5 ) for kNN under (a) gamma and (b) normal predicti ve distributions, shown for three imputation setups: (1) SI train & test, (2) SI train with MI test, and (3) MI train & test. Black thick curve: ground truth; thick colored curve: predictiv e means; shaded region: 95% prediction interv als. Overall, missing data is not merely a preprocessing issue. It is a source of predicti ve uncertainty that must be modeled explicitly when probabilistic forecasts are used for operational decision-making. R E F E R E N C E S [1] D. Y ang, W . W ang, C. A. Gueymard, T . Hong, J. Kleissl, J. Huang, M. J. Perez, R. Perez, J. M. Bright, X. Xia et al. , “ A revie w of solar forecasting, its dependence on atmospheric sciences and implications for grid integration: T ow ards carbon neutrality , ” Renewable and Sustainable Ener gy Reviews , vol. 161, p. 112348, 2022. [2] J. Antonanzas, N. Osorio, R. Escobar , R. Urraca, F . de Pison, and F . Antonanzas-T orres, “Re view of photo voltaic po wer forecasting, ” Solar Ener gy , vol. 136, pp. 78–111, 2016. [3] M. N. Akhter, S. Mekhilef, H. Mokhlis, and N. Mohamed Shah, “Revie w on forecasting of photov oltaic po wer generation based on machine learning and metaheuristic techniques, ” IET Renewable P ower Generation , vol. 13, no. 7, pp. 1009–1023, 2019. [4] Q. W ang, A. T uohy , M. Ortega-V azquez, M. Bello, E. Ela, D. Kirk- Davidof f, W . B. Hobbs, D. J. Ault, and R. Philbrick, “Quantifying the value of probabilistic forecasting for po wer system operation planning, ” Applied Energy , vol. 343, p. 121254, 2023. [5] B. Li and J. Zhang, “ A revie w on the integration of probabilistic solar forecasting in power systems, ” Solar Energy , vol. 210, pp. 68–86, 2020. [6] E. K oubli, D. Palmer, P . Rowle y , and R. Gottschalg, “Inference of missing data in photovoltaic monitoring datasets, ” IET Renewable P ower Generation , vol. 10, no. 4, pp. 434–439, 2016. [7] A. Li vera, M. Theristis, E. Koumpli, S. Theocharides, G. Makrides, J. Sutterlueti, J. S. Stein, and G. E. Georghiou, “Data processing and quality verification for improv ed photov oltaic performance and relia- bility analytics, ” Pr ogress in Photovoltaics: Resear ch and Applications , vol. 29, pp. 143–158, 2021. [8] R. H. French, L. S. Bruckman, D. Moser, S. Lindig, M. v an Iseghem, B. Müller , J. S. Stein, M. Richter, M. Herz, W . V an Sark, F . Baumgartner et al. , “ Assessment of performance loss rate of pv power systems, ” IEA Photov oltaic Power Systems Programme, T ech. Rep. IEA-PVPS T13- 22:2021, Apr. 2021. [9] Z. Lin, Q. Zhou, Z. W ang, C. W ang, D. B. Bookhart, and M. Leung- Shea, “ A high-resolution three-year dataset supporting rooftop photo- voltaics (pv) generation analytics, ” Scientific Data , v ol. 12, p. 63, 2025. [10] F . Najibi, D. Apostolopoulou, and E. Alonso, “Enhanced performance gaussian process regression for probabilistic short-term solar output forecast, ” International Journal of Electrical P ower & Ener gy Systems , vol. 130, p. 106916, 2021. [11] M. J. Mayer and D. Y ang, “Probabilistic photovoltaic power forecasting using a calibrated ensemble of model chains, ” Renewable and Sustain- able Energy Reviews , vol. 168, p. 112821, 2022. [12] X. G. Agoua, R. Girard, and G. Kariniotakis, “Probabilistic models for spatio-temporal photovoltaic power forecasting, ” IEEE T ransactions on Sustainable Energy , vol. 10, no. 2, pp. 780–789, 2018. [13] Y . Han, N. W ang, M. Ma, H. Zhou, S. Dai, and H. Zhu, “ A PV power interval forecasting based on seasonal model and nonparametric estimation algorithm, ” Solar Ener gy , vol. 184, pp. 515–526, 2019. [14] Y . W en, D. AlHakeem, P . Mandal, S. Chakraborty , Y .-K. W u, T . Senjyu, S. Paudyal, and T .-L. Tseng, “Performance evaluation of probabilistic methods based on bootstrap and quantile regression to quantify PV power point forecast uncertainty , ” IEEE transactions on neur al networks and learning systems , vol. 31, no. 4, pp. 1134–1144, 2019. [15] F . Golestaneh, P . Pinson, and H. B. Gooi, “V ery short-term nonpara- metric probabilistic forecasting of renewable energy generation—with application to solar ener gy , ” IEEE T ransactions on P ower Systems , vol. 31, no. 5, pp. 3850–3863, 2016. [16] B. Gu, H. Shen, X. Lei, H. Hu, and X. Liu, “F orecasting and uncertainty analysis of day-ahead photovoltaic power using a novel forecasting method, ” Applied Energy , vol. 299, p. 117291, 2021. [17] L. Liu, Y . Zhao, D. Chang, J. Xie, Z. Ma, Q. Sun, H. Y in, and R. W en- nersten, “Prediction of short-term PV power output and uncertainty analysis, ” Applied energy , vol. 228, pp. 700–711, 2018. [18] W . Zhang, Y . Luo, Y . Zhang, and D. Sriniv asan, “Solarg an: Multiv ari- ate solar data imputation using generative adversarial network, ” IEEE T ransactions on Sustainable Energy , v ol. 12, no. 1, pp. 743–746, 2020. [19] M. Shen, H. Zhang, Y . Cao, F . Y ang, and Y . W en, “Missing data impu- tation for solar yield prediction using temporal multi-modal variational auto-encoder , ” in Pr oceedings of the 29th A CM International Confer ence on Multimedia , 2021, pp. 2558–2566. 10 [20] I. B. Benitez, J. A. Ibañez, C. D. Lumabad, J. M. Cañete, F . N. De los Reyes, and J. A. Principe, “ A nov el data gaps filling method for solar PV output forecasting, ” Journal of Renewable and Sustainable Energy , vol. 15, no. 4, 2023. [21] T . Shireen, C. Shao, H. W ang, J. Li, X. Zhang, and M. Li, “Iterati ve multi-task learning for time-series modeling of solar panel PV outputs, ” Applied energy , vol. 212, pp. 654–662, 2018. [22] D.-S. Lee and S.-Y . Son, “PV forecasting model dev elopment and impact assessment via imputation of missing PV power data, ” IEEE Access , vol. 12, pp. 12 843–12 852, 2024. [23] W . Liu, C. Ren, and Y . Xu, “Missing-data tolerant hybrid learning method for solar power forecasting, ” IEEE T ransactions on Sustainable Ener gy , vol. 13, no. 3, pp. 1843–1852, 2022. [24] ——, “PV generation forecasting with missing input data: A super- resolution perception approach, ” IEEE T ransactions on Sustainable Ener gy , vol. 12, pp. 1493–1496, 2021. [25] T . Costa, B. Falcão, M. A. Mohamed, A. Annuk, and M. Marinho, “Employing machine learning for advanced gap imputation in solar power generation databases, ” Scientific Reports , vol. 14, no. 1, p. 23801, 2024. [26] Q.-T . Phan, Y .-K. W u, and Q.-D. Phan, “Enhancing one-day-ahead prob- abilistic solar power forecast with a hybrid transformer-lube model and missing data imputation, ” IEEE T ransactions on Industry Applications , vol. 60, no. 1, pp. 1396–1408, 2024. [27] D. B. Rubin, Multiple Imputation for Nonr esponse in Surve ys . New Y ork: John Wile y & Sons, 1987. [28] P . Pashmchi, J. Benoit, and M. Kanaga wa, “kNNSampler: Stochastic imputations for recovering missing value distributions, ” T ransactions on Mac hine Learning Research , 2025. [Online]. A vailable: https: //openrevie w .net/forum?id=4CDnIA CCQG [29] M. Kanagawa, “F ast computation of leave-one-out cross-validation for k-NN regression, ” Tr ansactions on Machine Learning Researc h , 2024. [30] D. B. Rubin, “Multiple imputation after 18+ years, ” Journal of the American Statistical Association , vol. 91, no. 434, pp. 473–489, 1996. [31] K. Krishnamoorthy , Handbook of statistical distributions with applica- tions . Chapman and Hall/CRC, 2006. [32] O. Troyanskaya, M. Cantor, G. Sherlock, P . Brown, T . Hastie, R. T ib- shirani, D. Botstein, and R. Altman, “Missing v alue estimation methods for dna microarrays, ” Bioinformatics , v ol. 17, no. 6, pp. 520–525, 2001. [33] T . Hastie, R. T ibshirani, and J. Friedman, The Elements of Statistical Learning: Data Mining, Inference, and Prediction , 2nd ed. New Y ork: Springer , 2009. [34] L. Breiman, “Random forests, ” Machine Learning , vol. 45, no. 1, pp. 5–32, 2001. [35] T . Cover and P . Hart, “Nearest neighbor pattern classification, ” IEEE T ransactions on Information Theory , vol. 13, no. 1, pp. 21–27, 1967. [36] D. E. Rumelhart, G. E. Hinton, and R. J. W illiams, “Learning repre- sentations by back-propagating errors, ” Nature , vol. 323, pp. 533–536, 1986. [37] R. Tibshirani, “Regression shrinkage and selection via the lasso, ” Jour- nal of the Royal Statistical Society: Series B , vol. 58, no. 1, pp. 267–288, 1996. [38] F . Pedregosa, G. V aroquaux, A. Gramfort, V . Michel, B. Thirion, O. Grisel, M. Blondel, P . Prettenhofer, R. W eiss, V . Dubour g, J. V ander- plas, A. Passos, D. Cournapeau, M. Brucher , M. Perrot, and E. Duch- esnay , “Scikit-learn: Machine learning in Python, ” J ournal of Machine Learning Research , vol. 12, pp. 2825–2830, 2011. Parastoo Pashmchi receiv ed the Ph.D. degree in data science from Sorbonne Uni versity , in 2026, through a joint industrial program with SAP Labs France. She receiv ed the M.Sc. degree in smart cities engineering from Univ ersité Côte d’Azur, Nice, France, in 2022. Previously , she earned an- other M.Sc. degree in civil engineering from Isfahan Univ ersity of T echnology , Isfahan, Iran, in 2018. She received her B.Sc. degree in ci vil engineering in Iran in 2014. Her research focuses on smart infrastructures and energy transition systems. Jérôme Benoit receiv ed the Engineer’ s degree in computer science from Poly- tech’Marseille, Marseille, France, in 2019. He previously received the M.Sc. degree in mathematics from Aix-Marseille Université, Marseille, France, in 1997. He has been w orking as an R&D Software Engineer at SAP Labs France since 2019. His research focuses on e-mobility , electric vehicle charging infrastructure, and machine learning applied to smart charging systems. Motonobu Kanagawa is an Assistant Professor in the Data Science Department at EURECOM, France, since 2019. Previously , he was a research scientist at the Max Planck Institute for Intelligent Systems and the Univ ersity of Tuebingen in Germany from 2017 to 2019. Before this, he was a postdoctoral researcher (2016-2017) and a PhD student (2013- 2016) at the Institute of Statistical Mathematics in Japan.
Original Paper
Loading high-quality paper...
Comments & Academic Discussion
Loading comments...
Leave a Comment