EVNextTrade: Learning-to-Rank-Based Recommendation of Next Charging Nodes for EV-EV Energy Trading
Peer-to-peer energy trading among electric vehicles (EVs) has been increasingly studied as a promising solution for improving supply-side resilience under growing charging demand and constrained charging infrastructure. While prior studies on EV-EV e…
Authors: Md Mahfujur Rahmana, Alistair Barros, Raja Jurdak
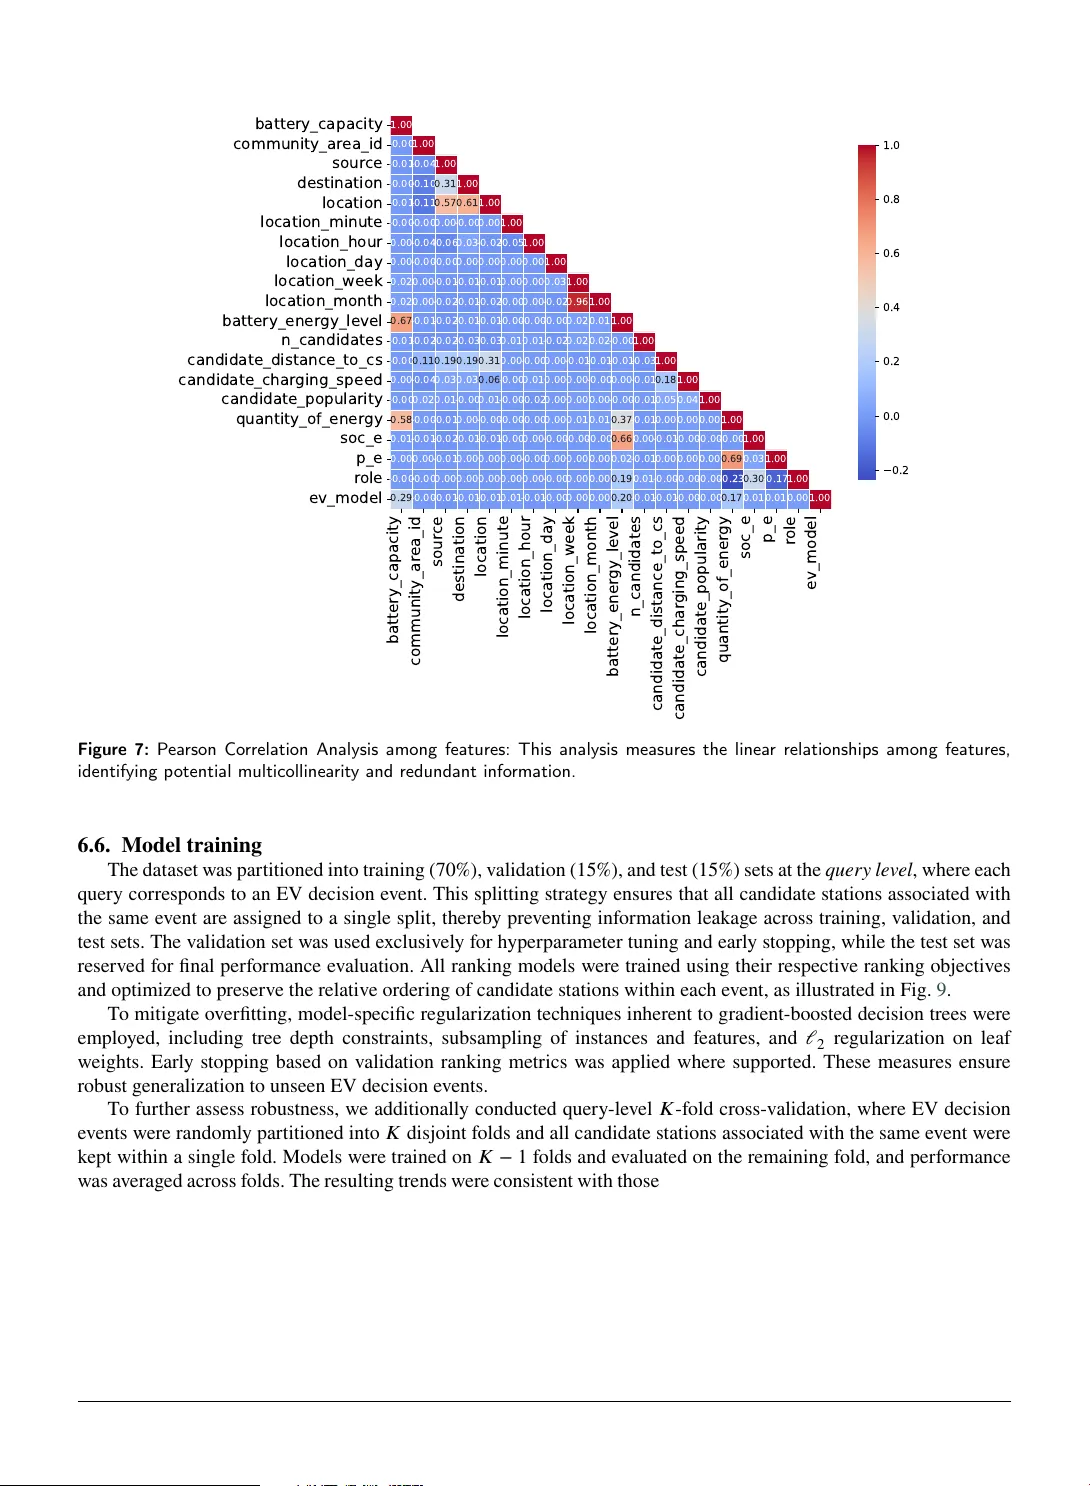
EVNe xtT rade: Lear ning-to-Rank -Based R ecommendation of Ne xt Char ging N odes f or EV –EV Ener gy T rading Md Mahfujur Rahman a , ∗ , Alistair Bar ros a , Raja Jurdak b and Darshika Kogg alahe w a a a School of Information Systems, Queensland Univer sity of T echnology , Brisbane, QLD, 4000, Australia b School of Computer Science, Queensland U niver sity of T ec hnology, Brisbane, QLD, 4000, Austr alia A R T I C L E I N F O Keyw ords : Electric v ehicle energy trading Charging nodes recommendation Learning-to-rank Gradient boosted ranking models Electric v ehicle mobility data Mobility-a ware energy trading A B S T R A C T Peer -to-peer energy trading among electric vehicles (EVs) has been increasingl y studied as a promising solution for improving suppl y-side resilience under g ro wing charging demand and constrained charging infrastructure. While pr ior studies on EV –EV energy trading and related EV research ha ve largely f ocused on transaction management or isolated mobility prediction tasks, the problem of identifying which charging nodes are more suitable for EV –EV trading in jour ney contexts remains open. W e address this gap by formulating next charging nodes recommendation as a learning-to-rank problem, where each EV decision ev ent is associated with a set of candidate char ging locations. W e propose a super vised ranking framewor k applied to a large-scale urban EV mobility dataset comprising millions of jour ne y records and multidimensional EV trading-related features, including EV energy level, trading role, distance to charging locations, c harging speed, and temporal station popularity . To account f or uncert ainty arising from the mobility of both energy providers and consumers, as well as the presence of multiple viable c harging nodes at a decision point, we employ probabilistic relevance refinement to generate graded labels for ranking. W e evaluate g radient-boosted lear ning-to-rank models, including LightGBM, XGBoost, and CatBoost, on EV jour ne y records enr iched with candidate char ging nodes. Experimental results show that LightGBM consistently achie ves the stronges t ranking per formance across standard metrics, including NDCG@k, Recall@k, and MRR, wit h par ticularl y strong early -ranking quality , reflected in the highest NDCG@1 (0.9795) and MRR (0.9990). These results highlight t he effectiveness of uncer tainty-a war e lear ning-to- rank for char ging node recommendation and suppor t improv ed coordination and matching in decentralized EV –EV energy trading systems. 1. Introduction Electric vehicles (EVs) hav e gained significant attention due to their potential to offer sustainable and eco-fr iendly transport ation solutions. The growing popular ity of EVs, t he declining cost of Renew able Energy Resources (RES), and technological advancements in energy stor age are significant factors in this trend. By 2030, t he number of EVs on the road w orldwide is expected to increase from just ov er 11 million in 2020 to approximatel y 145 million, according to the Inter national Energy Agency (IEA). At the same time, the increasing number of EVs has led to new and persistent challenges. Charging demand f or EVs is surging and f aces bar r iers due to the limited number of av ailable gr id-connected charging stations [ 13 ]. Meanwhile, EV dr ivers face bottlenecks, queues, and prolong ed w ait times when accessing charging stations (CSs). The limited a vailability of gr id-connected CSs e xacerbates t his challenge [ 6 ]. A dded to these challeng es are localized energy deficits, where gr id constraints and insufficient charging infrastr ucture hav e already limited EV usage, leading to a decline in EV adoption despite increasing mobility demand [ 1 ]. Finally , as widely repor ted, EV drivers e xperience range anxiety due to the limit ations of c harg e stations along their trav el routes, which are often commensurate with their daily jour ney s, and the limited batter y life times of EVs, requiring freq uent rechar ging. In the face of these challeng es, new opportunities are emerging to address resource short ages in ener gy supply and distribution bey ond the central urban areas in which EV energy trading is prominent [ 4 , 38 ]. In particular, bidirectional energy ex change across EVs is g ro wing in matur ity , as is t he reliability of wireless char ging pads (WCPs) through ∗ Corresponding author mdmahfujur.rahman@hdr.qut.edu.au (M.M. Rahman) OR CID (s): 0000-0002-3102-2099 (M.M. Rahman); 0000-0001-8980-6841 (A. Barros); 0000-0001-7517-0782 (R. Jurdak); 0000-0002-2695-1846 (D. Koggalahe wa) 1 : Preprint submitted to Elsevier Page 1 of 33 which EV –EV trading can t ake place [ 1 , 34 , 2 ]. Howe ver , t he contexts f or EV –EV trading car ry ke y differences compared to the currently a vailable EV –to–CS (EV –CS) models. Consumers, as w ell as providers, need to be matc hed with pro ximate EVs, each car rying distinct and independent mobile contexts. In par ticular , t he selection of trade points inv olves na vigation through varying tra vel pathwa ys, each consisting of different road segments with variable traffic densities. This usually results in variations in dr iv er jour ney routes, leading to choices and decisions about the selection points for trading. In addition, t he choices are influenced by t he perceived waiting times at char ging nodes, which include the times of energy transf er and queuing times as cars a wait t heir tur n f or access to char ging nodes. These challeng es are fur ther heightened, as successful bilateral trades depend on the alignment of independent drivers ’ navigation choices, each na vigating t heir own jour ney and diminishing energy levels. Ultimately , a trade, being essentially a service, car ries deliv ery obligations of resource capacity (how much energy is expected to be ex changed and t he speed of transfer) and reliability (the a vailability of the trading par tner). This, too, needs to be carefully appraised b y dr ivers when making choices about where to trade energy . This highlights the need for potential energy manag ement solutions. Existing research in EV energy management has made significant progress in forecas ting charging demand and anal yzing EV mobility , particularly for stationar y gr id-connected charging stations. Machine learning and deep lear ning techniques hav e been widely applied to predict char ging demand and infer char ging behavior from histor ical dat a [ 3 , 50 ]. How ever , most pr ior studies assume relativel y stable charging av ailability and larg ely focus on demand-side beha vior, limiting its applicability to EV–EV energy trading scenar ios where both energy providers and consumers are mobile [ 6 ]. While some studies classify EVs as energy providers or consumers based on predicted energy consumption [ 52 ], they typically rely on limited trav el histor y and ov erlook cr itical factors such as distance to candidate char ging locations, char ging-site capacity , charging speed, and the presence of nearby trading partners. Similarly , mobility-based approac hes that predict next charging location assume guaranteed charging a vailability at predicted vehicle destination, an assumption that is frequentl y unrealistic in EV–EV trading contexts [ 30 ]. From a dat a perspective, existing EV datasets research predominantly capture charging-session records at fixed stations [ 7 , 5 , 24 ], or general mobility traces without explicitl y modeling of energy trading interactions [ 28 ]. As a result, there is a lack of integrated, multidimensional dat asets that jointly model EV journeys, dynamic trading roles, energy ex change requirements, and candidate char ging locations along with their associated attr ibutes. Crucially , EV–EV energy trading introduces a complex decision-suppor t problem that ex ceeds the scope of e xisting prediction-based approaches. An EV–EV trading requires the spatio-temporal synchronization of two mobile EVs at a specific node. This interaction is parameterized by multiple competing variables, including trav el detours, waiting times, energy av ailability , charging speeds, and t he a vailability of successful partner matching. Fur thermore, each EV operates within a unique mobile context, defined by distinct jour ney requirements and na vigation choices across road networ ks wit h varying traffic densities. As such, EV drivers require automated suppor t to coordinate jour ney s and decide where to consume or pro vide energy . These limitations motiv ate the need f or recommendation models tailored to EV–EV ener gy trading, whic h jointl y consider EV mobility , dynamic energy state, char ging infrastr ucture characteristics, and contextual factors from both the energy provider and consumer perspectiv es. In this study , we address this gap by f or mulating ne xt char ging node recommendation as a ranking problem, in which each EV decision ev ent is associated with a set of candidate char ging nodes that are ev aluated and ranked simultaneously . Rather than predicting a single future location, the objective is to rank candidate charging nodes according to their relativ e likelihood of being selected for energy trading at a given decision point along an EV journey . T o suppor t next char ging node recommendation in EV–EV energy trading, we propose a super vised ranking- based framew ork that integrates mobility and energy-related f eatures including EV battery state, trading role, distance to candidate charging locations, char ging speed, and temporal station popularity . The framew ork produces an ev ent- specific (i.e., for each EV , jour ne y , and time) order ing of candidate char ging nodes based on EV jour ne ys, battery energy lev els, distances to charging locations, char ging speeds, and station popular ity . Experimental results demonstrate the effectiveness of t he proposed approac h in identifying t he most lik ely next char ging nodes f or EV –EV energy trading. This paper contr ibutes to the advancement of the field through the f ollowing ke y contributions: • W e present a multidimensional EV–EV trading dat aset that includes EV journeys, candidate charging nodes (W CPs), and EV tr ading intention profiles f or next charging nodes recommendation. The dataset fur ther incorporates char ging station metadat a, including location, c harg er type, charging speed, and number of por ts, as w ell as Google Popular Times dat a to capture temporal user density and energy av ailability trends at W CPs. : Preprint submitted to Elsevier P age 2 of 33 • T o the best of our know ledge, this is the first study to address the next charging nodes recommendation specifically for EV–EV energy trading. W e f ormulate t he problem as a ranking task and propose a lear ning- to-rank framew ork t hat lev erages multidimensional EV mobility and energy-related data to predict t he relative likelihood of charging nodes being considered f or EV–EV energy trading at a giv en decision point along an EV journey . • W e evaluate multiple supervised learning-to-rank models, including LightGBM, XGBoost, and CatBoost, under identical experiment al settings. The results demonstrate robust and consistent ranking per f ormance across models, highlighting the effectiv eness of the proposed frame work in learning relativ e char ging node preferences under uncertainty . The paper is structured as follo ws. Section 2 revie ws the related work on EV charging supply and demand prediction, EV mobility prediction, char ging location recommendation systems for EVs, and f eatures used f or mobility prediction, and identifies the cor responding research issues. Section 3 presents the rationale f or future-state recommendation. Section 4 descr ibes the study design, and Section 5 f or mulates t he problem. Section 6 details the research methodology , including data acquisition, label generation, dat a preprocessing, lear ning-to-rank modeling, model training, and evaluation metrics. Section 7 presents t he e xper imental results and discussion. Section 8 outlines the limitations of t he study , and Section 9 concludes the paper and discusses future research directions. 2. Related wor k This section re view s de v elopments and ke y contributions to the existing literature on predictiv e and recommenda- tion techniq ues, either directly related to EV –EV trading or indirectly related through proposals from EV -CS. First, it discusses sev eral tec hniques f or predicting char ging demand and supply f or EV–EV and EV –CS settings, highlighting their relev ance to EV–EV trading. Next, it discusses tec hniques f ocusing on EV mobility prediction. Subsequentl y , it discusses a char ging location recommendation sys tem for EVs. Finall y , it identifies the salient f eatures used in mobility prediction and del ves into the researc h issues that need to be addressed to advance t he EV–EV ener gy trading systems. 2.1. EV charging supply and demand prediction Accurate prediction of char ging demand and supply is essential for matching energy providers and consumers in EV –EV trading. Zhao et al. [ 52 ] used a LightGBM classifier to identify providers and consumers based on expected mileage and real-time location, achieving 95% accuracy in role classification. How ever , their model ex cluded contextual mobility features such as journey navigation choices of the driver , traffic congestion, and detour distances, limiting spatial-temporal applicability . Yi et al. [ 50 ] applied a Seq2Seq deep learning model f or long-term charging demand f orecasting at fixed charging stations (CSs), outper f or ming ARIMA, LSTM, and XGBoost baselines, but wit hout addressing supply-side v ariability . Similarly , by integrating heterogeneous f eatures like historical char ging dat a and time-related factors (e.g., time of day , day of the week), the T-LS TM-Enc [ 12 ] and hybrid LSTM netw ork [ 26 ] algorit hms can predict energy demand at CSs, capturing long-ter m and shor t-term f eatures of charging demand. How ev er, they did not incor porate real-time supply or mobility data. These studies indicated the impor tance of heterog eneous features in dev eloping effectiv e coordination strategies f or impro v ed trading matc hing and scheduling at char ging locations. In addition, these s tudies also sho wed that accurate prediction enables charging station operators to optimize resource allocation and manage energy suppl y more effectiv ely . 2.2. EV mobility prediction This section e xplores EV mobility prediction, where EVs are candidates for providing and consuming energy in trading. To facilitate EV –EV trading, EVs need to be effectiv ely redirected to conv enient charging locations where they can pro vide or consume energy . Howe ver , a pair of EV providers and consumers is required for trading, wit h the challeng e of EVs being mobile on different routes and in different geographic areas. Hence, t his section cov ers the existing literature on individual mobility predictions of EVs and in ves tigates t he cur rent state of research in this domain. Over the past f ew years, DL -based neural netw orks ha ve been increasingl y adopted for individual vehicle location prediction. The LSTM model with a backtrac king attention mechanism addresses long-term inf ormation handling in sparse scenar ios and mitigates vanishing sequential dependency in vehicle stop location prediction [ 25 ]. This mechanism aggregates historical hidden st ates using weights t hat reflect user regular ity and preference, impro ving : Preprint submitted to Elsevier P age 3 of 33 prediction accuracy by 7-10% o ver state-of-the-art methods across three real-w orld datasets with o ver 10,000 vehicles. The study [ 39 ] also used LS TM to predict the ne xt destinations of taxi drivers based on sequences of pick -up and drop- off points and timestamps. They utilized bag-of-concept (BOC) and word2v ec methods to capture points of interest (POIs), suc h as shopping malls and schools, and spatial zone embedding f or accurate predictions. Herber th et al. [ 18 ] also mentioned POIs as significant parameters f or mobility prediction. W ang et al. [ 47 ] proposed a h ybrid model that integrates a multi-la yer perception (MLP) to extract local features and LSTM to extract long-term dependency for predicting the trajectory of only the moving state of t axis [ 47 ]. The results show ed that the MAE increased when t he number of future prediction steps was long. Similarly , Fan et al. [ 14 ] introduced a h ybrid model combining CNN to capture local features and bidirectional LSTM to capture global f eatures. This model predicts the next location in each trajectory by consider ing contextual inf ormation like traffic flow and weather data. The results show ed that the model’ s accuracy sur passes t he baseline methods, particularly in predicting longer sequences of future locations. Although these studies do not directl y address EV mobility prediction, their relev ant methodologies can pro vide useful insights f or dev eloping EV mobility prediction at WCPs. Some studies ha ve been attempted on t he prediction of EV dr iving range [ 45 ], EV ne xt char ge location [ 30 ], etc., which ma y also be t he pioneering idea f or EV mobility prediction in EV –EV trading. A study by Robert et al. [ 30 ] used a CNN to predict EVs’ next charging locations based on battery levels, providing a no vel dataset f or EV mobility . Ho we ver , this study f ocused only on demand-side prediction, ov erlooking energy trading, which requires predicting the mobility of both ener gy pro viders and consumers at c harging locations. Additionally , this study did not account f or distances to the charg e locations and c harging speed, which could impact predictions. Based on t hese studies, there is a lack of EV mobility data at W CPs with varying energy requirements and their ability to provide and obt ain energy . How ev er, DL -based techniques such as CNN, LSTM, and CNN-LSTM are promising solutions f or solving EV mobility prediction and learning long-term dependencies in mobility time-series data. 2.3. Charging location recommendation system for EVs T eimoor i et al. [12] presented an EV recommender model f or charging station selection based on a combination of cloud and federated learning. The selection process is done based on some variables such as the a vailability of EV CS charging spots, distance, remaining batter y capacity , price, and time. The w eights are calculated b y dividing the parameters into EV and EVCS-related parameters and f or ming a v ector of pairs representing the variables in volv ed in the computation. The a verag e of all EVCS v ar iable values is assigned as a weight f or that variable. Since the proposed model is assumed to recommend an EV CS in real-time, the latency can be notified in the selection process because of insufficient EV and EV CS sample size, which can affect the ex ecution time and, consequentl y , the per f ormance of t he recommender system. Howe ver , the suppl y side has not been taken into consideration while selecting the best EV CS. Another study by Habbal et al. [ 16 ] developed a User-Pref erence-Based Charging Station Recommendation Scheme (UPCSRS) t hat integrates user pref erences into a multiple-attr ibute decision-making (MADM) framew ork. The approach employs t he analytic hierarch y process (AHP) to assign weights to user-defined cr iteria–distance, w aiting time, charging time, and price–and applies the technique f or order pref erence by similar ity to the ideal solution (TOPSIS) to rank the av ailable stations. Using real dat a from t he U.S. Department of Energy , the scheme achie ved superior accuracy and user satisf action compared with pro ximity- or price-based methods, demonstrating the effectiveness of a user-centric and adaptiv e recommendation process f or EV–station selection. Ho we ver , their model primar ily focuses on EV–station interactions and does not consider decentralized energy ex chang e between vehicles. A larg e number of selection cr iteria for charging locations can cause a decline in system performance, while a smaller number may not result in a good decision [ 16 ]. Theref ore, to determine the appropr iate range of cr iteria, a revie w w as conducted, ranging from three [ 16 , 44 , 48 , 10 , 11 , 27 , 19 ] to ten. How ev er, according to t he literature revie w , distance, char ging time (calculated by c harging speed), Google popular times, waiting time, and price emerged as k ey determinants from a comprehensive analysis of prior studies in the field. Bey ond EV charging, recommendation research in related domains, such as point-of-interest (POI) selection in location-based ser vices and e-commerce, has adopted a range of methodologies, including fuzzy logic, ranking-based approaches, and probabilistic modeling [ 29 , 51 , 33 ]. Fuzzy content matc hing and fuzzy multi-criter ia decision-making methods are particularly effective in settings where user pref erences and contextual factors are uncert ain, as the y model relev ance in a g raded rat her t han binary manner . In particular, Fuzzy TOPSIS has been widely used to aggregate : Preprint submitted to Elsevier P age 4 of 33 heterog eneous cr iter ia and produce ordered candidate lists when relev ance is imprecise or derived indirectly from multiple f actors [ 41 , 32 ]. Learning-to-rank has consequentl y emerg ed as a pr incipal approach in information retriev al and recommender systems, where the objective is to order candidate items by their relative relev ance rather t han to predict absolute utility values [ 51 , 43 ]. In lear ning-to-rank f ormulations, each recommendation ev ent is treated as a query over multiple candidates, and models lear n pref erence relationships using pair -wise, or list-wise super vision. Ranking- based formulations align naturall y with top-k ev aluation metrics and graded relev ance modeling, and are well-suited to recommendation scenar ios where decisions are comparative. A persistent challenge in ranking-based recommendation systems is the lack of e xplicit ground-tr uth rele vance labels. In many real-world settings, such as mobility and location recommendation, relev ance is not e xplicitly provided and must be inferred from noisy , incomplete information. In such cases, relevance signals are often constr ucted indirectly from av ailable cr iteria rat her t han obtained as direct annotations. Fuzzy multi-cr iteria decision-making methods provide a sys tematic wa y to generate g raded relev ance signals that preser v e ordinal relationships among alternatives wit hout imposing hard decisions [ 41 , 29 ]. Separately , latent-variable probabilistic models ha ve been widely used in recommender systems to capture hidden user preferences and conte xtual relevance under sparse or noisy obser v ations, wit h model parameters typically inferred using the Expectation-Maximization (EM) algor ithm [ 33 ]. These probabilistic approac hes focus on uncov er ing latent relev ance str ucture from noisy , indirectly constructed relev ance signals rather than relying on explicit g round-truth supervision, making them w ell-suited to recommendation scenarios with limited or uncer tain f eedback. How ev er, none of t hese analy ses aims to dev elop a recommendation system f or EV –EV energy trading, which in v olv es both demand and suppl y sides, including EV journeys at wireless charging pads. 2.4. F eatures used for mobility prediction Features play a critical role in prediction for EVs [ 46 ]. The accuracy and effectiveness of the predictive models hea vily rely on t he relevant and informativ e f eatures extracted from the dat a. Similarly , the characterization of mobility features, measurement of individual tra vel behaviors, and per f or mance analy sis are cr ucial f or vehicle mobility prediction [ 25 ]. The table 1 summarizes key f eatures for mobility prediction, including static attr ibutes like v ehicle ID and model name, and dynamic attr ibutes such as timestamps, locations, visit frequency , and batter y energy lev els. These f eatures collectively enable tracking and analyzing vehicle mov ements, tra vel patterns, and frequent POIs. Dynamic attributes like battery energy le vels and tr ip distance are par ticularly relev ant attributes in relation to EV –EV trading. How ev er, t he table underscores that most studies focus on con ventional v ehicles or individual EV mobility attr ibutes rather than EV –EV trading aspects, lea ving a gap in lev eraging EV mobility and energy -centric attr ibutes for EV –EV energy trading. This highlights the need f or fur ther research integ rating EV mobility and energy-centric attr ibutes to address specific challenges in EV –EV trading. The studies discussed in this section address similar problem domains using different predictive and recommenda- tion approaches. Their findings ha ve inf ormed t he dev elopment of our proposed solution by clar ifying the existing methodological gaps. Overall, the revie wed research demonstrates substantial progress in EV –CS prediction and recommendation systems but rev eals a lack of predictive modeling that captures EV –EV interactions at wireless char ging pads. This g ap motivates our proposed approac h, which focuses on recommending the next char ging locations f or decentralized EV–EV energy trading. 2.5. Resear ch issues A significant challeng e in EV –EV energy trading is anticipating EV mobility and charging node selection while tra velling. This difficulty ar ises from heterogeneous trav el patter ns, dynamic energy states, varying charging or dischar ging intent, and the mobility of both energy consumers and providers. These uncer tainties make it challenging to determine where EVs are likel y to be at any given time for energy trading, par ticularly when multiple f easible char ging locations are av ailable along an EV’ s jour ne y . How ev er, existing studies lar gel y over look EV mobility contexts that are critical for EV –EV energy trading, such as dynamically changing energy levels, dual supply –demand roles of EVs, start and stop-off locations, destination- dependent routing, proximity to charging resources, and constraints on the capacity and timeliness of energy transfer . More impor tantly , prior w ork often treats c harging node selection as an isolated problem, without e xplicitly modeling the relativ e desirability of multiple feasible charging locations encountered along a journey . : Preprint submitted to Elsevier P age 5 of 33 T able 1 Common data attributes or features used in existing studies for supp o rting mobility prediction: mobility data description Field/Features Category Static/dynamic Description Ref Used in EV–EV trad- ing VId Identifier S Unique identifier fo r the conventional ve- hicle [ 25 , 20 , 36 , 39 , 18 , 47 , 14 ] Y es Vehicle model Vehicle S Name of the vehicle model [ 30 ] Y es Timestamps T emp oral D Current date and time [ 25 , 30 , 20 , 36 , 39 , 18 , 47 , 14 ] Y es Locations (latitude, longitude) Spatial D Locations of vehicle at different time [ 25 , 30 , 20 , 36 , 39 , 18 , 47 , 14 ] Y es Stay locations Spatial D Vehicles stay location at different stoppage [ 25 ] No Visit frequency Behavioral D Indicate frequent visit at specific locations [ 25 , 20 , 42 ] No POIs Contextual D Represents nearb y points of interest [ 39 , 18 ] No Radius of gyra- tion Mobility D Distanced travel by users [ 15 ] No Battery energy level Energy D State of the charge (SoC) of EVs [ 30 ] Y es T rip distance (km) Mobility D Represent the dis- tance covered in km [ 30 ] No As a result, next charging nodes recommendation in EV –EV energy trading remains underexplored. In practical trading scenarios, EVs must evaluate and choose among a set of reachable wireless charging pads at a given time, and these decisions are inherentl y relativ e rather than absolute. For example, a wireless char ging pad 𝑊 𝐶 𝑃 1 ma y be considered more suitable t han 𝑊 𝐶 𝑃 2 , … , 𝑊 𝐶 𝑃 𝑛 at time 𝑡 due to differences in distance, energy transfer capability , a vailability , and t he likelihood of successful interaction with another EV . This study addresses this gap b y dev eloping a predictive framewor k for next charging node recommendation that ranks candidate char ging locations according to their relative suitability for EV –EV energy trading. By explicitl y modeling relative desirability under uncer tainty , the proposed approach pro vides a foundation for effective coordination and matc hing in decentralized EV –EV energy trading systems. 3. Rationale for future state recommendation Our objective is to inf er likely EV –EV ener gy trading locations befor e the next char ging cy cle occurs, using only historical and contextual inf or mation av ailable at a given time. This is motiv ated b y t he follo wing considerations: 1. Efficient matc hing and pr oactive coor dination: Anticipating future trading locations enables proactiv e matching betw een pro vider and consumer EVs and advanced coordination of energy ex changes. By reasoning about lik ely future states, the system can mitigate localized congestion at wireless charging pads and reduce coordination dela ys, thereby impro ving ov erall energy distribution efficiency . 2. Anticipatory decision modeling: Prior w ork in transpor tation and EV charging beha vior suggests that char ging- related decisions are of ten made ahead of ar r iv al based on journey progress, remaining energy , and anticipated char ging opportunities. Modeling these decisions in advance suppor ts proactive guidance and aligns wit h how vehicles plan subsequent actions during a tr ip. 3. Pr oactive driv er support: The proposed framew ork targets proactiv e assistance, such as recommending suit able trading nodes or scheduling energy ex changes ahead of time. This requires predicting likely future charging locations prior to the next charging cycle, rat her t han reacting only after a v ehicle ar r iv es at a char ging node. 4. F easibility fr om obser v ed mobility regularities: Alt hough the mobility data are derived from taxi trajectories, they exhibit stable spatio-temporal regular ities under real-world demand (e.g., recur rent routes, frequent stop : Preprint submitted to Elsevier P age 6 of 33 locations, and time-of-day concentration around popular destinations). These repeated patter ns provide sufficient signal to lear n a mapping from histor ical and contextual f eatures to likely next charging/trading locations. The approach does not assume optimal or fully rational behavior; it exploits empirically obser v ed collective regularities to support context-dependent char ging-node recommendations. This approach enables conte xt-a ware recommendations t hat align wit h how drivers plan their subsequent actions while tra veling. 4. Study design The aim of this study is to dev elop techniq ues and algorit hms to support efficient EV –EV trading in which optimal pairs of suppliers and consumers can be matched at locations and times, given dynamic mobile contexts of EVs. T o support this, t his study proposes to study an enriched context for EV mobility and to de v elop techniques and algor ithms in suppor t of a predictive model. This study is guided by one main research question (RQ): How can the c har ging of EVs be r ecommended at nodes (wir eless c harging pads) f or both provider s and consumers, given EV mobility contexts? By understanding the challeng es and research gaps, this question aims to recommend the most likel y wireless char ging pads for each EV . This RQ will guide t he in ves tigation, helping to e xplore various aspects of predictions and to develop an effectiv e solution for EV –EV trading. To suppor t t his, our contextual assumptions are as follo ws: • EV jour ney s are not strictly point-to-point but ma y include inter mediate stop-offs due to tra v el or c harging needs, reflecting realistic mobility patterns and enabling the consideration of multiple candidate char ging or trading nodes along a journey . • A wireless charging pad considers energy sourcing only from the pro vider. • Wireless charging pads are unevenl y distributed in spatial areas. • Pro viders and consumers are unevenl y distributed in unbounded spatial areas. • EV dr iver choice f or node selection are based on variable traffic flo ws, capacity , and timeliness of ener gy transfer of c harging pads, pro ximity to char ging resources, and energy a vailability . • EV drivers will deviate (detour) from their jour ney routes (e.g., home to w ork, work to home) by up to 10km only . This is based on trav el time, traffic conditions, and energy constraints. • EV drivers will not supply more energy than they require to reach their own destinations. • EV dr ivers will be willingness to par ticipate in EV–EV energy trading when contextual conditions, such as energy av ailability , tra vel f easibility , and charging node accessibility , are sufficiently fa vorable. • The c harging amount f or supplying and consuming will be sufficient to fulfill the next jour ne y requir ement of both pro vider and consumer for a giv en route. • Routing decisions made by EV dr iv ers are influenced b y na vigation applications (e.g., Google Maps or similar services), which guides route based on factors such as trav el time, traffic conditions, and distance. This assumption reflects realistic navig ation-assisted driving behavior and effects the set of feasible routes and char ging nodes encountered dur ing a jour ney . • Tr ading sys tem can trac k the energy used by EVs. These assumptions will guide t he formulation of t he mobility prediction function. : Preprint submitted to Elsevier P age 7 of 33 5. Problem formulation T o suppor t efficient EV–EV energy trading, we formulate a ranking-based predictive model t hat estimates the relativ e likelihood of candidate char ging nodes f or mobile EV providers and consumers at each decision point, giv en their ener gy state and mobility conte xt. For a given spatial area 𝑠𝑎 𝑖 ∈ and decision time 𝑡 , let 𝑡 = { 𝑒 1 , 𝑒 2 , 𝑒 3 , …} denote the set of EVs located within, or tra versing through, 𝑠𝑎 𝑖 during the decision interval [ 𝑡, 𝑡 + Δ 𝑡 ) , where Δ 𝑡 = 30 minutes. Each EV 𝑒 𝑖 ∈ 𝑡 is defined b y the tuple 𝑒 𝑖𝑑 , 𝑂 𝑡 𝑒 𝑖 , 𝐷 𝑡 𝑒 𝑖 , 𝑙 𝑡 𝑒 𝑖 , 𝐸 𝑡 𝑖 , 𝐵 𝑒 𝑖 𝑐 , 𝑢 𝑡 𝑒 𝑖 , 𝑑 𝑡 𝑒 𝑖 , corresponding to its journey state 𝐽 𝑡 𝑒 𝑖 at time 𝑡 . Here, 𝑒 𝑖𝑑 is the unique identifier of t he EV . 𝑂 𝑡 𝑒 𝑖 and 𝐷 𝑡 𝑒 𝑖 denote the origin and destination of 𝑒 𝑖 at time 𝑡 , dra wn from the global origin and destination sets 𝑡 = { 𝑂 𝑡 𝑒 ∶ 𝑒 ∈ 𝑡 } , 𝑡 = { 𝐷 𝑡 𝑒 ∶ 𝑒 ∈ 𝑡 } . The v ariable 𝑙 𝑡 𝑒 𝑖 ∈ represents t he spatial location of 𝑒 𝑖 at time 𝑡 , where denotes the set of feasible geographic locations. Locations may cor respond to or igins, destinations, or intermediate tra vel or trading points. 𝐸 𝑡 𝑖 denotes the current batter y ener gy lev el of 𝑒 𝑖 at time 𝑡 , expressed as a percent age, and 𝐵 𝑒 𝑖 𝑐 is the battery capacity . The ter m 𝑢 𝑡 𝑒 𝑖 represents the cumulativ e energy consumption (Wh) up to time 𝑡 , while 𝑑 𝑡 𝑒 𝑖 denotes t he trav eled distance within the jour ney . Let each EV 𝑒 𝑖 ha ve a battery capacity 𝐵 𝑐 (Wh) and a state of charg e SoC 𝑒 𝑖 ( 𝑡 ) ∈ [0 , 100] at time 𝑡 . This 𝑆 𝑜𝐶 is an import ant parameter in EV charging and disc harging, as it represents t he cur rent charg e le vel and play s a significant role in determining the charging or discharging activities dur ing a jour ney . Along an EV’ s jour ney , charging and discharging decisions arise at discrete decision points, such as intermediate stop-offs, route deviations, or proximity to charging infrastructure. At such points, an EV ma y act eit her as an energy consumer or provider , depending on its a vailable battery energy and remaining tra vel requirements. W e assume that an EV becomes eligible to act as an energy provider when it possesses sufficient sur plus energy bey ond its immediate mobility needs. Specificall y , if t he st ate of charg e ex ceeds a predefined safe ty t hreshold SoC t h , the EV is considered capable of discharging energy without compromising its ability to complete the remaining journey . Follo wing a pr ior study [ 21 ], we set SoC t h = 30% of the batter y capacity 𝐵 𝑐 f or provider EVs 𝑒 𝑖 . The t hreshold is calculated in Wh using the follo wing equation. 𝐸 𝑡ℎ = 𝑆 𝑜𝐶 𝑡ℎ 100 ∗ 𝐵 𝑒 𝑖 𝑐 (1) W e calculate the current energy 𝐸 𝑖 ( 𝑡 ) in Wh b y determining the cur rent SoC lev el and subtracting 𝐸 𝑡ℎ from 𝐸 𝑖 ( 𝑡 ) to get the av ailable energy 𝐸 av 𝑖 ( 𝑡 ) . 𝐸 𝑖 ( 𝑡 ) = SoC 𝑒 𝑖 ( 𝑡 ) 100 × 𝐵 𝑒 𝑖 𝑐 . (2) 𝐸 av 𝑖 ( 𝑡 ) = 𝐸 𝑖 ( 𝑡 ) − 𝐸 t h , (3) If 𝐸 av 𝑖 ( 𝑡 ) of an EV 𝑒 𝑖 is more than minimum tradable energy ( 𝐸 t r ade min ) which is ten thousand units of energy [ 21 ], and it has enough ener gy 𝐸 t r av el 𝑖 ( 𝑡, 𝑑 ) for going to the ne xt destination [ 52 ], it can pro vide energy at proximate charging pads at time t. 𝐸 pr ov 𝑖 ( 𝑡 ) = max 0 , 𝐸 av 𝑖 ( 𝑡 ) − 𝐸 t r av el 𝑖 ( 𝑡, 𝑑 ) (4) W e assume that EVs can provide energy when they ha v e energy sur pluses and the right conditions, such as minimal time to reac h char ging pads and f ast ener gy transf er . Ot herwise, Other wise, w e classify it as a consumer that requires energy at charging pads. For EVs acting as energy consumers, we define a upper state-of-charg e level SoC t ar get (e.g., 100% ), which represents the pref er red charging lev el for continued tra vel reliability and charging requirement SoC min (e.g., 20% ), to a void batter y deterioration. Consumer energy deficit can be e xpressed as f ollow s: 𝐸 cons 𝑖 ( 𝑡 ) = max 0 , SoC t ar get 100 𝐵 𝑖 − 𝐸 𝑖 ( 𝑡 ) (5) : Preprint submitted to Elsevier P age 8 of 33 W e consider the maximum required distance from the intended route to nodes of each EV 𝑒 𝑖 f or charging or dischar ging between the source and destination. At each decision time 𝑡 between source and destination, an EV 𝑒 𝑖 encounters a set of feasible charging nodes (W CPs), 𝑒 𝑖 𝑡 = { 𝐶 𝑃 1 , 𝐶 𝑃 2 , …} , identified based on distance and accessibility from its current route. Each candidate c harging node 𝐶 𝑃 𝑗 is characterized by attr ibutes such as distance to t he EV 𝑑 ( 𝐶 𝑃 𝑗 , 𝑒 𝑖 ( 𝑡 )) , char ging or discharging speed 𝑠 ( 𝐶 𝑃 𝑗 ) , and time-dependent popularity or congestion lev el 𝑝 ( 𝐶 𝑃 𝑗 , 𝑡 ) (e.g., der iv ed from Google P opular Times) to understand provider or consumer density of the charging node. EV dr iv ers are assumed to hav e access to such inf ormation, including charging-node a vailability as well as aggregate supply and demand conditions through trading applications. These signals influence both the decision to act as an energy provider or consumer and the selection of viable char ging nodes at decision time 𝑡 . Let 𝐱 context 𝑖,𝑡 denote the feature vector descr ibing the EV jour ney , energy lev el, spatial-temporal features, and contextual state of EV 𝑒 𝑖 at time 𝑡 , and let 𝐱 𝐶 𝑃 𝑗 𝑖,𝑡 denote the f eature vector of candidate char ging node 𝐶 𝑃 𝑗 (e.g., distance, char ging speed, popularity). The objectiv e is to learn a parameterized scor ing function 𝑓 𝜃 ( ⋅ ) that maps t hese f eatures to a real-valued relevance score: 𝑠 𝑖,𝑗 ,𝑡 = 𝑓 𝜃 𝐱 context 𝑖,𝑡 , 𝐱 𝐶 𝑃 𝑗 𝑖,𝑡 , (6) where 𝑠 𝑖,𝑗 ,𝑡 ∈ ℝ denotes a real-valued relev ance score that reflects the relative suitability of candidate char ging node 𝐶 𝑃 𝑗 f or EV 𝑒 𝑖 at decision time 𝑡 . Higher values of 𝑠 𝑖,𝑗 ,𝑡 indicate a stronger preference for selecting 𝐶 𝑃 𝑗 relativ e to other candidate nodes wit hin t he same decision ev ent. Accordingl y , t he recommended char ging nodes for EV 𝑒 𝑖 at time 𝑡 are obt ained by sorting candidates in descending order of their predicted scores: ∗ 𝑖,𝑡 = ar gsor t ↓ 𝑠 𝑖,𝑗 ,𝑡 ∶ 𝐶 𝑃 𝑗 ∈ 𝑒 𝑖 𝑡 . (7) Model parameters 𝜃 are learned b y minimizing a ranking loss r ank , which measures the discrepancy between the predicted ordering of candidate char ging nodes and the ref erence ordering defined by graded relev ance labels 𝑦 𝑖,𝑗 ,𝑡 within each EV decision event. min 𝜃 r ank { 𝑠 𝑖,𝑗 ,𝑡 ( 𝜃 )} , { 𝑦 𝑖,𝑗 ,𝑡 } . (8) For a given decision ev ent 𝑖 at time 𝑡 , candidate char ging nodes 𝑗 ∈ 𝑖 are cor rectly ordered when nodes with higher graded relevance labels receiv e higher predicted relevance scores, i.e., 𝑦 𝑖,𝑗 ,𝑡 > 𝑦 𝑖,𝑘,𝑡 ⇒ 𝑠 𝑖,𝑗 ,𝑡 > 𝑠 𝑖,𝑘,𝑡 , where 𝑠 𝑖,𝑗 ,𝑡 denotes the predicted rele vance score assigned to candidate node 𝑗 . Hence, t he graded labels 𝑦 𝑖,𝑗 ,𝑡 defined a pref erence structure ov er candidate nodes, where larger values indicate strong er suitability for EV –EV energy trading under the cor responding mobility and energy context. This f or mulation enables the model to lear n an uncert ainty-a w are, ev ent-specific ranking policy that generalizes bey ond deterministic heuristics and suppor ts robust char ging node recommendation in EV –EV energy trading. 6. Resear ch methodology 6.1. Ov erall system pipeline The process begins with t he collection of multidimensional datasets, including t axi mobility traces, charging station specifications, and temporal popularity metrics of char ging locations. These datasets are acquired and unified through a combination of API-based access and a custom integration algor ithm. The aggregated dat a is t hen processed t hrough cleaning, nor malization, f eature extraction, and f eature selection stages. The selected features ser ve as input to the learning-to-rank model, whic h captures spatiotempor al dependencies in driver jour ney and trading dynamics (pro vider or consumer). To enhance model generalization and reduce ov erfitting, we apply hyperparameter tuning using manual search, along with regular ization techniq ues. Then the trained model predicts t he most probable char ging locations, thereby suppor ting impro ved decision-making and operational efficiency in EV –EV energy trading. : Preprint submitted to Elsevier P age 9 of 33 EV Mobility Apps Python Script and Algorithms NextT rade-EV Dataset APIs Google Popular T ime Management Systems Charging Station Management Systems EV mobility data Charging station data Google popular time data Figure 1: Overall process for the EV–EV trading datasets generation. 6.2. Data acquisition and preliminary analy sis Ne xt c harging nodes recommendation f or EV–EV energy trading requires datasets that jointly model EV jour ney and trading-related attributes, including dynamic trading roles (provider or consumer), energy transaction volumes, battery energy states, and the set of candidate charging locations encountered throughout an EV’ s journey . Our final dataset (Ne xtT rade-EV) integ rates four real-world empirical dat a sources: (i) Chicago t axi mobility traces, (ii) top-selling EV model from the US A and Australia, (iii) Chicago charging st ation infrastructure data, and (iv) Google popular times at char ging locations. Building on these empirical observations, we fur ther derive and augment phy sically g rounded attr ibutes, including EV energy le v els estimated from trav el distances and per -kilometer energy consumption rates. The complete set of dataset attributes used to train the ranking model is presented in T able 2 . T o enable the use of large-scale taxi mobility data as a proxy for future EV–EV trading scenar ios, we make two ke y assumptions. First, we assume that t he major ity of taxis will transition to EVs in the future. Second, we assume that all EVs employ a standardized wireless charging mechanism that is full y compatible with wireless char ging pads. Under these assumptions, non-EV t axi trajectories can be treated as potential EV jour ney s, which simplifies dataset construction and f eature der ivation while remaining aligned with anticipated trends in electric mobility and charging infrastructure. Our Chicago taxi mobility dataset encompasses 77 community areas within the city of Chicago, each representing a distinct geographic region. It contains taxi jour ne y records from 4,551 individual v ehicles collected over a 12-mont h period, compr ising more than 17 million jour ney s. Following the approach of Marlin et al. [ 30 ], we constr uct a synthetic EV mobility dat aset from empirical taxi trajectories to preserve realistic spatio-temporal tra vel patter ns while enabling the anal ysis of EV ener gy trading. In this dataset, some entr ies in t he trip distance attribute were missing. To address this issue, we applied a two-stage imputation strategy . First, we used the Ha versine f or mula [ 49 ] to estimate trav el distances betw een pickup and drop-off locations based on t heir g eographic coordinates. Second, f or jour ne ys where coordinate-based distance estimation w as una vailable, we computed an av erage fare-per -kilometer rate from completed tr ips and used t his rate to estimate missing distances based on the corresponding fare values. This preprocessing step ensured consistency and completeness of distance-related f eatures required f or subseq uent mobility and char ging analysis. As a second empirical data source, we incorporate EV model datasets containing model names, battery capacities, and total dr iving range attributes, which are integrated with the pre viously described taxi mobility data to map each taxi jour ne y to EV -specific characteristics. Each taxi ID is first mapped to a unique EV ID, ensuring t hat all journey s : Preprint submitted to Elsevier P age 10 of 33 T able 2 Summa ry of Dataset A ttributes for EV–EV energy trading Field T ype Static/dynamic Description EV journey ID String D Unique identifier for each journey EV ID String S Unique identifier for each EV EV Mo del name String S An integer from 1 to 9 representing the EV mo del type allows easy vehicle category identification Battery capacity int64 S Rep resents the maximum energy storage capacit y of the EV’s battery , measured in w att- hours (Wh), indicating the total energy the battery can store. Battery range int64 D Represent the maximum distance the EV can travel on a full charge, measured in kilometers. This value is reduced after every fare (trip) based on the km covered in the journey . Community area ID int64 S An integer betw een 1 and 77, where each ID rep resents a designated community a rea in Chicago. Each community area is a geographic unit. Journey start and end time Timestamp D Represent the sta rt and end timestamps of each journey , used to track trip duration and temporal patterns. Time at lo cations Timestamp D Represents specific timestamps when an EV arrives at or departs from key locations, including nearby charging stations, pickup/drop-off points, and intermediate travel stops. EV journey loca- tions String D Represents spatio-temp o ral journey p oints, including source, destination, and interme- diate lo cations where EVs may stop, detour, trade, idle, or engage in travel interactions (trading, driving). T raveled distance int64 D Represents the distance covered by the EV during a journey , measured in kilometers. Battery energy level int64 D This feature rep resents the state of charge (SOC) of the EV’s battery at va rious p oints in a sp ecific time during the journey , measured in watt-hours (Wh). This is the most salient feature for understanding energy consumption, their role as a provider and consumer, estimating the expected energy exchange for trading, and analyzing the driver trading behavior. Energy consumption per journey int64 D The total energy utilized by an EV for completing a single journey . This field is critical for understanding energy needs and planning trading opportunities. Candidate cha rging stations for trading int64 D A set of nearb y charging stations identified as potential lo cations for energy trading. These stations are selected based on their proximit y to the EV’s journey path and are integrated into the driver’s travel itinerary . Distance to charging stations int64 D The spatial distance from an EV’s current lo cation to each candidate charging station. This metric impacts decisions regarding the feasibility and efficiency of visiting a station for energy trading. Charging sp eed of charging stations int64 D The cha rging rate related to candidate cha rging stations at which a charging station can transfer energy to o r from an EV, influencing the duration of trading sessions. Historical density of EVs at cha rging lo- cations int64 D Analogous to the concept of Google popular times at charging lo cations, this metric reflects the historical availability of EVs at specific charging lo cations over time fo r energy trading. The purp ose of Go ogle p opular times is to provide users with insights about how busy a place is at different times of the day and week. This spatial context information uses aggregated and anonymized lo cation data from users to estimate crowd levels at charging locations. In terms of energy implications, this information helps drivers make informed decisions ab out whether visiting a specific cha rging location is w orthwhile for their needs. At cha rging nodes, popularity reflects the relative level of human and vehicular activity around a station at a given time, and is used as a pro xy for the likelihoo d of encountering p otential trading partners. T rading role String D The dynamic role of an EV in energy trading, categorized as either a provider or a consumer. This attribute is crucial, as it enables the identification of trading dynamics (provider o r consumer) at charging locations and helps optimize energy supply and demand management. T rading Volume int64 D The amount of expected energy by p roviders and consumers in trading interaction, expressed in w att-hours (Wh). associated with a given taxi cor respond to the same EV . Subsequentl y , EV IDs are randomly assigned to one of nine EV models using a unif or m distribution o ver model types and their cor responding attr ibutes. This random assignment assumes that eac h EV model is represented by a sufficiently larg e training sample, as illustrated in Figures 2 and 3 . As a result, the assignment process remains unbiased. The ener gy levels at the source and destination are dynamically generated based on the EV’ s initial battery state and the energy consumed dur ing the journey . The initial batter y energy lev el for each EV w as determined using a uniform distribution betw een 20% and 100% of its maximum battery capacity . This method ensures that each EV’ s starting energy level is randomly distr ibuted across the specified range, reflecting realistic variations in t he state of : Preprint submitted to Elsevier P age 11 of 33 Figure 2: Distribution of trips p er EV model shown as a bar plot, o rdered from most to least frequent mo del. Figure 3: Distribution of unique EVs p er mo del (distinct EV IDs), ordered by mo del frequency . char ge. Dur ing the simulation, energy consumption for each jour ne y is calculated based on t he distance trav eled and the standard EV model’ s energy consumption rate. Af ter completing a journey , the destination energy lev el is determined by subtracting the energy consumed from the initial energy lev el. Additionally , when an EV’s energy lev el drops below a predefined t hreshold (20% of its battery capacity), a rec harging event is synthetically generated f ollowing t he c harg e- f eature construction procedure of Marlin et al. [ 30 ]. Specifically , the battery char ge le vel is decremented according to the distance tra veled and an ener gy-per -kilometer consumption rate, and once t he 20% threshold is reac hed, the batter y is assumed to be recharg ed to full capacity before the vehicle continues its subsequent jour ne y segment. This recharging process is used only to maintain realistic energy f easibility in the synthetic EV mobility data and does not represent a modeled char ging location or char ging decision. Accordingl y , the location of this synthetic recharging ev ent is not explicitl y modeled and is independent of the char ging node recommendation problem studied in this study . Figure 4 is included to illustrate t he underlying data distr ibution, showing how the number of EVs at different energy lev els varies across time window s, which is relev ant for understanding energy-dependent charging beha vior and informing energy -aw are char ging node recommendation. Integration of c harging station data, including the distance from each EV’ s location, is a crucial step in identifying suitable charging options. W e collected charging station information for t he same geographic region as the t axi mobility : Preprint submitted to Elsevier P age 12 of 33 (a) (b) (c) (d) Figure 4: Spatial distribution of EV lo cations by energy level (20–40%, 40–60%, 60–80%, 80–100%) fo r 30-minute windows, high p eak (08:30, 17:30) and off-p eak (06:00, 22:00) p erio ds; legends rep o rt p er energy level counts. data using multiple APIs. The primar y data sources include Google Maps ( https://www.google.com/maps ), EV Charg er Finder ( https://ev- charger- finder.p.rapidapi.com/ ), and the City of Chicago Open Data P ortal ( https://data.cityofchicago.org/ ). T o identify nearby candidate stations efficiently f or each dr iver ’ s jour ney , we dev eloped an adaptive searc h procedure presented in Algorithm 1 . The algorithm dynamically expands the searc h radius–from 1 km up to 10 km–until at least three charging stations are f ound for eac h location along the EV’ s jour ne y route. The proximity between each EV location and station is calculated using t he Hav ersine dis tance f or mula [ 40 , 49 ]. The distance calculation is shown in Eq. ( 9 ). Let ( 𝜙 1 , 𝜆 1 ) and ( 𝜙 2 , 𝜆 2 ) denote t he latitude and longitude (in radians) of an EV location and a charging point, respectiv ely , and let 𝑅 be the Earth’ s mean radius (approximatel y 6371 km). The Ha versine distance 𝑑 betw een t he two points is computed as: Δ 𝜙 = 𝜙 2 − 𝜙 1 , Δ 𝜆 = 𝜆 2 − 𝜆 1 , 𝑎 = sin 2 Δ 𝜙 2 + cos( 𝜙 1 ) cos( 𝜙 2 ) sin 2 Δ 𝜆 2 , 𝑑 = 2 𝑅 ar ct an 2 𝑎, 1 − 𝑎 . (9) Here, 𝑑 represents the great-circle distance between the EV and the char ging point along the Eart h ’ s surface. This adaptive and data-dr iv en approac h ensures comprehensive cov erage across dense and sparse urban regions, ultimately : Preprint submitted to Elsevier P age 13 of 33 producing an enr iched dataset t hat links e very journey with its set of candidate char ging locations and cor responding distances. After integ rating these candidate stations into the EV journey dataset, we further enr iched the data with key station attr ibutes, such as the popularity index of char ging locations over time and the c harging speed of each station. Algorit hm 2 assigns a trading role (pro vider or consumer) and a corresponding energy quantity to each EV jour ney based on its energy condition. Building on the previously defined battery capacity 𝐵 𝑒 𝑖 𝑐 and av ailable sur plus energy 𝐸 sur 𝑒 𝑖 ( 𝑡 ) (computed according to Eq. 4 ), we der iv e a scale-inv ar iant measure of trading potential by nor malizing the surplus energy wit h respect to the EV’s own batter y capacity: 𝑟 = min 1 , 𝐸 sur 𝑒 𝑖 ( 𝑡 )) 𝐵 𝑒 𝑖 𝑐 . (10) This ratio 𝑟 ∈ [0 , 1] represents the por tion of the EV’ s batter y capacity t hat can be saf ely traded without violating the minimum operational state-of-charg e (SoC) required for t he EV to complete its own trip. Impor tantly , this nor malization is self-referential, meaning that the ratio is computed relativ e to the same EV’ s capacity rat her than another vehicle ’ s capacity . Consequentl y , 𝑟 captures relativ e sur plus a vailability independent of absolute battery size differences across EV models. The trading role 𝑅 𝑗 ∈ {P , C} is then assigned according to the f ollowing piece wise probabilistic rule: 𝑅 𝑗 = C , 0 ≤ 𝑟 ≤ 0 . 30 , P with probability 𝑝 mid , C otherwise , 0 . 30 < 𝑟 ≤ 0 . 70 , P with probability 𝑝 high , C otherwise , 0 . 70 < 𝑟 ≤ 0 . 90 , P , 𝑟 > 0 . 90 . (11) For inter mediate surplus ranges, role assignment is probabilistic. Specificall y , a binar y random variable 𝑋 is gener ated such that: ℙ ( 𝑋 = 1) = 𝑝, ℙ ( 𝑋 = 0) = 1 − 𝑝, Where 𝑋 = 1 corresponds to assigning t he role P (provider) and 𝑋 = 0 cor responds to assigning t he role C (consumer). The probability parameter 𝑝 takes the v alue 𝑝 mid or 𝑝 high depending on the sur plus band. The probabilistic assignment in inter mediate regions models EV dr iv er behavior al uncer tainty: although sufficient sur plus exists, willingness to trade ma y depend on contextual or pref erence-related f actors not explicitl y observed in the dataset. After determining t he jour ney -lev el role 𝑅 𝑗 , t he cor responding energy q uantity 𝑄 𝑗 is computed in a role-dependent manner . Specificall y , 𝑄 𝑗 = max{0 , 𝐸 sur 𝑒 𝑖 ( 𝑡 )} , if 𝑅 𝑗 = P , 𝐸 cons 𝑒 𝑖 ( 𝑡 ) , if 𝑅 𝑗 = C . (12) For provider EVs, trades belo w t he minimum threshold 𝐸 t r ade min are suppressed to a v oid negligible energy ex chang es, i.e., 𝑄 𝑗 = 0 if 𝑅 𝑗 = P and 𝑄 𝑗 < 𝐸 t r ade min . (13) Finall y , the trading role 𝑅 𝑗 and quantity 𝑄 𝑗 are replicated across all 𝐿 timestamps of the jour ney to produce time-aligned lists used in t he EV –EV trading simulation. : Preprint submitted to Elsevier P age 14 of 33 Algorithm 1: Finding Adaptiv e Nearb y Candidate Charging Locations for Each EV Journey Input: 𝑑 𝑓 _ 𝑗 𝑜𝑢𝑟𝑛𝑒𝑦 : DataFrame of EV journeys with locations, 𝑑 𝑓 _ 𝑠𝑡𝑎𝑡𝑖𝑜𝑛 : Dat aFrame of charging stations with latitude, longitude, and station IDs Output: Updated 𝑑 𝑓 _ 𝑗 𝑜𝑢𝑟𝑛𝑒𝑦 : DataFrame with nearby charging stations and distances 1 Load jour ney data 𝑑 𝑓 _ 𝑗 𝑜𝑢𝑟𝑛𝑒𝑦 and charging station dat a 𝑑 𝑓 _ 𝑠𝑡𝑎𝑡𝑖𝑜𝑛 ; 2 Initialize empty lists: 𝑛𝑒𝑎𝑟𝑏𝑦 _ 𝑠𝑡𝑎𝑡𝑖𝑜𝑛𝑠 _ 𝑙𝑖𝑠𝑡, 𝑑 𝑖𝑠𝑡𝑎𝑛𝑐 𝑒𝑠 _ 𝑙 𝑖𝑠𝑡 ; 3 foreach 𝑒𝑣 _ 𝑟𝑜𝑢𝑡𝑒 in 𝑑 𝑓 _ 𝑗𝑜𝑢𝑟𝑛𝑒𝑦 do 4 Conv er t route string to a list of tuples ( 𝑙 𝑎𝑡𝑖𝑡𝑢𝑑 𝑒, 𝑙𝑜𝑛𝑔 𝑖𝑡𝑢𝑑 𝑒 ) ; 5 Initialize empty lists: 𝑟𝑜𝑢𝑡𝑒 _ 𝑛𝑒𝑎𝑟𝑏𝑦 _ 𝑠𝑡𝑎𝑡𝑖𝑜𝑛𝑠 , 𝑟𝑜𝑢𝑡𝑒 _ 𝑑 𝑖𝑠𝑡𝑎𝑛𝑐 𝑒𝑠 ; 6 foreach 𝑒𝑣 _ 𝑙𝑜𝑐 𝑎𝑡𝑖𝑜𝑛 in 𝑒𝑣 _ 𝑟𝑜𝑢𝑡𝑒 do 7 𝑠𝑒𝑎𝑟𝑐 ℎ _ 𝑟𝑎𝑑 𝑖𝑢𝑠 ← 1 , 𝑚𝑖𝑛 _ 𝑠𝑡𝑎𝑡𝑖𝑜𝑛𝑠 = 3 ; 8 while 𝑠𝑒𝑎𝑟𝑐 ℎ _ 𝑟𝑎𝑑 𝑖𝑢𝑠 ≤ 10 do 9 Initialize empty lists: 𝑛𝑒𝑎𝑟𝑏𝑦 _ 𝑠𝑡𝑎𝑡𝑖𝑜𝑛𝑠, 𝑑 𝑖𝑠𝑡𝑎𝑛𝑐 𝑒𝑠 ; 10 foreach station in 𝑑 𝑓 _ 𝑠𝑡𝑎𝑡𝑖𝑜𝑛 do 11 Compute Haversine distance 𝑑 between 𝑒𝑣 _ 𝑙 𝑜𝑐 𝑎𝑡𝑖𝑜𝑛 and 𝑠𝑡𝑎𝑡𝑖𝑜𝑛 [ ′ 𝑠𝑡𝑎𝑡𝑖𝑜𝑛 _ 𝑙𝑜𝑐 𝑎𝑡𝑖𝑜𝑛 ′ ] ; 12 if 𝑑 ≤ 𝑠𝑒𝑎𝑟𝑐 ℎ _ 𝑟𝑎𝑑 𝑖𝑢𝑠 then 13 Append ( 𝑠𝑡𝑎𝑡𝑖𝑜𝑛 _ 𝑖𝑑 , 𝑑 ) to respective lists; 14 Remo ve duplicates and ensure at least 3 stations are found; 15 if 𝑛𝑒𝑎𝑟𝑏𝑦 _ 𝑠𝑡𝑎𝑡𝑖𝑜𝑛𝑠 ≥ 𝑚𝑖𝑛 _ 𝑠𝑡𝑎𝑡𝑖𝑜𝑛 _ 𝑐 𝑜𝑢𝑛𝑡 then 16 break ; 17 else 18 Increase search radius: 𝑠𝑒𝑎𝑟𝑐 ℎ _ 𝑟𝑎𝑑 𝑖𝑢𝑠 ← 𝑠𝑒𝑎𝑟𝑐 ℎ _ 𝑟𝑎𝑑 𝑖𝑢𝑠 + 1 ; 19 Append ( 𝑛𝑒𝑎𝑟𝑏𝑦 _ 𝑠𝑡𝑎𝑡𝑖𝑜𝑛𝑠, 𝑑 𝑖𝑠𝑡𝑎𝑛𝑐 𝑒𝑠 ) to 𝑟𝑜𝑢𝑡𝑒 _ 𝑛𝑒𝑎𝑟𝑏𝑦 _ 𝑠𝑡𝑎𝑡𝑖𝑜𝑛𝑠 , 𝑟𝑜𝑢𝑡𝑒 _ 𝑑 𝑖𝑠𝑡𝑎𝑛𝑐 𝑒𝑠 lists; 20 Append ( 𝑟𝑜𝑢𝑡𝑒 _ 𝑛𝑒𝑎𝑟𝑏𝑦 _ 𝑠𝑡𝑎𝑡𝑖𝑜𝑛𝑠 , 𝑟𝑜𝑢𝑡𝑒 _ 𝑑 𝑖𝑠𝑡𝑎𝑛𝑐𝑒𝑠 ) to 𝑛𝑒𝑎𝑟𝑏𝑦 _ 𝑠𝑡𝑎𝑡𝑖𝑜𝑛𝑠 _ 𝑙𝑖𝑠𝑡, 𝑑 𝑖𝑠𝑡𝑎𝑛𝑐 𝑒𝑠 _ 𝑙 𝑖𝑠𝑡 ; 21 Assign 𝑛𝑒𝑎𝑟𝑏𝑦 _ 𝑠𝑡𝑎𝑡𝑖𝑜𝑛𝑠 _ 𝑙 𝑖𝑠𝑡 to 𝑑 𝑓 _ 𝑗𝑜𝑢𝑟𝑛𝑒𝑦 [’ 𝑐 𝑎𝑛𝑑 𝑖𝑑 𝑎𝑡𝑒 _ 𝑐ℎ𝑎𝑟𝑔 𝑖𝑛𝑔 _ 𝑠𝑡𝑎𝑡𝑖𝑜𝑛𝑠 ’] and 𝑑 𝑖𝑠𝑡𝑎𝑛𝑐𝑒𝑠 _ 𝑙 𝑖𝑠𝑡 to 𝑑 𝑓 _ 𝑗𝑜𝑢𝑟𝑛𝑒𝑦 [’ 𝑑 𝑖𝑠𝑡𝑎𝑛𝑐𝑒 _ 𝑡𝑜 _ 𝑐 𝑠 ’]; 22 Sav e 𝑑 𝑓 _ 𝑗 𝑜𝑢𝑟𝑛𝑒𝑦 as CSV ; 23 return 𝑑 𝑓 _ 𝑗 𝑜𝑢𝑟𝑛𝑒𝑦 ; Algorithm 2: Per-Journey Role Assignment (Pro vider and Consumer) and Energy V olume Input: Dat aset with columns: battery_energy_level (list, Wh), battery_capacity (Wh), time_at_locations (list) Input: 𝐸 t rade min =10000 (Wh), 𝑝 mid =0 . 50 , 𝑝 high =0 . 80 Output: Dataset ′ with roles (list) and quantity_of_energy (list) 1 Parse list-type columns from strings to lists; 2 Optionally set a NumPy seed for reproducibility; 3 Initialize ′ ← ∅ ; 4 foreach jour ney 𝑗 in do 5 𝐵 ← battery_capacity [ 𝑗 ] ; 6 ← time_at_locations [ 𝑗 ] ; 7 𝐿 ← ; 8 Step 1: Compute self-nor malized surplus ratio 9 𝐸 sur 𝑒 𝑖 ( 𝑡 ) ← av ailable sur plus energy using Eq. ( 4 ); 10 𝑟 ← min{1 , 𝐸 sur 𝑒 𝑖 ( 𝑡 )∕ 𝐵 𝑒 𝑖 𝑐 } ; 11 Step 2: Role assignment 12 if 0 ≤ 𝑟 ≤ 0 . 30 then 13 𝑅 𝑗 ← ‘C’; 14 else if 0 . 30 < 𝑟 ≤ 0 . 70 then 15 𝑅 𝑗 ← binomial (1 , 𝑝 mid )? ‘P’ ∶ ‘C’; 16 else if 0 . 70 < 𝑟 ≤ 0 . 90 then 17 𝑅 𝑗 ← binomial (1 , 𝑝 high )? ‘P’ ∶ ‘C’; 18 else 19 𝑅 𝑗 ← ‘P’; 20 Step 3: Quantity assignment 21 𝐸 cons 𝑗 ( 𝑡 ) ← consumer requirement using Eq. ( 5 ); 22 if 𝑅 𝑗 = ‘P’ then 23 𝑄 𝑗 ← max{0 , 𝐸 sur 𝑗 ( 𝑡 )} ; 24 if 𝑄 𝑗 < 𝐸 t rade min then 25 𝑄 𝑗 ← 0 ; 26 else 27 𝑄 𝑗 ← 𝐸 cons 𝑗 ( 𝑡 ) ; 28 Step 4: Broadcast to timestamps 29 roles [ 𝑗 ] ← [ 𝑅 𝑗 ] × 𝐿 ; 30 quantity_of_energy [ 𝑗 ] ← [ round ( 𝑄 𝑗 , 2)] × 𝐿 ; 31 Add updated journey 𝑗 to ′ ; 32 Sav e ′ to CSV ; : Preprint submitted to Elsevier P age 15 of 33 NextTrade- EV Datasets (Unlabelled) NextTrade- EV Datasets (labelled) Multi-Criteria Suitability Evaluation Station Score Labelled Datasets Energy level, distance, charging speeed, popularity , trading role Fuzzy TOPSIS Suitability Station Score EM-Based Probabilistic Refinement Soft and Graded Relevance for Station Unlabelled Datasets Decision Criteria Extraction Probabilistic method Soft and Graded Relevance Generation Figure 5: Lab el generation pip eline. Unlab eled EV decision events from the NextT rade-EV dataset are first evaluated using fuzzy TOPSIS to compute multi-criteria station suitability sco res. These sco res a re subsequently refined through EM-based p robabilistic mo deling to capture latent contextual uncertainty . The resulting soft relevance scores are discretized into graded relevance lab els, yielding a weakly lab eled dataset suitable for learning-to-rank without requiring observed station selection data. 6.3. Label selection In t he prediction model, we consider candidate charging stations as the possible charging locations f or EV – EV energy trading. For the pur pose of the training, the model requires both positiv e and neg ativ e samples as labels (relevance grades) [ 43 , 23 , 9 , 35 ]. Howe ver , explicit EV–EV trading selections for char ging nodes are not directly observable in historical mobility data. Rele vance labels are constr ucted probabilistically to reflect the relativ e plausibility of charging nodes being considered f or energy trading under the observed mobility and energy conte xt. Figure 5 presents the o verall label generation pipeline. W e appl y the f ollowing steps for label construction. 6.3.1. Fuzzy-weighted TOPSIS for st ation suitability estimation At each decision ev ent 𝑒 , cor responding to an EVs at time 𝑡 , a finite set of candidate charging stations 𝑒 is a vailable af ter geographic filter ing. In EV –EV energy trading, station selection is conditioned on the EV’ s trading role: consumer EVs prior itize reliable energy acquisition, while supplier EVs aim to efficiently transfer sur plus ener gy . These asymmetric objectives, toge ther with uncert ainty in operational conditions, motivate a multi-criter ia decision f or mulation under imprecision. Accordingly , we model st ation ev aluation as a fuzzy multi-criter ia decision-making (MCDM) problem and employ a fuzzy-w eighted TOPSIS (T echnique for Order Preference by Similarity to Ideal Solution) approac h to compute a suitability score f or each candidate station. TOPSIS rank s alter natives by evaluating their geometric pro ximity to an ideal solution and their distance from the worst-case solution in a multi-criter ia space. In our formulation, fuzziness is applied to the im portance weights of the decision criteria , rather than to the numerical values of WCP attributes. WCP attributes cor respond to physicall y measurable and operational quantities such as geographic distance (km), charging or discharging rate (kW), and a vailability (percent age) are treated as deterministic. Fuzziness is instead used to model uncertainty in the relativ e impor tance of t hese cr iteria, which may vary across EV roles, energy urg ency , and changing energy lev el. At each decision ev ent 𝑒 , corresponding to an EV at time 𝑡 , a finite set of candidate char ging points (CPs), denoted by 𝑒 , is av ailable after g eographic filtering. In EV –EV energy trading, CP selection is conditioned on t he EV’ s trading role: consumer EVs prior itize reliable energy acquisition, while supplier EVs aim to efficiently transfer sur plus ener gy . These asymmetric objectives, together with uncer tainty in operational conditions and dr iv er pref erences, motivate a multi-criter ia decision formulation under imprecision. Accordingl y , we model CP evaluation as a fuzzy multi-cr iteria decision-making (MCDM) problem and employ a fuzzy-weighted TOPSIS (Tec hnique for Order Pref erence by Similar ity to Ideal Solution) approach to compute a suitability score f or each candidate CP . TOPSIS ranks alter nativ es by evaluating t heir geometric proximity to an ideal solution and t heir distance from a worst-case solution in a multi-cr iteria space. In our f or mulation, fuzziness is applied exclusiv ely to the impor tance weights of decision cr iteria , rather t han to the numer ical values of CP attributes (e.g., distance, charging rate, or av ailability). This design choice captures uncert ainty in decision prior ities while maint aining deter ministic and comparable attr ibute values, thereby a voiding distortion of physical quantities and ensuring numerical stability in the TOPSIS distance calculations. Evaluation criteria: Each candidate station 𝑗 ∈ 𝑒 is c haracterized using the follo wing cr iter ia: • Distance 𝑑 𝑒,𝑗 (cost cr iterion), representing the trav el effor t required to reach the station at time 𝑡 . • Charging speed / transf er capacity 𝑠 𝑒,𝑗 (benefit criterion), captur ing t he potential transaction t hroughput. • P opularity / availability 𝑎 𝑒,𝑗 (benefit cr iterion), indicating t he likelihood of successful access or matching at time 𝑡 . : Preprint submitted to Elsevier P age 16 of 33 These criter ia jointly capture spatial, temporal, and mark et-le vel factors rele vant to station suitability in EV –EV energy trading. Event-wise normalization and cost–benefit con version: Because each decision event has its own candidate set, all criteria are normalized within eac h event . For benefit-type cr iteria 𝑥 ∈ { 𝑠, 𝑎 } , min–max nor malization is applied: 𝑥 nor m 𝑒,𝑗 = 𝑥 𝑒,𝑗 − min 𝑘 ∈ 𝑒 𝑥 𝑒,𝑘 max 𝑘 ∈ 𝑒 𝑥 𝑒,𝑘 − min 𝑘 ∈ 𝑒 𝑥 𝑒,𝑘 + 𝜖 . (14) Distance is a cost criter ion and is conv er ted into a benefit-type measure via min–max normalization f ollowed by in v ersion: 𝑑 nor m 𝑒,𝑗 = 1 − 𝑑 𝑒,𝑗 − min 𝑘 ∈ 𝑒 𝑑 𝑒,𝑘 max 𝑘 ∈ 𝑒 𝑑 𝑒,𝑘 − min 𝑘 ∈ 𝑒 𝑑 𝑒,𝑘 + 𝜖 . (15) Here, 𝜖 is a small positiv e constant introduced to av oid degenerate cases when all candidates exhibit identical values f or a criter ion, in whic h case the criter ion becomes non-discriminative wit hin the event. If max 𝑘 ∈ 𝑒 𝑥 𝑒,𝑘 = min 𝑘 ∈ 𝑒 𝑥 𝑒,𝑘 f or any criter ion 𝑥 ∈ { 𝑑 , 𝑠, 𝑎 } , we set t he cor responding normalized v alues to 𝑥 nor m 𝑒,𝑗 = 0 . 5 f or all 𝑗 ∈ 𝑒 , render ing that criter ion non-discr iminative f or event 𝑒 . Af ter transformation, all nor malized cr iteria lie in [0 , 1] , with higher values indicating better performance. T rading transaction pressure: To encode role-dependent urgency in EV –EV trading, we define a transaction pressure variable 𝑝 𝑒 ∈ [0 , 1] based on the EV’ s state-of-char ge (SOC): SOC 𝑒 = clip 𝐸 𝑒 𝐶 𝑎𝑝 𝑒 , 0 , 1 , (16) 𝑝 𝑒 = 1 − SOC 𝑒 , consumer EV , SOC 𝑒 , supplier EV (17) This f or mulation captures minimal, domain-consistent constraints: consumers e xhibit increasing urgency as SOC decreases, suppliers exhibit increasing propensity to trade as SOC increases. This pressure variable 𝑝 𝑒 captures contextual urgency rather t han estimated preference or obser v ed beha vior and is used only to modulate cr iterion import ance. Fuzzy weighting of criteria: Criterion import ance under EV –EV trading is uncert ain and v ar ies with the operational context. W e represent criter ion impor tance using tr iangular fuzzy numbers (TFNs) cor responding to three ordinal levels: High = (0 . 7 , 0 . 9 , 1 . 0) , (18) Medium = (0 . 3 , 0 . 5 , 0 . 7) , (19) Low = (0 . 1 , 0 . 3 , 0 . 5) . (20) The ov erlap among the triangular fuzzy numbers is intentional and reflects gradual transitions between linguistic import ance lev els, which is a standard practice in fuzzy MCDM to model uncer tainty and a v oid brittle decision boundaries. These fuzzy representations encode bounded uncert ainty while preser ving monotonic dominance (High > Medium > Low). Three fuzzy pressure regimes 𝑔 ∈ { low , med , high } are defined ov er t he transaction pressure variable 𝑝 𝑒 using standard tr iangular membership functions, which assign membership degrees 𝜇 𝑔 ( 𝑝 𝑒 ) ∈ [0 , 1] . Specifically , the lo w , medium, and high pressure regimes are defined by the triangular functions (0 , 0 , 0 . 5) , (0 . 25 , 0 . 5 , 0 . 75) , and (0 . 5 , 1 , 1) , respectiv ely . For each EV role 𝜌 ( 𝑒 ) ∈ { consumer , supplier } , w e specify defuzzified regime-lev el criter ion importance profiles 𝑤 𝜌,𝑔 ,𝑐 f or 𝑐 ∈ { 𝑑 , 𝑠, 𝑎 } (dist ance, speed, a vailability), reflecting domain-consistent pr iorities under different pressure regimes. The triangular fuzzy number associated with linguistic importance levels is defuzzified b y taking its centroid, resulting in a single relative numerical impor tance w eight (a cr isp regime-level weight). : Preprint submitted to Elsevier P age 17 of 33 The regime-le vel w eights 𝑤 𝜌,𝑔 ,𝑐 are normalized importance propor tions deriv ed from defuzzified linguistic prior ities, constructed to preserve relative dominance and monotonic shif ts across pressure regimes rather than computed t hrough an analytic formula. Event-specific criter ion weights 𝑤 𝑒,𝑐 are obtained by membership-weighted inter polation of the regime-lev el weights and subsequent nor malization: 𝑤 𝑒,𝑐 = 𝑔 𝜇 𝑔 ( 𝑝 𝑒 ) 𝑤 𝜌 ( 𝑒 ) ,𝑔 ,𝑐 𝑐 ′ ∈{ 𝑑 ,𝑠,𝑎 } 𝑔 𝜇 𝑔 ( 𝑝 𝑒 ) 𝑤 𝜌 ( 𝑒 ) ,𝑔 ,𝑐 ′ , 𝑐 𝑤 𝑒,𝑐 = 1 . (21) TOPSIS scoring via g eometric proximity: Let 𝑥 nor m 𝑒,𝑗 ,𝑐 denote the nor malized value of criter ion 𝑐 ∈ { 𝑑 , 𝑠, 𝑎 } . The weighted nor malized represent ation is given by: 𝑣 𝑒,𝑗 ,𝑐 = 𝑤 𝑒,𝑐 𝑥 nor m 𝑒,𝑗 ,𝑐 . (22) Since all cr iteria are benefit-type after conv ersion, the positiv e and negativ e ideal solutions are defined as: 𝑣 + 𝑒,𝑐 = max 𝑗 ∈ 𝑒 𝑣 𝑒,𝑗 ,𝑐 , 𝑣 − 𝑒,𝑐 = min 𝑗 ∈ 𝑒 𝑣 𝑒,𝑗 ,𝑐 . (23) The Euclidean distances to the ideal and anti-ideal solutions are: 𝐷 + 𝑒,𝑗 = 𝑐 𝑣 𝑒,𝑗 ,𝑐 − 𝑣 + 𝑒,𝑐 2 , (24) 𝐷 − 𝑒,𝑗 = 𝑐 𝑣 𝑒,𝑗 ,𝑐 − 𝑣 − 𝑒,𝑐 2 . (25) The station suit ability score is computed using the TOPSIS closeness coefficient: 𝑟 𝑒,𝑗 = 𝐷 − 𝑒,𝑗 𝐷 + 𝑒,𝑗 + 𝐷 − 𝑒,𝑗 , 𝑟 𝑒,𝑗 ∈ [0 , 1] . (26) A higher value of 𝑟 𝑒,𝑗 indicates that t he station is closer to the ideal multi-criter ia compromise and farther from the worst-case alter native. These scores serve as a decision prior and are subsequentl y refined through probabilistic smoothing and super vised lear ning-to-rank in later stages. 6.3.2. EM-based probabilistic smoothing of st ation suitability Let 𝑒 denote an EV decision ev ent and 𝑒 the cor responding set of candidate char ging or trading stations. The fuzzy-w eighted TOPSIS method calculates a deterministic suitability score 𝑟 𝑒,𝑗 ∈ [0 , 1] for each candidate 𝑗 ∈ 𝑒 . While some decision events exhibit a clearly dominant station, many EV–EV energy trading scenarios inv olve dense infrastructure, competition among providers, or role-dependent urgency asymmetr ies betw een consumers and suppliers, leading to multiple stations with comparable suit ability scores. Moreov er, t he dataset does not provide observed station selection labels. To account f or such ambiguity and impro ve robustness, we apply a probabilistic smoothing stag e based on the Expectation–Maximization (EM) algor ithm. Observed dat a and scope: The EM model operates e x clusivel y on the suitability scores { 𝑟 𝑒,𝑗 } produced t hrough fuzzy TOPSIS. It does no t directly use the or iginal dataset features, which are implicitly encoded in 𝑟 𝑒,𝑗 . This separation a voids double-counting and preserves modular ity betw een heuristic decision modeling and probabilistic refinement. Latent regime formulation: W e assume that station suitability scores arise from a small number of unobserved but recurr ing contextual patter ns, ref er red to as latent regimes . These regimes do not represent dr iv er types or beha vioral classes; rather, they capture distinct EV –EV energy trading contexts as reflected in the distributional shape of suitability scores (e.g., shar pl y peaked distributions indicating clear dominance among candidates versus flatter distr ibutions indicating high decision ambiguity). Formally , t he marginal distribution of suit ability scores is modeled as a finite mixture: 𝑝 ( 𝑟 𝑒,𝑗 ) = 𝐾 𝑘 =1 𝜋 𝑘 𝑝 ( 𝑟 𝑒,𝑗 ∣ 𝑧 𝑒,𝑗 = 𝑘 ) , (27) : Preprint submitted to Elsevier P age 18 of 33 where 𝑧 𝑒,𝑗 is a latent regime indicator and 𝜋 𝑘 denotes the mixture weight, with 𝐾 𝑘 =1 𝜋 𝑘 = 1 . The latent regimes are shared across all decision ev ents and capture recurr ing distr ibutional patter ns in station suit ability scores rather t han ev ent-specific or driver -specific states. Likelihood model: Since 𝑟 𝑒,𝑗 ∈ [0 , 1] , eac h latent regime is modeled using a Bet a distr ibution: 𝑝 ( 𝑟 𝑒,𝑗 ∣ 𝑧 𝑒,𝑗 = 𝑘 ) = Bet a( 𝑟 𝑒,𝑗 ∣ 𝛼 𝑘 , 𝛽 𝑘 ) , (28) The Beta distribution is employ ed because station suitability scores are continuous and bounded in [0 , 1] , and its flexible shape allo ws representation of both decisiv e and ambiguous trading contexts. EM estimation: Given cur rent parameter estimates { 𝜋 𝑘 , 𝛼 𝑘 , 𝛽 𝑘 } , the E-step computes poster ior responsibilities: 𝛾 𝑒,𝑗 ,𝑘 = 𝜋 𝑘 Bet a( 𝑟 𝑒,𝑗 ∣ 𝛼 𝑘 , 𝛽 𝑘 ) 𝐾 𝓁 =1 𝜋 𝓁 Bet a( 𝑟 𝑒,𝑗 ∣ 𝛼 𝓁 , 𝛽 𝓁 ) . (29) In the M-step, mixture weights are updated as 𝜋 𝑘 = 1 𝑁 𝑒 𝑗 ∈ 𝑒 𝛾 𝑒,𝑗 ,𝑘 , (30) where 𝑁 = 𝑒 𝑒 is the total number of ev ent–station pairs. The Beta parameters ( 𝛼 𝑘 , 𝛽 𝑘 ) are updated by maximizing the expected complete-data log-likelihood. The number of regimes 𝐾 is selected from a small rang e (e.g., 2 ≤ 𝐾 ≤ 5 ) to balance expressiv eness and stability . Smoothed suit ability estimation: Each latent regime 𝑘 is associated with an expected suitability le vel given by the mean of its Beta distr ibution: 𝜇 𝑘 = 𝔼 [ 𝑟 ∣ 𝑧 = 𝑘 ] = 𝛼 𝑘 𝛼 𝑘 + 𝛽 𝑘 . (31) For each e vent–station pair ( 𝑒, 𝑗 ) , we compute a smoothed suitability score as t he responsibility -weighted e xpect ation: 𝑟 𝑒,𝑗 = 𝐾 𝑘 =1 𝛾 𝑒,𝑗 ,𝑘 𝜇 𝑘 . (32) Event-le vel soft relev ance: For each ev ent 𝑒 , the smoothed suitability scores are normalized across the candidate set to obtain a soft relevance distribution: 𝑃 𝑒,𝑗 = 𝑟 𝑒,𝑗 𝑗 ′ ∈ 𝑒 𝑟 𝑒,𝑗 ′ , 𝑗 ∈ 𝑒 𝑃 𝑒,𝑗 = 1 . (33) The v alues 𝑃 𝑒,𝑗 quantify relative plausibility under uncer tainty and do not represent obser ved station c hoice probabil- ities. EM is emplo yed solely as a probabilistic smoothing mechanism. It does not model driver behavior or explicit marke t dynamics and does not rely on observed station selection labels. Graded relevance generation: The e vent-le vel sof t relevance scores 𝑃 𝑒,𝑗 produced in EM smoothing capture un- cert ainty in station suitability . How ev er, most lear ning-to-rank algorithms req uire discrete rele vance labels. Moreov er, enf orcing a single cor rect station per ev ent is unrealistic in EV –EV energy trading, where multiple candidate stations ma y be simult aneously viable. W e theref ore generate event-wise g r aded r elevance labels using a rank -based mapping that is robust to t he absolute scale of 𝑃 𝑒,𝑗 . For each event 𝑒 , candidates are rank ed by descending soft relev ance 𝑃 𝑒,𝑗 . Let r ank 𝑒 ( 𝑗 ) ∈ {1 , … , 𝑒 } denote the rank of station 𝑗 within ev ent 𝑒 , with r ank 𝑒 ( 𝑗 ) = 1 indicating t he highest rele vance. W e define a normalized rank score 𝑞 𝑒,𝑗 = 1 − r ank 𝑒 ( 𝑗 ) − 1 max( 𝑒 − 1 , 1) , 𝑞 𝑒,𝑗 ∈ [0 , 1] . (34) : Preprint submitted to Elsevier P age 19 of 33 (a) Density distribution of vehicles and charging stations in Chicago at sp ecific time intervals. The x-axis and y- axis rep resent the longitude and latitude of vehicles and cha rging stations, resp ectively . (b) Spatial distribution of trace locations fo r a single EV over the yea r to illustrate movement patterns across different lo cations over a one-y ear p erio d. The left- b ottom inset sho ws the spatial distribution of trace lo cations fo r the same EV over 24 hours, illustrating movement patterns throughout a single day . Figure 6: Spatial distribution of EV cha rging infrastructure and mobilit y patterns in Chicago. This transformation depends only on relative ordering within the event and is theref ore stable even when 𝑃 𝑒,𝑗 values are close due to probabilistic smoothing. W e conv ert 𝑞 𝑒,𝑗 into g raded relevance labels 𝑦 𝑒,𝑗 ∈ {0 , 1 , … , 𝐺 } using ordered thresholds 𝜅 𝐺 > 𝜅 𝐺 −1 > ⋯ > 𝜅 1 : 𝑦 𝑒,𝑗 = 𝐺, 𝑞 𝑒,𝑗 ≥ 𝜅 𝐺 , 𝐺 − 1 , 𝜅 𝐺 −1 ≤ 𝑞 𝑒,𝑗 < 𝜅 𝐺 , . . . 1 , 𝜅 1 ≤ 𝑞 𝑒,𝑗 < 𝜅 2 , 0 , 𝑞 𝑒,𝑗 < 𝜅 1 . (35) Thresholds { 𝜅 𝑔 } are selected to reflect the desired fraction of top-ranked candidates per event (e.g., top 10%, 30%, 60%), ensuring label diversity and preser ving the within-event ordering signal required f or learning-to-rank. T ogether, these steps transform heur istic, role-a w are suitability scores into supervised graded relevance labels suitable f or lear ning-to-rank without requiring observed st ation selection data. 6.4. Data preprocessing EV mobility and energy data undergo a preprocessing pipeline inv olving data understanding, dat a cleaning, data encoding and transformation, as well as f eature extraction and selection to suppor t charging nodes recommendation in EV –EV energy trading. 6.4.1. Dat a understanding: The prepared dataset compr ises dat a on taxi mobility , char ging stations, and t he temporal popularity of charging stations. T o understand v ehicle mobility , we visualized the spatial distr ibution of EVs and charging stations across selected time inter vals (Figure 6a ). This anal ysis provides insights into charging provider and consumer hotspots, as well as potential congestion areas across spatial and temporal dimensions. These findings are cr ucial f or optimizing char ging station distribution and enhancing energy distr ibution efficiency . In addition, t he spatial distribution of journey points for a single EV ov er a 24-hour per iod and across the entire year (Figure 6b ) rev eals recurr ing mobility patter ns, including freq uently tra versed routes, repeated stop-off locations, : Preprint submitted to Elsevier P age 20 of 33 and spatial concentration around specific urban regions. These patter ns indicate that v ehicle mobility is not random but exhibits regular spatiotemporal str ucture, with cer tain areas repeatedly acting as interaction hotspots where vehicles are more likely to engage in energy trading. Suc h recur ring locations and routes are particularly relevant for EV –EV ener gy trading, as they represent candidate regions where suppl y–demand matching and char ging node coordination are more likel y to occur . This analy sis motivates t he use of historical jour ney patter ns and spatial recur rence as informativ e f eatures for recommending ne xt charging nodes. 6.4.2. Dat a cleaning Data cleaning was per f or med to address missing values, duplicate records, and data inconsistencies to improv e data quality and maintain data integ rity . Duplicate entr ies were remo ved when the same EV w as recorded tra v eling be tween identical locations at the same timestamp. In addition, loop jour ne ys–cases where an EV star ted and ended at t he same location without meaningful displacement (i.e., tra veled distance close to zero)–w ere ex cluded, as the y pro vide limited relev ance to EV–EV trading and add unnecessary noise. To resolv e inconsistencies, measurement units (Wh, km) were standardized across all k ey attr ibutes, including battery energy lev el, trav el distance, trading volume, charging speed, and battery capacity , ensur ing consistency and comparability t hroughout the analy sis. 6.4.3. Dat a encoding and transformation W e applied appropr iate encoding techniques to the dataset to ensure compatibility wit h ranking models. Categor ical f eatures such as EV model, candidate charging stations, and trading role were encoded using the label encoding method [ 37 ]. W e examined the numerical attributes in t he dataset and obser v ed substantial scale variations across sev eral f eatures, including distance_t o_cs , c harging_speed , volume_of_energy , and popularity_index . Such disparities in magnitude can bias machine lear ning models f or lear ning-to-rank by causing features wit h larger numeric ranges to dominate t he lear ning process. To address this issue, min–max nor malization method [ 17 ] was applied to these continuous attributes, ensur ing that all featur es were scaled to a comparable range while preser ving their or iginal distributions. 6.4.4. F eature extraction and selection T o support next charging node recommendation under uncert ainty , we constr uct a multidimensional featur e set that captures candidate station characteristics, EV state information, and temporal and conte xtual f actors av ailable at eac h decision point. Feature extraction is performed at the level of EV decision ev ents, where each ev ent cor responds to a set of candidate charging stations considered simultaneously . T able 3 summar izes the f eatures used f or model training and evaluation. Identifiers such as EV ID and EV journey ID are retained only for query grouping, data splitting, and ev aluation purposes and are not used as input f eatures dur ing model training. Similarly , candidate char ging node identifiers are not used as model input features. The lear ning-to-rank model operates on candidate-level attributes and EV contextual f eatures to produce relevance scores f or each candidate within a decision ev ent. Station identifiers are used onl y to associate predicted relev ance scores with ph ysical char ging nodes after ranking. T o assess potential redundancy among f eatures, we conduct a pair wise Pearson cor relation analysis [ 22 , 31 ]. Figure 7 presents the cor relation matr ix for the selected candidate-lev el, EV -lev el, and contextual f eatures. Overall, cor relation values remain low to moderate, with no feature pairs exhibiting strong linear dependence indicativ e of multicollinearity . Expected relationships are obser v ed, such as a moderate positive cor relation between battery energy lev el and nor malized state-of-charg e ( soc_e ), reflecting their shared physical meaning. The requested transaction quantity show s a positive cor relation with both state-of-charg e and instant aneous batter y energy lev el, indicating that EVs with greater a vailable energy tend to engage in larg er energy trading volumes. Candidate station attr ibutes, including distance to station, charging speed, and historical popular ity , exhibit low mutual correlation, suggesting that they capture complementar y aspects of station suitability rather than redundant information. Based on this analysis, no f eatures were remov ed due to redundancy , and the complete f eature set w as retained for subsequent lear ning-to-rank experiments. 6.5. Learning-to-Rank models for next charging nodes recommendation T o generalize beyond r ule-based suitability estimation and lear n a unified decision policy applicable to unseen ev ents, we f or mulate next charging node recommendation as a supervised lear ning-to-rank problem. The objective is to lear n a scor ing function that orders candidate st ations according to their relative relev ance within each decision event. Each EV decision ev ent 𝑒 is treated as a query , and t he cor responding candidate stations 𝑗 ∈ 𝑒 are treated as items to be : Preprint submitted to Elsevier P age 21 of 33 T able 3 F eature set used for lea rning-to-rank in EV–EV charging no de recommendation.The following EV-level, temp o ral, spatial, context-level, and vehicle-level attributes a re treated as contextual features, as they cha racterize the decision environment under which candidate cha rging no des are ranked. Category Feature Description Candidate-level Distance to station Distance from the EV’s current location to the candidate charging station, capturing travel effort and feasibilit y . Charging speed Maximum charging or discharging rate supported by the station, reflecting energy transfer capability . Station p opularit y Historical usage intensit y of the station, reflecting recur- ring demand and supply pressure and local availability conditions that influence EV–EV matching feasibility . EV-level Battery capacity Maximum battery capacity of the EV. Battery energy level Available battery energy at the decision p oint. State-of-charge ( SoC 𝑒 ) Normalized battery energy level, capturing charging o r discharging urgency . T ransaction pressure ( 𝑝 𝑒 ) Role-aw are p ressure reflecting supply o r demand urgency in EV–EV energy trading. Energy quantity Amount of energy requested o r offered for trading, de- pending on the EV’s role. T rading role EV role in the trading interaction (provider or consumer). T emporal Time-of-day Hour and minute of the decision point, capturing daily mobility and cha rging patterns. Calendar context Day-of-w eek, week, and month indicators capturing peri- odic mobility b ehavio r. Cyclic time enco dings Sine and cosine transformations of time-of-da y , da y-of- week, and month to model temporal perio dicit y . Spatial Location identifier Encoded rep resentation of the EV’s current, source, and destination lo cations at the decision point. Community area Encoded spatial region providing coarse-grained geo- graphic context. Context-level Candidate set size Number of candidate charging stations available for the EV decision event, capturing choice complexit y and in- frastructure density . Vehicle-level EV model Vehicle mo del type capturing heterogeneity in charging and discharging cha racteristics. ranked. For each quer y–item pair, the input feature vector includes candidate-specific attr ibutes (e.g., distance, c harging speed, and popularity), EV -le vel attr ibutes (e.g., trading role and ener gy le vel), and optional conte xtual f eatures (e.g., candidate count) that are shared across all candidates within the same ev ent. The target super vision signal is the g raded relev ance label 𝑦 𝑒,𝑗 . These labels indicate relative station desirability within an event and do not represent obser v ed station selection outcomes. T o learn this ranking function, we employ supervised lear ning-to-rank models trained using graded relev ance labels derived from probabilisticall y refined station suitability scores. This f or mulation captures relative station desirability under uncer tainty without assuming a single ground-tr uth choice. Specifically , we e valuate t hree gradient-boosting- based ranking algorit hms: LightGBM Ranker with a LambdaRank objective, XGBoost Ranker with a pairwise ranking objective, and CatBoost Ranker wit h a PairLogit objective [ 43 , 23 ]. All models are trained independently on the Ne xtT rade-EV dataset using identical f eature sets and relev ance labels, enabling a fair compar ison of ranking performance. Given a set of queries and associated g raded relev ance labels, the ranking models lear n a scoring function 𝑓 ( ⋅ ) that assigns higher scores to stations wit h higher relev ance grades wit hin the same decision ev ent. Depending on the underl ying algor ithm, pairwise or listwise loss functions are employ ed to penalize incor rect order ings, wit h larger penalties assigned to swaps inv olving greater relev ance differences. As t he relev ance labels are inferred rather t han directly obser v ed, the resulting models should be inter preted as lear ning a generalized ranking policy consistent with inf er red station suitability patter ns, rather than predicting realized driver choices. In summary , the proposed approac h f or mulates each EV decision event as a ranking query , combines contextual and candidate-lev el attributes into query–item f eature vectors, and lear ns a ranking function using a gradient-boosted learning-to-rank model. The complete learning-to-rank–based recommendation framew ork is illustrated in Fig. 8 . : Preprint submitted to Elsevier P age 22 of 33 battery_capacity community_ar ea_id sour ce destination location location_minute location_hour location_day location_week location_month battery_ener gy_level n_candidates candidate_distance_to_cs candidate_char ging_speed candidate_popularity quantity_of_ener gy soc_e p_e r ole ev_model battery_capacity community_ar ea_id sour ce destination location location_minute location_hour location_day location_week location_month battery_ener gy_level n_candidates candidate_distance_to_cs candidate_char ging_speed candidate_popularity quantity_of_ener gy soc_e p_e r ole ev_model 1.00 -0.00 1.00 -0.01 -0.04 1.00 -0.00 -0.10 0.31 1.00 -0.01 -0.11 0.57 0.61 1.00 -0.00 -0.00 0.00 -0.00 0.00 1.00 0.00 -0.04 -0.06 0.03 -0.02 -0.05 1.00 0.00 -0.00 -0.00 0.00 0.00 0.00 0.00 1.00 0.02 0.00 -0.01 -0.01 -0.01 0.00 0.00 0.03 1.00 0.02 0.00 -0.02 -0.01 -0.02 -0.00 0.00 -0.02 0.96 1.00 0.67 -0.01 -0.02 -0.01 -0.01 -0.00 -0.00 -0.00 0.02 0.01 1.00 -0.01 -0.02 -0.02 -0.03 -0.03 0.01 0.01 -0.02 0.02 0.02 -0.00 1.00 -0.00 0.11 0.19 0.19 0.31 0.00 -0.00 0.00 -0.01 -0.01 -0.01 -0.03 1.00 0.00 -0.04 0.03 0.03 0.06 -0.00 0.01 0.00 0.00 -0.00 0.00 -0.01 0.18 1.00 -0.00 0.02 0.01 -0.00 0.01 -0.00 -0.02 0.00 0.00 0.00 -0.00 -0.01 0.05 0.04 1.00 0.58 -0.00 -0.01 0.00 -0.00 -0.00 -0.00 0.00 0.01 0.01 0.37 -0.01 0.00 0.00 0.00 1.00 0.01 -0.01 -0.02 -0.01 -0.01 -0.00 0.00 -0.00 -0.00 -0.00 0.66 0.00 -0.01 -0.00 -0.00 -0.00 1.00 0.00 0.00 -0.01 0.00 0.00 0.00 -0.00 0.00 0.00 0.00 0.02 -0.01 0.00 0.00 0.00 0.69 0.03 1.00 -0.00 -0.00 0.00 0.00 0.00 0.00 0.00 -0.00 0.00 0.00 0.19 0.01 -0.00 -0.00 -0.00 -0.23 0.30 -0.17 1.00 0.29 -0.00 -0.01 -0.01 -0.01 0.01 -0.01 -0.00 0.00 0.00 0.20 -0.01 -0.01 -0.00 -0.00 0.17 0.01 0.01 0.00 1.00 0.2 0.0 0.2 0.4 0.6 0.8 1.0 Figure 7: Pea rson Correlation Analysis among features: This analysis measures the linea r relationships among features, identifying p otential multicollinearit y and redundant information. 6.6. Model training The dataset was par titioned into training (70%), validation (15%), and tes t (15%) sets at the query level , where each query cor responds to an EV decision ev ent. This splitting strategy ensures that all candidate stations associated with the same ev ent are assigned to a single split, thereby prev enting information leakage across training, validation, and test sets. The validation set w as used ex clusivel y for hyperparameter tuning and early stopping, while the test set w as reserved for final per f or mance evaluation. All ranking models were trained using their respectiv e ranking objectives and optimized to preserve t he relative order ing of candidate stations within each e vent, as illustrated in Fig. 9 . T o mitigate o v erfitting, model-specific regularization techniques inherent to gradient-boosted decision trees w ere employ ed, including tree depth constraints, subsampling of instances and features, and 𝓁 2 regularization on leaf weights. Earl y stopping based on validation ranking metr ics was applied where suppor ted. These measures ensure robust generalization to unseen EV decision ev ents. T o furt her assess robustness, we additionally conducted quer y -lev el 𝐾 -fold cross-validation, where EV decision ev ents were randomly par titioned into 𝐾 disjoint folds and all candidate stations associated with the same event were kept within a single fold. Models were trained on 𝐾 − 1 folds and ev aluated on the remaining fold, and performance w as a verag ed across folds. The resulting trends were consistent with those obtained using the fix ed train/validation/tes t split. 6.7. P erformance ev aluation metrics T o ev aluate t he quality of next charging node recommendation, we emplo y standard ranking metrics t hat assess the relative ordering of candidate stations wit hin each EV decision ev ent. Since the task is formulated as a ranking problem with graded relevance labels rather than a single ground-tr uth choice, w e focus on top- 𝑘 ranking metrics that emphasize early precision and cov erage. W e repor t ranking per f or mance at cutoffs 𝑘 ∈ {1 , 3 , 5 , 10} , which reflect realistic recommendation list sizes in EV –EV energy trading scenar ios. : Preprint submitted to Elsevier P age 23 of 33 NextT rade-EV Dataset (Labeled) EV decision events queries Candidate charging nodes items Graded relevance labels * Labels obtained through Fuzzy TOPSIS + EM (Fig. 1) Feature Representation Contextual Features (Query-level) EV -level: SoC, energy , role, pressure, quantity T emporal: time-of-day , calendar , cyclic encodings Spatial: location, community area Context-level: candidate set size V ehicle-level: EV model * Shared across all candidate for a decision events Candidate Features (Item-level) Distance to charging stations Charging speed Station popularity/energy availability *V ary across candidate charging nodes Learning-to-Rank Model (LightGBM) Input: Query-item feature vectors Supervision: Graded Relevance Labels T raining: Learn ranking function f(query , item) Combined into query–item feature vectors Inference: Score and order candidate charging nodes Next charging nodes recommendation Ordered list of candidate charging nodes T op-k recommendations Figure 8: Next charging no des recommendation framew ork based on learning-to-rank. NDCG@ 𝑘 : Normalized Discounted Cumulative Gain (NDCG) ev aluates ranking quality under graded relev ance by rewar ding highly relev ant stations appearing near the top of the ranked list. The Discounted Cumulative Gain at cutoff 𝑘 is defined as DCG@ 𝑘 = 𝑘 𝑖 =1 2 r el 𝑖 − 1 log 2 ( 𝑖 + 1) , (36) where r el 𝑖 denotes the graded relev ance of the station ranked at position 𝑖 . NDCG is obtained by nor malizing DCG with respect to the ideal ranking: NDCG@ 𝑘 = DCG@ 𝑘 IDCG@ 𝑘 , (37) where IDCG@ 𝑘 is the DCG of the ideal (per f ectly ordered) ranking. NDCG is particularly suitable f or our setting as it supports multi-lev el relev ance labels derived from probabilis tic smoothing [ 8 ]. Recall@ 𝑘 : Recall@ 𝑘 measures t he extent to which relev ant stations are cov ered within t he top- 𝑘 ranked results. Let 𝑒 denote the set of relevant stations f or ev ent 𝑒 , defined as those with graded relevance abo ve a predefined t hreshold, and let 𝑒,𝑘 denote t he top- 𝑘 ranked stations. Recall@ 𝑘 is computed as Recall@ 𝑘 = 𝑒 ∩ 𝑒,𝑘 𝑒 . (38) This metric reflects the ability of the model to include plausible charging or trading options within a limited recommendation list. In scenarios where only one station is highl y relev ant, Recall@ 𝑘 reduces to a hit-rate indicator [ 43 ]. : Preprint submitted to Elsevier P age 24 of 33 NextT rade-EV Dataset (Labeled) Each query = one EV decision event Each query has multiple candidate charging nodes Data Splitting T rain 70% V alidation 15% T est 15% Model T raining (Ranking Loss) V alidation (Early stop and hyperparams) T rained Learning-to-Rank Model (LightGBM) Ranking objectives (pairwise / listwise) Regularization (depth, subsampling, L2) Early stopping guided by validation metrics Ranked Candidate Stations per EV Event Predictions on unseen test queries T op-k ranking metrics reported Ranking inference on test set Learn f(query , item) Query-level split (no leakage) Final Evaluation (Ranking Metrics) Figure 9: Query-level training, validation, and testing protocol for lea rning-to-rank mo dels. MRR: Mean Reciprocal Rank (MRR) emphasizes how earl y the first relevant station appears in the ranked list. It is defined as MRR = 1 𝑄 𝑄 𝑒 =1 1 r ank 𝑒 , (39) where r ank 𝑒 denotes the rank position of the first station in ev ent 𝑒 whose relevance exceeds t he rele vance t hreshold, and 𝑄 is the total number of ev ents. Higher MRR v alues indicate that highl y suitable stations tend to appear closer to the top of the recommendation list [ 8 ]. 7. Result analysis and discussions This section ev aluates the overall performance of t he selected models through a comprehensive analy sis. 7.1. Experimental specifications For scalable training and evaluation, we ex ecuted experiments on a high-per f or mance computing (HPC) cluster using the Port able Batch Sy stem (PBS). Each r un used a single compute node provisioned with a 4-core CPU, 512 GB RAM, and one NVIDIA H100 GPU . The software stac k included Python 3.10.8 with Pandas, NumPy , Scikit-lear n, T ensorFlow , and Matplotlib to suppor t data processing and model training. Jobs were submitted via a PBS scr ipt and consolidated stdout/stderr logging to data.log . Resource requests and en vironment activation were handled at submission time to ensure reproducibility and efficient utilization of GPU resources. 7.2. P erformance analysis Based on the Ne xtT rade-EV datasets, each decision point produces a probabilistic distribution of candidate charging stations that represents the relativ e lik elihood of selection. These soft labels are used to train ranking models that aim to lear n an ordering function over candidate stations at each decision point in a journey for the EV driver . T o ev aluate their ranking effectiveness, we adopt standard information-retriev al metrics–NDCG@k, Recall@k, and MRR –which measure how highly rele vant station is ranked among the top- 𝑘 candidates. Unlik e accuracy-based evaluation, these metrics emphasize the quality of t he entire ranked list, offer ing a more fine-grained assessment of model behavior at each decision point. T able 4 represents t he ranking per f or mance of t hree supervised lear ning-to-rank model including LightGBM (LambdaRank), XGBoost (pairwise), and CatBoost (PairLogit), ev aluated on the Ne xtTr ade-EV dat aset (test dat a) : Preprint submitted to Elsevier P age 25 of 33 T able 4 Compa rison of learning-to-rank mo dels fo r next charging nodes recommendation Model NDCG@1 Recall@1 NDCG@3 Recall@3 NDCG@5 Recall@5 NDCG@10 Recall@10 MRR LightGBM (Lamb daRank) 0.9795 0.1931 0.9725 0.5112 0.9762 0.6848 0.9811 0.8889 0.9990 XGBoost (Pairwise) 0.9655 0.1926 0.9623 0.5119 0.9689 0.6854 0.9749 0.8899 0.9984 CatBoost (PairLogit) 0.9678 0.1924 0.9646 0.5111 0.9709 0.6854 0.9772 0.8900 0.9982 Figure 10: LightGBM Lamb daRank convergence and early stopping. T raining (blue) and validation (purple) NDCG@10 versus b o osting iteration for the LightGBM rank er. The b est iteration selected by early stopping occurs at Iter = 499 with a p eak validation NDCG@10 = 0.9716 (blue mark er; dashed vertical line). using g raded relevance labels derived from probabilisticall y smoothed station suitability scores. All models were trained and ev aluated under identical query-le v el data splits and f eature sets to ensure a fair compar ison. Across all e valuation metrics and cutoff lev els ( 𝑘 ∈ 1 , 3 , 5 , 10 ), LightGBM consistentl y achie ves t he best o verall performance. In par ticular , LightGBM attains t he highest NDCG@1 (0.9795), indicating superior accuracy in placing the most relev ant charging or trading station at the top of t he recommendation list. This advantage persists at larger cutoffs, with LightGBM maint aining t he highest NDCG@3, NDCG@5, and NDCG@10 values, demons trating str ong ranking quality throughout the recommendation list rather t han only at the top position. Recall-based metr ics rev eal a closely competitive patter n. Recall@1 is nearly identical across models, with LightGBM achieving a marginal advantage (0.1931). Recall trends are broadl y consistent across models: XGBoost is marginall y higher at Recall@3 and Recall@5, whereas CatBoost att ains the best Recall@10, wit h all differences remaining small. This indicates t hat while XGBoost and CatBoost retr ie v e slightl y more relev ant stations at specific deeper cutoffs, LightGBM achie ves superior ranking quality , as reflected by consistently higher NDCG scores. Hence, the results sugges t that LightGBM prior itizes more accurate order ing of highl y relev ant stations at top positions, while differences in recall at deeper cutoffs remain marginal across models. Mean Reciprocal Rank (MRR) v alues are unif ormly high f or all models, ex ceeding 0.997, which indicates that at least one highly rele vant station typicall y appears near t he top of the rank ed list for most decision e v ents. Nonetheless, LightGBM again achie ves the highest MRR (0.9990), reinforcing its superior earl y-ranking beha vior . Figure 10 illustrates the conv ergence beha vior of LightGBM LambdaRank. The training and v alidation NDCG@10 curves follo w a consistent trajector y and stabilize after sufficient boosting iterations (around 500 iterations), with minimal diver gence betw een them. Early stopping identifies iteration 499 as the optimal model based on validation NDCG@10. After conv ergence, additional boosting iterations produce onl y marginal chang es in performance, confirming stable optimization behavior . These results indicate that gradient-boosted decision tree–based ranking models are well suited to the EV–EV char ging node recommendation problem. Among t he ev aluated models, LightGBM provides the best balance betw een earl y precision and ov erall ranking consistency and is therefore adopted as the pr imary ranker in the proposed framew ork. For subsequent analy sis, LightGBM is fixed as the ranking model, while TOPSIS is used as the : Preprint submitted to Elsevier P age 26 of 33 T able 5 Sensitivit y Analysis of SoC Thresholds Threshold Configuration ( 𝑟 ) Providers (%) Consumers (%) NDCG@1 Recall@1 NDCG@5 Recall@5 NDCG@10 Recall@10 ( 𝑟 ≤ 0 . 30 , 𝑟 > 0 . 85) 55.99 44.01 0.9793 0.1930 0.9761 0.6849 0.9811 0.8889 Baseline ( 𝑟 ≤ 0 . 30 , 𝑟 > 0 . 90) 56.48 43.52 0.9795 0.1931 0.9762 0.6848 0.9811 0.8889 ( 𝑟 ≤ 0 . 30 , 𝑟 > 0 . 95) 56.78 43.22 0.9795 0.1931 0.9763 0.6849 0.9812 0.8889 baseline super vision mechanism, allowing the effect of probabilistic refinement to be isolated independently of model architecture. 7.3. Sensitivity analy sis T o ex amine the robustness of the proposed EV–EV trading recommendation framew ork, we conduct sensitivity analy ses on ke y design parameters that influence role assignment and candidate generation. Specifically , we ev aluate the impact of (1) SoC threshold selection used in jour ney -lev el role assignment and (2) spatial radius constraints used for candidate charging pad generation. These analy ses assess whether ranking per formance remains stable under reasonable variations of operational and spatial assumptions. 7.3.1. Sensitivity t o SoC thr eshold T o assess the robustness of the proposed mechanism, we conducted a sensitivity analysis on t he surplus t hresholds used in Algorithm 2 . The lower cutoff ( 𝑟 ≤ 0 . 30 ) corresponds to a minimum operational safe ty constraint, ensur ing t hat EVs with insufficient surplus are deter ministicall y classified as consumers. Accordingl y , this boundar y w as kept fixed. Hence, sensitivity analy sis f ocuses on the upper pro vider cutoff, which go verns t he strictness of sur plus inter pretation. Specifically , we varied the provider threshold around the baseline configuration ( 𝑟 ≤ 0 . 30 , 𝑟 > 0 . 90) by testing alternative values of 𝑟 > 0 . 85 and 𝑟 > 0 . 95 . The probabilistic decision r ule, including the probability parameters 𝑝 mid and 𝑝 high , was preserved, and a fixed random seed was employ ed during probabilistic role assignment to ensure reproducibility . This setup evaluates whether ranking per f ormance is sensitive to reasonable perturbations of t he deterministic pro vider threshold. T able 5 presents the sensitivity analy sis of the provider cutoff while keeping the consumer safety threshold fixed at 𝑟 ≤ 0 . 30 . V arying the upper sur plus threshold from 0.85 to 0.95 results in only minor changes in role (provider , consumer) distribution, with the propor tion of providers ranging between 55.99% and 56.78%. This indicates that moderate adjustments to the provider cutoff do not substantially alter the class balance. More impor tantly , ranking per f or mance remains unchanged across configurations. NDCG@1 remains at approx- imately 0.9795, NDCG@5 at 0.9762, and NDCG@10 at 0.9811, while Recall@10 consistently sta ys around 0.8889. The negligible variation across all ranking depths demonstrates t hat the lear ned rele vance function is not sensitiv e to moderate per turbations of t he SoC threshold. These findings confirm that the proposed role-assignment mechanism and ranking model are robust with respect to reasonable variations in the provider sur plus cutoff, and that per f or mance does not depend critically on the exact selection of the 90% threshold. 7.3.2. Sensitivity t o candidate radius T o ev aluate t he robustness of our model with respect to t he candidate generation radius, we v aried t he maximum allow able detour distance from 1 km to 10 km. T able 6 summarizes the distribution of candidate WCPs per decision ev ent across radius of 1, 2, 3, 5, and 10 km o v er 2190331 ev ents. The mean number of candidates increases from 7.21 at 1 km to 9.15 at 10 km, while the median stabilizes at 8 for radius ≥ 2 km, indicating that most accessible WCPs are already captured within a short spatial range. The upper percentiles remain constant (P90 = 16, P95 = 19) across radius, showing that expanding the radius does not substantially increase the upper tail of candidate av ailability . The primar y effect of increasing the radius is the reduction of infeasible ev ents: t he proportion of zero-candidate ev ents drops shar ply from 16.84% at 1 km to 0.23% at 3 km and becomes negligible beyond 5 km. Similarl y , sparse cases ( ≤ 3 candidates) decrease from 28.72% at 1 km to 13.85% at 3 km, while the propor tion of ev ents wit h ≤ 10 candidates decreases more moderately , reflecting a rightward shift of the distribution rather than explosiv e candidate growth. These findings indicate t hat increasing the radius bey ond 3 km yields diminishing returns in candidate e xpansion. A 3 km radius already eliminates nearly all infeasible ev ents while maintaining moderate candidate set sizes, suggesting : Preprint submitted to Elsevier P age 27 of 33 T able 6 Distribution of candidate WCPs p er EV decision event under varying geographic radius limits. Radius (km) #Events Mean Median P90 P95 0 WCPs (%) ≤ 𝟑 (%) ≤ 𝟓 (%) ≤ 𝟏𝟎 (%) 1 2190331 7.21 6 16 18 16.84 28.72 48.31 74.80 2 2190331 8.64 8 16 19 2.67 17.75 38.16 68.32 3 2190331 9.07 8 16 19 0.23 13.85 35.33 66.34 5 2190331 9.14 8 16 19 0.02 13.18 35.27 66.33 10 2190331 9.15 8 16 19 0.00 12.54 35.15 66.32 Figure 11: Percentage of decision events with zero candidate WCPs under va rying geographic filtering radius (1–10 km). The proportion of infeasible events decreases sharply as the radius expands, dropping from 16.84% at 1 km to nearly zero b eyond 5 km. This demonstrates that small radius can lead to substantial candidate sparsit y , whereas radius ≥ 3 km effectively ensure candidate av ailabilit y fo r almost all decision events. that most practically accessible char ging options are captured wit hin this spatial range. These obser vations are also visually suppor ted by Figures 11 and 12 . When examined alongside the ranking results in T able 7 , a consistent pattern emerg es. Despite differences in candidate sparsity between t he 1 km radius and larger radii, ranking performance remains highly stable. At 1 km, NDCG@1 is 0.9764 and Recall@1 is 0.2212, while at 10 km they are 0.9796 and 0.1930, respectivel y . Similarly , NDCG@10 v ar ies onl y slightl y from 0.9782 (1 km) to 0.9813 (10 km), and Recall@10 remains close to 0.89 across all radius settings. Although 74.80% of 1 km decision ev ents cont ain ten or fe wer candidates, compared to approximatel y 66.3% at 3 km and abo ve, the ranking model maintains comparable accuracy . This indicates t hat t he model does not rely on tr ivially small candidate sets to achiev e strong per f or mance. U nder t he 1 km setting, candidate a vailability is more restricted and some events exhibit sparsity , whereas under t he 10 km setting the model must discriminate among a larger and more diverse set of char ging options. The sust ained ranking quality under e xpanded search spaces demonstrates that t he learned relev ance function effectivel y captures mobility context, char ging pad features, and energy conte xt, rather t han benefiting from ar tificially constrained candidate pools. These findings demonstrate t he robustness of t he proposed framew ork wit h respect to spatial filter ing parame ters. In summar y , the sensitivity analy ses across both sur plus threshold configurations and spatial candidate-generation radius demonstrate that the proposed framew ork exhibits stable ranking beha vior under reasonable perturbations of key design parameters. The negligible variation in NDCG and Recall metr ics indicates t hat the learned relevance function captures structural relationships betw een mobility context, ener gy context, and char ging station suitability , rat her than relying on finel y tuned thresholds or constrained candidate pools. : Preprint submitted to Elsevier P age 28 of 33 Figure 12: The empirical cumulative distribution of candidate cha rging pads per decision event under varying radius limits. F or a given value 𝑥 , the cumulative distribution rep resents the proportion of decision events with at most 𝑥 candidate W CPs. The curves demonstrate that candidate availabilit y stabilizes b ey ond 3 km, as the distributions for 5 km and 10 km a re nearly indistinguishable. T able 7 Sensitivit y of ranking performance to candidate-generation radius. Radius (km) NDCG@1 Recall@1 NDCG@3 Recall@3 NDCG@5 Recall@5 NDCG@10 Recall@10 1 0.9764 0.2212 0.9693 0.5160 0.9726 0.6866 0.9782 0.8862 2 0.9750 0.2442 0.9668 0.5164 0.9704 0.6840 0.9765 0.8828 3 0.9768 0.2040 0.9679 0.5115 0.9716 0.6817 0.9782 0.8848 5 0.9796 0.1959 0.9705 0.5143 0.9746 0.6854 0.9813 0.8886 10 0.9796 0.1930 0.9706 0.5123 0.9747 0.6842 0.9813 0.8881 7.4. Ablation study of probabilistic smoothing and feature components T able 8 summar izes the ranking per f or mance of the proposed framewor k under different ablation settings, isolating the effects of probabilistic smoothing and feature composition. W e conduct t his ablation study to examine t he contribution of two factors in the proposed EV–EV char ging node recommendation framewor k: (i) probabilistic smoothing through t he Expect ation–Maximization (EM) algor ithm and (ii) t he inclusion of EV -lev el and contextual f eatures bey ond candidate WCP attributes. All variants are trained and evaluated using the same LightGBM ranking model with a LambdaRank objective, identical query-le v el data splits, and t he same ev aluation metr ics to ensure a fair comparison. The onl y differences across variants are t he rele vance label constr uction strategy , that is, TOPSIS-derived or EM-refined labels, and t he feature set used for training. TOPSIS without EM: As a baseline, fuzzy-w eighted TOPSIS suit ability scores 𝑟 𝑒,𝑗 are directly conv er ted into graded relev ance labels using a within-ev ent rank -based mapping, without probabilistic smoothing. This configuration represents a purely heuristic ranking pipeline. The results sho w strong performance at higher cutoffs, particularly f or Recall@5 and Recall@10, reflecting the deter ministic nature of TOPSIS and its tendency to produce shar pl y peaked rankings. Howe ver , t his approach implicitly assumes a decisive order ing among candidate stations and does not account f or uncer tainty ar ising from dense infrastr ucture or the presence of multiple simultaneously viable trading options, which are common in EV –EV energy trading scenarios. TOPSIS with candidate-onl y features: In this ablation, the learning-to-rank model is trained using only candidate-lev el features (distance, charging speed, and popular ity), ex cluding EV state variables and contextual inf or mation. Performance deg rades consistentl y across all NDCG cutoffs compared to t he full model, indicating that : Preprint submitted to Elsevier P age 29 of 33 T able 8 Ablation study evaluating the impact of p robabilistic smo othing (EM) and feature comp onents on ranking p erfo rmance using LightGBM (Lamb daRank). Va riant EM Context NDCG@k Recall@k MRR @1 @3 @5 @10 @1 @3 @5 @10 TOPSIS lab els + full features × ✓ 0.9423 0.9616 0.9724 0.9759 0.2516 0.7401 0.9596 0.9986 0.9981 TOPSIS lab els + candidate-only features × × 0.7508 0.8478 0.8845 0.8989 0.2426 0.6936 0.9120 0.9925 0.9764 EM labels + candidate-only fea- tures ✓ × 0.8802 0.8933 0.9130 0.9317 0.1902 0.5061 0.6815 0.8835 0.9960 EM lab els + full features (Full Model) ✓ ✓ 0.9795 0.9725 0.9762 0.9811 0.1931 0.5112 0.6848 0.8889 0.9990 candidate attributes alone are insufficient to explain relative station suitability . This result highlights the impor tance of incorporating EV -specific factors, such as energy state and transaction pressure, as well as temporal conte xt, in order to capture realistic decision behavior . EM with candidate-only features: Ne xt, EM-based probabilistic smoothing is applied to the TOPSIS scores to generate soft rele vance labels, while still restricting the feature set to candidate-only attributes. Performance decreases relativ e to the heur istic TOPSIS baseline, par ticularl y at early cutoffs. This behavior is expected: EM intentionally reduces e xtreme dominance in suitability scores in order to model decision uncer tainty . When do wnstream lear ning capacity is limited by a reduced feature set, this uncer tainty cannot be effectivel y resolved, leading to weaker early - ranking accuracy . Impor tantly , this result demonstrates that EM is not intended to impro ve heur istic rankings in isolation, but rather to pro vide uncer tainty-a ware super vision for super vised lear ning-to-rank models. Full model (EM with full feature set): The full model combines EM-based probabilistic smoothing wit h a comprehensiv e f eature set including candidate attributes, EV state variables (e.g., state of char ge and transaction pressure), as well as temporal and contextual f eatures. This configuration achiev es the strongest ov erall performance across all NDCG and MRR metrics, with particularly large gains at early cutoffs such as NDCG@1. In terms of recall, t he results reveal a complementar y patter n. While the heur istic TOPSIS baseline att ains very high Recall@5 and Recall@10, the EM-based full model maint ains competitiv e recall while emphasizing more accurate top-ranked order ing (as reflected by substantially higher NDCG@1 and MRR values). This indicates that the learning- to-rank framew ork pr ioritizes placing t he most suitable charging pad at the highest ranks rather than maximizing the total number of relev ant candidates retriev ed within broader cutoffs. Hence, the ablation study demonstrates that EM-based probabilistic smoothing, when combined with contextual f eature modeling, significantly improv es earl y-ranking precision and top-position accuracy . Although heur istic ap- proaches may retrieve a larg er number of relevant candidates at deeper cutoffs, the full model provides best ranking quality at the highest positions. Particularly , this is impor tant in t he EV–EV trading context, where an EV dr iver typically selects a single charging pad, and t he cor rectness of the top-ranked recommendation directly impacts operational efficiency and user satisfaction. 8. Limitations Although the proposed framew ork demonstrates robust predictive and calibration per f or mance, sev eral limit ations ha ve been identified. F irst , the charging station choices are extracted from historical mobility traces rat her than observed charging or EV –EV transaction records. Consequently , the dat a do not directly verify whether a stop cor responded to an actual char ging or discharging ev ent, which station was used, how much energy w as transf er red, how long the transaction lasted, or whether t he interaction in vol ved grid charging or EV –EV trading. This introduces uncert ainty into the derived ground tr uth and may lead to discrepancies between inferred char ging decisions and real operational behavior . Second , the station popular ity is nor malized relative to t he av erage percent age rat her than the absolute demand or supply , which ma y obscure real-wor ld charging or dischar ging load variations across different regions and times. Third , while heur istic and EM-based soft labeling suppor t label quality , both rely on underl ying assumptions about decision rationality and feature relevance, which may not fully capture all beha vioral or environmental f actors influencing charging/dischar ging choices. F inally , t he cur rent analy sis focuses on station- lev el recommendation wit hout incor porating real-time chang es to energy prices, which are critical f or deployment in larg e-scale EV–EV trading sys tems. Despite t hese limit ations, t he proposed ranking frame w ork provides a strong methodological f oundation f or scalable, data-driven coordination in EV–EV ener gy trading. : Preprint submitted to Elsevier P age 30 of 33 9. Conclusion and Future W orks This study presented a recommendation frame w ork for predicting next char ging nodes in EV–EV energy trading scenarios, explicitl y addressing the uncer tainty and multi-choice nature of charging decisions along EV journeys. Rather than modeling char ging beha vior as a single-label prediction problem, the proposed approac h f or mulates next char ging nodes selection as a learning-to-rank task, where candidate stations are ordered according to their relativ e suitability within each decision e v ent. The framew ork integrates fuzzy -weighted TOPSIS f or role-a ware heur istic suitability estimation, EM-based probabilistic smoothing to model decision ambiguity , and supervised lear ning-to-rank models to learn a generalized ranking policy . Experimental ev aluation on t he Ne xtTrade-EV dataset demonstrated t hat gradient-boosted ranking models are w ell suited to this se tting, wit h LightGBM (LambdaRank) consistentl y achie ving the strongest per f ormance across NDCG@k , Recall@k, and MRR metrics. Results further show ed t hat probabilistic smoothing alone does not enhance heur istic rankings, but becomes effective when paired with r ich EV -le vel and contextual features, enabling impro v ed earl y-ranking accuracy and robust generalization to unseen decision ev ents. Bey ond empirical performance, this study contr ibutes to a reproducible and extensible ev aluation pipeline for EV–EV charging node recommendation under uncer tainty . By explicitly modeling role-dependent urgency , energy lev el dynamics, temporal context, and candidate-set characteristics, t he framew ork captures realistic variability in EV–EV trading beha vior wit hout relying on observed station selection labels. This design suppor ts decentralized coordination by producing ranked candidate sets rather than point predictions, which is more aligned with EV–EV matching and negotiation processes. As EV participation and trading density continue to scale, our future researc h dev elopment will f ocus on impro ving model scalability and privacy t hrough distr ibuted and privacy -preserving lear ning paradigms. In addition, while the cur rent f or mulation assumes stationar y char ging nodes as inter mediaries, real-world deplo yments ma y inv olve mobile char ging units (char ging-as-a-ser vice) or direct EV–EV energy exc hange. Extending the frame w ork to accommodate such dynamic trading configurations represents an impor tant direction for fur ther research. A cknow ledgments The authors acknow ledge t hat this research is par tly suppor ted b y the QUT Postgraduate R esearch A ward (QUTPRA) sc holarship. Data A vailability The data that suppor t the findings of this study are a vailable from the cor responding author upon reasonable request. Ref erences [1] Abishu, H.N., Seid, A.M., Y acob, Y .H., A yall, T ., Sun, G., Liu, G., 2022. Consensus mechanism f or bloc kchain-enabled v ehicle-to-vehicle energy trading in the internet of electric v ehicles. IEEE T rans. V eh. T echnol. 71, 946–960. [2] Adil, M., Mahmud, M.A.P ., Kouzani, A.Z., Khoo, S., 2021. Energy trading among electric vehicles based on stack elberg approaches: A review . Sustain. Cities Soc. 75, 103199. [3] Almaghrebi, A., Aljuheshi, F ., Rafaie, M., James, K., Alahmad, M., 2020. Dat a-driven charging demand prediction at public charging stations using super vised machine learning reg ression methods. Energies 13, 4231. [4] Alshahrani, S., Khalid, M., Almuhaini, M., 2019. Electr ic vehicles beyond energy storage and modern pow er networks: Challenges and applications. IEEE Access 7, 99031–99064. [5] Asensio, O.I., Apablaza, C.Z., La wson, M., W alsh, S.E., 2020. Replication data for: A field experiment on workplace nor ms and electric vehicle charging etiquette . [6] Bakr, A., Srewa, M., Bulut, E., Akka ya, K., Rahman, M., Alshar if, A., 2023. Pr ivacy -preser ving v2v char ge sharing coordination using the hungarian algorithm, in: 2023 IEEE 97th V ehicular T echnology Conf erence (VTC2023-Spring), IEEE. pp. 1–6. [7] Boulder City Corporation, 2021. City of boulder open data. URL: https://open- data.bouldercolorado .gov/datasets/ 95992b3938be4622b07f0b05eba95d4c_0/explore . accessed 10 Nov ember 2025. [8] Burges, C.J., 2010. From ranknet to lambdarank to lambdamar t: An ov er view . Lear ning 11, 81. [9] Covington, P ., Adams, J., Sargin, E., 2016. Deep neural networks for youtube recommendations, in: Proceedings of the 10t h ACM conf erence on recommender systems, pp. 191–198. [10] Dixon, J., Elders, I., Bell, K., 2018. Characterization of electric vehicle fast charging forecourt demand, in: 2018 IEEE PES Inno vativ e Smart Grid T echnologies Conference Europe (ISGT -Europe), IEEE. pp. 1–9. : Preprint submitted to Elsevier P age 31 of 33 [11] Dixon, J., Elders, I., Bell, K., 2019. Ev aluating the likely temporal v ariation in electr ic v ehicle char ging demand at popular amenities using smartphone locational data. iet intell transp syst 2020; 14 (6): 504–10. [12] Eddine, M.D., Shen, Y ., 2022. A deep lear ning based approach for predicting the demand of electric vehicle charge. Journal of Supercomputing 78, 14072–14095. doi: 10.1007/s11227- 022- 04428- 0 . [13] El-Say ed, I., Khan, K., Dominguez, X., Arboley a, P ., 2020. A real pilot-platf or m implementation for blockc hain-based peer-to-peer energy trading, in: 2020 IEEE Po wer & Energy Society General Meeting (PESGM), pp. 1–5. doi: 10.1109/PESGM41954.2020.9281855 . [14] Fan, X., Guo, L., Han, N., W ang, Y ., Shi, J., Y uan, Y ., 2018. A deep learning approach f or next location prediction, in: 2018 IEEE 22nd International Conf erence on Computer Supported Cooperativ e W ork in Design ((CSCWD)), IEEE. pp. 69–74. [15] Gonzalez, M.C., Hidalgo, C.A., Barabasi, A.L., 2008. Understanding individual human mobility patterns. nature 453, 779–782. [16] Habbal, A., Alrifaie, M.F ., 2024. A user -pref erence-based charging station recommendation f or electric vehicles. IEEE Transactions on Intelligent Transportation Sys tems 25, 11617–11634. [17] Hastie, T., 2009. The elements of statistical learning: data mining, infer ence, and prediction. [18] Herberth, R., Menz, L., Körper, S., Luo, C., Gauter in, F., Gerlicher , A., W ang, Q., 2019. Identifying atypical tra vel patterns f or improv ed medium-term mobility prediction. IEEE Transactions on Intelligent Transportation Sys tems 21, 5010–5021. [19] Hossain, M.R., Barros, A., Fidge, C., 2025. From cloud to edge: dynamic placement optimization of business processes in iiot netw orks. Journal of Networ k and Computer Applications , 104317. [20] Huang, Y ., Xiao, Z., W ang, D., Jiang, H., W u, D., 2019. Exploring individual travel patter ns across private car trajectory data. IEEE Transactions on Intelligent T ranspor tation Sys tems 21, 5036–5050. [21] Ja ved, M.U ., Jav aid, N., Malik, M.W ., Akbar , M., Samuel, O., Y aha ya, A.S., Othman, J.B., 2022. Blockchain based secure, efficient and coordinated energy trading and dat a shar ing between electr ic vehicles. Cluster Comput. 25, 1839–1867. [22] Jebli, I., Belouadha, F .Z., Kabbaj, M.I., Tilioua, A., 2021. Prediction of solar ener gy guided b y pearson correlation using machine lear ning. Energy 224, 120109. [23] Jeunen, O., Sagt ani, H., Doi, H., Karimov , R., Pokharna, N., Kalim, D., Ustimenk o, A., Green, C., Mehrotra, R., Shi, W ., 2023. On gradient boosted decision trees and neural rankers: a case-study on short-video recommendations at sharechat, in: Proceedings of the 15th Annual Meeting of the For um for Information Retrieval Evaluation, pp. 136–141. [24] Lee, Z.J., Li, T ., Low , S.H., 2019. Acn-data: Analysis and applications of an open ev char ging dataset, in: Proceedings of the tenth ACM international conf erence on future energy systems, pp. 139–149. [25] Long, W ., Li, T., Xiao, Z., W ang, D., Zhang, R., Regan, A.C., Chen, H., Zhu, Y ., 2022. Location prediction for individual vehicles via exploiting tra vel regularity and preference. IEEE T ransactions on V ehicular T echnology 71, 4718–4732. [26] Ma, T.Y ., Fay e, S., 2022. Multistep electric vehicle charging station occupancy prediction using hybrid LSTM neural networks. Energy (Oxf.) 244, 123217. [27] Mahdi, A.J., Te ttamanti, T ., Esztergár -Kiss, D., 2023. Modeling the time spent at points of interest based on google popular times. IEEE Access 11, 88946–88959. [28] Malek, Y .N., Najib, M., Bakhouy a, M., Gaber, J., 2023. Helecar -d: A dat aset f or urban electro mobility in moroccan context. Data in Brief 48, 109080. [29] Mao, M., Lu, J., Zhang, G., Zhang, J., 2015. A fuzzy content matching-based e-commerce recommendation approach, in: 2015 IEEE International Conf erence on Fuzzy Systems (FUZZ-IEEE), IEEE. pp. 1–8. [30] Marlin, R., Jurdak, R., Abuadbba, A., Ruj, S., Miller, D., 2024. Electr ic vehicle next charge location prediction. IEEE Transactions on Intelligent Transportation Sys tems . [31] Mehedi, S.T ., Islam, C., Ramachandran, G., Jurdak, R., 2026. Dysec: a mac hine learning-based dynamic analysis for detecting malicious packag es in pypi ecosystem. IEEE Transactions on Inf ormation Forensics and Security . [32] Mieszko wicz-Rolka, A., Rolka, L., 2020. Preference-oriented fuzzy topsis method, in: International Conf erence on Intelligent and Fuzzy Systems, Springer . pp. 758–766. [33] Moay edikia, A., Jensen, R., Samimi, A., 2026. Trust-enhanced poi recommendation algorit hm using expectation-maximization. Social Netw ork Anal ysis and Mining 16, 17. [34] Mohamed, A.A., Shaier , A.A., Metwall y, H., Selem, S.I., 2023. Wireless charging technologies for electric v ehicles: Inductive, capacitive, and magnetic gear . IET Po wer Electronics . [35] Oard, D.W ., Kim, J., et al., 1998. Implicit feedbac k for recommender systems, in: Proceedings of the AAAI workshop on recommender systems, Madison, WI. pp. 81–83. [36] Pahal, S., Rathee, N., 2021. Evaluating uncer tainty of measurement while predicting location in smar t vehicles. MAP AN 36, 377–388. [37] Posla vskaya, E., Kor olev , A., 2023. Encoding categorical data: Is there ye t anything’hotter ’ t han one-hot encoding? arXiv preprint arXiv:2312.16930 . [38] Rahman, M.M., Barros, A., Jurdak, R., et al., 2025. A survey of coordination techniques for ev–e v energy trading. T echRxiv . doi: 10.36227/ techrxiv.175328646.62175361/v1 . [39] Rossi, A., Barlacchi, G., Bianchini, M., Lepri, B., 2019. Modelling t axi dr ivers ’ behaviour f or t he next destination prediction. IEEE Transactions on Intelligent T ranspor tation Sys tems 21, 2980–2989. [40] Sinnott, R.W ., 1984. Virtues of the ha versine. Sky and telescope 68, 158. [41] Sodhi, B., T V , P ., 2012. A simplified description of fuzzy topsis. arXiv preprint arXiv :1205.5098 . [42] Song, C., Qu, Z., Blumm, N., Barabási, A.L., 2010. Limits of predictability in human mobility . Science 327, 1018–1021. [43] Sun, Y ., Xiang, Y ., Zou, D., Li, N., Chen, H., 2024. A multi-objectiv e recommender system f or enhanced consumer beha vior prediction in e-commerce, in: 2024 IEEE 6th Inter national Conference on Po wer, Intelligent Computing and Systems (ICPICS), IEEE. pp. 884–889. [44] Tian, Z., Jung, T., W ang, Y ., Zhang, F., T u, L., Xu, C., Tian, C., Li, X.Y ., 2016. Real-time charging station recommendation system f or electric-vehicle taxis. IEEE T ransactions on Intelligent Transportation Sy stems 17, 3098–3109. : Preprint submitted to Elsevier P age 32 of 33 [45] V arg a, B.O., Sagoian, A., Mariasiu, F ., 2019. Prediction of electric v ehicle range: A comprehensive review of current issues and challenges. Energies 12, 946. [46] V enticinque, S., Nacchia, S., 2019. Lear ning and prediction of e-car charging requirements f or flexible loads shif ting, in: Inter net and Distributed Computing Systems. Springer International Publishing, Cham, pp. 284–293. [47] W ang, Y ., Zhang, D., Liu, Y ., Tan, K.L., 2019. Trajectory forecas ting with neural networks: An empir ical evaluation and a new hybrid model. IEEE Transactions on Intelligent Transportation Sys tems 21, 4400–4409. [48] W ang, Z., Abolarin, E., W u, K., Rebba, V ., Hu, J., Hu, Z., Bao, S., Zhou, F., 2025. Beyond charging anxiety: An explainable approach to understanding user pref erences of ev charging stations using review data. arXiv prepr int arXiv:2507.03243 . [49] Winarno, E., Hadikur nia wati, W ., Rosso, R.N., 2017. Location based ser vice for presence system using haversine method, in: 2017 inter national conf erence on innov ative and creative information technology (ICITech), IEEE. pp. 1–4. [50] Yi, Z., Liu, X.C., W ei, R., Chen, X., Dai, J., 2021. Electr ic vehicle c harging demand forecas ting using deep lear ning model. Jour nal of Intelligent Transportation Sys tems: Technology , Planning, and Operations doi: 10.1080/15472450.2021.1966627 . [51] Zehlike, M., Y ang, K., Stoyano vich, J., 2022. Fairness in ranking, par t ii: Lear ning-to-rank and recommender systems. ACM Computing Survey s 55, 1–41. [52] Zhao, K., Zhang, M., Lu, R., Shen, C., 2022. A secure intra-regional-inter-regional peer-to-peer electr icity trading system for electr ic vehicles. IEEE Trans. V eh. T echnol. 71, 12576–12587. : Preprint submitted to Elsevier P age 33 of 33
Original Paper
Loading high-quality paper...
Comments & Academic Discussion
Loading comments...
Leave a Comment