PASTA: A Modular Program Analysis Tool Framework for Accelerators
The increasing complexity and diversity of hardware accelerators in modern computing systems demand flexible, low-overhead program analysis tools. We present PASTA, a low-overhead and modular Program AnalysiS Tool Framework for Accelerators. PASTA ab…
Authors: Mao Lin, Hyeran Jeon, Keren Zhou
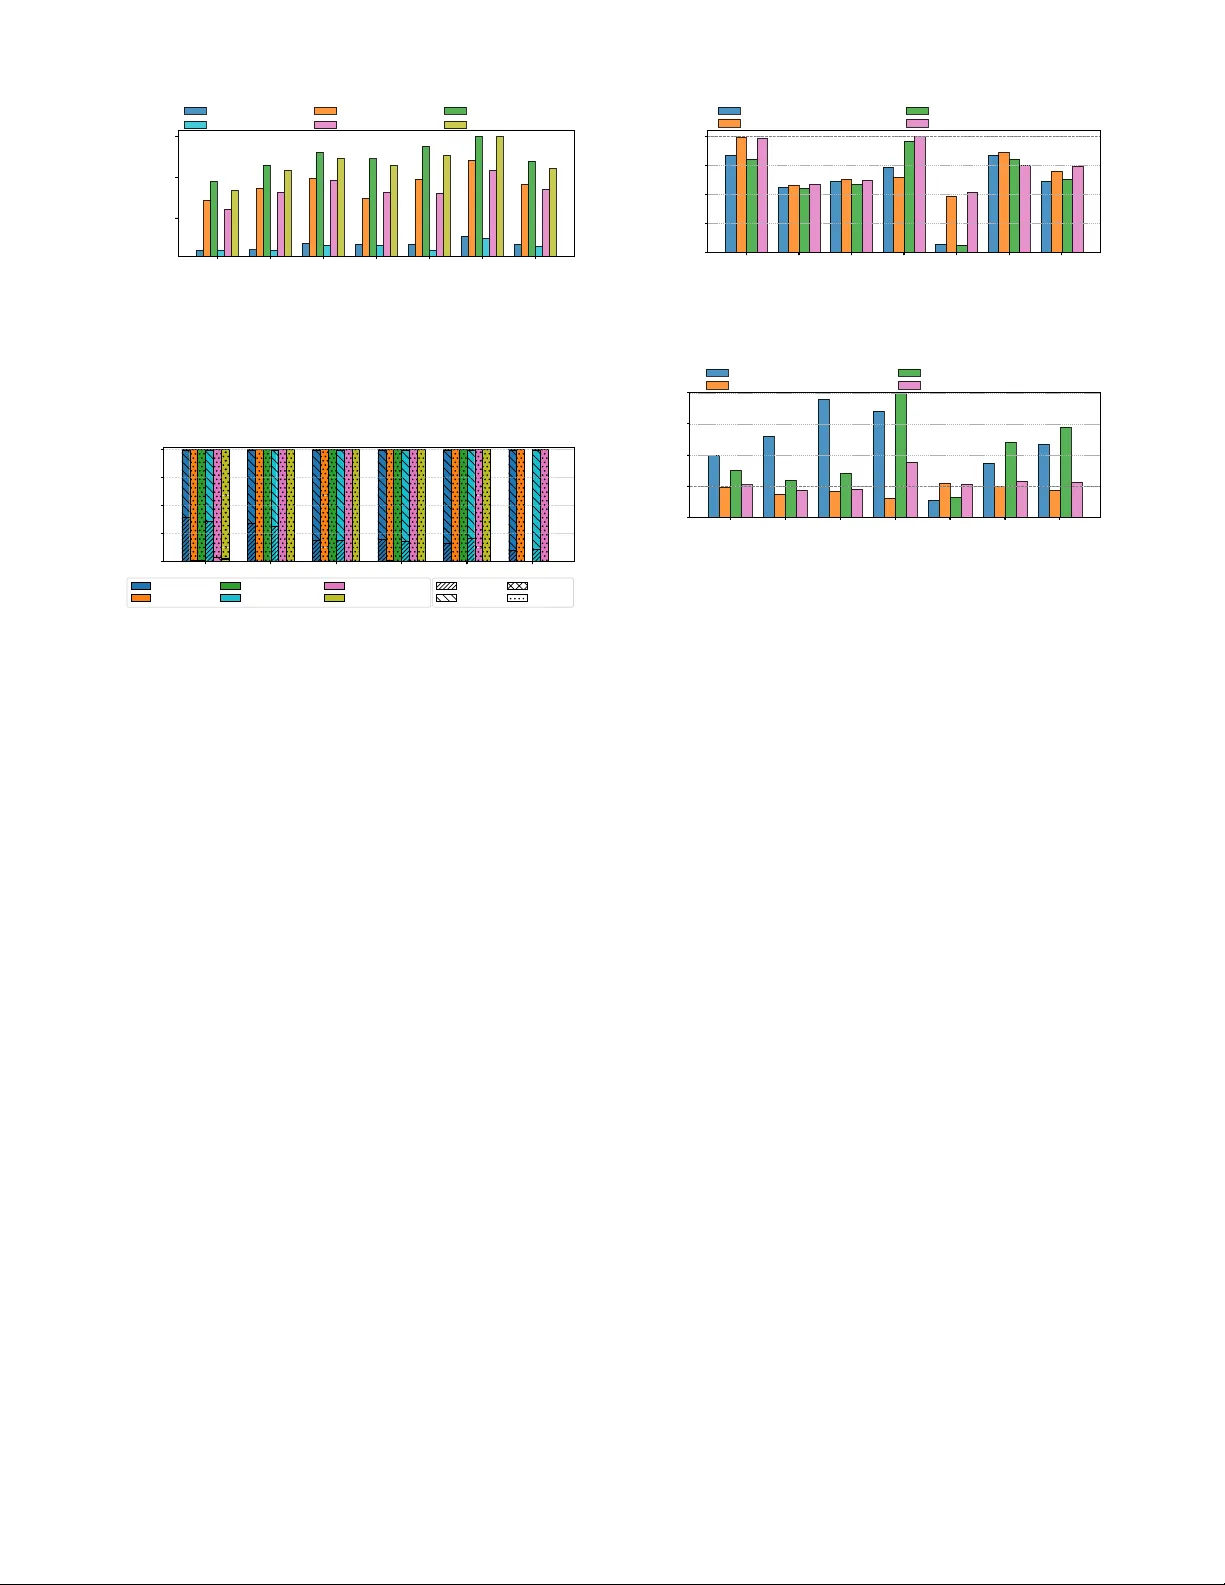
P AST A: A Modular Program Analysis T ool Frame work for Accelerators Mao Lin ∗ , Hyeran Jeon ∗ , K eren Zhou † ‡ , ∗ Uni versity of California, Merced, USA † George Mason Uni versity , USA ‡ OpenAI, USA Abstract —The increasing complexity and div ersity of hard ware accelerators in modern computing systems demand flexible, low- overhead program analysis tools. W e present P A S T A , a low- overhead and modular Program AnalysiS Tool Framework for Accelerators. P A S T A abstracts over low-lev el profiling APIs and diverse deep lear ning frameworks, offering users a unified inter - face to capture and analyze runtime events at multiple levels. Its extensible design enables r esearchers and practitioners to rapidly prototype custom tools with minimal overhead. W e demonstrate the utility of P A STA by dev eloping se veral analysis tools, including tools for deep learning workload characterization and UVM optimization. Through extensive evaluations on mainstream deep learning workloads tested on NVIDIA and AMD GPUs under both single- and multi-GPU scenarios, we demonstrate P A S T A ’ s broad applicability . On NVIDIA GPUs, we further show that P A STA provides detailed performance insights with significantly lower overhead (up to 1.3 × 10 4 faster) than con ventional analysis tools, thanks to its GPU-accelerated backend. P A S T A strikes a practical balance between usability , extensibility , and efficiency , making it well-suited for moder n accelerator -based computing en vironments. Index T erms —Perf ormance Analysis, Performance T ool, GPU Computing, Deep Learning, NVIDIA GPU , AMD GPU , Hetero- geneous Accelerator I . I N T RO D U C T I O N W ith Moore’ s Law nearing its physical limits, the escalating computational needs of emer ging big data workloads ha ve ush- ered in the era of domain-specific computing. V arious acceler- ators, such as GPUs and TPUs, ha ve emerged as essential com- pute engines with their massi ve parallelism and specialized compute capabilities. T o fully exploit the compute capabilities of these accelerators, understanding workload beha vior and identifying performance bottlenecks are crucial. Howe ver , the massiv e parallelism within individual accelerators, combined with their asynchronous interactions with CPUs, complicates the task of performance analysis and hinders the deduction of actionable optimization insights. T o address this, accelerator vendors of fer performance analysis tools such as NVIDIA Nsight Systems [1] and AMD R OCm Profiler [2], which help dev elopers analyze ex ecution behavior and performance met- rics. Despite their usefulness, these v endor-pro vided tools ha ve notable limitations including limited fle xibility and extensibility and inadequate support for emerging workloads . These tools typically focus on predefined general-purpose metrics and This paper has been accepted to the IEEE/ACM International Symposium on Code Generation and Optimization (CGO), 2026. often fail to meet the needs of user-specific performance anal- ysis. For example, NVIDIA Nsight Systems provides timeline- based views of CPU and GPU acti vity , but it lacks the ability to capture fine-grained memory reuse patterns or associate memory acti vity with high-level model structures in deep learning (DL) workloads. Furthermore, vendor tools primarily capture ev ents from low-le vel profiling libraries [2], [6], [7] and attribute them to general program context, offering limited visibility into higher-le vel behaviors specific to modern DL framew orks like PyT orch [8] and T ensorFlo w [9]. F or e xample, these frame works introduce their own memory allocators and ex ecution models (e.g., kernel grouping by layers), which result in unique runtime patterns and performance characteris- tics. While DL frameworks integrate their own profilers, such as the PyT orch Profiler [3] and T ensorFlo w Profiler [4], these profilers only expose high-lev el model behaviors and lack the capability to trace low-le vel accelerator performance details and are not easily extensible. T o support custom performance analysis, accelerator ven- dors also expose low-le vel programming interfaces and li- braries [10]–[13], enabling dev elopers to build performance analysis tools tailored to their specific needs. Ho wever , this approach often requires comprehensive knowledge of accel- erator architecture, lo w-level programming models, as well as considerable dev elopment effort. In addition, while various community-dev eloped tools exist for accelerator performance analysis, they only tar get specific inef ficiency problems or specialized use cases [14]–[18]. Their limited extensibility poses challenges for generalization to a broader range of program analysis tasks. Giv en the increasing demand for performance analysis tools tailored to emerging workloads and the limitations of existing solutions, we present P A S T A , a low-o verhead modular program analysis tool framew ork for accelerators. T o the best of our knowledge, P A S T A is the first frame work designed to support cross-vendor accelerators and di verse DL workloads with ex- tensibility . P A S T A of fers se veral key advantages over existing solutions. 1) Modularity and extensibility . P A S T A can be easily e xtended to meet user-specific performance analysis needs by allowing de velopers to create custom analyses with simply ov erriding functions in the P A S T A tool collection template. 2) Cross-vendor support. P A S T A abstracts away the differences among vendor -specific profiling interfaces through unified P A S T A ev ent handlers, which support monitoring on various accelerator architectures. 3) DL framework integra- T ABLE I: Comparison of P A S T A with tools from accelerator vendors and deep learning framew orks. T ool/Fuctionalities NVIDIA Supported 1 AMD Supported 2 DL Framework Supported 3 Low-o verhead (GPU-accelerated) Extensibility Open- Sourced P A S T A (Ours) ✓ ✓ ✓ ✓ ✓ ✓ NSight Systems [1] ✓ ✗ ✗ ✗ ✗ ✗ R OCProfiler [2] ✗ ✓ ✗ ✗ ✗ ✓ PyT orch Profiler [3] ✗ ✗ ✓ ✗ ✗ ✓ T ensorFlow Profiler [4] ✗ ✗ ✓ ✗ ✗ ✓ Omniperf [5] ✗ ✓ ✗ ✗ ✗ ✓ 1 , 2 : T ools can analyze standard NVIDIA CUD A and AMD ROCm programs with low-le vel vendor library information. 3 : T ools can capture and analyze deep learning framework-specific e vents, such as tensor allocation and destruction tion. P A S T A supports DL framework-specific events capturing functionalities (e.g., operator execution and tensor allocation) to provide a more holistic view of workload behavior . 4) Low- overhead design. P A S T A is designed with analysis ef ficiency in mind, aiming to reduce runtime impact and accelerate the processing of performance data. It lev erages lightweight hooks provided by vendor profiling interfaces and DL framework callbacks, minimizing instrumentation overhead. Additionally , P A S T A includes an e vent processor that preprocesses ra w runtime data and performs preliminary analysis on GPUs, accelerating the processing of large volumes of data generated by massively parallel accelerator ex ecutions. T able I compares the key advantages of P A S T A with the tools provided by accelerator vendors and DL frame works. T o demonstrate the practical utility of P A S TA , we dev elop sev eral analysis tools as case studies, including a DL workload characterization tool and a Unified V irtual Memory (UVM) optimization tool. These tools are implemented with minimal effort thanks to P A S T A ’ s extensible framework and can be ap- plied to div erse DL models. The case studies rev eal actionable insights, such as identifying kernel bottlenecks, quantifying underutilized memory regions, and optimizing UVM prefetch- ing strategies, with significantly lower overhead compared to existing profiling tools, particularly due to P A S T A ’ s GPU- accelerated analysis design. Our contrib utions are as follows: • T o the best of our knowledge, P A S T A is the first program analysis framework that supports emerging DL workloads and accelerators from multiple vendors, including both NVIDIA and AMD GPUs. • P A S T A ’ s modular and extensible design allows it to be easily tailored to div erse performance analysis needs, which significantly speeds up the optimization and dev elopment processes. • W e demonstrate the ef fecti veness of P A S TA through case studies on single- and multi-GPU scenarios, which demon- strate substantially reduced analysis time and unique in- sights with P A S TA compared with the existing vendor- specific profiling tools. • P A S TA is fully open-sourced under the MIT license 1 and includes a detailed user guide for conducting performance analysis with some tools built using P A S TA , as well as a dev eloper guide for extending P A S TA for their own 1 Source code av ailable at: https: // github . com / AccelProf / AccelProf performance analysis needs 2 . I I . B A C K G RO U N D A N D R E L A T E D W O R K This section uses GPUs as an example accelerator , while P A S TA can be used for any accelerators that have APIs with which a host CPU can monitor v arious execution status. A. GPU P erformance Analysis Due to massive parallelism and asynchronous interactions with a host CPU, GPU-accelerated applications pose chal- lenges for performance analysis. T o support analysis, GPU vendors provide various tools such as NVIDIA ’ s Nsight Sys- tems [1] and Nsight Compute [19], AMD’ s R OC Profiler [2] and Omniperf [5], and Intel’ s VT une Profiler [20]. These tools profile low-le vel activities of architectural components, but those profiling results often lack application semantics and insufficient to pro vide meaningful insights for optimization, making them difficult to use directly for performance tuning. T o address these limitations, se veral analysis tools have been dev eloped using vendor -provided interfaces. DrGPUM [14] and Diogenes [21] pinpoint memory-related inef ficiencies, such as inefficient CPU-GPU memory transfers. V alueExpert and GVProf [15], [22] identify value-related inefficiencies in GPU-accelerated applications. Nayak et al. proposed a tool that identifies redundant and improper synchronization opera- tions in GPU programs [17]. GV ARP [18] detects performance variance in large-scale heterogeneous systems and provides insights to locate the root causes. CUD AAdvisor [23] performs fine-grained GPU kernel analysis, including memory reuse distance and div ergence analysis, offering actionable insights for optimization. While these tools enable more comprehen- siv e performance analysis, as each tool is designed for certain inefficiencies of the target GPUs, users should identify the right tools for each target analysis. Some tools, such as HPC- T oolkit [24] supports a more general performance analysis on both NVIDIA and AMD GPUs. Howe ver , they primarily focus on HPC workloads and do not support emerging workloads such as DL models. Giv en the diversity of accelerators and workloads, a more extensible solution is needed to support broader analyses. B. DL W orkload P erformance Analysis W ith the increasing importance of DL models for almost all computing domains, performance optimization of DL work- loads is one of the most critical research topics of today . 2 User and dev eloper documentation: https: // accelprofdocs . readthedocs . io PA S T A T o o l C o l l e c t i o n NVIDIA Normal CUDA GP U A n a l y s i s CP U P r e - pr o c e s s PA S T A Ev e n t P ro c e s s o r PA S TA To o l 1 Di s p a t c h U n i t DL Wo r k l o a d AMD Normal ROCm DL Wo r k l o a d Incomi ng Acceler ator s … In t e r f a c e St a n d a r d iz a t io n PA S T A Ev e n t H a n d l e r Pr o f i l i n g Ut i l i t i e s Co n f i g u r a t i o n Lo w - le v e l I n t e r f a c e H a n d lin g PA S TA To o l 2 PA S TA To o l 3 Mor e T o ols … P rog ram A nalysi S T ool Framewor k f or A cceler at ors ( PAS TA ) Fig. 1: Design of P A S TA . Howe ver , most of the DL frameworks are designed to be DL practioner-friendly while hiding backend interactions with accelerators [25], [26]. While this abstraction helps DL model designers to focus on the model architecture without concern- ing systems and hardware-side activities, it complicates exe- cution analysis and optimization using traditional performance tools. T o tackle this issue, DL frameworks hav e introduced their own performance analysis tools, such as PyT orch Profiler [3], T ensorFlo w Profiler [4] and J AX Profiler [27]. While these framew ork-native performance analysis tools are useful, they hav e several limitations: (1) they lack support for expos- ing low-le vel details of accelerators, (2) the y often require significant programming effort to configure, and (3) they support limited profiling metrics, which lack flexibility and extensibility for customized analysis. T o overcome these limitations, third-party DL performance analysis tools have been introduced. NVIDIA provides DL- Prof [28], which aggregates kernel performance data from tools like Nsight Systems and n vprof and offers layer -wise kernel performance summaries. DeepContext [16] links call stacks from high-level Python code to underlying accelerator C/C++ libraries, enabling the identification of inefficiencies in DL codebases. RL-Scope [29] collects cross-stack profiling information (e.g., CUD A API time and GPU kernel time) and provides a detailed breakdown of CPU/GPU ex ecution time. Hotline Profiler [30] detects runtime bottlenecks in DL workloads and presents them using multi-scale timeline visu- alizations. Despite these advances, these tools either support only specific target inef ficiencies or remain closed-source, thus are difficult to extend for customized analysis across diverse DL workloads. I I I . D E S I G N A N D M E T H O D O L O G Y A. Over all Design Figure 1 shows the architecture of P A S TA , which consists of three modular components: P A S TA Event Handler , P A S TA Event Pr ocessor , and P A S TA T ool Collection . The event han- dler interf aces directly with low-le vel, v endor-specific profiling APIs and high-level DL framew ork callbacks to configure. T ABLE II: List of Supported Events in P A S TA . Low-Lev el Accelerator Events Coarse-Grained Host-Called API Events All Driver Functions All Runtime Functions Synchronization Kernel Launch Memory Copy Memory Set Resource Operations Batch Memory Operations Fine-Grained Device-Side Operations Thread Block Entry Thread Block Exit Global Memory Access Shared Memory Access Barrier Instruction Device Function Call Device Function Return Device-Side Malloc Device-Side Free Global-T o-Shared Copy Pipeline Commit Pipeline W ait Remote Shared Memory Access Cluster Barrier Any Specific Instruction High-Level DL Framework Events Operator Start Operator End T ensor Allocation T ensor Reclamation Layer Boundary* Forward/Backw ard Boundary* Customized Code Region* * Requires manual insertion of P AS TA annotations, as discussed in Section III-F1. This layer abstracts away the complexity of diverse accelerator platforms and enables consistent ev ent collection across hard- ware vendors. Built atop the event handler , the event processor acts as the dispatch and preprocessing layer . It standardizes heterogeneous runtime information through a unified interface and performs preprocessing on either the CPU or GPU. This component transforms raw profiling data into structured insights suitable for higher-le vel analysis. The tool collection hosts user-defined analysis tools that retriev e runtime data via the standardized interface and perform customized analyses such as kernel profiling or memory characterization. All three components are designed in independent modules so that each can be separately upgraded without modifying the other modules. For instance, supporting a new accelerator only requires updating the event handler , while users can add new tools without changing the handler or processor . This modular , extensible design makes P A S TA suitable for diverse accelerators and targeted, lo w-ov erhead analysis. B. P A S TA Modules Event handler: In P A S TA , the ev ent handler module is respon- sible for initializing and setting up the profiling utilities. It ab- stracts the comple xities of v endor-specific profiling APIs and DL framew ork callbacks, and provides a comprehensive set of handler functions for both coarse-grained and fine-grained runtime ev ents on accelerators. Coarse-grained ev ents include kernel launches, memory copy operations, and synchronization calls, while fine-grained events capture individual thread-level activities, such as memory accesses by each thread. In addition to low-le vel, “bare-metal” vendor -specific ev ents, P A S TA also monitors high-lev el DL framework-specific events, such as tensor allocation and operator execution. T able II summarizes … 0 … 1023 … N … Tra c e B u f f e r ( S t a l l W h e n F u l l ) Fetch (Full) Reset & Resume GPU CP U (a) Con ventional GPU-based trace col- lection with CPU-side analysis. The GPU stalls when the trace buffer is full, waiting for the CPU to fetch and flush the data. … 0 … 1023 … N … GPU CP U … … PASTA Analysis Threads 0 … 1023 … N Result Buffer Fetch (End) (b) P A S TA ’ s GPU-resident collect- and-analyze model. GPU threads per- form in-situ analysis, avoiding stalls and reducing CPU-GPU overhead. Fig. 2: Comparison of CPU- and GPU-based analysis models. the complete set of e vents currently supported by P A S TA . P A S TA ’ s extensible design allo ws new events to be supported by adding handler functions in the e vent handler module. Event processor: The event processor module pre-processes raw data captured by the event handler and dispatches it to the corresponding P A S TA tool for customized analysis. It also normalizes event metadata across frame works and profiling utilities, handling inconsistencies (e.g., neg ati ve vs. positiv e size for memory release) and extracting relev ant details, such as grid configurations for kernel launch events or copy direc- tions for memory copy operations, based on ev ent type. T o enable low-o verhead analysis, the ev ent processor adopts GPU-accelerated analysis by launching helper device functions that employ groups of GPU threads (e.g., warps in NVIDIA GPUs) to concurrently process collected data. When an e vent is triggered on the GPU (e.g., a memory access), the profiling library records the instruction into a device buf fer . A helper device function then processes many of these events concur- rently , significantly accelerating performance analysis. Fig- ure 2 compares CPU- and GPU-based analysis models. Specif- ically , Figure 2a shows the conv entional GPU-based trace collection with CPU-side analysis, which is used in vendor- provided tools such as the NVBit MemTrace tool [31] and the Compute Sanitizer MemoryTrack er tool [32]. Figure 2b demonstrates how P A S TA adopts a GPU-resident collect-and- analyze model, effecti vely avoiding stalls and reducing CPU- GPU communication overhead. T ool collection: The collection module provides templates for customized analyses, and the user can retriev e all or a subset of ev ents from the ev ent processor module to conduct customized analyses for their own program analysis needs. For example, they can e xtract tensor allocation and operator ex ecution ev ents to analyze memory usage or ex ecution behavior in DL workloads, or retrie ve kernel launch information to identify the most frequently in vok ed kernels. W e show several use cases in Section V. C. W orkflow Figure 3 sho ws the workflo w of P A S TA . P A S TA takes binary ex ecutable files of GPU-accelerated applications as input, without requiring access to the source code. This mak es P A S TA particularly suitable for analyzing closed-source libraries such as CUDNN [33] and CUBLAS [34]. During ex ecution, when Binary Appli cation (closed - so urce libraries e.g., CUDNN, CUBLAS) DL Workloads (e.g., CNN and LLM on DL Framewo rks) PA S TA Event H an dl er PA S TA Event Processo r PA S TA Too l 1 PA S TA Too l 2 PA S TA Too l 3 PA S TA Too l Co l l ec t i on GPU Preprocess CPU Preprocess Dispatch Unit Framewo rk Callbacks Profilin g APIs Unifi ed Interf ace 1 2 3 4 Fig. 3: W orkflow of P A S TA . an e vent listed in T able II occurs, the corresponding callback function in the P A S TA ev ent handler module is in vok ed ( ❶ and ❷ ), which collects meta and runtime information related to these e vents for subsequent processing. Once data collection is complete, the relev ant function in the ev ent processor pre- processes the g athered ra w data ( ❸ ). CPU preprocess functions handle coarse-grained ev ents (e.g., memory allocations and kernel launches), while GPU preprocess functions manage fine-grained ev ents (e.g., memory accesses). Next, the dispatch unit routes the pre-processed data to a specific P A S TA tool defined within the P A S TA collection ( ❹ ). The selected tool then analyzes the data and generates performance reports about program behavior . Users can specify the desired P A S TA tool via a command-line option or an en vironment variable, allowing flexible tool selection based on specific analysis. D. Support for Diverse GPU Platforms T o support GPUs from different vendors, P A S TA provides a set of uniform, decoupled interfaces within its ev ent handler . These interfaces simplify inte gration and ensure consistent ev ent collection across platforms. For NVIDIA GPUs, P A S TA takes adv antage of callbacks from both the NVIDIA Compute Sanitizer APIs [10] and NVIDIA NVBit [11]. The NVIDIA Compute Sanitizer APIs offer lightweight and intuitive call- backs that reduce dev elopment effort. Howe ver , the y can only inspect a subset of instructions, such as memory and barrier operations. In contrast, NVIDIA NVBit offers more comprehensiv e coverage by covering all SASS instructions. This increased flexibility , howe ver , requires substantial dev el- opment effort and potentially incurs higher runtime o verhead. P A S TA allows users to ha ve the flexibility to choose either of these libraries independently or use both in conjunction to gain insights into their code execution. For AMD GPUs, P A S TA integrates with the R OCprofiler-SDK tool library [12]. These APIs are analogous to NVIDIA ’ s Compute Sanitizer callbacks and enable P A S TA to capture memory , kernel, and synchronization ev ents on AMD platforms with the same interface. As a result, P A S TA of fers consistent cross-vendor support for profiling and analysis. E. Support for Diverse DL F rame works In DL frameworks, resources and GPU kernel ex ecutions are hierarchically managed, which often makes it challenging to adopt vendor -provided tools to gather insightful feedback [35]. For example, in PyT orch and T ensorFlo w , GPU memory is managed via memory pools [36]. While pooled memories are first allocated via vendor-pro vided memory APIs (e.g., cudaMalloc or HipMalloc ), subsequent allocations and releases of tensors are managed by memory pools that employ framew ork-specific memory management algorithms, which 1 + import pasta 2 # forward function of the model 3 def forward(): 4 ... # other layers 5 + pasta.start() 6 self.transformer_layer() # targeted region 7 + pasta.stop() Listing 1: An example of layer -wise analysis support. are often challenging to track synchronously with hardware ev ents. Furthermore, DL frameworks run one or multiple kernels within a single operator to complete a specific com- putation, where this operator-to-kernel mapping information is hidden from the users. T o solve these challenges, P A S TA lev erages the callbacks [37] provided by DL frameworks to integrate high-level framework statistics into the event handler module. Note that P A S TA can collect low-le vel accelerator- related ev ents and high-le vel DL frame work-specific e vents concurrently , which fills the gap between vendor -provided and DL-framew ork-provided profiling tools. F . Advanced F eatur es 1) Range-Specific Analysis: It is common to analyze a spe- cific sub-re gion of an application rather than the entire appli- cation. P A S TA supports range-specific analysis to facilitate this need. F or standard GPU applications, users can define the en vi- ronment variables START_GRID_ID and END_GRID_ID to specify the subset of kernel launches to analyze. Additionally , P A S TA provides support for Python annotations via the pasta package. Listing 1 shows an example usage of the pasta package. Users can annotate specific code regions they wish to analyze or profile using pasta . start and pasta . end (Lines 5 and 7). This feature is particularly useful in DL workloads, where individual layers typically have distinct behavioral character- istics. By lev eraging this capability , users can conduct fine- grained analysis at the layer lev el, distinguish between forward and backward passes, or define any custom analysis range. Although e xisting DL profiling tools of fer similar annotation capabilities, P A S TA distinguishes itself through its minimal and non-intrusiv e API design. Users can annotate regions of interest by simply inserting pasta . start and pasta . end , without needing to configure additional logging infrastruc- ture or modify the ex ecution context, enabling fine-grained performance analysis with minimal disruption to the original codebase. 2) Inef ficiency Location Utilities: Identifying the source of performance inef ficiencies is essential for ef fecti ve opti- mization. P A S TA provides cross-level location utilities that help dev elopers pinpoint inef ficient code at both high-level Python and low-le vel C/C++ lev els, significantly simplifying the debugging and optimization process. In contrast, many existing analysis tools offer only partial visibility , such as lo w- lev el C/C++ backtraces (e.g., NVIDIA Nsight Systems [1]) or high-lev el Python call stacks (e.g., PyT orch Profiler [3]), thus failing to deli ver a comprehensiv e cross-lev el context for diagnosing inef ficiencies. torch/aten / src / ATen / cuda/CUDABlas.cpp: 771 at::cuda::blas::gemm_and_bias() torch/aten / src / ATen/native/cuda/Blas.cpp: 281 operator() torch/aten / src / ATen/native/cuda/Blas.cpp: 281 addmm_out_cuda_impl torch/build/aten / src / ATen/RegisterCUDA.cpp: 17434 wrapper_CUDA_addmm ... ../sysdeps / nptl/libc_start_call_main.h: 58 __libc_start_call_main ../csu / libc - start.c : 392 __libc_start_main_impl anaconda3/.../torch/nn/modules/linear.py: 114 def forward() anaconda3/.../torch/nn/modules/module.py: 1527 def _call_impl() anaconda3/.../torch/nn/modules/module.py: 1518 def _wrapped_call_impl() models/bert / bert_pytorch/model/utils/feed_forward.py: 16 def forward() ... models/bert/run_bert.py: 146 def test_bert() models/bert/run_bert.py: 177 def () Python C/C++ Fig. 4: Cross-layer call stack of the kernel with highest memory reference count during BER T inference. The trace spans Python-level code, PyT orch modules, and low-le vel C++/CUD A operations. P A S TA enables selective control through a set of prede- fined knobs, such as MAX_MEM_REFERENCED_KERNEL and MAX_ CALLED _ KERNEL , which identify the kernel with the most memory references and the most frequent inv ocations, respectiv ely . Users can easily extend this mechanism with custom knobs to locate specific inefficiencies while avoiding the high ov erhead of capturing full context information for all runtime e vents. Figure 4 presents the call stack of the kernel with the highest memory reference count during BER T inference. This visualization enables users to easily identify the most memory- intensiv e kernel, at :: cuda :: blas :: gemm _ and _ bias , facilitating targeted optimization for BER T execution on memory-bound systems. G. Gener alization to Emerging Accelerators and W orkloads Support for Emerging Accelerators and W orkloads. P A S TA ’ s architecture is designed to be adaptable beyond GPU- based accelerators and DL workloads. P A S TA can support accelerators if the accelerators provide runtime ev ent instru- mentation APIs, such as memory operations, kernel dispatch ev ents, and synchronization points. Once the ev ent APIs are provided, P A S TA can be extended by implementing a backend handler that maps device-specific ev ents (e.g., for Google TPUs, systolic-array operations or TPU counters) into P A S TA ’ s unified e vent format. Like wise, P A S TA can also support workloads beyond DL because P A S TA design is application agnostic. As far as the user specifies the region of interest based on his/her semantic knowledge of the target application, P A S TA can be used for analyzing any applications, such as graph analytics or HPC applications. Handling Differences in Lo w-Lev el Event Semantics. P A S TA tar gets heterogeneous accelerators used as CPU co- processors. Although terminologies may differ , many runtime ev ents share common semantics: kernel launch ev ents record grid size and kernel name, memory allocation events record address and size, and memory copy ev ents specify size and transfer direction. P A S TA ’ s ev ent handler normalizes such in- consistencies in event formats, naming con ventions, and timing P rog ram A nalysi S T ool Framework f or A ccelerator s ( PA S TA ) User Code // Allocate memory cudaMalloc (& p , size ) ... // Launch kernel Kernel <<< x, y >>> ( p ); // Allocate memory hipMalloc (& p , size ) ... // Launch kernel Kernel <<< x, y >>> ( p ); Real - world Applications (Diverse accelerators, DLs) High - level DL Callbacks // Tensor callback c10 :: reportMemoryUsage (...) // Operator callback at :: RecordFunctionCallback (...) // cudaMalloc callback SANITIZER_..._MEMORY_ALLOC // kernel launch callback SANITIZER_CBID_LAUNCH_BEGIN // hipMalloc callback ROCPROFILER_HIP_..._hipMalloc // kernel launch callback ROCPROFILER_..._hipLaunchKernel Low - level V end or APIs (NVIDIA) Low - level V end or APIs (AMD) Va r i o u s P r o f i l i n g A P I s / L i b ra r i e s (Architecture knowledge, Eff ort, etc.) PA S TA Ev e n t Ha n dl e r /* Utils enabling & configuration */ ... // tensor handler PASTA :: tensor_call_handler (...) // operator handler PASTA :: op_call_handler (...) // cudaMalloc handler PASTA :: memory_call_handler (...) // kernel handler PASTA :: kernel_call_handler (...) ... // much more handler Standardiz ed Interf aces (Hide Low - level Details, Save Dev E fforts.) PA S TA Even t Pro ce ss or /* Accelerated inst preprocess */ __device__ inst_preprocess (); // tensor preprocess & dispatch PASTA :: tensor_info_process (...) // op preprocess & dispatch PASTA :: op_info_process (...) // memory preprocess & dispatch PASTA :: memory_info_process (...) // kernel preprocess & dispatch PASTA :: kernel_info_process (...) ... // more preprocess & dispatch Auto Disp atch a nd Acceler ate Analysis (Easy to Extend, Speedup Profiling) PA S TA To o l C o ll e c t i on // analysis template PASTA :: tensor_analysis (...) PASTA :: op_process (...) PASTA :: memory_analysis (...) PASTA :: kernel_analysis (...) ... // Customized Analysis // e.g., DL analysis TOOL1 :: tensor_analysis (...) TOOL1 :: op_analysis (...) // Customized Analysis (e.g., Kernel Analysis ) TOOL2 :: kernel_analysis (...) PA S TA To o l Te m p l a t e PA S TA To o l 1 PA S TA To o l 2 Unified T ool Te m pl a t e (Flexible & Customized Analysis) Profiling Utilities # create tensor x x = torch.randn ( m , n ) # create tensor y y = torch.randn ( n , p ) ... # start matmul operator z = torch.matmul ( x , y ) Func tio n Invo catio n C hai n Fig. 5: Codebase structure of P A S TA . metadata. For instance, some runtimes report memory deallo- cation sizes with opposite signs or as deltas. By abstracting such differences, P A S TA unifies semantically equivalent ev ents and exposes a consistent interface to higher-le vel analyses. V endor-specific events, such as tensor memory operations in NVIDIA Blackwell GPUs or systolic-array operations in TPUs, are handled by specialized handler functions. These ev ents are ignored on other accelerators, ensuring portability while exposing device-unique features. H. Extensibility for Diverse Analyses The modular and unified architecture of P A S TA makes it highly e xtensible for di verse analysis purposes. Developers can rapidly prototype instruction-lev el, memory-centric, or value- based tools with minimal changes, beyond the specific case studies in Section V. Instruction-level analysis tools. These tools focus on fine- grained behaviors at the instruction granularity , leveraging P A S TA ’ s support for instruction-level instrumentation via ven- dor APIs (as shown in T able II). Branc h diverg ence analysis can be implemented by intercepting device-side control flow instructions and correlating them with activ e thread masks, helping identify warp inefficiencies in SIMT architectures. Instruction scheduling overhead analysis targets pipeline stalls and issue port contention by analyzing throughput counters and stall reason metrics. By integrating these with operator- lev el boundaries, developers can pinpoint inefficient schedul- ing regions. Memory-centric analysis tools. These tools e xamine how memory is used and accessed during execution, which is critical for understanding performance bottlenecks in memory- bound workloads. Memory barrier stall analysis quantifies synchronization delays that occur at device- or cluster -le vel barriers. W ith P A S TA ’ s support for capturing barrier and synchronization e vents (as listed in T able II), users can directly measure stall durations and frequencies. By recording times- tamps at barrier entry and exit points, dev elopers can compute precise stall intervals and identify kernels or layers that suffer from excessiv e synchronization ov erhead. Additional analyses such as shar ed memory bank conflicts , r e gister pr essur e , and underutilized memory re gions can be dev eloped by lev eraging P A S TA ’ s memory ev ent handler . V alue-based analysis tools. These tools inspect runtime data values or semantics for correctness or anomaly detection. For instance, a numeric overflow sanitizer could instrument arithmetic instructions and track operand ranges to detect ov erflo w or underflow e vents. Similarly , tools such as r edun- dant value load/stor e detection and data taint tracking can be implemented on top of P A S TA by associating value semantics with traced instruction-lev el events. These analyses lev erage P A S TA ’ s fine-grained operation monitoring capabilities, such as operand values and memory accesses, to detect inefficien- cies or security vulnerabilities during ex ecution. I V . I M P L E M E N TA T I O N As shown in Figure 5, the system is organized with five primary components: user code, profiling utilities, the event handler , the ev ent processor , and custom analysis tools. A. DL Supports P A S TA integrates with real-world DL applications through both high-lev el and lo w-level interf aces. On the high- lev el side, it supports mainstream DL framew orks such as PyT orch via function hooks and callbacks (e.g., c10 :: reportMemoryUsage and at ::RecordFunction ). At the low lev el, P A S TA instruments accelerator-specific APIs. For example, P A S TA intercepts calls to cudaMalloc and cuLaunchKernel on NVIDIA platforms or hipMalloc and hipLaunchKernel on AMD platforms, providing fine- grained visibility into memory allocation and kernel launch ev ents on the tar get hardware. B. P A S TA Modules Figure 5 presents the codebase structure of P A S TA . The ev ent handler module receiv es div erse event information from both DL framework-le vel callbacks (e.g., c10 :: reportMemoryUsage ) and lo w-le vel runtime instrumenta- tion (e.g., SANITIZER_ CBID_LAUNCH_BEGIN ), and trans- lates them through a collection of modular handler functions (e.g., PASTA :: tensor _ call _ handler for tensor allo- cations and PASTA ::kernel _ call_ handler for kernel launches). The ev ent processor module then preprocesses the raw profiling data collected by the event handler using cor- responding processor functions, such as PASTA:: tensor_ info_process and PASTA ::kernel _info _process . T o support large volumes of fine-grained data—such as instruction-lev el access traces— P A S TA employs GPU analysis threads via patched APIs (e.g., sanitizerPatchModule ), accelerating preprocessing by offloading tasks to the device through __device__ -annotated functions. In the tool collec- tion module, P A S TA extracts rele vant data for high-lev el anal- ysis by overriding functions in customizable tool templates. C. Interface to T ar get Application T o enable seamless integration with target applications, P A S TA is built as a shared library and injected at runtime via the LD_PRELOAD mechanism. This allo ws it to intercept both framew ork and accelerator runtime calls without modifying application source code. Once loaded, P A S TA enables the underlying e vent capture mechanisms using vendor-specific APIs. For instance, it utilizes sanitizerEnableDomain from Compute Sanitizer, nvbit _ at _ cuda _ event from NVBit, and rocprofiler _ configure _ callback ... from the ROCProfiler SDK to enable and initialize the pro- filing utilities. Each captured ev ent is handled via a corre- sponding callback implementation, which forwards the event to the event handler system. Finally , P A S TA includes sev eral advanced features to support rich de veloper introspection and cross-language analysis. The pybind11 library is used to enable user annotations and tool customization via Python, while the CPythonPyFrame API is leveraged to capture Python-lev el call stacks. For C/C++ sources, P A S TA integrates with libbacktrace to extract symbolic stack traces. D. Multi-GPU Support P A S TA supports multi-GPU scenarios by associating e vents with the corresponding GPU using the device index e x- posed from vendor -provided profiling APIs [10], [12]. Pro- filing multi-GPU computing has sev eral challenges. One of them is the interference from auxiliary processes. T o run an application on multiple GPUs, applications typically spa wn one process to handle each GPU and use se veral helper processes [38], [39]. For instance, Megatron-LM [40] employs Just-In-T ime (JIT) compilation that launches auxiliary pro- cesses during execution; when profiling with LD_ PRELOAD , these helpers—despite not creating a CUDA context—are still instrumented, leading to unnecessary initialization messages and potential runtime errors. T o address this, P A S TA uses CUDA_INJECTION64_PATH so that the profiler is injected only into processes that actually initialize a CUDA context. F or multi-node GPU setups, P A S TA runs independently on each node, generating profiles per rank or per node. V . C A S E S T U D I E S U S I N G T O O L S B U I LT W I T H P A S TA In this section, we present sev eral tools dev eloped using P A S TA , demonstrating how it aids developers in understanding T ABLE III: Hardware and Software En vironment. Machine CPU GPU System System Memory GPU Driver GPU T oolkit A Intel(R) Xeon(R) Gold 5320 NVIDIA A100 (80GB) × 2 Linux 5.14 128 GB 570.86.10 CUDA 12.1 B AMD Ryzen 7 5800X NVIDIA GeForce R TX 3060 Linux 6.11 32 GB 560.28.03 CUDA 12.1 C Intel(R) Xeon(R) Platinum 8568Y AMD MI300X Linux 6.8 240 GB 6.12.12 ROCm 6.4 T ABLE IV: Ev aluated DL models. Model T ype Layers Architecture Batch Size Abbr . AlexNet CNN 8 Conv olutional Full Connected 128 AN ResNet18 CNN 18 Residual Block 32 RN-18 ResNet34 CNN 34 Residual Block 32 RN-34 GPT -2 Transformer 12 Transformer (Decoder) 8 GPT -2 BER T Transformer 12 Transformer (Encoder) 16 BER T Whisper (small) Transformer 12 Transformer (En/De-coder) 16 Whisper performance issues and program behaviors, as well as guiding optimizations. Although we focus on DNN workloads in this paper , P A S TA also supports other workloads, such as GPU- accelerated HPC applications. A. Experimental Setup W e ev aluated the functionality and use cases of P A S TA on three CPU-GPU systems, each equipped with one or more discrete GPUs as accelerators. T able III summarizes the hardware specifications and system software versions. W e studied six widely used DL models—AlexNet [41], ResNet18 [42], ResNet34 [42], GPT -2 [43], BER T [44], and Whisper [45]—as detailed in T able IV. T o control the UVM ov ersubscription factor (as applied in Section V -C), we limit device memory capacity by allocating a specified amount in adv ance, following a common approach used in prior work [46], [47]. B. Common Application Behaviors Analysis In this subsection, we present two tools de veloped with P A S TA that illustrate how users can e xtend P A S TA for cus- tomized performance analysis. With only a fe w lines of code, they can analyze kernel in vocation distributions and iden- tify optimization candidates, showcasing the extensibility of P A S TA . W e also compare the profiling overhead of P A S TA for different underlying profiling APIs and analysis mechanisms, highlighting P A S TA ’ s flexible support for multiple profiling backends and its low-o verhead design. 1) K ernel Invocation F requency Analysis: W e first demon- strate a simple implementation of a kernel inv ocation fre- quency analysis tool to illustrate how P A S TA can be extended for customized program analysis. W e then present insights deriv ed from the results of this analysis. Figure 6 shows the data flo w of the kernel in vocation frequency analysis tool. When a kernel launch event occurs, it triggers a kernel launch callback function provided by the profiling API (e.g., NV :: kernel _ launch _ callback ). This, in turn, in vok es the P A S TA event handler function PASTA::kernel_call_handler , which collects kernel- related information such as the kernel name and grid configu- ration. Subsequently , the kernel_info_process function PASTA :: kernel_info _process (...) Kernel1 <<< x,y >>> ( x ); ... Kernel2 <<< x,y >>> ( x ); ... PASTA :: kernel_call _handler (...) PA S TA Even t Ha nd l e r PA S TA Even t Pro c es s or TOOL :: record_ke rnel_freq(.) PA S TA To o l C o l l e c t i o n NV :: kernel_laun ch_callback (.) User Code Profili ng API Dataflow TOOL :: rec ord_kerne l_freq(.) To o l d e v e l o p e d via P AST A Fig. 6: Kernel in vocation analysis tool dev eloped via P A S TA . ( .) . )) )))),( (( ))),( ( () (( ( )) () () )) () () (() (( )(( () )).(( ))) )( ) ( Fig. 7: Kernel in vocation frequency distrib ution across all model inference and training runs: bubble size reflects in vo- cation counts (actual numbers in the le gend). in the ev ent processor module preprocesses and organizes the data gathered by the event handler . These operations are handled entirely by the P A S TA framework. T o de velop a kernel in vocation frequency analysis tool, users only need to retriev e this preprocessed data from the ev ent processor and implement a customized analysis in the TOOL :: record _ kernel _ freq function. In this case, users maintain a map to record the number of times each kernel is in voked—an intuitiv e yet insightful statistic. Figure 7 presents the kernel in vocation frequencies observ ed during inference and training for the models listed in T able IV, as collected by the kernel frequency analysis tool. This analy- sis rev eals sev eral insights useful for optimization. Notably , although thousands of kernels are launched during model ex ecution, only a small subset are inv oked heavily—such as at::native::im2col_kernel and ampere_sgemm * . These results suggest that focusing optimization efforts on frequently inv oked kernels can yield significant performance gains. Leveraging P A S TA ’ s cross-layer call stack tracing fea- ture, users can directly trace performance-critical kernels back to their source code, simplifying targeted optimizations, as shown in Figure 4. In comparison, e xisting tools that often require users to manually extract and correlate such patterns. 2) Memory Characteristics Analysis: The memory charac- teristics analysis tool focuses on analyzing the working set size of DL models. W e define the working set size of a workload as the maximum memory footprint of any single kernel execution within that workload [48]. This metric is critical for ev aluating whether the memory capacity of a system can accommodate a gi ven workload. Howe ver , analyzing the working set size of GPU-accelerated applications presents several challenges. First, e xisting profil- ing APIs, such as NVIDIA NVBit and AMD R OCProfiler T ABLE V: Memory characteristics of di verse DNN models (Sizes in MB unless otherwise noted). Model Kernel Count Memory Footprint W orking Set (WS) Minimum WS A verage WS Median WS 90th percentile WS Inference AlexNet 1428 1528.13 876.12 1.01 216.25 148.26 406.33 RN-18 1497 1232.13 1024.0 1.00 KB 86.07 64.00l 172.27 RN-34 2657 1261.59 1024.0 1.00 KB 76.61 43.25 164.0 BER T 487 1179.64 212.62 47.50 KB 75.23 37.69 141.75 GPT -2 583 4148.10 1493.85 4.00 KB 59.02 25.08 138.0 Whisper 663 2304.15 627.44 2.25 78.54 20.81 153.81 A vg. 1219 1942.29 876.34 0.55 98.62 56.52 196.03 Train AlexNet 4040 3285.17 1512.09 512 B 188.60 144.62 406.33 RN-18 1542 3165.13 1024.00 512 B 84.58 43.25 172.27 RN-34 2734 4316.86 1024.00 512 B 75.33 43.25 164.00 BER T 554 5679.03 235.47 1.00 KB 77.71 37.97 209.30 GPT -2 2004 7862.10 2240.77 512 B 51.37 24.0 137.66 Whisper 665 2104.80 937.01 2.25 80.42 20.81 153.81 A vg. 2593 4402.02 1162.22 0.38 93.00 52.32 207.23 Fill Address Buff er (Compute Sanitizer , NVBit ) Transfer Addr ess Buffer ( Buffer Ful l & Kernel Complet ion) Empty Buff er & Resume Execut ion Ker ne l Exe cu ti on CPU Analy sis … Load/Store Instructions Update th e Map Kernel - to - Object (a) CPU-based analysis in con ventional vendor -provided tools. Ker ne l Exe cu ti on Load/Store Instructions Update Map PASTA Analysis Threads Transfer Resul t Buf fer (Kerne l Comp letion) No St al l Durin g Kern el Ex ecu ti on CPU Pr ocess Update th e Map Kernel - to - Object ( access_count > 0) (b) GPU-based analysis in P A S TA . Fig. 8: Memory characterization tool de veloped via P A S TA . SDK, only provide e vent-based metadata, such as kernel names and launch configurations, but not the argument lists or their values. This limitation makes it dif ficult to determine which memory objects are accessed by a given k ernel. Second, ev en if the argument list is available, it is still possible that some objects passed into the kernel are ne ver accessed, posing a challenge to accurately exclude them from the working set without tracking actual memory accesses. T o address these challenges, we developed a working set size analysis tool using P A S TA . The core idea is to track which memory objects ha ve been accessed during kernel ex ecution. By associating memory access addresses with their corresponding objects, we can compute the memory footprint of each kernel. The maximum of these footprints across all kernels defines the working set size of the workload. T able V summarizes the memory footprints and working set sizes for inference and training of the models listed in T able IV. The results show: 1) working sets are often much smaller than ov erall footprints, with average footprints 2.22 × and 3.79 × larger than working sets in inference and training, respectiv ely; 2) median and 90th percentile working sets are modest, indicating most kernels use limited memory . These findings suggest that a substantial fraction of memory is underutilized e ven for memory-intensi ve DL workloads. This insight provides theoretical support for memory optimization strategies such as swapping and data offloading [49]–[51]. 3) Analysis Overhead of P A S TA : As shown in Figure 8, we implement the memory characteristics analysis tool described in Section V -B2 in three variants: two con ventional CPU- based approaches using Compute Sanitizer MemoryT racker AlexNet RN-18 RN-34 BER T GPT -2 Whisper Geo. 10 2 10 4 10 6 Overhead (log scale) (v .s. Model Execution Time) ∞ ∞ CS-GPU-A100 CS-GPU-3060 CS-CPU-A100 CS-CPU-3060 NVBIT -CPU-A100 NVBIT -CPU-3060 Fig. 9: Normalized ov erhead of div erse analysis models on A100 and R TX 3060. CS-GPU: GPU-side trace collection & analysis using Compute Sanitizer . CS-CPU: trace collec- tion on GPU & analysis on CPU using Compute Sanitizer . NVBIT -CPU: trace collection on GPU & analysis on CPU using NVBit. ∞ for those that did not finish within 7 days. AlexNet RN-18 RN-34 BER T GPT -2 Whisper 0.00 0.25 0.50 0.75 1.00 F raction of T otal Time CS-GPU-A100 CS-CPU-A100 NVBIT -CPU-A100 CS-GPU-3060 CS-CPU-3060 NVBIT -CPU-3060 Execution Collection T ransfer Analysis Fig. 10: Breakdown of P A S TA profiling time on A100 and R TX 3060. (See Fig. 9 for the definitions of CS-GPU, CS- CPU, NVBIT -CPU). tool [32] and NVBit MemT race tool [31] correspondingly (Figure 8a), and another variant that uses GPU-accelerated analysis (Figure 8b). In the CPU-based approaches, when memory instructions are instrumented, the log of accessed addresses is recorded into a buf fer . The buf fer is copied to the CPU when it becomes full or the kernel terminates, to be summarized for analysis. In contrast, the GPU-accelerated version performs this analysis directly on the device. When a kernel is launched, a map from memory object to access count is transferred to the GPU. During e xecution, a profiling device function increments access count for each associated memory object upon each access. When the kernel completes, the access count map is copied back to the CPU, where objects with non-zero access counts are identified as part of the kernel’ s working set. By summarizing the profiling statistics on the device by exploiting GPU parallelism, this approach significantly accelerates analysis performance. Figure 9 compares the ov erhead of the GPU-accelerated analysis with the two CPU-based implementations on A100 GPUs and R TX 3060. On average, the results show that on A100, the GPU-accelerated tool in P A S TA is 941 × and 13006 × faster than CPU-based tools using Compute Sanitizer and NVBit, respectiv ely . On R TX 3060, it achieves av erage speedups of 627 × and 7353 × . The CPU-based methods incur significant ov erhead as they rely on a single CPU thread and can introduce significant stalls. W e also note that the Compute Sanitizer-based tool performs faster than the NVBit-based tool because it instruments only memory instructions, whereas NVBit must first dump and parse SASS code to identify memory instructions, which introduces additional ov erhead. AlexNet RN-18 RN-34 BER T GPT -2 Whisper A vg. 0.00 0.25 0.50 0.75 1.00 Execution T ime (Normalized to No Pr efetch) Object-Level Pr efetch (3060) T ensor-L evel Prefetch (3060) Object-Level Pr efetch (A100) T ensor-L evel Prefetch (A100) Fig. 11: Execution time of object-lev el and tensor-le vel prefetch on R TX 3060 and A100 under no memory oversub- scription. AlexNet RN-18 RN-34 BER T GPT -2 Whisper A vg. 0 1 2 3 4 Execution T ime (Normalized to No Pr efetch) 10.3 Object-Level Pr efetch (3060) T ensor-L evel Prefetch (3060) Object-Level Pr efetch (A100) T ensor-L evel Prefetch (A100) Fig. 12: Execution time of object-lev el and tensor-le vel prefetch on R TX 3060 and A100 under a memory ov ersub- scription factor of 3. W e further break down the profiling overhead into four com- ponents: workload execution, trace collection, trace transfer , and trace analysis. Figure 10 shows the breakdo wn of P A S TA profiling time on A100 and R TX 3060. In the GPU-accelerated version, trace collection and analysis are fused into a single GPU function, so the reported “collection time” includes both collection and analysis. Although collection time occupies a larger fraction in the GPU-accelerated version compared to CPU-based v ersions, its absolute time is much shorter , as shown in the ov erhead comparison in Figure 9. In contrast, CPU-based versions are dominated by trace analysis time, which could take hours to days since a limited number of (typically single) CPU threads process massi ve profiling data. C. UVM Optimization for DL W orkloads 1) T ensor-A war e UVM Pr efetcher: NVIDIA ’ s UVM pro- vides a unified memory space shared between the GPU and CPU, simplifying GPU programming and enabling mem- ory ov ersubscription to ef fectiv ely expand the usable GPU memory . Due to this advantage, UVM has been increasingly adopted for DL workloads [52], [53], which hav e e ver- growing memory demands [54]–[58]. Howe ver , while UVM offers transparent memory e xpansion, its page-fault-driv en, on- demand data migration mechanism can incur substantial over - head, especially when accessed data resides in CPU memory and must be migrated to the GPU at runtime [53], [59], [60]. T o mitigate these o verheads, existing UVM optimization approaches aim to proacti vely prefetch or pre-evict data so that frequently accessed data resides in GPU memory , a voiding costly page fault handling [61], [62]. These solutions typically operate at the granularity of memory objects (e.g., regions allocated via cudaMallocManaged ), under the assumption that memory access patterns are consistent within each object. Fig. 13: Memory access hotness of BER T inference over time. While this assumption holds for man y con ventional GPU applications, it does not apply to modern DL workloads. Contemporary DL frame works such as PyT orch and T en- sorFlow adopt pool-based memory management. Instead of allocating memory per tensor, they request lar ge chunks of memory from the system (using APIs like cudaMalloc or cudaMallocManaged ) and then manage memory internally by subdi viding these chunks into smaller regions to serve individual tensor allocations. As a result, a single memory object may contain multiple tensors, each with different life- times and access patterns. This discrepancy renders existing object-lev el UVM prefetching strategies suboptimal for DL workloads [53]. Without awareness of tensor boundaries and usage patterns, object-le vel prefetching can result in unneces- sary data migrations, memory bloat, and contention, thereby hurting performance. T o address this issue, we leverage P A S TA ’ s cross-layer ev ent capturing capability—capable of tracing both high- lev el framew ork-specific operations and low-le vel accelerator ev ents—to de velop a UVM prefetching analysis tool. This tool captures kernel execution events and correlates them with the accessed memory objects and tensors (as described in Section V -B2). Based on this analysis, we generate a multi-lev el prefetching scheme and build an automated UVM prefetcher that executes prefetching at either memory object or tensor granularity , and compares their performance. Figure 11 shows the normalized execution time of object- lev el and tensor-le vel prefetching on R TX 3060 and A100 GPUs under non-o versubscribed memory conditions. Both strategies yield improv ements ov er the baseline (no prefetch- ing), with average speedups of 39% and 30% on R TX 3060 and 37% and 26% on A100, respectiv ely . Object-level prefetching achieves slightly higher speedups in this scenario, as it benefits from aggressiv e data migration when sufficient GPU memory is av ailable. Howe ver , under memory oversubscription, aggressi ve prefetching can be detrimental. Figure 12 presents the normal- ized ex ecution times under an ov ersubscription factor of 3 (i.e., the application’ s memory footprint is 3× the GPU memory capacity). In this case, object-lev el prefetching significantly degrades performance, with av erage slo wdowns of 2.35 × and 2.91 × observed on R TX 3060 and A100, respecti vely . The root cause is that many tensors within a prefetched 0 4768 Memory Usage (MB) NVIDIA AMD AMD (tail) 0K 1K 2K 3K 4K 5K Logical Timestamp (T ensor Allocation/Deallocation Event Index) −2500 0 Δ (MB) NVIDIA > AMD NVIDIA < AMD Fig. 14: Memory usage ov er time in one training iteration of GPT -2 under identical configurations on AMD and NVIDIA GPUs, with the bottom subfigure sho wing their difference. object may not actually be accessed during kernel ex ecution, resulting in excessi ve and unnecessary data migration. This inefficient use of device memory leads to page thrashing and undermines performance. Notably , GPT -2 consistently benefits from object-le vel prefetching across both hardware platforms. This is attributed to its relativ ely small working set size compared to its overall memory footprint, as shown in T able V, which results in less memory pressure and minimal page thrashing, ev en under 3 × oversubscription. While tensor- lev el prefetching outperforms the baseline on the R TX 3060, it performs slightly worse than the baseline on the A100. This highlights the need for more sophisticated prefetching strategies tailored to memory-intensive workloads, particularly when operating under constrained memory conditions. 2) T ime-Series Hotness Analysis: The performance of UVM prefetching is determined by the timely delivery of “hot” data into the GPU. T o research an efficient UVM prefetching algorithm, we de velop a time-series hotness analysis tool using P A S TA , which tracks access hotness over time in the unit of 2MB virtual memory blocks. Figure 13 shows the results of BER T inference without oversubscription. The results re- veal significant diver gence in access patterns across memory blocks. Memory blocks highlighted between each pair of the horizontal blue lines are frequently accessed throughout the entire ex ecution, suggesting they likely store long-lived hot data (e.g., model parameters). These blocks are good candidates for prefetching and can be pinned in device mem- ory using UVM APIs such as cudaMemPrefetchAsync and cudaMemAdvise . In contrast, blocks highlighted with red boxes exhibit bursts of frequent accesses within narrow time windows and lack reusability , indicating they may con- tain short-li ved, transient data (e.g., key-v alue caches). These blocks are suitable for proactive eviction to make room for other high-priority hot data. D. Support for Diverse GPU V endors and Scenarios. 1) Comparison between AMD and NVIDIA GPUs: P A S TA can support various GPU platforms. W e compare the mem- ory behaviors of NVIDIA and AMD GPUs (details in T a- ble III) while running one training iteration of a GPT -2 model (T able IV). Figure 14 shows the memory usage during the iteration. Both backends exhibit the same three-phase pattern—ramp-up, peak, ramp-down—as PyT orch’ s caching allocator recycles tensors [63]. This similarity is expected since HIP memory management closely follows CUD A ’ s 0 1907 3814 Memory Usage (MB) GPU 0 GPU 1 0K 100K 200K 300K 400K 500K Logical Timestamp (T ensor Allocation/Deallocation Event Index) −0.05 0.00 0.05 Δ (MB) GPU0 < GPU1 GPU0 > GPU1 (a) Data Parallelism 0 953 1907 Memory Usage (MB) GPU 0 GPU 1 0K 200K 400K 600K 800K 1000K Logical Timestamp (T ensor Allocation/Deallocation Event Index) −0.05 0.00 0.05 Δ (MB) GPU0 < GPU1 GPU0 > GPU1 (b) T ensor Parallelism 0 953 1907 Memory Usage (MB) GPU 0 GPU 1 GPU 1 (tail) 0K 100K 200K 300K 400K 500K Logical Timestamp (T ensor Allocation/Deallocation Event Index) 0 2000 Δ (MB) GPU0 < GPU1 GPU0 > GPU1 (c) Pipeline Parallelism Fig. 15: Per -GPU memory usage over time in one training iteration of the Megatron GPT -2 345M model with different parallelism strategies. Bottom subfigures plot the memory usage dif ference between the two GPUs. design [64]. W e also observe backend-specific differences. On the NVIDIA GPU, fe wer allocation/deallocation ev ents are issued, but peak memory usage is slightly higher than on the AMD GPU. This discrepancy may be influenced by differences in operator decomposition and kernel fusion strategies across CUDA/cuDNN and HIP/MIOpen backends, as prior work has shown that fusion affects both the number of allocations and temporary memory requirements [65], [66]. 2) Multi-GPU Scenario: W e run Megatron GPT -2 345M [67] on the Megatron-LM framework [40], [68] with two A100 GPUs (T able III). Figure 15 shows per - GPU memory usage ov er one training iteration under Data Parallelism (DP), T ensor Parallelism (TP), and Pipeline Parallelism (PP). Compared to the single-GPU case in Section V -D1, Megatron-LM’ s memory behavior is different: tensors are more persistent with longer lifetimes (e.g., for communication). DP and TP exhibit identical memory usage across two GPUs, since DP runs tw o replicated models and TP e venly divides the model across de vices. The peak memory of TP is about half of DP’ s, consistent with model sharding. GPUs showed asymmetric statistics under PP because the model is split at the midpoint of the transformer block stack, thus final layers that produce logits run on GPU1, increasing GPU1’ s tail execution. These observations match the semantics of DP , TP , and PP , and demonstrate that P A S TA can accurately reveal insights from complex workloads. V I . D I S C U S S I O N A. Impact on W orkload Execution. Correctness. P A S TA passively intercepts runtime e vents but does not modify program data or ex ecution logic. Thus, the functional correctness of the workload is unaffected, and all program outputs remain identical to uninstrumented execution. P A S TA requires a small fraction of GPU memory (e.g., 4MB) to store profiling data. Therefore, P A S TA induces minimal to no interference in resource usage. Perf ormance Overhead. P A S TA ’ s runtime profiling may in- troduce performance o verhead. The magnitude of this over - head is not strictly predictable, since it depends on both the type and volume of e vents being captured. In general, the more ev ents or instructions are traced, the higher the expected over - head. P A S TA ’ s GPU-accelerated design significantly mitigates these costs, as described in Section V -B3. B. Relation to Existing T echniques. Stream Runtime V erification (SR V). SR V is an online verification mechanism that monitors the streams of events while an application is running and checks if the program ex ecutes as specified by the user [69], [70]. P A S TA lev erages the runtime monitoring, similar to SR V . Howe ver , the goal and the ov erall mechanism of SR V and P A S TA are fundamentally different. SR V focuses on the program ex ecution verification by using formalized specifications and various monitoring algorithms, whereas P A S TA ’ s ultimate goal is to optimize program ex ecution by providing accelerator -aw are profiling APIs, tool templates, and backends that abstract vendor APIs. eBPF-based T racing. eBPF is widely used in Linux for dynamic tracing at the kernel level [71]. It provides a pro- grammable interface for collecting events such as system calls and I/O operations, enabling custom analysis tools. P A S TA plays a comparable role for accelerators: it captures and normalizes GPU runtime ev ents, offering modular tem- plates for higher -level analysis. While eBPF addresses general- purpose observability , P A S TA complements it by focusing on accelerator-specific semantics and GPU workloads. V I I . C O N C L U S I O N In this paper, we present P AS TA , a low-o verhead, modu- lar program analysis framew ork for heterogeneous acceler- ators. By unifying low-le vel profiling APIs with high-level framew ork callbacks, P A S TA enables rapid dev elopment of customized analysis tools. Case studies on kernel inv ocation tracking, memory working set analysis, and UVM prefetch optimization demonstrate its versatility . Evaluations show that P A S TA deliv ers significantly lower overhead than existing pro- filers while supporting rich cross-layer analysis, establishing its potential as a foundational tool for accelerator -aware system optimization and performance research. A C K N O W L E D G M E N T This work was supported by NSF grants, CAREER- 2341039, CCF-2452081 and NSF-2411134. W e thank AMD Cloud for providing computing resources. A RT I FA C T A P P E N D I X A. Abstr act Our artifact provides P A S TA , a modular program analysis framew ork for accelerators, along with its profiling client AccelProf. The artifact includes source code, build scripts, and detailed instructions to reproduce the main results presented in Figure 7, T able V, Figure 9, 10, 11, 12, 13, 14, and 15. The artifact demonstrates the case studies developed with P A S TA . B. Artifact check-list (meta-information) • Pr ogram: AccelProf. • Compilation: Makefile. • Run-time en vironment: Linux x86-64 systems. • Hard ware: NVIDIA GPUs and AMD GPUs. • Execution: accelprof- v- t< tool > < executable > [args ... ] • Metrics: GPU application metrics demonstrating the func- tionality of the P A S TA framework. • Output: Figures presented in the paper . • How much disk space required (approximately)?: ≤ 100 GB. • How much time is needed to prepare workflow (approxi- mately)?: ≤ 1 hour . • How much time is needed to complete experiments (approx- imately)?: Reproducing Figure 9 and Figure 10 may take several days. Other figures can be repr oduced within ≤ 2 hour . • Publicly av ailable?: Y es. • Code licenses (if publicly available)?: MIT . • Ar chived (provide DOI)?: doi.org/10.5281/zenodo.17547322 . C. Description 1) How deliver ed: The artifact associated with this paper is publicly available at Zenodo [72]. The open-source GitHub repository is publicly available at: https://github .com/AccelProf/AccelProf. User and de veloper documentation is publicly available at: https://accelprofdocs.readthedocs.io. 2) Har dwar e dependencies: P A S TA supports both NVIDIA and AMD GPUs with x86-64 CPUs. W e ha ve tested it on NVIDIA A100, NVIDIA GeForce R TX 3060, and AMD MI300X GPUs. For best reproducibility , we recommend using the same GPU models and a machine with at least 100 GB of av ailable disk space. 3) Softwar e dependencies: The artifact was tested on the following software versions (or ne wer). Older versions may also work but are un verified. • NVIDIA CUDA driv er: ≥ 560.28.03 • AMD GPU Driv er ≥ 6.12.12 • CUD A T oolkit: 12.1 and abov e • R OCm 6.4 and above • GCC: 9.4 and abov e • Linux Kernel: 5.14 and above • PyT orch 2.0 and abo ve • NVIDIA NVBIT 1.7.3 and abov e D. Installation • Do wnload the codebase. The P A S TA codebase is orga- nized into multiple submodules. 1 git clone --recursive \ 2 https://github.com/AccelProf/AccelProf.git 3 cd AccelProf && git checkout cgo26 4 git submodule update --init --recursive • Check dependencies P A S TA requires PyT orch and neces- sary Python development library installed. 1 bash ./bin/utils/check_build_env.sh • Build P A S TA . 1 # 15 minutes 2 make ENABLE_CS=1 ENABLE_NVBIT=1 ENABLE_TORCH=1 • Set environment variables. 1 export ACCEL_PROF_HOME=$( pwd ) 2 export PATH=${ACCEL_PROF_HOME}/bin:${PATH} • Setup P A S TA AE toolkit. 1 bash ./bin/setup_ae E. Experiment workflow • Setup artifact. 1 cd cgo26-ae 2 bash ./bin/setup_artifact.sh • Reproduce Figure 7. Figure 7 sho ws kernel in vocation frequency distribution. 1 bash ./bin/run_figure_7.sh • Reproduce T able V. T able V shows memory characteris- tics of diverse DNN models. 1 bash ./bin/run_table_v.sh • Reproduce Figure 9. Figure 9 shows normalized ov erhead of diverse analysis models on A100 and R TX 3060. This experiment may take sev eral days to complete. Users can set the environment variable ACCEL _ PROF _ ENV _ SAMPLE_RATE to speed up the process. 1 bash ./bin/run_figure_9.sh • Reproduce Figure 10. Figure 10 shows the breakdown of P A S TA profiling time on A100 and R TX 3060. This experiment may take sev eral days to complete. Users can set the environment variable ACCEL _ PROF _ ENV _ SAMPLE_RATE to speed up the process. 1 # Checkout to specific branch 2 cd ${ACCEL_PROF_HOME} 3 cd nv-nvbit && git checkout oh-breakdown 4 cd ${ACCEL_PROF_HOME} 5 cd nv-compute && git checkout oh-breakdown 6 cd ${ACCEL_PROF_HOME} 7 8 # Re-build the codebase 9 make ENABLE_CS=1 ENABLE_NVBIT=1 ENABLE_TORCH=1 10 11 # Run the experiment 12 # This may take several days to complete 13 bash ./bin/run_figure_10.sh • Reproduce Figure 11. Figure 11 shows execution time of object-lev el and tensor-le vel prefetch on R TX 3060 and A100 under no memory ov ersubscription. 1 bash ./bin/run_figure_11.sh • Reproduce Figure 12. Figure 12 shows execution time of object-lev el and tensor-le vel prefetch on R TX 3060 and A100 under a memory ov ersubscription. 1 bash ./bin/run_figure_12.sh • Reproduce Figure 13. Figure 13 shows memory access hotness of BER T inference ov er time. 1 bash ./bin/run_figure_13.sh • Reproduce Figure 14. Figure 14 shows memory usage ov er time of GPT -2 training under identical configurations on AMD and NVIDIA GPUs. Reproducing Figure 14 requires collecting data from both AMD and NVIDIA GPU platforms. The generated profil- ing trace from the AMD server must then be transferred to the NVIDIA serv er to plot the memory usage comparison. On AMD GPU: A file named out _ amd . log will be generated in the results / figure _ 14 / di- rectory . Please move this file to the corresponding results / figure _ 14 / directory on the NVIDIA server . 1 # Download codebase 2 git clone --recursive \ 3 https://github.com/AccelProf/AccelProf.git 4 cd AccelProf && git checkout cgo26 5 git submodule update --init --recursive 6 7 # Compile the codebase 8 make ENABLE_ROCM=1 9 10 # Set environment ariables 11 export ACCEL_PROF_HOME=$( pwd ) 12 export PATH=${ACCEL_PROF_HOME}/bin:${PATH} 13 14 # Setup AE Toolkit 15 bash bin/setup_ae 16 cd cgo26-ae 17 bash ./bin/setup_artifact.sh 18 19 # Run the experiment 20 bash ./bin/run_figure_14_amd.sh On NVIDIA GPU: After run the experiment for Figure 14 on AMD GPU, please move the out _ amd . log to NVIDIA server under results / figure_14 / . 1 # Run the experiment 2 bash ./bin/run_figure_14_nvidia.sh 3 4 # Plot Figure 14 5 # Ensure out_amd.log is moved. 6 bash ./bin/plot_figure_14.sh results/figure_14/ • Reproduce Figure 15. Figure 15 shows per-GPU memory usage over time in GPT -2 345M model training with dif- ferent parallelism strategies. The reproduction of Figure 15 requires Megatron-LM [40] to be installed. 1 bash ./bin/run_figure_15.sh path_to_megatron F . Evaluation and expected r esult The reproduced results are located in folder ./ results . The outputs for Figure 7, T able V, Figure 9, 10, 11, 12, 13, 14, and 15 are expected to match the corresponding results in the paper . G. Methodology Submission, re vie wing and badging methodology: • http: // cT uning . org / ae / submission- 20190109 . html • http: // cT uning . org / ae / re viewing- 20190109 . html • https://www .acm.or g/publications/policies/artifact- revie w-badging R E F E R E N C E S [1] N. Corporation, “Nvidia nsight systems, ” https :/ / dev eloper .nvidia.com / nsight- systems, accessed: April 2025. [2] A. Corporation, “Rocprofiler documentation, ” https : / / rocm . docs . amd . com/projects/rocprofiler/en/latest/, accessed: April 2025. [3] P . T eam, “Pytorch profiler, ” https:// pytorch.org/tutorials/recipes/recipes/ profiler recipe.html, accessed: April 2025. [4] T . T eam, “T ensorflow profiler: Profile model performance, ” https://www . tensorflow .org/tensorboard/ tensorboard profiling keras, accessed: April 2025. [5] A. Corporation, “Omniperf documentation, ” https://rocm.docs.amd.com/ projects/omniperf/en/docs- 6.2.0/, accessed: April 2025. [6] N. Corporation, “Nvidia cuda profiling tools interface (cupti) - cuda toolkit, ” https://developer .n vidia.com/cupti, accessed: May 2025. [7] I. Corporation, “oneapi: A new era of heterogeneous computing, ” https: / / www. intel . com / content / www / us / en / developer/ tools / oneapi / overvie w. html, accessed: May 2025. [8] A. Paszke, S. Gross, F . Massa, A. Lerer, J. Bradbury , G. Chanan, T . Killeen, Z. Lin, N. Gimelshein, L. Antiga, A. Desmaison, A. K ¨ opf, E. Y ang, Z. DeV ito, M. Raison, A. T ejani, S. Chilamkurthy , B. Steiner, L. Fang, J. Bai, and S. Chintala, PyT or ch: an imper ative style, high- performance deep learning library . Red Hook, NY , USA: Curran Associates Inc., 2019. [9] M. Abadi, P . Barham, J. Chen, Z. Chen, A. Davis, J. Dean, M. Devin, S. Ghemawat, G. Irving, M. Isard, M. Kudlur, J. Levenber g, R. Monga, S. Moore, D. G. Murray , B. Steiner, P . Tucker , V . V asudev an, P . W arden, M. Wicke, Y . Y u, and X. Zheng, “T ensorflow: a system for large-scale machine learning, ” in Pr oceedings of the 12th USENIX Conference on Operating Systems Design and Implementation , ser . OSDI’16. USA: USENIX Association, 2016, p. 265–283. [10] N. Corporation, “Compute sanitizer api reference manual, ” https://docs. n vidia . com / compute - sanitizer / SanitizerApiGuide / index . html, accessed: April 2025. [11] O. V illa, M. Stephenson, D. Nellans, and S. W . Keckler , “Nvbit: A dynamic binary instrumentation framew ork for n vidia gpus, ” in Pr oceedings of the 52nd Annual IEEE/A CM International Symposium on Micr oarc hitectur e , ser . MICRO ’52. New Y ork, NY , USA: Association for Computing Machinery , 2019, p. 372–383. [Online]. A vailable: https://doi.org/10.1145/3352460.3358307 [12] A. Corporation, “Rocprofiler-sdk documentation, ” https : / / rocm . docs . amd.com/projects/rocprofiler- sdk/en/latest/, accessed: April 2025. [13] O. T eam, “Xprof (tpu e xecution profiler), ” https : // github.com /openxla / xprof, accessed: May 2025. [14] M. Lin, K. Zhou, and P . Su, “Drgpum: Guiding memory optimization for gpu-accelerated applications, ” in Proceedings of the 28th A CM International Conference on Ar chitectural Support for Pr ogramming Languages and Operating Systems, V olume 3 , ser . ASPLOS 2023. New Y ork, NY , USA: Association for Computing Machinery , 2023, p. 164–178. [Online]. A vailable: https://doi.org/10.1145/3582016.3582044 [15] K. Zhou, Y . Hao, J. Mellor -Crummey , X. Meng, and X. Liu, “Gvprof: A value profiler for gpu-based clusters, ” in SC20: International Conference for High P erformance Computing, Networking, Storage and Analysis , 2020, pp. 1–16. [16] Q. Zhao, H. W u, Y . Hao, Z. Y e, J. Li, X. Liu, and K. Zhou, “Deepcontext: A context-aware, cross-platform, and cross-framework tool for performance profiling and analysis of deep learning workloads, ” 2024. [Online]. A vailable: https://arxiv .org/abs/2411.02797 [17] A. Nayak and A. Basu, “Over-synchronization in gpu programs, ” in 2024 57th IEEE/ACM International Symposium on Microar chitectur e (MICR O) , 2024, pp. 795–809. [18] X. Y ou, Z. Xuan, H. Y ang, Z. Luan, Y . Liu, and D. Qian, “Gvarp: Detecting performance variance on large-scale heterogeneous systems, ” in Proceedings of the International Conference for High P erformance Computing, Networking , Stor age, and Analysis , ser . SC ’24. IEEE Press, 2024. [Online]. A vailable: https://doi.org/10.1109/SC41406.2024.00063 [19] N. Corporation, “Nvidia nsight compute, ” https: //developer .nvidia.com/ nsight- compute, accessed: April 2025. [20] I. Corporation, “Intel vtune profiler user guide, ” https://www .intel.com/ content / www / us / en / docs / vtune - profiler / user - guide / 2025 - 1 / overvie w. html, accessed: April 2025. [21] B. W elton and B. P . Miller, “Diogenes: looking for an honest cpu/gpu performance measurement tool, ” in Pr oceedings of the International Confer ence for High P erformance Computing, Networking, Storag e and Analysis , ser . SC ’19. Ne w Y ork, NY , USA: Association for Computing Machinery , 2019. [Online]. A vailable: https://doi.org/10.1145/3295500.3356213 [22] K. Zhou, Y . Hao, J. Mellor-Crummey , X. Meng, and X. Liu, “V alueexpert: exploring value patterns in gpu-accelerated applications, ” in Pr oceedings of the 27th ACM International Confer ence on Ar chitectur al Support for Pr ogramming Languag es and Operating Systems , ser . ASPLOS ’22. New Y ork, NY , USA: Association for Computing Machinery , 2022, p. 171–185. [Online]. A vailable: https://doi.org/10.1145/3503222.3507708 [23] D. Shen, S. L. Song, A. Li, and X. Liu, “Cudaadvisor: Llvm-based runtime profiling for modern gpus, ” in Proceedings of the 2018 International Symposium on Code Generation and Optimization , ser . CGO ’18. Ne w Y ork, NY , USA: Association for Computing Machinery , 2018, p. 214–227. [Online]. A vailable: https://doi.org/10.1145/3168831 [24] L. Adhianto, S. Banerjee, M. Fagan, M. Krentel, G. Marin, J. Mellor- Crummey , and N. R. T allent, “Hpctoolkit: tools for performance analysis of optimized parallel programs http://hpctoolkit.org, ” Concurr . Comput.: Pract. Exper . , vol. 22, no. 6, p. 685–701, Apr . 2010. [25] J. E. Gonzalez, “Machine learning frameworks, ” https : / / ucbrise . github . io / cs294 - ai - sys - sp22 / assets / lectures / lec10 / 10 deep learning framew orks.pdf, accessed: April 2025. [26] J. Enoh, “Deep di ve into deep learning frame works: A technical perspec- tiv e, ” https: / / www.linkedin. com /pulse / deep - div e- learning - frameworks- technical- perspective- john- enoh- fkcyc/, accessed: April 2025. [27] J. T eam, “jax.profiler module, ” https://docs.jax.dev/en/latest/jax.profiler . html, accessed: April 2025. [28] N. Corporation, “Dlprof user guide, ” https : / / docs . n vidia . com / deeplearning/frameworks/dlprof - user- guide /index. html, accessed: April 2025. [29] J. Gleeson, M. Gabel, G. Pekhimenko, E. de Lara, S. Krishnan, and V . Janapa Reddi, “Rl-scope: Cross-stack profiling for deep reinforcement learning workloads, ” in Proceedings of Machine Learning and Systems , A. Smola, A. Dimakis, and I. Stoica, Eds., vol. 3, 2021, pp. 783–799. [Online]. A vailable: https://proceedings.mlsys.org/paper files/ paper/2021/file/676638b91bc90529e09b22e58abb01d6- Paper .pdf [30] D. Snider , F . Che valier , and G. Pekhimenko, “Hotline profiler: Automatic annotation and a multi-scale timeline for visualizing time-use in dnn training, ” in Pr oceedings of Machine Learning and Systems , D. Song, M. Carbin, and T . Chen, Eds., vol. 5. Curan, 2023, pp. 104–126. [Online]. A vailable: https : / / proceedings . mlsys . org / paper files / paper / 2023/file/347330dd540c72b2c9b0cc304bcf43c6- Paper- mlsys2023.pdf [31] N. Corporation, “Nvidia n vbit tools - mem trace, ” https : / / github.com / NVlabs/NVBit/releases/tag/v1.7.4, accessed: May 2025. [32] ——, “Nvidia compute sanitizer samples memorytracker , ” https : / / github . com / NVIDIA / compute - sanitizer - samples / tree / master / MemoryT racker, accessed: May 2025. [33] ——, “Nvidia cudnn: Cuda deep neural network library , ” https : / / dev eloper .nvidia.com/cudnn, accessed: May 2025. [34] ——, “Nvidia cublas: Basic linear algebra on n vidia gpus, ” https : //dev eloper .nvidia.com/cublas, accessed: May 2025. [35] S. W . Min, K. W u, S. Huang, M. Hidayeto ˘ glu, J. Xiong, E. Ebrahimi, D. Chen, and W . mei Hwu, “Pytorch-direct: Enabling gpu centric data access for very large graph neural network training with irregular accesses, ” 2021. [Online]. A vailable: https://arxiv .org/abs/2101.07956 [36] P . T eam, “Pytorch cuda caching allocator, ” https: / /github.com /pytorch / pytorch / blob / main / c10 / cuda / CUD ACachingAllocator . cpp, accessed: May 2025. [37] ——, “C10 api memoryreportinginfobase, ” https: / /github.com /pytorch/ pytorch / blob / 8af995f207317adc9f3145ddd5fe4768209aca93 / c10 / core / Allocator .h#L289C1- L326C20, accessed: May 2025. [38] ——, “Distributeddataparallel, ” https : / / docs . pytorch . org / docs / stable / generated/ torch . nn . parallel . DistributedDataParallel. html, accessed: Au- gust 2025. [39] vLLM T eam, “vllm architecture overvie w - worker , ” https: // docs.vllm . ai/en/latest/design/arch overvie w .html#worker, accessed: August 2025. [40] D. Narayanan, M. Shoeybi, J. Casper, P . LeGresley , M. Patwary , V . K orthikanti, D. V ainbrand, P . Kashinkunti, J. Bernauer , B. Catanzaro, A. Phanishayee, and M. Zaharia, “Efficient large-scale language model training on gpu clusters using megatron-lm, ” in Pr oceedings of the International Confer ence for High P erformance Computing, Networking, Storage and Analysis , ser . SC ’21. New Y ork, NY , USA: Association for Computing Machinery , 2021. [Online]. A vailable: https://doi.org/10.1145/3458817.3476209 [41] A. Krizhevsky , I. Sutskever , and G. E. Hinton, “Imagenet classification with deep conv olutional neural networks, ” vol. 60, no. 6, p. 84–90, May 2017. [Online]. A vailable: https://doi.org/10.1145/3065386 [42] K. He, X. Zhang, S. Ren, and J. Sun, “Deep residual learning for image recognition, ” in 2016 IEEE Conference on Computer V ision and P attern Recognition (CVPR) , 2016, pp. 770–778. [43] A. Radford, J. W u, R. Child, D. Luan, D. Amodei, I. Sutskev er et al. , “Language models are unsupervised multitask learners, ” OpenAI blog , vol. 1, no. 8, p. 9, 2019. [44] J. Devlin, M.-W . Chang, K. Lee, and K. T outanova, “Bert: Pre-training of deep bidirectional transformers for language understanding, ” arXiv pr eprint arXiv:1810.04805 , 2018. [45] A. Radford, J. W . Kim, T . Xu, G. Brockman, C. McLeave y , and I. Sutskev er , “Robust speech recognition via large-scale weak supervi- sion, ” in Proceedings of the 40th International Conference on Machine Learning , ser . ICML ’23. JMLR.or g, 2023. [46] D. Ganguly , Z. Zhang, J. Y ang, and R. Melhem, “ Adaptive page migration for irregular data-intensive applications under gpu memory oversubscription, ” in 2020 IEEE International P arallel and Distributed Pr ocessing Symposium (IPDPS) , 2020, pp. 451–461. [47] ——, “Interplay between hardware prefetcher and page eviction policy in cpu-gpu unified virtual memory , ” in Pr oceedings of the 46th International Symposium on Computer Arc hitectur e , ser . ISCA ’19. New Y ork, NY , USA: Association for Computing Machinery , 2019, p. 224–235. [Online]. A vailable: https://doi.org/10.1145/3307650.3322224 [48] W ikipedia, “W orking set size, ” https : // en. wikipedia .org/ wiki /W orking set size, accessed: May 2025. [49] C.-C. Huang, G. Jin, and J. Li, “Swapadvisor: Pushing deep learning beyond the gpu memory limit via smart swapping, ” in Proceedings of the T wenty-Fift h International Confer ence on Ar chitectur al Support for Pr ogramming Languag es and Operating Systems , ser . ASPLOS ’20. New Y ork, NY , USA: Association for Computing Machinery , 2020, p. 1341–1355. [Online]. A vailable: https://doi.org/10.1145/3373376.3378530 [50] J. Ren, S. Rajbhandari, R. Y . Aminabadi, O. Ruw ase, S. Y ang, M. Zhang, D. Li, and Y . He, “ZeRO-Of fload: Democratizing Billion-Scale model training, ” in 2021 USENIX Annual T echnical Confer ence (USENIX A TC 21) . USENIX Association, Jul. 2021, pp. 551–564. [Online]. A vailable: https://www .usenix.org/conference/atc21/presentation/ren- jie [51] S. G. P atil, P . Jain, P . Dutta, I. Stoica, and J. Gonzalez, “POET: Training neural networks on tiny devices with integrated rematerialization and paging, ” in Pr oceedings of the 39th International Conference on Machine Learning , ser . Proceedings of Machine Learning Research, K. Chaudhuri, S. Jegelka, L. Song, C. Szepesvari, G. Niu, and S. Sabato, Eds., vol. 162. PMLR, 17–23 Jul 2022, pp. 17 573–17 583. [Online]. A vailable: https://proceedings.mlr .press/v162/patil22b .html [52] R. Prabhu, A. Nayak, J. Mohan, R. Ramjee, and A. Panw ar , “vattention: Dynamic memory management for serving llms without pagedattention, ” in Pr oceedings of the 30th ACM International Confer ence on Arc hitectural Support for Pro gramming Languages and Operating Systems, V olume 1 , ser . ASPLOS ’25. New Y ork, NY , USA: Association for Computing Machinery , 2025, p. 1133–1150. [Online]. A vailable: https://doi.org/10.1145/3669940.3707256 [53] M. Lin and H. Jeon, “Understanding oversubscribed memory management for deep learning training, ” in Pr oceedings of the 5th W orkshop on Machine Learning and Systems , ser . EuroMLSys ’25. New Y ork, NY , USA: Association for Computing Machinery , 2025, p. 46–55. [Online]. A vailable: https://doi.org/10.1145/3721146.3721955 [54] X. W ang, B. Ma, J. Kim, B. K oh, H. Kim, and D. Li, “cmpi: Using cxl memory sharing for mpi one-sided and two-sided inter-node communications, ” in Pr oceedings of the International Confer ence for High P erformance Computing, Networking, Storage and Analysis , ser . SC ’25. Ne w Y ork, NY , USA: Association for Computing Machinery , 2025, p. 2216–2232. [Online]. A vailable: https://doi.org/10.1145/3712285.3759816 [55] X. W ang, J. Liu, J. W u, S. Y ang, J. Ren, B. Shankar, and D. Li, “Performance characterization of cxl memory and its use cases, ” in 2025 IEEE International P arallel and Distributed Pr ocessing Symposium (IPDPS) , 2025, pp. 1048–1061. [56] B. Ma, V . Nikitin, X. W ang, T . Bicer , and D. Li, “mlr: Scalable laminography reconstruction based on memoization, ” in Proceedings of the International Confer ence for High P erformance Computing, Networking, Storage and Analysis , ser . SC ’25. New Y ork, NY , USA: Association for Computing Machinery , 2025, p. 265–280. [Online]. A vailable: https://doi.org/10.1145/3712285.3759805 [57] Z. Du, Q. Zhang, M. Lin, S. Li, X. Li, and L. Ju, “ A comprehensi ve memory management framework for cpu-fpga heterogenous socs, ” IEEE T ransactions on Computer-Aided Design of Integrated Circuits and Systems , vol. 42, no. 4, pp. 1058–1071, 2023. [58] X. Ding, Y . Zhang, B. Chen, D. Y ing, T . Zhang, J. Chen, L. Zhang, A. Cerpa, and W . Du, “T owards vm rescheduling optimization through deep reinforcement learning, ” in Proceedings of the T wentieth European Confer ence on Computer Systems , ser . EuroSys ’25. Ne w Y ork, NY , USA: Association for Computing Machinery , 2025, p. 686–701. [Online]. A vailable: https://doi.org/10.1145/3689031.3717476 [59] T . Allen and R. Ge, “In-depth analyses of unified virtual memory system for gpu accelerated computing, ” in Pr oceedings of the International Confer ence for High P erformance Computing, Networking, Storag e and Analysis , ser . SC ’21. Ne w Y ork, NY , USA: Association for Computing Machinery , 2021. [Online]. A vailable: https://doi.org/10.1145/3458817.3480855 [60] S. Go, H. Lee, J. Kim, J. Lee, M. K. Y oon, and W . W . Ro, “Early- adaptor: An adaptiv e framew ork forproactiv e uvm memory manage- ment, ” in 2023 IEEE International Symposium on P erformance Analysis of Systems and Software (ISP ASS) , 2023, pp. 248–258. [61] P . B, G. Cox, J. V esely , and A. Basu, “Suv: Static analysis guided unified virtual memory , ” in 2024 57th IEEE/ACM International Symposium on Micr oarchitectur e (MICR O) , 2024, pp. 293–308. [62] M. Lin, Y . Feng, G. Cox, and H. Jeon, “Forest: Access-aware gpu uvm management, ” in Proceedings of the 52nd Annual International Symposium on Computer Arc hitectur e , ser . ISCA ’25. New Y ork, NY , USA: Association for Computing Machinery , 2025. [Online]. A vailable: https://doi.org/10.1145/3695053.3731047 [63] Z. DeV ito, “ A guide to pytorch’ s cuda caching allocator, ” https://zde vito. github . io / 2022 / 08 / 04 / cuda - caching - allocator. html, accessed: August 2025. [64] P . T eam, “Pytorch hip caching allocator masquerading as cuda, ” https:// github.com/pytorch/pytorch/tree/ main/aten /src/A T en /hip/ impl, accessed: August 2025. [65] Z. Zhang, D. Y ang, X. Zhou, and D. Cheng, “Mcfuser: High- performance and rapid fusion of memory-bound compute-intensive operators, ” in Pr oceedings of the International Confer ence for High P erformance Computing, Networking, Storage , and Analysis , ser . SC ’24. IEEE Press, 2024. [Online]. A vailable: https :// doi. org/10. 1109/ SC41406.2024.00040 [66] W . Niu, J. Guan, Y . W ang, G. Agraw al, and B. Ren, “Dnnfusion: accelerating deep neural networks execution with advanced operator fusion, ” in Proceedings of the 42nd ACM SIGPLAN International Confer ence on Progr amming Language Design and Implementation , ser . PLDI 2021. Ne w Y ork, NY , USA: Association for Computing Machinery , 2021, p. 883–898. [Online]. A vailable: https :/ /doi .org/10 . 1145/3453483.3454083 [67] N. Corporation, “Megatron-lm gpt2 345m, ” https: / / catalog . ngc . nvidia. com/orgs/n vidia/models/megatron lm 345m, accessed: August 2025. [68] M. Shoeybi, M. Patw ary , R. Puri, P . LeGresley , J. Casper , and B. Catan- zaro, “Megatron-lm: Training multi-billion parameter language models using model parallelism, ” arXiv preprint , 2019. [69] C. S ´ anchez, “Synchronous and asynchronous stream runtime verification, ” in Proceedings of the 5th A CM International W orkshop on V erification and MOnitoring at Runtime EXecution , ser . V OR TEX 2021. New Y ork, NY , USA: Association for Computing Machinery , 2021, p. 5–7. [Online]. A vailable: https://doi.org/10.1145/3464974.3468453 [70] L. Bozzelli and C. S ´ anchez, “Foundations of boolean stream run- time verification, ” in International Conference on Runtime V erification . Springer , 2014, pp. 64–79. [71] B. Gbadamosi, L. Leonardi, T . Pulls, T . Høiland-Jør gensen, S. Ferlin- Reiter , S. Sorce, and A. Brunstr ¨ om, “The ebpf runtime in the linux kernel, ” arXiv preprint , 2024. [72] M. Lin, H. Jeon, and K. Zhou, “P asta: A modular program analysis tool framework for accelerators, ” 2025. [Online]. A vailable: https://doi.org/10.5281/zenodo.17547322
Original Paper
Loading high-quality paper...
Comments & Academic Discussion
Loading comments...
Leave a Comment