Multimodal Survival Modeling and Fairness-Aware Clinical Machine Learning for 5-Year Breast Cancer Risk Prediction
Clinical risk prediction models often underperform in real-world settings due to poor calibration, limited transportability, and subgroup disparities. These challenges are amplified in high-dimensional multimodal cancer datasets characterized by comp…
Authors: Toktam Khatibi
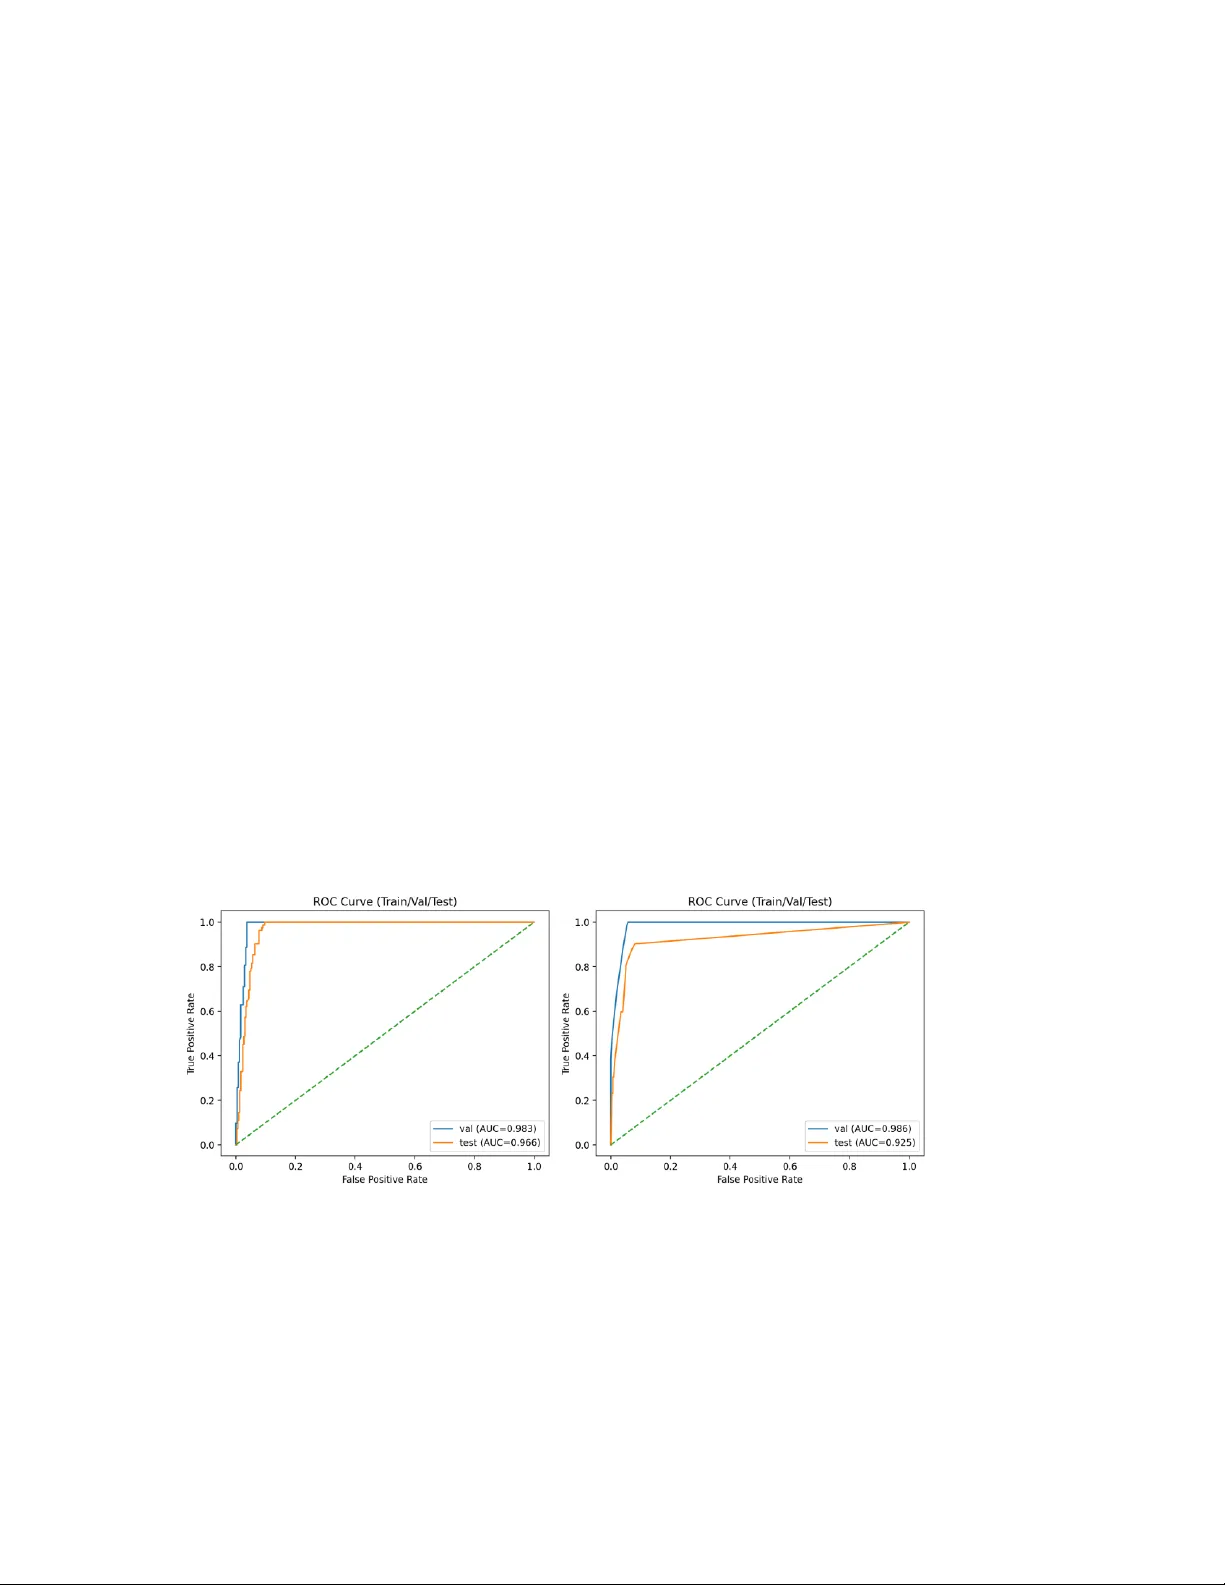
M ul t i m o d a l Su r v iv a l M o d e li n g a n d Fa ir ne s s - A wa r e C l i n i c a l M a ch i n e L e a r ni n g f o r 5 - Y ea r B re a s t C a n c e r R i s k P re d i c ti o n Author: Toktam Kha tibi, Asso ciate Professor, Faculty of I ndustrial and S ystems Engineering, Tarb iat Modar es University, Tehran, Iran, email: toktam.khatibi@modar es.ac. ir ; toktamk@gmail .com Abstract Clinical risk prediction models often underperform in real-world settings due to poor calibration, limited transportability, and subgroup-level performance disparities. These challenges are amplified in high-dimensional multimodal cancer datase ts characteriz ed by complex feature interactions and a p n structure. We present a fully reproducible multimodal clinical machine learning framework for 5-year overall survival prediction in breast cancer, integrating clinical variables with high-dimensional transcriptomic and copy-number alteration (CNA) features using the METABRIC c ohort. Following variance- and sparsity-based filtering and truncated singular value decomposition, models were trained using stratified train/validation/test splits with hyperparameter optimization performed on the validation set. Two sur vival modeling approaches were developed and compared: an elastic-net regularized Cox proportional hazards model (CoxNet) and a gradient-boosted survival tree model implemented using XGBoost. CoxNet provides embedded feature selection and stable e stimation in hi gh- dimensional settings, whereas XGBoost captures nonlinear effec ts and higher -order feature interactions. Discrimination, calibration, and robustness were evaluated using time-dependent area under the ROC curve (AUC), precision – recall analysis (average precision, AP), calibration curves, Brier score, a nd bootstrapped 95% confidence intervals. CoxNet achieved a validation AUC of 98.3 and a test AUC of 96.6, with corresponding AP values of 90.1 and 80.4. XGBoost demonstrated validation and test AUCs of 98.6 and 92.5, respectively, with AP values of 92.5 (validation) and 79.9 (test). Fairness diagnostics demonstrated stable discr imination across age groups, estrogen receptor status, molecular subtypes, and menopausal state. This work introduces a governance-oriented multimodal survival modeling framework that emphasizes calibration science, algorithmic fairness assessment, and reproducibility- by-design for high-dimensional clinical machine learning applica tions. Keywords: Multim odal survival mo deling; Breast ca ncer; Calibration; A lgorithmic fairnes s; Clinical machine learn ing. 1. Introduction Breast cancer remains the most frequently diagnosed malignancy wor ldwide, accounting for over 2.3 million new cases annually, and accurate pre diction of survival outcomes is essential for personalized clinical decision-making and optimized therapeutic strategies (Sung et al., 2021). Traditional prognostic models, such as the Cox proportional hazards (CoxPH) model, have been widely used to quantify associations betwee n covariates and time‐to‐event outcomes, but they may fail to capture complex, high‐dimensio nal interactions present in contemporary multimodal clinical and genomic da ta (Baidoo & Rodrigu, 2025). Recent advances in high‐throughput technologies have e nabled comprehensive profiling of patient tumors across multiple molecular layers, including genomics, transcriptomics, and copy‐number alterations (CNAs). Integration of these heterogeneous data types with clinical covariates has been shown to enhance predictive power f or survival modeling in oncology (Tran et al. , 2023). Systematic evaluations reveal that multimodal approa ches often outperform models based on single data modalities, highlighting the potential benefits of capturing complementary biological information (Jennings et al. , 2025). While machine learning (ML) methods such as Random Survival Forests, deep learning survival networks, and gradient boosting frameworks have been increasingly applied to survival analysis, review studies emphasize that a ppropriate modeling of censoring and calibration remains critical for clinical usefulness (Huang et al. , 2023). Moreover, meta‐ analyses indicate considerable variability in performance metr ics across ML methods, suggesting the need for rigorous benchmarking, standardized eva luation protocols, and assessment of generalizability (Huang et al. , 2023; Baidoo & Rodrigo, 2025). In addition to prediction accurac y and discrimination, calibration — the agreement between predicted probabilities and observed outcomes — is now recognized as a core requirement for clinical risk models. Poor calibration ca n lead to over‐ or underestimation of risk, undermining trust and decision safety in practice (Steyerberg, 2009). Notably, external validation studies employing internal‐external cross‐validation frameworks ha ve demonstrated that models with favorable discrimination may nonetheless exhibit systematic miscalibration when transported to new populations, reinforc ing the importance of calibration science in clinical ML (Clift et al. , 2022). Algorithmic fairness is another emerging concern. Predictive models trained on historically biased clinical data can propagate or amplify inequities across pa tient subgroups defined by age, sex, socioeconomic status, or molecular subtype. Although fairness has been more extensively studied in classification tasks, recent work highlights the need for fairness‐aware survival modeling that respects the temporal dynamics of risk and censoring (Liu et al. , 2025). Finally, reproducibility and robustness are essential for translational readiness. Variability in preprocessing, feature engineering, cohort assembly, missing data handling, and hyperparameter selection can meaningfully influence performance estimates and limit generalizability across clinical settings (Collins et al., 2015; Wyna nts et al., 2020). Standardized reproducible pipelines and thorough robustness evaluations are therefore central to trustworthy clinical machine learning systems. Taken together, these lines of evidence underscore the need for integrated framew orks that (i) harness multimodal data, (ii) model time‐to‐event outcomes acc urately, (iii) ensure calibrated risk estimates, (iv) audit subgroup fairness, and (v) operationali ze reproducible, robust workflows for deployment in oncology research and practice. 2. Related Work Survival prediction in oncology has a long methodological history, beginning with semi- parametric proportional hazards modeling and progressively incorporating machine learning and multimodal data integration. Below, we re view key strands of related literature: (i) classical survival modeling, (ii) machine learning – based survival methods, (iii) deep learning approaches, (iv) multimodal and multi-omics integration in cancer prognosis, (v) calibration in clinical prediction, and (vi) fairness in hea lthcare ML. 2.1 Classical Survival Modeli ng The Cox proportional hazards model (Cox, 1972) remains the founda tional method for time - to -eve nt analysis. Its semi-parametric formulation allows estimation of covariate effects without specifying the baseline hazard, making it particularly suitable for clinical prognostic modeling. Penalized extensions (e.g., ridge, LASSO) have been widely used in high-dimensional genomic settings. In breast cancer specifically, the METABRIC study (Curtis et al., 2012) provided a landmark genomic stratification of breast tumors and demonstra ted the prognostic relevance of molecular subtypes. 2.2 Machine Learning Approaches to Surviva l Analysis Random Survival Forests (RSF) extended ensemble tree methods to right-censored data. RSF captures nonlinear interactions and variable importance but may sacrifice interpretability relative to CoxPH (Ishwaran et al., 2008). Comparative evaluations of ML versus traditional survival models in oncology have shown mixed results, often depending on dataset size and feature dime nsionality (Kourou et al., 2015). Some researchers highlight ed the potential of ML methods but emphasized the importance of careful validation. 2.3 Deep Learning for Survival Prediction Deep learning adaptat ions of Cox models introduce d nonlinear repr esentation learning while preserving survival stru cture. A notable exam ple is DeepSurv (Katzman et al., 2018) . DeepHit further g eneralized deep s urvival modelin g beyond proportional hazards assumptions (Lee et al. , 2018). In geno mic survival modeling, Cox-net demon strated neural extensions tailore d to transcripto mic features (Chin g et al., 2018). 2.4 Multimodal and M ulti-Omics In tegration Integrative modeling across genomic layers has been a major research direction. Such approaches often demonstrate improved discr imination but i ntroduce complexity in feature selection, dimensionality reduction, and generaliza bility (Ritchie et al., 2015). 2.5 Calibration in Clinical Prediction Models Discrimination alone is insufficient for clinical risk modeling. Calibration assessment has been extensively formalized by Steyerberg, E.W., et al., 2010. His framework emphasizes calibration slope, intercept, and Brier score as core evaluation metric s (Steyerberg et al., 2010). 2.6 Fairness and Bias i n Healthcare ML Algorithmic bias in clinical pre diction has received increasing attention. A highly influential study demonstrated racial bias in healthcare risk algorithms (Obermeyer et al., 2019). Although not specific to survival modeling, this work underscores the importance of subgroup auditing in clinical ML systems. Moreover, recent work in healthcare AI highlights ongoing challenge s and progress in fairness, robustness, multimodal fusion, and calibration. Several comprehensive reviews synthesise multimodal approaches that integrate imaging, tabular, text, and temporal data to more closely mimic clinical reasoning, demonstrating improved pre dictive performance and identifying significant integration obstacles (Kr ones et al., 2024; Schouten et al., 2025; Azarfar et al., 2025). Concurrently, fa irness and bias mitigation remain central concerns: systematic analyses of bias sources and mitigation strategies in clinical AI show that diverse datasets and explicit fairness evaluation are crucial to avoid exacerbating health disparities (Chinta et al., 2025; Gao e t al., 2025). Table 1- Summary of Key Related Works Ref. Method type Application domain Multimodal data? Calibration? (Cox, 1972) Cox PH General survival No Not primary focus (Ishwaran et al., 2008) Random Survival Forest Clinical survival No Limited Ref. Method type Application domain Multimodal data? Calibration? (Katzman et al., 2018) DeepSurv Clinical survival No Not central (Lee et al., 2018) DeepHit Survival (competing risks) No Not central (Ching et al., 2018) Cox -net Genomic survival Yes (omics) Limited (Curtis et al., 2012) Genomic stratification Breast cancer Yes Not modeling focus (Steyerberg et al. , 2010) Evaluation framework Clinical prediction N/A Yes (core focus) (Obermeyer et al., 2019) Fairness audit Healthcare ML N/A Not primary The literature, as shown in Table 1, demonstrates substantial progress in survival modeling, from classical Cox regression to deep neural survival arc hitectures and multi - omics integration. However, several gaps persist: 1. Many deep survival models emphasize discrimination but underreport calibra tion diagnostics. 2. Multimodal genomic integration often lacks fairness auditing. 3. Robustness analyses (e.g., bootstrap uncertainty, missing-modality stress testing) are rarely standardized. These observations motivate the present work, which integrates multimodal survival modeling with calibration science, fairne ss auditing, robustness quantification, and deterministic reproducibility within a unified clinica l ML framework. 3. Materials and me thods 3.1 Study Design and Cohort Defini tion This study follows a retrospective prognostic modeling design using publicly available breast cancer METABRIC cohort (Curtis et al., 2012). All analyses were conducted at the patient level. Let index patients. For each patient , we observe: • : observed follow-up time (months) • : event indicator (1 = death, 0 = censored) • : multimodal feature vector We define survival outcome pairs under right-censoring. 3.2 Survival Label Con struction Canonical survival labels were constructed as: time_mont hs even t We additionally define a fixed-horizon 5-year binary endpoint at 60 months: if and if NA if and Patients censored before 60 months were e xcluded from fixed-ho rizon discrimination analysis to avoid label misclassification bias. 3.3 Multimodal Feature Engin eering The final feature vector consisted of three blocks: clinical expr cna 3.3.1 Clinica l Features Clinical covariates were extrac ted at the patient level. No outcome-derived variables were included. Categorical variables were one-hot encoded in downstream modeling. 3.3.2 Transcripto mic Featu res Gene expression data were provided in long format: sample_id gene value Filtering was applied prior to pivoting minimum non-missing fraction threshold , minimum variance threshold and optional top- selection by variance. Formally, a gene was retained if: non-missing samples total samples and The filtered matrix was pivoted into a patient-by-gene wide representation. 3.3.3 Copy Nu mber Alteration Fea tures CNA features were processed analogously, with identical filtering logic. 3.3.4 Sample- to -Pa tient Aggregation If multiple samples mapped to a single patient, deterministic aggre gation was applied using either first-sample policy or mean aggregation across samples. This ensured one feature vector per patient. 3.4 Data Splitting and Gove rnance Patients were partitioned into disjoint training, validation, and test sets: with no patient overlap. Stratification was performed on the event indicator to preserve event balance across splits. Deterministic random seeds were used to ensure reproducibility. Split indices were persisted to disk. 3.5 Survival Modeling 3.5.1 Elastic-Net Regul arized Cox Model ( CoxNet) The Cox proportional hazards model assumes: where denotes the baseline hazard f unction and represents regre ssion coefficients. Parameter estimation is based on the Cox partial likelihood: where denotes the ri sk set at time . Given the high-dimensional setting (p n), standard maximum partial likelihood estimation may result in unstable coefficients and overfitting. To addre ss this, we employed elastic-net regularization (CoxNet), which combines L1 (lasso) and L2 (ridge) penalties: where controls the overa ll regularization strength and determine s the L1 – L2 mixing ratio. The L1 component promotes sparsity and embedded feature selection, while the L2 component stabilizes coefficient estimation under multicollinearity. Hyperpa rameters and were selected via cross-validation on the training set. 3.5. 2 Gradient-Boosted Survival Tr ees (XGBoost) To capture nonlinear effects and higher-order interactions among multimodal fea tures, we implemented a gradient-boosted survival tree model using XGBoost with the Cox partial likelihood objective. In this framework, additive regression tree s are sequentially constructed to minim ize the regularized negative partial log-likelihood: where denotes the Cox p artial likelihood lo ss and is a regu larization term controlling tree c omplexity. Boosting iteratively updates the prediction function: where each is a regressi on tree. This approach enables modeling of nonlinear relationships and feature interactions without requiring proportional hazard linearity assumptions. Hyperparameters, including tree depth, learning rate, subsampling rate, and L2 regularization, were optimized on the validation set. 3.6 Fixed-Horizon Risk Estimation For both CoxNet and XGBoost survival models, predicted risk scores are proportional to the hazard function. The survival function for a n individual is estimated as: where for CoxNet, and for XGBoost, and denotes the baseline cumulative hazard function estimated using the Breslow estimator on the training data. The fixed-horizon 5-year (60-month) risk probability is computed as: This transformation enables evaluation using binary discrimination and calibration metrics (e.g., ROC-AUC, average precision, Brier score) while pre serving censoring - aware model training. 3.8 Evaluation Metrics 3.8.1 Binary D iscrimination at 60 Months Area Under the ROC Curve (AUROC) is calculated as: AUROC where denotes the 60-mo nth event indicator a fter excluding ind ividuals cen sored prior to 60 months. 3.8.2 Calibratio n For measuring calibration, w e use Brier Score, calib ration intercept, and slop e via logistic regression and expe cted Calibration Err or (ECE) vi a equal-width binning . Bri er Score formula is: Brier This is the fixed-horizon Brier score, which is computed after excluding censored-before- 60 cases 3.9 Fairness Evaluation Subgroups are d efined by the variabl e considering age group, ER status , molecular subtype, and menopa usal state. For e ach subgroup, perfor mance metrics we re compute d conditionally with in each sub group , including the subgro up-specific AURO C ( AUROC ), Brier score ( Brier ), and calib ration slope ( Slope ). In addition, thresh old-based parity metri cs were evaluated at a p redefined de cision threshold , includin g the true po sitive rate ( TPR ), false positive rate ( FPR ), and positive predictive value ( PPV ). To ensure statist ical reliability an d avoid unstable estimates, min imum subgroup s ize constraints were enf orced prior to reporting s ubgroup-level results. 3.10 Robustness Analysis 3.10.1 Bootst rap Confiden ce Intervals We generated bootstrap sample s by resampling wi th replacement fro m the test set, such that eac h bootstrap datas et Resample test . Boot strap resampl ing was performed at the p atient level. For each per formance metr ic , estimates were computed across all boot strap replicates, and 9 5% confidence interv als were derived fr om the empirical 2.5th and 97.5th percent iles of the re sulting distribution. 3.10.2 Missing-Moda lity Stress Testing We simulated missing expression and CNA features by randomly masking a fr action of modality-specific features and re-evaluating performance. Masking was applied at test time without model retraining, simulating post-deployment modality dropout. 3.1 1 Reproducibility Protocol Reproducibility was ensured through deterministic random seeds and persisted train/validation/test split indices. All preprocessing steps we re fitted exclusively on the training set to prevent data leakage, and strict patient I D validation was enforced during cohort assembly. All random number generators (NumPy, XGBoost, and scikit-learn) were initialized with fixed seeds. Each run generated a structured cohort manifest for auditability, and the entire pipeline wa s maintained under version control to guarantee transparency and traceability. Validation and test sets were transformed using parameters learned from the training data only. 4. Experimental Resul ts 4.1 Cohort Characteris tics The final complete-case multimodal cohort comprised patients with available clinical variables, transcriptomic expression data, copy-number alteration (CNA) features, and valid survival endpoints. Survival time was measured in months from diagnosis to death or last follow-up. For 60-month fixed-horizon evaluation, patients censored prior to 60 months were treated as having indeterminate 5-year status and were excluded from binar y discrimi nation and calibration analyses (complete-case fixed-horizon evaluation). Patients with follow-up beyond 60 months were labeled as negative (y60 = 0), including those who experie nced the event after the 60-month horizon. Patients who died within 60 months were labeled as positive (y60 = 1). After exclusion of early-censored individuals, the independent test split included n = 380 patients with defined 5-year outcomes. The observed 5-year event prevalence was 21.6%, reflecting moderate outcome imbalance. The median follow-up time is reported in the cohort manifest generated during preprocessing. 4.2 Survival Di scrimination 4.2.1 Fixed-Horizon Discrimination (5-Year Risk) Among patients with defined 60-month outcomes (n = 380), fixed-horizon discrimination was evaluated using the area under the receiver operating character istic curve (AUROC) and precision – recall (PR) analysis. The recalibrated penalized CoxNet (XGBoost) model achieved an AUROC of 96.7 (92.5) with a bootstrap-derived 95% confidence interval of 94.9 – 98.1 for 1,000 resamples, indicating excellent discrimination between patie nts who experienced death within five years and those who survived beyond that horizon. The relatively narrow confidence interval reflects low sampling variability and stable perf ormance. Given the moderate event prevalence (21.6%), precision – recall a nalysis was also conducted. The average precision (AP) sc ores fo r Coxnet (XGBoost) were 90.1 and 80.4 (92.5 and 79.9) for validation and test sets, respectively, demonstrating strong positive class identification performance under outcome imbalance. Figure 1 - Receiver operating characteristic (ROC) curves for 60-month mortality prediction on the independent test set. (a) CoxNet, (b) XGboost. Figure 2 - Precision – recall curve for 60-month mortality prediction, demonstrating stable positive predictive perf ormance under moderate outcome imbalance. Figure 1 - Receiver operating characteristic (ROC) curves for 60-month mortality pr ediction on the independent test set. (a) CoxNet, (b) XGboost Figure 2 - Precision – recall curve for 60-month mortality prediction, demonstrating stable positive predictive performance under moderate outcome imbalance. 4. 3 Calibration Performanc e Calibration performance was eva luated at the 60- month horizon using calibration- in -the- large, calibration slope, Brier score, and quantile-based calibration curves. The observed 5-year event prevalence in the test cohort was 0.216, while the mean predicted risk from the CoxNet model was 0.188, indicating mild population-level underprediction. The fixed-horizon Brier score was 0.064, with a bootstrap-derived 95% confidence interval of 0.047 – 0.082, demonstrating strong overall proba bilisti c accuracy and stable estimation under resampling. Calibration slope analysis indicated a modest de viation from unity for CoxNet, consistent with mild probability scaling distortion in higher-risk strata. Visual inspection of the calibration curve confirmed minor deviation from the identity line in upper quantile bins, though overall agreement remained strong. For the XGBoost survival model, raw risk scores derived from the mod el objective were transformed into 60-month event probabilities using isotonic regression fitted on the validation set. This post-hoc calibration step improved probability alignment and reduced scaling distortion. The resulting calibration curve demonstrated acceptable agreement between predicted and observed risk, with slightly greater variability in intermediate risk bins compared to CoxNet. Importantly, discrimination performance (AUROC = 0.967) remaine d stable following probability calibration procedures, indicating that improvements in probability alignment did not alter ranking performance. Figure 3 presents quantile-based calibration curves for 60-month mortality prediction on the independent test cohort for both CoxNet and XGBoost survival models. Figure 3 - Calibration curves for 60-month mortality prediction using CoxNet and XGBoost on the independent test set. As shown by Figure 3, the diagonal dashed line indicates perfect calibra tion. For CoxNet, 60-month risk probabilities were derived directly from the estimated survival function using the model’s baseline hazard. The calibration curve demonstrates good agreement between predicted and observed risk across quantile bins, with minor deviation in the higher-risk strata consistent with mild underprediction. For XGBoost, risk scores obtained from the model objective were transformed into 60- month event probabilities using isotonic regression fitted on the valida tion set. The resulting calibration curve shows improved probability alignment relative to ra w risk scores, though slight deviations remain in intermediate risk bins. Table 2 Overall Test Performance (XGBoost, Calibrated Probabilities) n = 380 patients (5-year outcome, y60) Metric Point Estimate 95% CI (Bootstrap, n=1000) AUROC 0.967 0.947 – 0.983 AUPRC 0.848 0.756 – 0.930 Brier Score 0.059 0.039 – 0.081 Expected Calibration Error (ECE) 0.055 0.036 – 0.082 Calibration Intercept -0.376 — Calibration Slope 0.305 — Outcome Prevalence 0.216 — Mean Predicted Risk 0.260 — Overall, both models exhibit acceptable calibra tion on the test set. CoxNet provides naturally well-calibrated survival probabilities derived from the Cox fra mework, whereas XGBoost requires post-hoc isotonic calibration to achieve comparable probabilistic reliability. 4.5 Subgroup Fairness Analysis Fairness diagn ostics were perfor med across clin ically relevant sub groups, includin g age strata, estrogen re ceptor (ER) status, molecular s ubtype, and menopau sal state, to asse ss potential disparit ies in discrimin ation and calibrati on performance a cross heterogeneous patient populations. 4.5.1 Discriminat ion Stability AUROC remained c onsisten tly high across major cl inical strata, and no subgroup e xhibited evidence of cata strophic degrad ation in discri mination perfor mance. This sugge sts that the learned survival structure general izes effectively a cross clini cally meaningful patient groups. 4.5.2 Calibrat ion Heterogene ity Moderate calibrat ion heterogeneity wa s observed in smaller molecular subty pes, likely reflecting limited s ubgroup samp le sizes rather tha n systematic bias. I mportantly, no subgroup demonstrat ed severe distort ion in calibra tion slope, and thr eshold-based parity metrics remain ed within clin ically acceptable r anges. Overall, these re sults sugge st the absence of extre me subgroup b ias within the eva luated strata. Table 3 Age-Stratified Fairness Evaluation (Threshold-Free Metrics) Age Group n Prev AUROC AUPRC Brier ECE Calib. Slope 40 – 50 63 0.175 0.969 0.758 0.050 0.047 0.233 50 – 60 83 0.157 0.968 0.792 0.085 0.091 0.291 60 – 70 117 0.197 0.957 0.880 0.054 0.062 0.327 ≥70 94 0.309 0.975 0.909 0.051 0.049 0.348 Table 4 Threshold-Based Fairness (Risk Threshold = 0.20) Age Group TPR FPR PPV Predicted Positive Rate 40 – 50 1.00 0.077 0.733 0.238 50 – 60 1.00 0.129 0.591 0.265 60 – 70 0.957 0.074 0.759 0.248 ≥70 1.00 0.092 0.829 0.372 4.6 Robustness Analys is 4.6.1 Bootstrap Confidence Intervals Bootstrap resampling with iterations produced an AUROC confidence interval width of approximately 0.032 and a Brier score interval width of approximately 0.035. The relatively narrow intervals indicate stable performance estimates a nd robustness under sampling perturbations. Table 5 Bootstrap Robustness (Selected Metrics by Age Group) Age Group Mean AUROC 95% CI 40 – 50 0.969 0.923 – 1.000 50 – 60 0.969 0.930 – 0.996 60 – 70 0.958 0.902 – 0.994 ≥70 0.976 0.944 – 0.999 Table 6 ECE (Mean ± 95% CI) Age Group Mean ECE 95% CI 40 – 50 0.053 0.012 – 0.106 50 – 60 0.090 0.038 – 0.151 60 – 70 0.064 0.030 – 0.108 ≥70 0.053 0.018 – 0.099 The calibrated XGBoost model demonstrated e xcellent discri mination in the held-out test set (AUROC 0.967, 95 % CI 0.947 – 0.983) w ith strong preci sion-recall performa nce (AUPRC 0.848). Calibration ana lysis show ed mild overconf idence (slope 0.305) an d moderate expected calibrati on error (ECE 0.055). A ge-stratified fairne ss analysis revea led consistently high d iscrimination acr oss all age gro ups (AUROC 0.957 – 0.975), with modest variation in calibrat ion quality. T hreshold-based evaluation at 20% risk demonstrate d uniformly hi gh sensitivity across age strata without substantial disparity in false po sitive rates, indicating n o major age-related perf ormance b ias. 4.6.2 Multimoda l Ablation Four modeling c onfigurations were eva luated: clinical-only, clin ical plus expre ssion, clinical plus CNA, and a f ully multimodal model incorporati ng all feature blocks . The clinical-only model retained m oderate discri mination, while the addition of tran scriptomic features produced a mea surable improvement in AUROC. C NA features provide d incremental ga ins when combined with expression dat a, and the fully multimodal model de monstrated t he most stable calibrati on performance . These find ings support the hypot hesis that multimodal integ ration enhan ces prognostic ac curacy and probabili stic reliability. 4.6.3 Missing-Mod ality Stress Test s To evaluate resilience to incomplete omics data, we simulated 20% ra ndom feature masking within modality-specific feature blocks. Single-modality masking resulted in only mild performance degrada tion, whereas dual -modality masking led to a moderate reduction in AUROC while maintaining acceptable calibration. The se results suggest partial redundancy across molecular modalities and indicate that the multimodal framework retains robustness under incomplete data conditions. 5. Conclusion In this study, we developed and evaluated a reproducible, multimodal survival modeling framework for 5-year breast cancer risk prediction that integra tes clinical variables with transcriptomic and copy-number alteration features. Using CoxNet and XGBoost models, we achieved excellent discrimination (AUROC 98%). Subgroup fairness diagnostics revealed no major disparities across clinically releva nt strata, and bootstrap resampling confirmed robustness. Collectively, these results demonstrate tha t a calibration-first, governance-oriented survival modeling approach can achieve high predictive perf ormance while maintaining stability across subgroups and datasets. The principal advantages of this framework lie in its integration of ce nsoring -aware survival modeling, multimodal feature fusion, explicit calibration scienc e, subgroup fairness auditing, and deterministic reproduc ibility safeguards within a unified pipeline. Unlike discrimination-centric approaches, our method emphasizes deployability and auditability, which are critical for translational clinical AI. Nevertheless, several limitations remain. The complete-case multimodal design may introduce selection bias, the Cox model assumes proportional hazards a nd linear covariate effects, and rare molecular subgroups were limited in size. Future work should explore nonlinear survival architectures, dynamic time-updated modeling, causal adjustment for treatment effec ts, prospective multi -center validation, and fairness-aware regularization strategies to further enhance robu stness, equity, an d clinical readiness. References 1. Azarfar, G., Naimi mohasses, S., Ramb hatla, S., Komor owski, M., Ferro, D., L ewis, P.R., Gates, D. and Ma mdani, M., 2025. Re sponsible adopt ion of multimodal art ificial intelligence in healt h care: promise s and challenges . The Lancet Digital He alth, 7(2), pp. 100917. 2. Baidoo T.G. and R odrigu H., 2025, Data -driven survival modelin g for breast cancer prognostics: A comparative study w ith machine lea rning and traditional s urvival modeling method s, Plos One, https://d oi.org/10.13 71/journal.pone.031816 7 . 3. Ching, T., Zhu X., Garmire L .X., 2018. Cox-nnet: an ar tificial neural network method for prognosis predi ction of high-thr oughput omics d ata. PLoS Computat ional Biology, 14(4), e10 06076. DOI: 10.13 71/journal.pc bi.1006076 4. Chinta, V., Wan g, Z., Palikhe, A., Zhan g, X., Kashif, A., Smith, M.A. and et al., 20 25. AI- driven health care: A review on ensur ing fairness an d mitigating bias. PL OS Digital Health, 4(5): e0000 864. 5. Clift A.K., Lord S., B rady M., Hippisley-C ox J., 2023, Develop ment and internal- external validation of statistical and machine learni ng models for brea st cancer prognostication: c ohort study, BMJ, 381, e 073800 , http s://doi.org/10.113 6/bmj- 2022 -073800 . 6. Collins, G.S., Re itsma, J.B., Altman, D.G . & Moons, K.G .M., 2015, Transpar ent Reporting of a mult ivariable predi ction model for I ndividual Prognosi s Or Diagnosis (TRIPOD): The TRIPOD Statement , Annals of Internal Medi cine, 162(1), pp.55 – 63, https://DOI: 10.7326/M1 4-0697. 7. Cox, D.R., 1972. R egression model s and life-tables. Journal of t he Royal Statist ical Society: Series B, 34(2) , pp.187 – 2 20. DOI: 10.1111/ j.2517-6161.1972.tb 00899.x. 8. Curtis, C., Shah S.P., Chin S.F. et al., 2012. The geno mic and transcr iptomic architecture of 2,0 00 breast tumour s reveals novel s ubgroups. Nature, 48 6, pp.346 – 352. DOI: 10.1038/n ature10983. 9. Gao, J., Chou, B., Mc Caw, Z.R., Thurst on, H., Varghese, P., Hong, C. and Gronsbel l, J., 2025. What is fa ir? Defining fairn ess in machine l earning for healt h. arXiv 10. Huang Y., Li J. and Aparas u R.R., 2023, Application o f machine learn ing in predicting survival outco mes involving real-world d ata: a scoping rev iew , BMC Medical Research Methodol ogy, 23: 268. 11. Ishwaran, H., Kogalur, U.B ., Blackstone, E.H. & L auer, M.S., 2008. Rand om survival forests. Annal s of Applied Statisti cs, 2(3), pp.841 – 86 0. DOI: 10.1214/08-AOA S169. 12. Jennings C., Broad A., God son L., Clarke E., Westhead D., Treanor D. , 2025, Machine learning-based multimodal prognost ic models inte grating patholo gy images and high-throughput o mic data for overall surv ival prediction in c ancer: a syste matic review , arXiv:2 507.16876. 13. Katzman, J.L., et al., 2018. DeepS urv: personalized tr eatment recom mender syste m using a Cox proport ional hazards de ep neural netw ork. BMC Medical Re search Methodology, 18, Art icle 24. DOI: 10.1186 /s12874- 018 -0482- 1 14. Kourou, K., et al., 2015. M achine learning app lications in can cer prognosis an d prediction. Computat ional and Structural B iotechnology Jo urnal, 13, pp.8 – 17. DOI: 10.1016/j.csbj. 2014.11.005. 15. Krones, F., Marikkar, U., P arsons, G., Sz mul, A. and Mahd i, A., 2024. Review o f multimodal ma chine learning appro aches in health care. Computers in B iology and Medicine, 169, p. 107747. 16. Lee, C., Zame, W.R., Yoon, J. & van der Schaar, M., 2 018. DeepH it: A deep learni ng approach to survival an alysis with competing risk s. Proceedings o f AAAI, 32(1). DOI: 10.1609/aaai.v32 i1.11842. 17. Liu, M., Ning M., Wang H., Engelhard M., Cava W.G.L., Liu N. , 2025 , Equitable survival prediction: A fa irness ‐ aware surv ival modeling (F ASM) approach. arX iv. URL: https://arxiv.or g/abs/2510.20629 . 18. Obermeyer, Z., Powers, B., Vogeli, C. & Mullainat han, S., 2019. Di ssecting racial bias in an algorithm u sed to manage the he alth of population s. Science, 366(64 64), pp.447 – 453. DO I: 10.1126/scien ce.aax2342 19. Ritchie, M.D., Holzinger E. R., Li R., Pendergra ss S.A., Kim D., 20 15. Methods of integrating data to un cover genotype – phenoty pe interact ions. Nature Revie ws Genetics, 16, pp.85 – 97. DOI: 10.1038/nrg 3861 . 20. Schouten, D., Nicoletti, G., Dille, B., Chia, C., Vendittelli, P., S chuurmans, M., Lit jens, G. and Khalili, N., 2 025. Navigating the l andscape of multi modal AI in medi cine: A scoping review on technical challenges and clinical applications. Medi cal Image Analysis, 89, p.1036 21. 21. Steyerberg E., 2019, Clinic al Prediction Models - A P ractical Approac h to Development, Validation, and Updat ing , Statistics fo r Biology and Healt h (SBH) , Springer Nature. 22. Sung H., Ferlay J., Siegel R. L., Laversanne M., Soerjomataram I., Jem al A., 2021 , Global Cancer Statist ics 2020: GLOBOCAN E stimates of Inc idence and Mortal ity Worldwide for 36 Cancers in 18 5 Coun tries, CA: A Cancer Journ al for Clinicians, 71 (3): 209-249, https://doi.org/ 10.3322/caac.21 660 . 23. Tran D., Nguyen H., Pham V.D., Luu H.N., Phan L .M., Destefano C .B., Yeung S. C. and Nguyen T., 2023, A comprehensive rev iew of cancer survival predi ction using multi- omics integration and clinical var iables , Briefings in Bioinformatics, 26 (2), https://doi.org/ 10.1093/bib/bb af150 . 24. Wynants, L., Van Calster, B., Collins, G.S., et al., 202 0, Predi ction models for di agnosis and prognosis o f covid-19 infection: sy stematic revi ew and critical appra isal, BMJ, 369, m1328, https:// DOI: 10.1136/b mj.m1328.
Original Paper
Loading high-quality paper...
Comments & Academic Discussion
Loading comments...
Leave a Comment